the independent advisor - the fiduciary group · pdf file · 2017-10-24typical real...
TRANSCRIPT

Quarterly Newsletter of The Fiduciary Group®January 2013
THE InDEPEnDEnTADVISOR
By Malcolm L. Butler, [email protected]
For the past few years, the Federal reserve has been engaged in a concerted
effort to add liquidity to the economy by purchasing US Treasury bonds and mortgage backed securities. In the course
of this unprecedented activity, which has been termed “Quantitative Easing,” the Fed has built up a balance sheet of nearly $3 trillion. In effect, this balance sheet was created by the Fed printing money in exchange for the purchase of these assets. The long-term conse-quence of this excessive money creation may very well result in diminished purchasing power of our currency.
The Fed has undertaken these actions in an effort to keep interest rates low. In a low interest rate environ-ment, the value of various assets can
increase because the debt to purchase them is less cost-ly. In effect, with the cost of money (the rate of interest) declining, the purchasing power of debt increases.
In the wake of the Fed’s activities, housing prices and stock prices have all risen. Thanks to these historically low interest rates, investors have been focused on a search for yield (through stock dividends and bond coupon payments). Since holding onto cash and other risk-free assets leaves investors with a negative real rate of return, investors have bid up stocks and bonds to near all-time highs . The Fed is essentially promoting the reflation of asset values that had suffered during the financial crisis.
As the Fed seeks to keep yields low in order to stimu-late economic activity, some observers have suggested that this “easy monetary policy” and the U.S. govern-ment’s fiscal deficit spending could ultimately combine to ignite inflation. Typically, when asset prices increase,
CONTENTSProtecting the Purchasing Powerof Investment AssetsMalcolm L. Butler, J.D.
Is a Rotation Back to Equities Beginning?Joel P. Goodman, CFA
A Balanced Approach to 2013Scott B. McGhie, CPA
A Budget That WorksAndrew Clark, MBA, CFP®
The Million Dollar LunchJulia L. Butler, J.D., MBA
conserve. plan. grow.®
Protecting the Purchasing Power of Investment Assets
U.S. TIPS and Emerging Markets Equities asset class performance was not available during the High Inflation (Rising) & High Inflation (Falling) time periods. Benign or stable inflation refers to inflation around the 2-3%.
Source: Thompson Reuters Data Stream, as reprinted in BNY Mellon asset Management report, “Positioning Portfolios to Manage Inflation Risk with Real Assets,” August 2010

prices of goods and services are also likely to increase, and this effort to reflate asset values could turn into an environment of rising inflation. Even modest inflation can significantly erode purchasing power.
Milton Friedman stated: “Inflation is just like alcoholism. In both cases when you start drinking or when you start printing too much money, the good effects come first. The bad effects only come lat-er...That’s why in both cases there is a strong temptation to overdo it. To drink too much and to print too much money. When it comes to the cure, it’s the other way around. When you stop drinking or when you stop printing money, the bad effects come first and the good effects only come later. That’s why it’s so hard to persist with the cure.”
Given the possible risk of an inflationary scenario at some point in the future, we have taken steps to reposi-tion our client portfolios, by making investments in “real assets.” This is an asset class that we distinguish from the traditional asset classes of equity, fixed income and cash.
Our definition of a real asset includes physical or tangible assets that have value due to their substance, and other assets with characteristics that offer pricing power to increase revenues in the wake of a rising price environment. Typical real assets under this definition include gold and precious metals, commodities, real es-tate, Treasury Inflation Protected Securities (TIPS), and Energy Master Limited Partnerships (MLPs).
We think these types of assets, in addition to equities, will potentially hedge portfolios from the negative impact of rising inflation. The prices of these real assets can increase, as the underlying replacement cost is ad-justed upward. These real assets can also generate in-come streams that are sensitive to inflation. Cash flows from real assets, whether in the form of rents or the sale of a commodity like oil, can be increased in response to inflation as new leases and commodity prices reflect the impact of inflation.
Real assets play a “supporting” role in a diversified portfolio rather than replacing the “core” of a portfolio. For example, in a Balanced Growth portfolio where the equity allocation might be 65-75%, we may allocate 5-10% to real assets.
There are 4 primary types of assets that we include in our real asset allocation: Commodities including Gold and Precious metals, Real Estate, TIPS and Energy MLPs.
GoldOf all the precious metals, gold is the most popular as an investment since it has a long history as a medium of exchange. Gold is generally perceived as a hedge
against economic, political, and social crises. It is par-ticularly important as a protection against currency de-valuation. Rather than buying physical gold, we invest in exchange traded funds (ETFs) that actually hold gold bullion and trade daily on an exchange.
real EstateCommercial real estate is traditionally perceived as an inflation hedge. Commercial real estate investments have specific characteristics that can help them keep pace with inflation. Most important is the structure of leases which allows for step-ups in rent, usually tied to an official inflation rate. Many leases also allow prop-erty owners to pass through expenses to their tenants. We typically utilize real estate investment trusts and mutual funds that specialize in investment real estate to gain representation in this asset class.
TIPSTIPS are US treasury securities that are indexed to inflation in order to protect investors from the nega-tive effects of inflation. TIPS pay interest on a principal amount that rises with inflation, as measured by the Consumer Price Index. Thus, investors are compensated as consumer prices rise. When the securities mature, the investor is paid the adjusted principal amount or the original principal, whichever is greater. We have found that the best way to invest in this asset class is through mutual funds that hold a wide variety of maturities.
Energy MLPsMLPs are limited partnerships that are publicly traded on a securities exchange. Because MLPs are classified as partnerships, they avoid corporate income tax at both a state and federal levels. The vast majority of MLPs are pipeline businesses, which earn stable income from the transport of oil, gasoline or natural gas. Advantages of investing in energy infrastructure MLPs include not only providing attractive current income, but many of the interstate petroleum pipelines also have annual rate ad-justments that are equal to or above the PPI for finished goods. We invest directly in a few companies and also through mutual funds and exchange traded notes which own a cross section of Energy MLPs.
The Federal reserve has a mission to improve economic growth by intervening in fixed income markets to keep interest rates below normal. This policy distorts valuations and at some point, valuations will again be dictated by market forces without interference from governmental agencies. We believe that adding real assets to investment portfolios is a sound strategy to protect purchasing power from the “invisible enemy” of inflation.

Joel P. Goodman, CFAChief Investment [email protected]
If we rewind the clock by two years to the end of 2010, the story was much different. Trailing ten-year returns (simple price appreciation) on stocks were close to nil, averaging negative 0.5% per year. The ’00 decade be-came known as “the lost decade,” as equity portfolios stood still. For retail investors, bonds have offered an attractive total return alternative: reasonable income from the bond’s coupon plus capital appreciation from declining interest rates. As the below chart shows, fund flows followed this strategy as cumulative bond fund contributions have significantly outpaced equity fund flows over the last several years. In fact, equity funds have had cumulative withdrawals since January, 2008.
Equity vs. Bond Fund Flows (MM)
Source: Investment Company Institute
Similarly, institutional investors have systematically reduced exposure to equities. Of note, the chart on the following page from Milliman’s 2012 Pension Funding Study shows that equity allocations for pension plan assets have been declining while fixed income alloca-tions have been increasing. Citing the need to “de-risk” portfolios, pension plan asset managers have migrated
Global equity markets during 2012 waded through a tepid U.S. recovery, the European sovereign debt crisis, a slowdown in China, the U.S. presi-
dential election, and political dysfunction in Washing-ton, and still managed to post high-single to double-dig-it returns. These macro and political uncertainties have kept many investors away from equities, who continue to bear scars from the 2008 financial crisis. Yet, as we review results for the trailing one, three, and ten-year periods, we see that equity returns (as represented by the S&P 500 Index) have bested fixed income returns. In fact, average annual returns on equities have once again resembled their long-term historical returns.
Trailing Returns for S&P 500 and BarCap Aggregate Index
Source: Bloomberg
While not a market timing call, there are several factors, in our view, that could support a multi-year rotation back into equities. These include an under-allocation to equities by retail and institutional investors, improving consumer and business confidence, and attractive rela-tive valuations.
3
Is a Rotation Back to Equities Beginning?
16.0%
10.9%
4.2%
6.2%
0.0%
2.0%
4.0%
6.0%
8.0%
10.0%
12.0%
14.0%
16.0%
18.0%
1 Year 3 Year 10 YearS&P 500 Index BarCap Aggregate Index
7.1%
5.2% -600,000
-400,000
-200,000
0
200,000
400,000
600,000
800,000
1,000,000
1,200,000
Jan-
08A
pr-0
8Ju
l-0
8O
ct-0
8Ja
n-09
Apr
-09
Jul-
09
Oct
-09
Jan-
10A
pr-1
0Ju
l-1
0O
ct-1
0Ja
n-11
Apr
-11
Jul-
11
Oct
-11
Jan-
12A
pr-1
2
Cumulative Equity Fund Flows Cumulative Bond Fund Flows

As businesses gain more clarity on tax policy, spending cuts, and deficit reduction, they may be more inclined to invest this capital. According to data compiled by Bloomberg, global mergers and acquisitions rose to the highest level in four years during the fourth quarter, the most since the third quarter of 2008, an indication that companies may be starting to take risk.
If we take a longer view of equities relative to fixed income, the valuation discrepancy on a “P/E” basis has become pronounced. We use a trailing price to earnings ratio for the S&P 500 and divide the 10-year Treasury yield into 100 to determine the “bond P/E.” The below chart shows how dramatic the differential has become as compared with the prior five decades. There is no question that liquidity provided by global central bankers has distorted asset prices and exagger-ated this valuation discrepancy. However, it is bonds, not equities that may likely experience a greater valu-ation adjustment as rates rise. When this occurs, we believe fixed income investor patience will deplete quickly and manifest in a rotation into other return vehicles such as equities.
Average Equity and Bond “Price/Earnings” Ratio by Decade
Source: Strategas Research Partners
While we may be on the leading edge of a re-allocation to equities, we are not advocating an abandonment of a well thought out asset allocation strategy. Nor would we endorse a return seeking strategy that does not consider downside risk. We think investors will be best served by staying focused on their medium and long-term goals, understanding their emotional biases, and remembering that while stock prices may be volatile, the value of the underlying business is not. And finally, portfolio construction should align with the investment objectives, needs and risk tolerance of each investor.
away from equities to alternative assets such as private equity, real estate, commodities, and long-duration fixed income securities.
Pension Fund Asset Allocation (Equity vs. Fixed Income)
Source: Milliman 2012 Pension Funding Study
“The way I see it, investors face two main risks: the risk of losing money and the risk of missing out.” - Howard Marks
On the investment pendulum continuum, investors have been more concerned about the risk of losing money than the risk of missing out. This mindset has produced good risk-adjusted results. However, we believe this ap-proach may be less rewarding over the next few years as portfolios will need to overcome negative real interest rates and the reemergence of inflation. Fixed income will provide some necessary cash flow to portfolios, but low absolute nominal yields will be a poor hedge against inflation. At the margin, we believe the combination of a renewed appetite for return and dissatisfaction with low yields may drive a re-allocation to equities.
In addition to a shift in investor sentiment, improving consumer and business confidence should support a stronger economic recovery which would be construc-tive for equities. We have seen a divergence between consumer and business confidence over the last year. Consumer confidence has been trending higher, as better unemployment and housing market statistics have buoyed consumer optimism. However, busi-nesses have been more tentative, hoarding cash and restraining capital spending in response to the Fiscal Cliff uncertainty and a stricter regulatory environment. Companies which comprise the S&P 500 now hold close to $1.5 trillion in cash on their balance sheets.
0%
10%
20%
30%
40%
50%
60%
70%
2005 2006 2007 2008 2009 2010 2011Equity % Fixed Income %
12.5 11.7
19.5 20.1
14.5
21.1
13.69.9
15.5
23.8
0
10
20
30
40
50
60
1960's 1970's 1980's 1990's 2000's CurrentEquity P/E (S&P 500 TTM EPS)Bond "P/E" (100/10-Year Treasury Yield)
Bond investors are paying the equivalent of $56 for $1 of income, while equity investors are only paying $14.50 for $1 of earnings.
18.1
56.8
A Balanced Approach to 2013Scott B. McGhie, CPASenior Investment [email protected]
Striking the right portfolio balance for investors is our mission for each and every client. At a basic level, a balanced approach means a portion of
one’s portfolio is invested in equity and a portion in fixed income. Even for our most aggressive and most conservative investors, we believe in a bal-anced, diversified approach. History has taught us that a balanced asset allocation approach produces sufficient investment returns and buffers volatility and short-term losses to a degree that makes it possible for the average investor to sustain a long-term investing mindset. We attempt to construct portfolios that allow for our human frailties.
The asset allocation does move around based on market movements and our view of valuations and prospective market returns relative to their risk. Historically, even the safest certificates of deposit, U.S. Treasury, and agency securities produced a sufficient return rela-tive to inflation and risk, but this is simply not the case today. With the Federal Reserve suppressing interest rates, about the only advantage to holding these “safe” securities is to buffer the volatility of the stock market. This advantage is trumped, however, by the near cer-tainty that investors will erode their purchasing power by owning these securities, and even worse, experi-ence losses when interest rates finally reach an inflec-tion point and begin reverting to normalized rates. This appropriately earns these safe securities the modicum “returnless risk,” which is the notion that in exchange for the safety of low volatility and negligible default risk, an investor earns negative real return and poten-tially absorbs a hazardous amount of interest-rate risk.
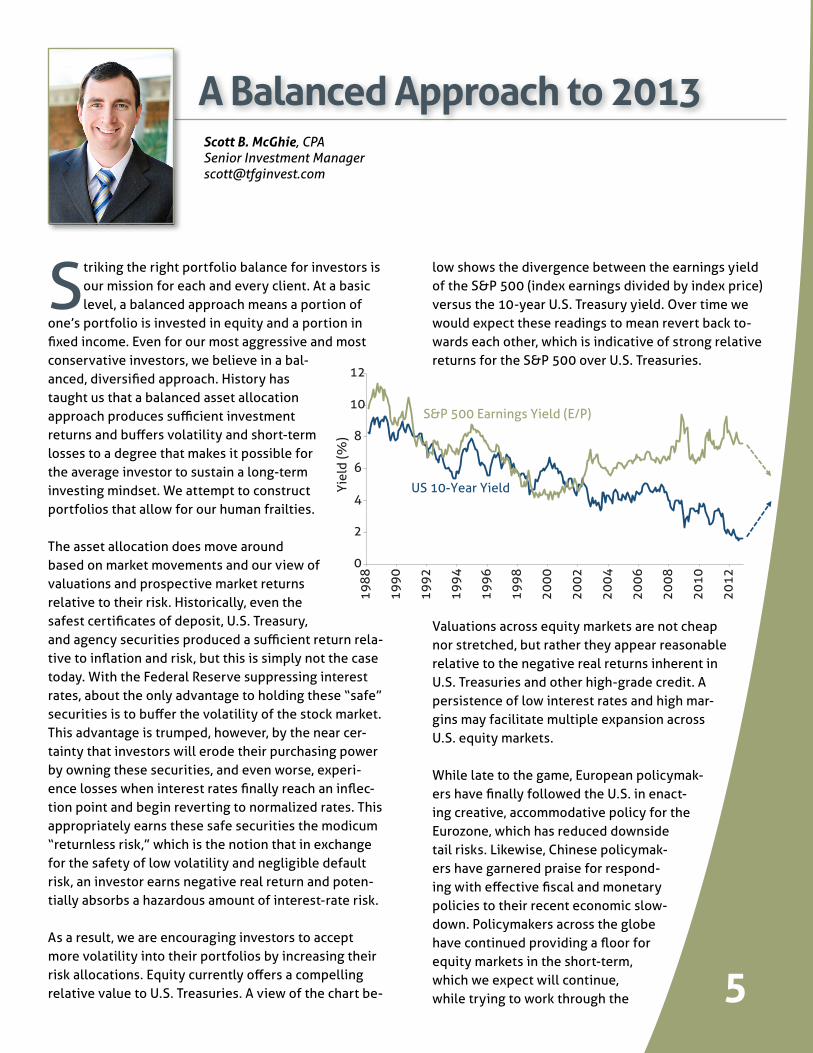
As a result, we are encouraging investors to accept more volatility into their portfolios by increasing their risk allocations. Equity currently offers a compelling relative value to U.S. Treasuries. A view of the chart be-
low shows the divergence between the earnings yield of the S&P 500 (index earnings divided by index price) versus the 10-year U.S. Treasury yield. Over time we would expect these readings to mean revert back to-wards each other, which is indicative of strong relative returns for the S&P 500 over U.S. Treasuries.
Valuations across equity markets are not cheap nor stretched, but rather they appear reasonable relative to the negative real returns inherent in U.S. Treasuries and other high-grade credit. A persistence of low interest rates and high mar-gins may facilitate multiple expansion across U.S. equity markets.
While late to the game, European policymak-ers have finally followed the U.S. in enact-ing creative, accommodative policy for the Eurozone, which has reduced downside tail risks. Likewise, Chinese policymak-ers have garnered praise for respond-ing with effective fiscal and monetary policies to their recent economic slow-down. Policymakers across the globe have continued providing a floor for equity markets in the short-term, which we expect will continue, while trying to work through the 5
0
2
4
6
8
10
12 19
88
1990
1992
1994
1996
1998
2000
2002
2004
2006
2008
2010
2012
Yiel
d (%
)
S&P 500 Earnings Yield (E/P)
US 10-Year Yield

complex web of longer-term issues facing developed economies.
These accommodating policies will potentially lead to significant unin-
tended consequences in future years, whether it creates a new equity market
bubble from forcing investors to take risk or perilous increases in global inflation
and interest rates. Only time will tell, but for 2013, we do not foresee these conse-
quences taking hold.We have positioned portfolios to guard against rising interest
rates, and we have begun positioning them to help mitigate inflation risks. As always,
diversification is the key, because nobody can consistently predict future outcomes.
On the fixed income side, accepting credit and international risk won in 2012, and we expect
more of the same in 2013. U.S. Treasuries and high-grade credit underperformed during 2012
as their absolute low yield levels finally showed evidence of perhaps bottoming. Assuming the economy continues to muddle through, and interest rates continue to be low, corporations and govern-ments will continue to be able improve their balance
sheets through accessing the debt markets.
In high yield credit, leveraged corporations should continue to see below-average default rates and low-ering interest burdens in 2013. In international govern-ment credit, emerging market bonds should continue to see a bid from investors as continued recognition of their governments’ healthy budget surpluses takes an increased hold. The same holds true for emerging market corporate bonds, which have the unique advan-tage of most issuances being US dollar denominated, enabling investors to avoid currency fluctuation risk.
Investment thoughts for 2013 always begin and end with potential risks we face as investors. Nobody has been talking about risks lately, which leads us to look at what could cause short-term volatility during the year. Here are several risks in a nutshell:
EuropeThe situation in Greece is certainly on firmer footing, but political tensions remain a major concern. Extend-ing to broader Europe, very little progress has been made towards a long-term, sustainable governance and
policy framework for the Euro-based countries. Europe faces other political challenges via Italy’s recent Prime Minister’s resignation and Germany holding federal elec-tions in the fall. Spain is also likely to need additional assistance from policymakers.
U.S.The fiscal cliff resolved as most analysts thought, which is a partial agreement and a handshake to extend the dead-line to discuss the more complex issues. Raising taxes is one thing, agreeing on spending cuts and an unresolved debt ceiling is a narrower tightrope facing politicians. We do not expect the markets to accept these negotiations as peacefully as it did raising taxes. We expect Republicans (who feel like they gave up too much in the tax increase debate) will hold the debt ceiling hostage to the dismay of Democrats, which will raise tensions in spending cut negotiations.
The U.S. economy continues to muddle along. Each of the past 3 years has seen a period during the year of a tempo-rary decline in economic data, which caused the market to correct. Most research we have read suggests that if it happens again in 2013, it is most likely to be in the first half of the year. This coupled with the unresolved debt ceiling causes us to be cautious during the first quarter.
Emerging MarketsWhile improvements are being seen in China’s economic data, India and Brazil continue to face some challenges. Ultimately, “as China goes, everyone goes,” but whether emerging markets are growing “fast enough” will con-tinue to be a focus for investors in 2013.
OilThe other main risk is the continued standoff with Iran. Any action taken by or against Iran would disrupt all major markets, especially the oil market. On the positive side, Goldman Sachs believes that developments leading to increasing oil supplies will lead to a more stable struc-tural oil price for the medium-to-longer term.
This is merely scratching the surface of the opportuni-ties and risks facing investors in 2013 and beyond. It’s the complex entanglement of all of these issues that causes us to believe that a diversified, balanced portfolio remains the optimal way to address the quickly chang-ing global market dynamics. When investing, we seek to avoid “returnless risk,” earn sufficient returns, buffer volatility and short-term losses, and diversify.

A Budget That WorksAndrew Clark, MBA, CFP®
Chief Planning Officer & Senior Investment [email protected]
as I work with clients, both in their working years and in retirement, they often express fears about the way they handle money. I hear things
like “we waste too much money” or “I need to save more.” More often, I hear clients say they are not sure where their money goes, as if it is a missing sock that’s disappeared in the dryer. My question to them is “did you tell your money where to go?”
If you do not tell your money what to do, you will not get the results you want. When it comes to determin-ing how you spend your money, or better yet, how to spend your money, a budget is often the tool you need.
I know, I know: working on a budget sounds like volun-teering for an unnecessary root canal. But the fact of the matter is, if you are not monitoring and controlling your cash flow, you probably are not living within your means in retirement or saving enough to reach retire-ment goals. Malcolm’s column last quarter pointed out that before you can be an investor, you must be a saver. Well if you aren’t saving or living within your means, a budget may help get you there. If you need help with your budget, read on. If you are good at budgeting, read on: you may learn something that you can use or pass along to your children, grandchildren, or parents.
When most people set about to do a budget they create a fictionalized document that shows how they would like to spend their money. It might resemble something you would want to give your doctor regard-ing your diet. You might be tempted to leave a few things out or under-represent some of the things you eat. When you prepare your initial budget, be honest. If you spend $5 on coffee every day at Starbucks, put it in your budget. You can always get critical later and look for opportunities to save. Most of us are pretty good at taking care of the big things in our lives: mort-gages, car payments, groceries, etc., but we often get lost in the details of our household budgets.
A second major mistake in budgeting is creating a one-time budget that you never revisit. This becomes like a New Year’s resolution weight loss plan, soon forgotten in a drawer. A budget should be created, and updated each month or income period (pay, pension, or retire-ment withdrawal all fit in this category).
So how can you get started? An ideal way is to create a budget that you look at several times each month, and is based on the zero-dollar budget concept (also called a zero-based budget). This is a budgeting con-cept made popular by Dave Ramsey, a well-known per-sonal money management expert, author, and speaker. Quite simply this is a method of budgeting where you account for all income, and subtract all budget items until you have zero dollars left. If forces you to as-sign every dollar of income in advance to an expense or savings category. As Dave Ramsey puts it, you’ll spend (or save) your month’s income on paper be-fore you spend (or save) it in real life.
You look at your cash flow on a weekly, bi-weekly, or monthly basis (however it is that you receive and disburse your income). You show all of the items you plan to spend (or save) money on dur-ing that period, whether it be paying specific bills, clothing, pocket money, family entertain-ment, a college savings account, or what have you. As you go down the list of items you spend money on, you subtract this from the income, so that you see something that looks a little like this: Week 1Income $ 10,000.00 Mortgage $ (3,500.00) Car Payment $ (700.00) Lunches $ (250.00)Savings $ (2,000.00) Running Total $ 3,550.00 7

Cable $ (65.00)Coffee each morning $ (50.00)Gasoline $ (150.00)Life Insurance Premiums $ (150.00)Gym Membership $ (50.00)Club Dues $ (100.00)Running Total $ 0.00
Once I have my budget on paper (or spreadsheet) I can then see where there may be opportunities for ad-ditional savings or where there is waste. You can also take your bank statement and compare it to the spend-ing plan and see how you did. A budget is a guide. It’s not perfect. If you don’t get it right the first time, that’s OK; when used properly a budget will help you im-prove spending or saving over time.
The other concept to gain about budgeting is that it’s not a one-time deal. Many people create an amazing looking budget that is colorful, and it winds up in a desk drawer. Instead, you have to see it as an ongo-ing process. If you take the simple budget I’ve done above and do it for each income period of the month, and plan your spending before the month begins, then monitor your actual spending against the plan, you will be amazed at what control you gain over your finances.
There are numerous software packages, spreadsheets and websites that will help you track your budget. Most, however, do a great job at tracking what you spent in the past, but don’t necessarily help you plan your spending in the same way that a zero-dollar budget will. You can keep it low-tech as well: a good yellow legal pad and a $5 calculator will work just fine.
At The Fiduciary Group we offer budgeting assistance as part of our overall Financial Planning services. We can help you develop a budget you can use each month to plan your spending and then monitor your progress. Gaining control of where your money goes can propel you toward being a better saver, and ultimately a bet-ter investor.
You assign each saving or spending item a dollar amount, and each line
item is deducted from the income to be received for the given period of time. If
you have finished your budget and you still have a positive balance at the bottom,
you’re not finished. The idea is to complete the budget until there are zero dollars left –
each dollar has been given a place.
Income $ 10,000.00 Mortgage $ (3,500.00)
Car Payment $ (700.00)Lunches $ (250.00)
Savings $ (2,000.00)Tithes / Charity $ (1,000.00)Property Taxes - set aside $ (750.00)
Kids College Acct $ (250.00)Groceries $ (500.00)
Clothing $ (100.00)Dry cleaning $ (50.00)
Electricity $ (250.00)Cable $ (65.00)Coffee each morning $ (50.00)
Gasoline $ (150.00)Life Insurance Premiums $ (150.00)Gym Membership $ (50.00)Club Dues $ (100.00)Running Total $ 1,085.00
At this point, my budget is still not quite complete. I should allocate the remaining $1,085.00 to savings or make an additional debt payment on the car or home, so that my total is zero. The purpose of the zero-based budget is to make sure you have allocated each dollar as you want it to be spent, and to identify opportunities to improve your spending and saving. You literally tell every dollar of your income where to go.
Income $ 10,000.00 Mortgage $ (3,500.00)Car Payment $ (700.00)Lunches $ (250.00)Savings $ (3,085.00)Tithes / Charity $ (1,000.00)Property Taxes - set aside $ (750.00)Kids College Acct $ (250.00)Groceries $ (500.00) Clothing $ (100.00)Drycleaning $ (50.00)Electricity $ (250.00)

Julia L. Butler, J.D., MBAChief Operating & Compliance [email protected]
someone say (or maybe even thought to yourself), “I don’t have money left over out of my paycheck to save for retirement because I spend everything I make”?
If retirement savings is not one of the first line-items of your monthly budget, right up there with your mortgage, insurance, food, and medicine, chances are you are not funding your personal “pension fund” sufficiently to give you the assets you need to retire. I would even argue that retirement savings (as well as emergency fund savings) should be the FIRST line item, because your other costs should be adjusted ac-cordingly as a function of your “post-saving” income.
Let’s take a simple example of how savings can grow over time, especially those savings made early on, due to the benefit of compounding.
The obvious starting point to “free up” more of your “spending” money for “saving” money is to look at your discretionary spending items. What are you spending for lunch on average on a monthly basis? It’s not uncommon for those who eat out every day (especially if they’re also stop-ping off for a Latte Grande or two at Starbucks) to spend $15-$25 per day for food and/or beverages. What if instead, you brought your lunch to work every day, made your coffee at home, and avoided the temptation to indulge in take-out or dining out for dinner more than once a week? Let’s say you could save just over $12 per day on “lunch money.” This adds up to $86 per week or $375 per month. After one year you would have about $4,500. That’s a good start to an investment account.
Well, here’s the great news, especially for young people. If you invested the $4,500 in a retirement account and then contributed $375 per month to this investment account for the next 40 years, and assuming you earn an
There is a game in golf called “Snake” that penalizes the member of the foursome who most recently 3-putted (for non-golfers, 3-putting is what you
try at all costs to avoid; you want to one- or two- putt the ball once it’s on the green). In the game of Snake, the first person to 3-putt the ball gets and keeps the “snake” in their pocket until someone else 3-putts a hole, then the snake goes to that golfer, and so on until all 18 holes are played. The last person to end up with the snake has to pay the other players the agreed bet.
For laughs, someone suggested to make the bet $1 but with the kicker that the bet would double with each hole a 3-putt was made. Thus after the first hole where someone made a 3-putt, the bet amount would be $1. The next time a 3-putt was made, the bet would increase to $2, then $4, then $8 and so forth.
Suffering all too often from a case of the 3-putts (and not even being a betting person), I decided to calcu-late what the person ending up with the snake would owe after 18 holes if there was a 3-putt on all 18 holes. Can you guess what the poor golfer who made the 3-putt on the 18th hole would have to pay? The answer: $131,072. Thank goodness there are only 18 holes. The 19th hole would cost $262,143!
The explosive growth of $1 to $131,072 in just 18 holes is a great example of compounding, which brings me to the subject of this article, which is how to be suc-cessful in saving for retirement.
Success Strategy #1: Save As Much as You Can for as Long as You CanAndrew wrote in this quarter’s newsletter about how to tackle budgeting. Clearly that is the start to success in retirement savings, because without a good budget which has a line-item for retirement savings, you will risk not putting money aside in a disciplined way every month for retirement from the start of your working life through the end. How many times have you heard 9
The Million Dollar Lunch

average compounded annual return of 7% (achievable if you follow a
disciplined investment strategy as we’ll discuss below), you will have
$1,057,706 by the time you retire. That’s the power of compounding.
Here’s a simple compounding table that demonstrates the difference the amount
of annual savings and the number of years saving can make:
Annual Number of Years of Saving Savings
The more you save and the longer you save, you will have significantly more in your investment account due to the effect of compounding.
So before going out for that $15-25 lunch or dinner, think about what it’s really costing you. The $12.36 you could save every day of every week of every year will be worth over one million dollars to your retire-ment account in just over 40 years.
As Jason Zweig of the Wall Street Journal recently wrote, “save more, stretch out your time horizons as long as you can and let the power of compounding—even at low rates—do its quiet work.”
Success Strategy #2: Earn Acceptable Annualized Returns Over Time While Managing risk appropriatelyOk, enough on the importance of saving enough, saving regularly, and saving over a long enough period of time. Let’s now take a look at the impact that the annualized return you earn over time makes in terms of how much you have in the end.
Let’s return to our example of saving $86 per week. We already know that these regular savings, added to your initial year’s savings of $4,500, would be worth
$1,057,706 in 40 years if you earned an average 7% compounded rate of return.
What if instead of 7% you only earned 2%, which is about the rate of return on a 10-year U.S. Treasury bond? The difference in the end result is dramatic. Earning only 2%, you would have only $285,421 in 40 years rather than the million-plus you would have with a 7% annualized return. Because of the power of compounding, simply by achieving 5 percentage points more on your annualized returns, you would have more than 3.7 times as much over a period of 40 years.
So what can you do to try to earn an average 7% annual-ized return during your accumulation/ savings years?
This is where a disciplined invest-ment approach comes in. Think
about your investment approach as following a risk/ return continuum over the 40 years you are saving. When you’re starting out or have 20, 30, or 40 years ahead of you before you will begin taking distributions from those savings, you can take more risk in search of higher annualized returns because you have more time to recover from the downturns and thus can better ride out the “ups and downs” of the markets. You will likely follow a Growth or Aggressive Growth strategy (stock allocation of 80% to 95% and a 5% to 20% fixed income allocation).
As your time horizon decreases to 10 to 20 years, you’ll likely reduce the volatility in your investment account slightly by moving to a Moderate Growth to Growth strategy (65% to 80% stocks/ 20% to 35% fixed income). In the last 5-10 years of your work life, you’ll likely follow a Moderate to Moderate Growth strategy (50% to 65% stock allocation), and in the last 5 years a Moderate Conservative to Moderate strategy (35% to 50% stocks).
Early in retirement, because you’ll still have 30 years or more ahead of you in which you need to generate income from your retirement account, you’ll still prob-ably invest your assets in a Moderate Conservative to Moderate approach, gradually reducing your strategy to a more Conservative approach later in retirement (20% to 35% stocks). Of course, an investment strat-egy is a very personal choice and is influenced not just by one’s time horizon but by one’s personal circum-stances and psychological risk tolerance as well.
5 Years 10 Years 15 Years 20 Years 25 Years 30 Years 35 Years 40 Years 2,500 $14,377 $34,541 $62,823 $102,489 $158,123 $236,152 $345,592 $499,088
5,000 $28,754 $69,082 $125,645 $204,977 $316,245 $472,304 $691,184 $998,176 7,500 $43,131 $103,623 $188,468 $307,466 $474,368 $708,456 $1,036,777 $1,497,263
10,000 $57,507 $138,164 $251,290 $409,955 $632,490 $944,608 $1,382,369 $1,996,351 12,500 $71,884 $172,706 $314,113 $512,444 $790,613 $1,180,760 $1,727,961 $2,495,439
15,000 $86,261 $207,247 $376,935 $614,932 $948,736 $1,416,912 $2,073,553 $2,994,527 17,500 $100,638 $241,788 $439,758 $717,421 $1,106,858 $1,653,064 $2,419,145 $3,493,614
20,000 $115,015 $276,329 $502,580 $819,910 $1,264,981 $1,889,216 $2,764,738 $3,992,702 22,500 $129,392 $310,870 $565,403 $922,399 $1,423,103 $2,125,368 $3,110,330 $4,491,790
25,000 $143,768 $345,411 $628,226 $1,024,887 $1,581,226 $2,361,520 $3,455,922 $4,990,878 The returns above are based on a 7% average compounded return, a starting balance of zero, and annual contributions.

If you follow a disciplined allocation strategy along the risk/return continuum, and assuming effective portfolio construction and management within that allocation strategy, a 7% average annualized return is a reasonable target over the period of your accumulation years. The longer your time horizon, the more risk you will be able to take. The shorter your time horizon, you should adjust your risk appropriately.
And remember, these returns are not linear. In other words, you will not experience portfolio growth of 7% per year, every year. As the graph shows, returns from year to year are highly irregular, more so with portfolios more weighted toward stocks. However, because your retirement account is one you likely will not touch (and should not touch) until retirement, as long as you ride out the ups and downs associated with a given strategy, and as long as you stick with and transition the strategy appropriately over time, you should be able to achieve an acceptable average compounded return.
In summary, don’t get caught with the retirement “snake” in your pocket. Save enough, save long enough, earn reasonable annualized returns for your given level of risk by following a disciplined investment strategy backed by effective portfolio management, and put the com-pounding machine to work for you.
Within this context, let’s take a look at some historical returns of these strategies and the volatility (devi-ance from the average annualized return in any given calendar year). Below is a graph showing the range of positive and negative annual returns (in any given 12 calendar months), and the average annualized return, for the six allocation strategies mentioned above (Aggressive Growth to Conservative) over the last 20 years. We have used the S&P 500 index as the proxy for the stock allocation and the Barclays Aggregate Bond Index as the proxy for fixed income. We caution that these returns do not represent either the expected future returns or expected volatility of these allocation portfolios, but at least it gives the flavor of the trade-off between risk (range of annual returns) and average annualized returns in these various allocation strate-gies, and why it makes sense to follow a disciplined, risk-appropriate investment allocation strategy that transitions over time as tolerance for risk decreases:
Range of Annual Returns and Average Compounded Annual Return of Allocation Portfolios 1992-2012
Past performance is not indicative of future results. This is particularly true when 10-year treasuries have averaged 6% historically and are currently yielding significantly less. All investments carry risk of loss, including loss of principal. Di-versification and allocation may mitigate risk but neither can ensure a profit nor protect against loss in a declining market. 11
8.22%
- 34.89%
33.76%
8.17%
30.89%
8.02%
- 22.21%
7.77%
-
7.44%
- 9.54%
22.30%
7.02%
- 3.21%
-40.00%
-30.00%
-20.00%
-10.00%
0.00%
10.00%
20.00%
30.00%
40.00%
50.00%
Range of PositiveAnnual Returns
Average Compounded Annual Return
Range of Negative Annual Returns
80% Stocks20% Bonds
35% Stocks65% Bonds35% Stocks65% Bonds 20% Stocks
80% Bonds20% Stocks80% Bonds
- 28.55%
15.88%
25.16%
50% Stocks50% Bonds50% Stocks50% Bonds
28.03%
65% Stocks35% Bonds65% Stocks35% Bonds
95% Stocks5% Bonds
95% Stocks5% Bonds
36.62%
28.03%

®
Trust
Note From The Editor:
We hope you have found this edition of The Fiduciary Group newsletter to be both interesting and relevant. We would like to hear your thoughts and suggestions. Please e-mail your feedback to [email protected]. If you have family or friends who you think might benefit from receiving our newsletter, please e-mail us their name, address, and e-mail address. Thanks, and we look forward to enhancing our service to you with each edition.-Julia L. Butler, Editor Chief Operating & Compliance Officer and Director, 401(k) Advisory Services
C. LEE BUTLER, CHAIRMAN EMERITUS
Office: 310 Commercial DriveSavannah, Georgia 31406
Mailing: P.O. Box 13688Savannah, Georgia • 31416
T 912-303-9000 • F 912-303-9001
WWW.TFGINVEST.COM
In this fast-moving world of ours with major changes in almost every field of activity, it is gratifying to know that we have retained many of the individuals and families as clients
of our investment management service from our beginning over 40 years ago. Needless to say, these clients have become dear friends over the years, through the ups and downs of the security markets and periods of political upheaval. A lot has happened between the days of Richard Nixon and Barack Obama.
When I think back to the origins of our firm, it really all started with the trust department work I had been doing from the time I graduated from law school. As a trust officer, I man-aged and administered families’ assets in order to protect the assets across generations and carry out the intentions of the grantor to care for the needs of his or her family members or designated beneficiaries.
I started this firm when I realized that to serve my clients in a way that truly served only their best interests, not the interests of a financial institution which held the trust assets, I had to be independent. That was the start of the independent investment advisor model which our firm has followed to this very day. Managing all clients’ assets in this way—based on inde-pendent decision making and undivided loyalty—has allowed us to expand the “trust service” model across all of our client relationships. This is what distinguishes “Registered Investment Advisors” from the many different kinds of financial professionals you can find today.
My advice to those looking for an investment advisor today is the same as it was 40 years ago. If you’re going to delegate the management of your money to someone, make sure it’s someone you can trust, someone who is independent of financial institutions (and the finan-cial interests those institutions may seek to promote), and someone who only has your best interests at heart.