the income statement and the statement of cash flows
TRANSCRIPT

Marshall: Accounting: What the Numbers Mean, Sixth Edition
9. The Income Statement and the Statement of Cash Flows
Text © The McGraw−Hill Companies, 2003
9The income statement answers some of the most important questions that users of the financial
statements have: What were the financial results of the entity’s operations for the fiscal period?
How much profit (or loss) did the firm have? Are sales increasing relative to cost of goods sold
and other operating expenses? Many income statement accounts were introduced in Chapters
5–8 when transactions also affecting asset and liability accounts were explained. However,
because of the significance of the net income figure to managers, stockholders, potential
investors, and others, it is appropriate to focus on the form and content of this financial
statement.
The income statement of Intel Corporation is on page 20 of the annual report in the Appendix.
This page of the annual report has been reproduced as Exhibit 9-1. Note that comparative
statements for the years ended on the last Saturday in December of 2001, 2000, and 1999 are
presented. This permits the reader of the statement to assess quickly the recent trend of these
important data.
As you might expect, Intel’s income statement starts with “net revenues” (sales). What in
popular jargon is referred to as the bottom line, or “net income,” is really the fifth line from the
bottom of the statement. In between, subtotals are provided for “operating income” and “income
before taxes.” Can you determine how much “gross profit” Intel earned in 2001? Although not
reported as a separate subtotal, this amount is the difference between net revenues and cost of
sales, or a whopping $13,052 million! The significance of the last four lines of the statement will be
discussed later in this chapter. The principal objective of the first part of this chapter is to permit
you to make sense of any income statement.
The second part of this chapter explores the statement of cash flows in more detail than
presented in Chapter 2. Remember that this statement explains the change in the entity’s cash
from the beginning to the end of the fiscal period by summarizing the cash effects of the firm’s
operating, investing, and financing activities during the period. The statement of cash flows gives
investors a chance to go beyond income statement numbers and determine whether or not those
results are consistent with what is happening in the principal cash flow categories. For example,
the first hints of financial difficulties of dot-com highfliers and Enron Corporation were visible in this
financial statement.
The IncomeStatement andthe Statement ofCash Flows
CH
AP
TER

Marshall: Accounting: What the Numbers Mean, Sixth Edition
9. The Income Statement and the Statement of Cash Flows
Text © The McGraw−Hill Companies, 2003
Intel’s comparative statements of cash flows are presented on page 22 of the Appendix for
each of the past three years. Notice that the subtotal captions describe the activities—operating,
investing, and financing—that caused cash to be provided and used during these years. Pay more
attention to these three “big-picture” items than to the detailed captions and amounts within each
category. Notice, however, that Intel uses a substantial amount of cash each year to purchase
property, plant, and equipment (an investing activity) and to repurchase and retire common stock
(a financing activity). As explained later, these are both signs of a financially healthy firm—especially
if the firm can cover these payments from its cash flows provided by operating activities. Did Intel
do this for each year presented?
The income statement and statement of cash flows report what has happened for a period of
time (usually, but not necessarily, for the fiscal year ended on the balance sheet date). The balance
sheet, remember, is focused on a single point in time—usually the end of the fiscal year—but one
can be prepared as of any date.
Chapter 9 The Income Statement and the Statement of Cash Flows 309
INTEL CORPORATIONConsolidated Statements of Income
(dollars in millions)
Three Years Ended December 29, 2001 2001 2000 1999
Net revenues . . . . . . . . . . . . . . . . . . . . . . . . . . . . . . . . . . . . . . . . . . . . . . . . . . . $26,539 $33,726 $29,389
Cost of sales . . . . . . . . . . . . . . . . . . . . . . . . . . . . . . . . . . . . . . . . . . . . . . . . . . . . $13,487 $12,650 $11,836
Research and development . . . . . . . . . . . . . . . . . . . . . . . . . . . . . . . . . . . . . . . . . 3,796 3,897 3,111
Marketing, general, and administrative . . . . . . . . . . . . . . . . . . . . . . . . . . . . . . . . . 4,464 5,089 3,872
Amortization of goodwill and other acquisition-related intangibles and costs . . . . 2,338 1,586 411
Purchased in-process research and development . . . . . . . . . . . . . . . . . . . . . . . . 198 109 392
Operating costs and expenses . . . . . . . . . . . . . . . . . . . . . . . . . . . . . . . . . . . . . . . $24,283 $23,331 $19,622
Operating income . . . . . . . . . . . . . . . . . . . . . . . . . . . . . . . . . . . . . . . . . . . . . . . . $ 2,256 $10,395 $ 9,767
Gains (losses) on equity securities, net . . . . . . . . . . . . . . . . . . . . . . . . . . . . . . . . . (466) 3,759 883
Interest income and other, net . . . . . . . . . . . . . . . . . . . . . . . . . . . . . . . . . . . . . . . 393 987 578
Income before taxes . . . . . . . . . . . . . . . . . . . . . . . . . . . . . . . . . . . . . . . . . . . . . $2,183 $15,141 $11,228
Provision for taxes . . . . . . . . . . . . . . . . . . . . . . . . . . . . . . . . . . . . . . . . . . . . . . . . 892 4,606 3,914
Net income . . . . . . . . . . . . . . . . . . . . . . . . . . . . . . . . . . . . . . . . . . . . . . . . . . . . . $ 1,291 $10,535 $ 7,314
Basic earnings per common share . . . . . . . . . . . . . . . . . . . . . . . . . . . . . . . . . . $ 0.19 $ 1.57 $ 1.10
Diluted earnings per common share . . . . . . . . . . . . . . . . . . . . . . . . . . . . . . . . . $ 0.19 $ 1.51 $ 1.05
Weighted average common shares outstanding . . . . . . . . . . . . . . . . . . . . . . . 6,716 6,709 6,648
Weighted average common shares outstanding, assuming dilution . . . . . . . 6,879 6,986 6,940
Income Statement Exhibit 9-1
QWhat DoesIt Mean?
1. What does it mean when net income is referred to as the “bottom line”?
Marshall: Accounting: What the Numbers Mean, Sixth Edition
9. The Income Statement and the Statement of Cash Flows
Text © The McGraw−Hill Companies, 2003
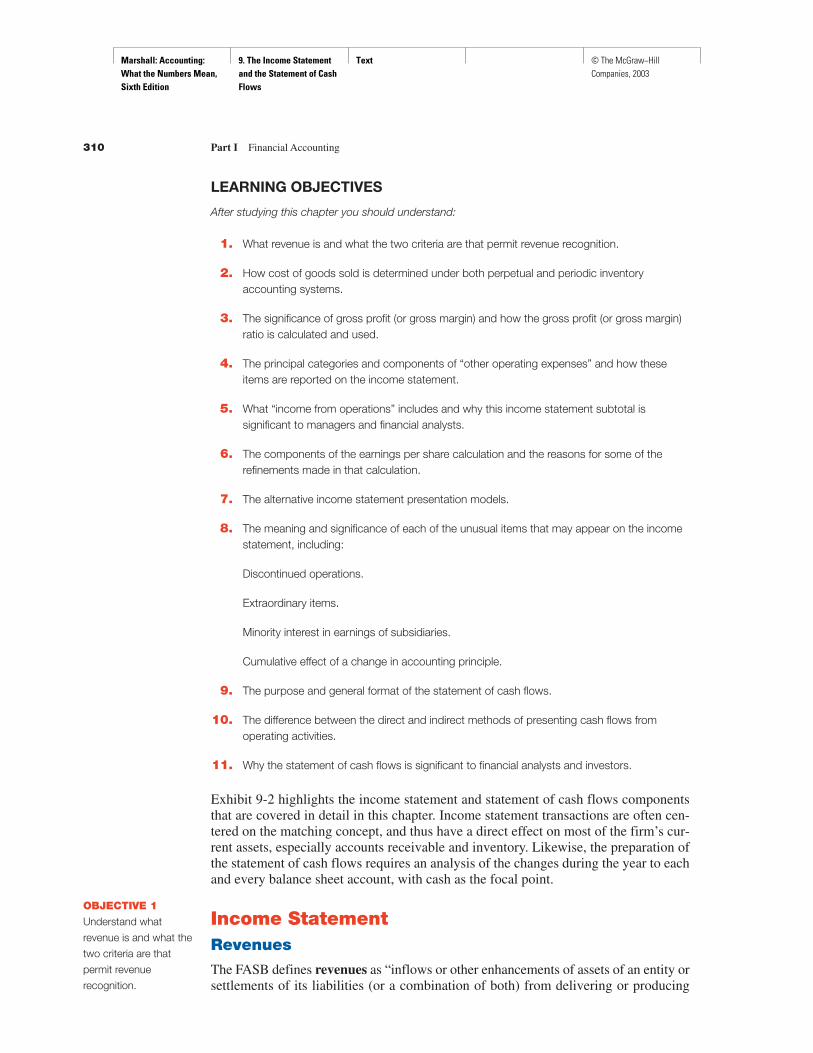
LEARNING OBJECTIVES
After studying this chapter you should understand:
1. What revenue is and what the two criteria are that permit revenue recognition.
2. How cost of goods sold is determined under both perpetual and periodic inventoryaccounting systems.
3. The significance of gross profit (or gross margin) and how the gross profit (or gross margin)ratio is calculated and used.
4. The principal categories and components of “other operating expenses” and how theseitems are reported on the income statement.
5. What “income from operations” includes and why this income statement subtotal issignificant to managers and financial analysts.
6. The components of the earnings per share calculation and the reasons for some of therefinements made in that calculation.
7. The alternative income statement presentation models.
8. The meaning and significance of each of the unusual items that may appear on the incomestatement, including:
Discontinued operations.
Extraordinary items.
Minority interest in earnings of subsidiaries.
Cumulative effect of a change in accounting principle.
9. The purpose and general format of the statement of cash flows.
10. The difference between the direct and indirect methods of presenting cash flows fromoperating activities.
11. Why the statement of cash flows is significant to financial analysts and investors.
Exhibit 9-2 highlights the income statement and statement of cash flows componentsthat are covered in detail in this chapter. Income statement transactions are often cen-tered on the matching concept, and thus have a direct effect on most of the firm’s cur-rent assets, especially accounts receivable and inventory. Likewise, the preparation ofthe statement of cash flows requires an analysis of the changes during the year to eachand every balance sheet account, with cash as the focal point.
Income StatementRevenues
The FASB defines revenues as “inflows or other enhancements of assets of an entity orsettlements of its liabilities (or a combination of both) from delivering or producing
310 Part I Financial Accounting
OBJECTIVE 1
Understand what
revenue is and what the
two criteria are that
permit revenue
recognition.

Marshall: Accounting: What the Numbers Mean, Sixth Edition
9. The Income Statement and the Statement of Cash Flows
Text © The McGraw−Hill Companies, 2003
Chapter 9 The Income Statement and the Statement of Cash Flows 311
BALANCE SHEET
Current Assets ChapterCash and cash equivalents 5, 9
Short-term marketable securities 5
Accounts receivable 5, 9
Notes receivable 5
Inventories 5, 9
Prepaid expenses 5
Deferred tax assets 5
Noncurrent AssetsLand 6
Buildings and equipment 6
Assets acquired by capital lease 6
Intangible assets 6
Natural resources 6
Other noncurrent assets 6
INCOME STATEMENT
Sales 5, 9
Cost of goods sold 5, 9
Gross profit (or gross margin) 5, 9
Selling, general, and administrative expenses 5, 6, 9
Income from operations 9
Gains (losses) on sale of assets 6, 9
Interest income 5, 9
Interest expense 7, 9
Income tax expense 9
Unusual items 9
Net income 5, 6, 7, 8, 9
Earnings per share 9
Current Liabilities ChapterShort-term debt 7
Current maturities of long-term debt 7
Accounts payable 7
Unearned revenue or deferred credits 7
Payroll taxes and other withholdings 7
Other accrued liabilities 7
Noncurrent LiabilitiesLong-term debt 7
Deferred income taxes 7
Other long-term liabilities 7
Owners’ EquityCommon stock 8
Preferred stock 8
Additional paid-in capital 8
Retained earnings 8
Accumulated other comprehensive income (loss) 8
Treasury stock 8
STATEMENT OF CASH FLOWS
Operating ActivitiesNet income 5, 6, 7, 8, 9
Depreciation expense 6, 9
(Gains) losses on sale of assets 6, 9
(Increase) decrease in current assets 5, 9
Increase (decrease) in current liabilities 5, 9
Investing ActivitiesProceeds from sale of
property, plant, and equipment 6, 9
Purchase of property, plant, and equipment 6, 9
Financing ActivitiesProceeds from long-term debt 7, 9
Repayment of long-term debt 7, 9
Issuance of common/preferred stock 8, 9
Purchase of treasury stock 8, 9
Payment of dividends 8, 9Primary topics of this chapter.Other affected financial statement components.
Financial Statements—The Big Picture
BALANCE SHEET
Exhibit 9-2
Marshall: Accounting: What the Numbers Mean, Sixth Edition
9. The Income Statement and the Statement of Cash Flows
Text © The McGraw−Hill Companies, 2003
goods, rendering services, or other activities that constitute the entity’s ongoing majoror central operations.”1 In its simplest and most straightforward application, this defin-ition means that when a firm sells a product or provides a service to a client or customerand receives cash, creates an account receivable, or satisfies an obligation, the firm hasrevenue. Most revenue transactions fit this simple and straightforward situation. Rev-enues generally are measured by the amount of cash received or expected to be receivedfrom the transaction. If the cash is not expected to be received within a year, then therevenue usually is measured by the present value of the amount expected to be received.
In Concepts Statement No. 5, the FASB expands upon the above definition of rev-enues to provide guidance in applying the fundamental criteria involved in recogniz-ing revenue. To be recognized, revenues must be realized or realizable and earned.Sometimes one of these criteria is more important than the other.
Realization means that the product or service has been exchanged for cash, claimsto cash, or an asset that is readily convertible to a known amount of cash or claims tocash. Thus the expectation that the product or service provided by the firm will resultin a cash receipt has been fulfilled.
Earned means that the entity has completed, or substantially completed, the ac-tivities it must perform to be entitled to the revenue benefits (i.e., the increase in cashor some other asset, or the satisfaction of a liability).
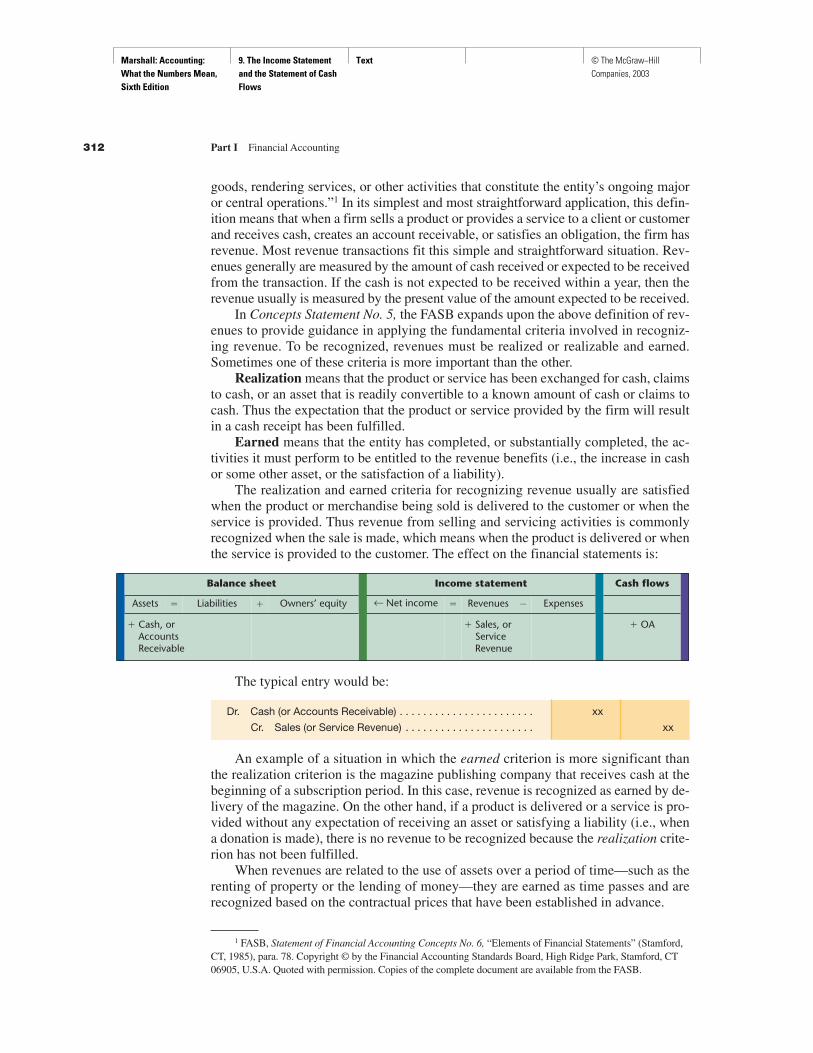
The realization and earned criteria for recognizing revenue usually are satisfiedwhen the product or merchandise being sold is delivered to the customer or when theservice is provided. Thus revenue from selling and servicing activities is commonlyrecognized when the sale is made, which means when the product is delivered or whenthe service is provided to the customer. The effect on the financial statements is:
The typical entry would be:
Dr. Cash (or Accounts Receivable) . . . . . . . . . . . . . . . . . . . . . . . xx
Cr. Sales (or Service Revenue) . . . . . . . . . . . . . . . . . . . . . . xx
An example of a situation in which the earned criterion is more significant thanthe realization criterion is the magazine publishing company that receives cash at thebeginning of a subscription period. In this case, revenue is recognized as earned by de-livery of the magazine. On the other hand, if a product is delivered or a service is pro-vided without any expectation of receiving an asset or satisfying a liability (i.e., whena donation is made), there is no revenue to be recognized because the realization crite-rion has not been fulfilled.
When revenues are related to the use of assets over a period of time—such as therenting of property or the lending of money—they are earned as time passes and arerecognized based on the contractual prices that have been established in advance.
312 Part I Financial Accounting
1 FASB, Statement of Financial Accounting Concepts No. 6, “Elements of Financial Statements” (Stamford,CT, 1985), para. 78. Copyright © by the Financial Accounting Standards Board, High Ridge Park, Stamford, CT06905, U.S.A. Quoted with permission. Copies of the complete document are available from the FASB.
Assets � Liabilities � Owners’ equity ← Net income
Balance sheet Income statement
�� Revenues Expenses
Cash flows
� OA� Cash, or AccountsReceivable
� Sales, or Service Revenue

Marshall: Accounting: What the Numbers Mean, Sixth Edition
9. The Income Statement and the Statement of Cash Flows
Text © The McGraw−Hill Companies, 2003
Some agricultural products, precious metals, and marketable securities have read-ily determinable prices and can be sold without significant effort. Where this is thecase, revenues (and some gains or losses) may be recognized when production is com-pleted or when prices of the assets change. These are unusual situations, however, andexceptions to the rule that an arm’s-length exchange (i.e., sales transaction) must occurto meet the realization and earned criteria.
Due to the increasing complexity of many business activities and other newly de-veloped transactions, a number of revenue recognition problems have arisen over theyears. Therefore, the FASB and its predecessors within the American Institute of Cer-tified Public Accountants have issued numerous pronouncements about revenuerecognition issues for various industries and transactions. As a result, revenue recog-nition is straightforward an overwhelming proportion of the time. However, sincethey are the key to the entire income statement, revenues that are misstated (usuallyon the high side) can lead to significantly misleading financial statements. Accord-ingly, management and internal auditors often design internal control procedures tohelp promote the accuracy of the revenue recognition process of the firm. The SECopened 49 new financial reporting cases during the first two months of 2002, whichwas a record high and compared to only 18 cases in the same period of 2001. Manyof these cases involved questionable revenue recognition practices. While not everySEC investigation will result in an enforcement action, the increased volume of casespoints to the increasingly aggressive accounting and reporting practices engaged in bycorporations, and to increasingly tighter regulatory scrutiny following the Enron col-lapse and bankruptcy.
Sales is the term used to describe the revenues of firms that sell purchased or man-ufactured products. In the normal course of business, some sales transactions will besubsequently voided because the customer returns the merchandise for credit or for arefund. In some cases, rather than have a shipment returned (especially if it is onlyslightly damaged or defective and is still usable by the customer), the seller will makean allowance on the amount billed and reduce the account receivable from the cus-tomer for the allowance amount. If the customer has already paid, a refund is made.These sales returns and allowances are accounted for separately for internal controland analysis purposes but are subtracted from the gross sales amount to arrive at netsales. In addition, if the firm allows cash discounts for prompt payment, total cash dis-counts are also subtracted from gross sales for reporting purposes. A fully detailed in-come statement prepared for use within the company might have the following revenuesection captions:
Sales . . . . . . . . . . . . . . . . . . . . . . . . . . . . . . . . . $
Less: Sales returns and allowances . . . . . . . . . . ( )
Less: Cash discounts on sales . . . . . . . . . . . . . . ( )
Net sales . . . . . . . . . . . . . . . . . . . . . . . . . . . . . $
Net sales, or net revenues, is the first caption usually seen in the income statement ofa merchandising or manufacturing company (as illustrated in Exhibit 9-1). Many com-panies provide a detailed calculation of the net sales amount in the accompanyingnotes or financial review section of the annual report.
Firms that generate significant amounts of revenue from providing services in addi-tion to (or instead of) selling a product will label the revenue source appropriately in theincome statement. Thus, a leasing company might report Rental and service revenues as
Chapter 9 The Income Statement and the Statement of Cash Flows 313

Marshall: Accounting: What the Numbers Mean, Sixth Edition
9. The Income Statement and the Statement of Cash Flows
Text © The McGraw−Hill Companies, 2003
the lead item on its income statement, or a consulting service firm might show Fee rev-enues, or simply Fees. If a firm has several types of revenue, the amount of each couldbe shown if each amount is significant and is judged by the accountant to increase theusefulness of the income statement. Occasionally, difficult revenue recognition issues areencountered in practice (see Business in Practice—The Hidden Cost of Shelf Space foran interesting example).
From a legal perspective, the sale of a product involves the passing of title (i.e.,ownership rights) in the product from the seller to the purchaser. The point at whichtitle passes usually is specified by the shipment terms (see Business in Practice—Shipping Terms). This issue becomes especially significant in two situations. The firstinvolves shipments made near the end of a fiscal period. The shipping terms will de-termine whether revenue is recognized in the period in which the shipment was madeor in the subsequent period when the shipment is received by the customer. Achiev-ing an accurate “sales cutoff” may be important to the accuracy of the financial state-ments if the period-end shipments are material in amount. The second situation relatesto any loss or damage of the merchandise while it is in transit from the seller to thebuyer. The legal owner of the merchandise, as determined by the shipping terms, isthe one who suffers the loss. Of course, this party may then seek to recover theamount of the loss from the party responsible for the damage (usually a third-partyshipping company).
For certain sales transactions, a firm may take more than a year to construct theitem being sold (for example, a cruiseship builder or a manufacturer of complex cus-tom machinery). In these circumstances, delaying revenue recognition until the prod-uct has been delivered may result in the reporting of misleading income statementinformation for a number of years. Because these items are being manufactured undera contract with the buyer that specifies a price, it is possible to recognize revenue (andcosts and profits) under what is known as the percentage-of-completion method. If,based on engineers’ analyses and other factors, 40% of a job has been completed in the
314 Part I Financial Accounting
Business in
Practice
The Hidden Cost of Shelf Space
An unusual twist to attempting to report revenues as high as possible was dealt with by the FASBin a change that took effect in 2002. A common practice of large consumer products companiesis to pay retail stores “incentives” to stock their merchandise. Prior to 2002 these incentive pay-ments were subtracted from manufacturers’ revenues to arrive at the revenue amount reportedin the income statement (i.e., they were treated as sales allowances). This practice hid the in-centive amounts from competitors and financial statement users. Beginning in 2002, incentivepayments are to be reported as operating expenses. The reporting of this change has forced theaffected companies to restate their 2001 revenues upward by the amount of the incentives.Thus, the 2001 incentive payments made by such companies became “known” as their 2002annual reports were issued. The restatements amounted to 13 to 15% of revenues for severallarge companies. However, per the new standard, in 2002 the incentive payments were includedwith operating expenses, so their significance is still hidden (in expenses now rather than in rev-enues). Essentially, the 2001 restatements gave analysts a one-time look at the incentiveamounts. The FASB is being pressured to require disclosure of these costs in the future but is re-sisting due to complications it believes are involved. Many industries use incentives—each for dif-ferent reasons and each with different results—so the development of consistent reportingpractices across industry lines would be difficult to achieve in practice.Source: “The Hidden Cost of Shelf Space,” commentary by Julie Forster, Business Week, April 15, 2002.

Marshall: Accounting: What the Numbers Mean, Sixth Edition
9. The Income Statement and the Statement of Cash Flows
Text © The McGraw−Hill Companies, 2003
current year, 40% of the expected revenue (and 40% of the expected costs) will be rec-ognized in the current year.
Companies should disclose any unusual revenue recognition methods, such as thepercentage-of-completion method, in the notes or financial review accompanying thefinancial statements. Because profits will be directly affected by revenue, the user ofthe financial statements must be alert to, and understand the effect of, any revenuerecognition method that differs from the usual and generally accepted practice of rec-ognizing revenue when the product or service has been delivered to the customer (seeBusiness in Practice—Revenue Recognition Practices of Dot-Com Companies for aglimpse at some of the questionable practices employed in recent years).
Gains, which are increases in an entity’s net assets resulting from incidental trans-actions or nonoperating activities, are usually not included with revenues at the begin-ning of the income statement. Gains are reported as other income after the firm’soperating expenses have been shown and income from operations has been reported.Interest income is an example of an “other income” item. The reporting of gains willbe explained in more detail later in this chapter.
Expenses
The FASB defines expenses as “outflows or other using up of assets or incurrences ofliabilities (or a combination of both) from delivering or producing goods, renderingservices, or carrying out other activities that constitute the entity’s ongoing major orcentral operations.”2 Some expenses (cost of goods sold is an example) are recognizedconcurrently with the revenues to which they relate. This is another application of thematching principle, which has been previously described and emphasized. Some ex-penses (administrative salaries, for example) are recognized in the period in which they
Chapter 9 The Income Statement and the Statement of Cash Flows 315
Business in
Practice
Shipping Terms
Many products are shipped from the seller to the buyer instead of being picked up by the buyerat the time of sale. Shipping terms define the owner of products while they are in transit. FOBdestination and FOB shipping point are the terms used. (FOB means free on board and is jar-gon that has carried over from the days when much merchandise was shipped by boat.) Whenan item is shipped FOB destination, the seller owns the product until it is accepted by the buyerat the buyer’s designated location. Thus title to merchandise shipped FOB destination passesfrom seller to buyer when the merchandise is received by the buyer. FOB shipping point meansthat the buyer accepts ownership of the product at the seller’s shipping location.
Shipping terms also describe which party to the transaction is to incur the shipping cost.The seller incurs the freight cost for shipments made FOB destination; the buyer incurs the costof shipments made FOB shipping point. Payment of the freight cost is another issue, however.The freight cost for products shipped freight prepaid is paid by the seller; when a shipment ar-rives freight collect, the buyer pays the freight cost. Ordinarily, items shipped FOB destinationwill have freight prepaid, and items shipped FOB shipping point will be shipped freight collect.However, depending on freight company policies or other factors, an item having shipping termsof FOB destination may be shipped freight collect, or vice versa. If this happens, the firm payingthe freight subsequently collects the amount paid to the freight company from the other firm,which incurred the freight cost under the shipping terms.
2 Ibid., para. 80.

Marshall: Accounting: What the Numbers Mean, Sixth Edition
9. The Income Statement and the Statement of Cash Flows
Text © The McGraw−Hill Companies, 2003
are incurred because the benefit of the expense is used up simultaneously or soon afterincurrence. Other expenses (depreciation, for example) result from an allocation of thecost of an asset to the periods that are expected to benefit from its use. In each of thesecategories, expenses are recognized in accordance with the matching principle becausethey are incurred to support the revenue-generating process. The amount of an expenseis measured by the cash or other asset used up to obtain the economic benefit it repre-sents. When the outflow of cash related to the expense will not occur within a year, itis appropriate to recognize the present value of the future cash flow as the amount ofthe expense.
Most of the time, the identification of expenses to be recognized in the current pe-riod’s income statement is straightforward. Cost of goods sold, compensation of em-ployees, uncollectible accounts receivable, utilities consumed, and depreciation oflong-lived assets are all examples. In other cases (research and development costs andadvertising expense, for example), the impact of the expenditure on the revenues of fu-ture periods is not readily determinable. For these types of expenditures, there is nosound method of matching the expenditure with the revenues that may be earned overseveral periods. To avoid the necessity of making arbitrary allocations, all advertisingand R&D expenditures are recorded as expenses in the period incurred. This approachis justified by the objectivity and conservatism concepts.
Other types of expense involve complex recognition and measurement issues:Income tax expense and pension expense are just two examples. Recall the discus-sion of these topics in Chapter 7 when the liabilities related to these expenses werediscussed.
Losses, which are decreases in an entity’s net assets resulting from incidentaltransactions or nonoperating activities, are not included with expenses. Losses are re-ported after income from operations, as discussed later in this chapter.
The discussion of expenses in this chapter follows the sequence in which expensesare presented in most income statements.
Cost of Goods Sold
Cost of goods sold is the most significant expense for many manufacturing and mer-chandising companies. Recall from your study of the accounting for inventories inChapter 5 that the inventory cost-flow assumption (FIFO, LIFO, weighted-average)being used by the firm affects this expense. Inventory shrinkage, the term that de-scribes inventory losses from obsolescence, errors, and theft, usually is included in costof goods sold unless the amount involved is material. In that case, the inventory losswould be reported separately as a loss after operating income has been reported.
Determination of the cost of goods sold amount is a function of the inventory cost-flow assumption and the inventory accounting system (periodic or perpetual) used toaccount for inventories. Recall that under a perpetual system, a record is made of everypurchase and every sale, and a continuous record of the quantity and cost of each itemis maintained. When an item is sold, its cost (as determined according to the cost-flowassumption) is transferred from the inventory asset to the cost of goods sold expensewith the following effect on the financial statements:
316 Part I Financial Accounting
OBJECTIVE 2
Understand how cost of
goods sold is
determined under both
perpetual and periodic
inventory accounting
systems.
Assets � Liabilities � Owners’ equity ← Net income
Balance sheet Income statement
�� Revenues Expenses
Cash flows
� Cost of Goods Sold
NA� Inventory

Marshall: Accounting: What the Numbers Mean, Sixth Edition
9. The Income Statement and the Statement of Cash Flows
Text © The McGraw−Hill Companies, 2003
The entry is:
Dr. Cost of Goods Sold . . . . . . . . . . . . . . . . . . . . . . . . . . . . . . . xx
Cr. Inventory . . . . . . . . . . . . . . . . . . . . . . . . . . . . . . . . . . . . xx
The key point about a perpetual inventory system is that cost is determined whenthe item is sold. As you can imagine, a perpetual inventory system requires much dataprocessing but can give management a great deal of information about which inventoryitems are selling well and which are not. Advances in point of sale technologies (suchas standard bar code scanners used by retail stores) have allowed even small merchan-dising firms to achieve perpetual inventories. Some systems are even tied in with thefirms’ suppliers so that when inventory falls to a certain level, a reorder is automati-cally placed. Under any type of perpetual system, regular counts of specific inventoryitems will be made on a cycle basis during the year, and actual quantities on hand willbe compared to the computer record of the quantity on hand. This is an internal controlprocedure designed to determine whether the perpetual system is operating accuratelyand to trigger an investigation of significant differences.
In a periodic inventory system, a count of the inventory on hand (taking a physicalinventory) is made periodically—frequently at the end of a fiscal year—and the cost ofinventory on hand (determined according to the cost-flow assumption) is determined.This cost is then subtracted from the sum of the cost of the beginning inventory (i.e.,the ending inventory of the prior period) and the cost of the merchandise purchasedduring the current period. (For a manufacturing firm, the cost of goods manufactured—discussed in Chapter 13—rather than purchases, is used.) This cost of goods soldmodel is illustrated below using 2001 data from the Intel Corporation financial state-ments in the Appendix. Can you find the inventory and cost of goods sold amounts inthe Appendix? The unknown amounts for net purchases and goods available for sale
Chapter 9 The Income Statement and the Statement of Cash Flows 317
Business in
Practice
Revenue Recognition Practices of Dot-Com Companies
Rapidly rising stock values of dot-com companies during the late 1990s seemed to run contraryto traditional value measures such as the price/earnings ratio because many of these companieshad no earnings. Financial analysts and investors used revenue growth as a key benchmark.That focus tempted many firms to record revenues in ways that stretched generally acceptedrevenue recognition practices that bordered on reporting misleading results. Some of these prac-tices were:
Recognizing revenue too soon—Revenue was recognized when orders were received butbefore they were shipped, or revenue was recorded from future software upgradesbefore the upgrades had been completed, or revenue was recognized from softwarelicenses when a contract was signed rather than over the life of the contract.
Overstating revenue from reselling—When a product or service was resold without everhaving been owned by the reseller, revenue was recognized for the full amountcharged to the purchaser, rather than just for the reseller’s markup.
As a result of such questionable practices, the Securities and Exchange Commission (SEC)issued a staff accounting bulletin on revenue recognition in late 1999 that generally delayed therecognition of revenue into future quarters for certain dot-com companies and caused several af-fected companies to restate prior-year earnings. Historically, more than half of all SEC accounting-fraud cases have involved revenue hoaxes, so the heightened scrutiny of software companypractices did not come as a surprise to many financial analysts.

Marshall: Accounting: What the Numbers Mean, Sixth Edition
9. The Income Statement and the Statement of Cash Flows
Text © The McGraw−Hill Companies, 2003
318 Part I Financial Accounting
OBJECTIVE 3
Understand the
significance of gross
profit and how the gross
profit ratio is calculated
and used.
have been solved for in the model using these known amounts. All amounts are in mil-lions of dollars.
Cost of beginning inventory . . . . . . . . . . . . . . . . . . . . . . $ 2,241
� Net purchases (cost of goods manufactured) . . . . . . . 13,499
� Cost of goods available for sale . . . . . . . . . . . . . . . . . $15,740
� Cost of ending inventory . . . . . . . . . . . . . . . . . . . . . . (2,253)
� Cost of goods sold . . . . . . . . . . . . . . . . . . . . . . . . . . $13,487
The amounts shown for cost of goods sold, inventory, and net purchases include theprice paid to the supplier, plus all ordinary and necessary costs related to the purchasetransaction (such as freight and material handling charges). Cost is reduced by theamount of any cash discount allowed on the purchase. When the periodic inventorysystem is used, freight charges, purchases discounts, and purchases returns andallowances (the purchaser’s side of the sales return and allowance transaction) are usu-ally recorded in separate accounts, and each account balance is classified with pur-chases. Thus the net purchases amount is made up of the following:
Purchases . . . . . . . . . . . . . . . . . . . . . . . . . . . . . . . . . . . $
Add: Freight charges
Less: Purchase discounts . . . . . . . . . . . . . . . . . . . . . . . ( )
Less: Purchase returns and allowances . . . . . . . . . . . . . ( )
Net purchases . . . . . . . . . . . . . . . . . . . . . . . . . . . . . . $
Although the periodic system may require a less complicated record-keeping sys-tem than the perpetual system, the need to take a complete physical inventory to de-termine accurately the cost of goods sold is a disadvantage. Also, although it can beestimated or developed from special analysis, inventory shrinkage (losses from theft,errors, etc.) is not really known when the periodic system is used because these lossesare included in the total cost of goods sold.
Note that selling and administrative expenses (discussed later in the Other Operat-ing Expenses section of this chapter) are not included as part of cost of goods sold!
Gross Profit or Gross Margin
The difference between sales revenue and cost of goods sold is gross profit, or grossmargin. Using data from Exhibit 9-1, the income statement for Intel Corporation tothis point is:
INTEL CORPORATIONConsolidated Statements of Income
(dollars in millions)
Three Years Ended December 29, 2001 2001 2000 1999
Net revenues . . . . . . . . . . . . . . . . . . . . . . . . . . . . . . . . . . . . . . $26,539 $33,726 $29,389
Cost of sales . . . . . . . . . . . . . . . . . . . . . . . . . . . . . . . . . . . . . . 13,487 12,650 11,836
Gross profit . . . . . . . . . . . . . . . . . . . . . . . . . . . . . . . . . . . . . . . $13,052 $21,076 $17,553
When the amount of gross profit is expressed as a percentage of the sales amount,the resulting gross profit ratio (or gross margin ratio) is an especially important
Marshall: Accounting: What the Numbers Mean, Sixth Edition
9. The Income Statement and the Statement of Cash Flows
Text © The McGraw−Hill Companies, 2003
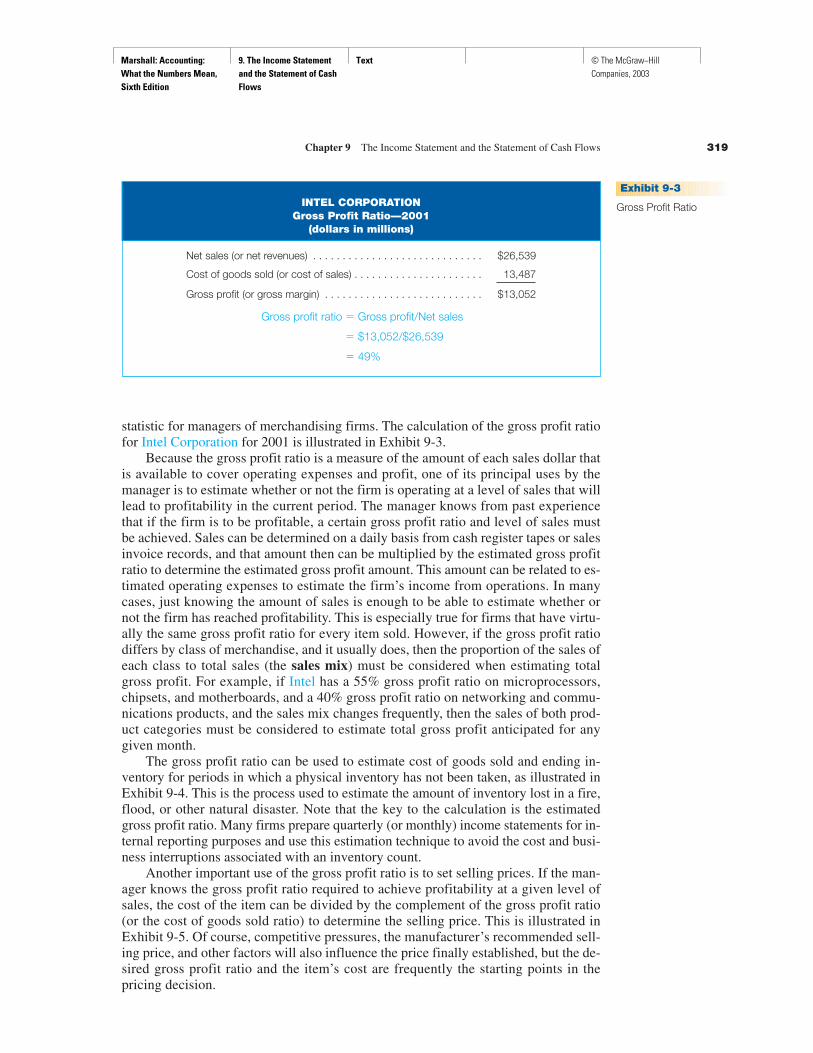
statistic for managers of merchandising firms. The calculation of the gross profit ratiofor Intel Corporation for 2001 is illustrated in Exhibit 9-3.
Because the gross profit ratio is a measure of the amount of each sales dollar thatis available to cover operating expenses and profit, one of its principal uses by themanager is to estimate whether or not the firm is operating at a level of sales that willlead to profitability in the current period. The manager knows from past experiencethat if the firm is to be profitable, a certain gross profit ratio and level of sales mustbe achieved. Sales can be determined on a daily basis from cash register tapes or salesinvoice records, and that amount then can be multiplied by the estimated gross profitratio to determine the estimated gross profit amount. This amount can be related to es-timated operating expenses to estimate the firm’s income from operations. In manycases, just knowing the amount of sales is enough to be able to estimate whether ornot the firm has reached profitability. This is especially true for firms that have virtu-ally the same gross profit ratio for every item sold. However, if the gross profit ratiodiffers by class of merchandise, and it usually does, then the proportion of the sales ofeach class to total sales (the sales mix) must be considered when estimating totalgross profit. For example, if Intel has a 55% gross profit ratio on microprocessors,chipsets, and motherboards, and a 40% gross profit ratio on networking and commu-nications products, and the sales mix changes frequently, then the sales of both prod-uct categories must be considered to estimate total gross profit anticipated for anygiven month.
The gross profit ratio can be used to estimate cost of goods sold and ending in-ventory for periods in which a physical inventory has not been taken, as illustrated inExhibit 9-4. This is the process used to estimate the amount of inventory lost in a fire,flood, or other natural disaster. Note that the key to the calculation is the estimatedgross profit ratio. Many firms prepare quarterly (or monthly) income statements for in-ternal reporting purposes and use this estimation technique to avoid the cost and busi-ness interruptions associated with an inventory count.
Another important use of the gross profit ratio is to set selling prices. If the man-ager knows the gross profit ratio required to achieve profitability at a given level ofsales, the cost of the item can be divided by the complement of the gross profit ratio(or the cost of goods sold ratio) to determine the selling price. This is illustrated inExhibit 9-5. Of course, competitive pressures, the manufacturer’s recommended sell-ing price, and other factors will also influence the price finally established, but the de-sired gross profit ratio and the item’s cost are frequently the starting points in thepricing decision.
Chapter 9 The Income Statement and the Statement of Cash Flows 319
Exhibit 9-3
Gross Profit RatioINTEL CORPORATIONGross Profit Ratio—2001
(dollars in millions)
Net sales (or net revenues) . . . . . . . . . . . . . . . . . . . . . . . . . . . . . $26,539
Cost of goods sold (or cost of sales) . . . . . . . . . . . . . . . . . . . . . . 13,487
Gross profit (or gross margin) . . . . . . . . . . . . . . . . . . . . . . . . . . . $13,052
Gross profit ratio � Gross profit/Net sales
� $13,052/$26,539
� 49%

Marshall: Accounting: What the Numbers Mean, Sixth Edition
9. The Income Statement and the Statement of Cash Flows
Text © The McGraw−Hill Companies, 2003
The gross profit ratio required to achieve profitability will vary among firms as aresult of their operating strategies. For example, a discount store seeks a high sales vol-ume and a low level of operating expenses, so a relatively low gross profit ratio is ac-cepted. A boutique, on the other hand, has a relatively low sales volume and higheroperating expenses and needs a relatively high gross profit ratio to achieve profitability.
Even though gross profit and the gross profit ratio are widely used internally bythe managers of the firm, many companies (such as Intel) do not present gross profit as
320 Part I Financial Accounting
Exhibit 9-4
Using the Gross ProfitRatio to EstimateEnding Inventory andCost of Goods Sold
Assumptions:
A firm expects to have a gross profit ratio of 30% for the current fiscal year. Beginninginventory is known because it is the amount of the physical inventory taken at the endof the prior fiscal year. Net sales and net purchases are known from the accountingrecords of the current fiscal period.
The model (with assumed known data entered):
Net sales . . . . . . . . . . . . . . . . . . . . . . . . . . $100,000 100%
Cost of goods sold:
Beginning inventory . . . . . . . . . . . . . . . . $ 19,000
Net purchases . . . . . . . . . . . . . . . . . . . . 63,000
Cost of goods available for sale . . . . . . . $ 82,000
Less: Ending inventory . . . . . . . . . . . . . . ?
Cost of goods sold . . . . . . . . . . . . . . . . . $ ?
Gross profit . . . . . . . . . . . . . . . . . . . . . . . . $ ? 30%
Calculation of Estimated Ending Inventory:
Gross profit � 30% � $100,000 � $30,000
Cost of goods sold � $100,000 � $30,000 � $70,000
Ending inventory � $82,000 � $70,000 � $12,000
Exhibit 9-5
Using Desired GrossProfit Ratio to SetSelling Price
Assumption:
A retail store’s cost for a particular carpet is $8 per square yard. What selling price persquare yard should be established for this product if a 20% gross profit ratio is desired?
Selling price � Cost of product/(1 � Desired gross profit ratio)
� $8/(1 � 0.2)
� $10
Proof:Calculated selling price . . . . . . . . . . . . . . . . . . . . . . . . . . . . . . . . . . . . $10 per square yard
Cost of product . . . . . . . . . . . . . . . . . . . . . . . . . . . . . . . . . . . . . . . . . . 8 per square yard
Gross profit . . . . . . . . . . . . . . . . . . . . . . . . . . . . . . . . . . . . . . . . . . . . . $ 2 per square yard
Gross profit ratio � Gross profit/Selling price
� $2/$10
� 20%
Marshall: Accounting: What the Numbers Mean, Sixth Edition
9. The Income Statement and the Statement of Cash Flows
Text © The McGraw−Hill Companies, 2003
a separate item in their published income statements. However, cost of goods sold usu-ally is shown as a separate item. Thus, the user of the income statement can make thecalculation for comparative and other evaluation purposes.
Other Operating Expenses
The principal categories of other operating expenses frequently reported on the in-come statement are:
Selling expenses.General and administrative expenses.Research and development expenses.
These categories can be combined in a variety of ways for financial reporting pur-poses. For instance, Intel uses two principal categories: “Research and development”and “Marketing, general, and administrative” expenses.
The financial statement footnotes, or financial review, will sometimes provide de-tailed disclosure of the nature and amount of expense items that are combined withothers in the income statement. However, management often reports certain operatingexpenses as separate items to highlight their significance. Common examples includerepairs and maintenance, research and development, and advertising. Total deprecia-tion and amortization expense is frequently reported as a separate item on the incomestatement (or disclosed in the explanatory notes) because these expenses do not resultin the disbursement of cash. The total of depreciation and amortization expense alsoappears in the statement of cash flows, as will be illustrated later in this chapter.
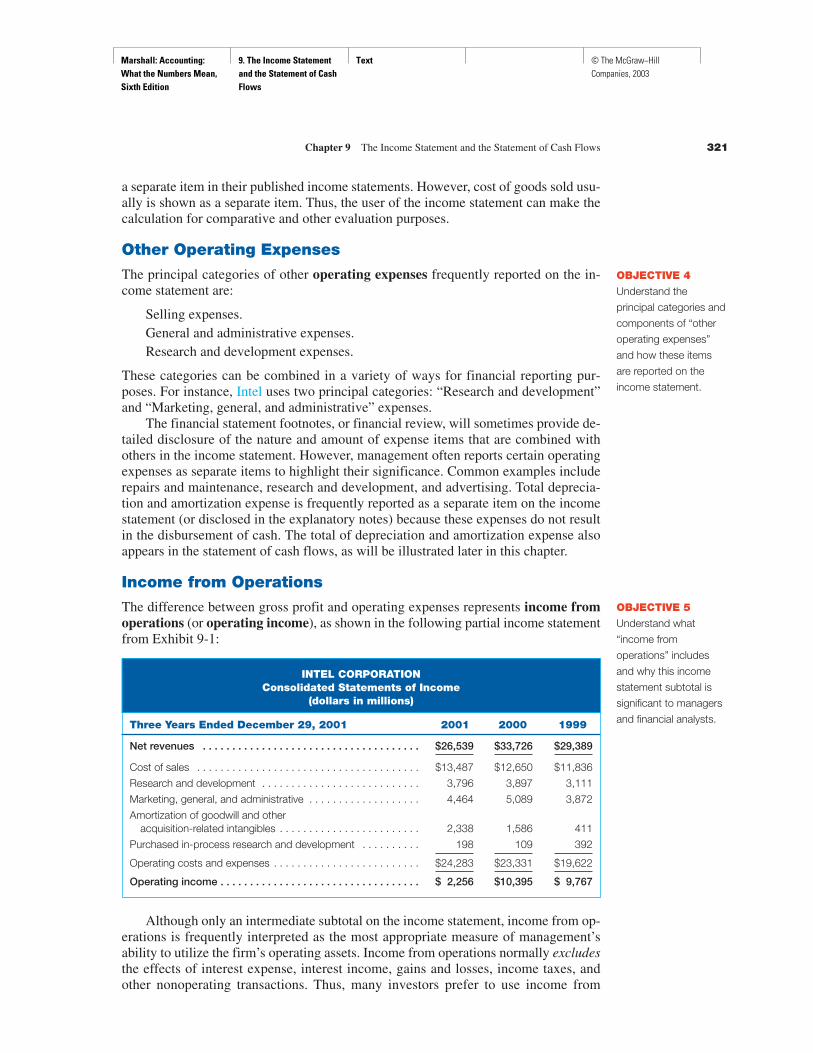
Income from Operations
The difference between gross profit and operating expenses represents income fromoperations (or operating income), as shown in the following partial income statementfrom Exhibit 9-1:
INTEL CORPORATIONConsolidated Statements of Income
(dollars in millions)
Three Years Ended December 29, 2001 2001 2000 1999
Net revenues . . . . . . . . . . . . . . . . . . . . . . . . . . . . . . . . . . . . . $26,539 $33,726 $29,389
Cost of sales . . . . . . . . . . . . . . . . . . . . . . . . . . . . . . . . . . . . . . $13,487 $12,650 $11,836
Research and development . . . . . . . . . . . . . . . . . . . . . . . . . . . 3,796 3,897 3,111
Marketing, general, and administrative . . . . . . . . . . . . . . . . . . . 4,464 5,089 3,872
Amortization of goodwill and other acquisition-related intangibles . . . . . . . . . . . . . . . . . . . . . . . . 2,338 1,586 411
Purchased in-process research and development . . . . . . . . . . 198 109 392
Operating costs and expenses . . . . . . . . . . . . . . . . . . . . . . . . . $24,283 $23,331 $19,622
Operating income . . . . . . . . . . . . . . . . . . . . . . . . . . . . . . . . . . $ 2,256 $10,395 $ 9,767
Although only an intermediate subtotal on the income statement, income from op-erations is frequently interpreted as the most appropriate measure of management’sability to utilize the firm’s operating assets. Income from operations normally excludesthe effects of interest expense, interest income, gains and losses, income taxes, andother nonoperating transactions. Thus, many investors prefer to use income from
Chapter 9 The Income Statement and the Statement of Cash Flows 321
OBJECTIVE 4
Understand the
principal categories and
components of “other
operating expenses”
and how these items
are reported on the
income statement.
OBJECTIVE 5
Understand what
“income from
operations” includes
and why this income
statement subtotal is
significant to managers
and financial analysts.

Marshall: Accounting: What the Numbers Mean, Sixth Edition
9. The Income Statement and the Statement of Cash Flows
Text © The McGraw−Hill Companies, 2003
operations data (rather than net income data) to make a “cleaner” assessment of thefirm’s profitability trend. As discussed in Chapter 3, income from operations is fre-quently used in the return on investment calculation, which relates operating income toaverage operating assets.
Although operating income is commonly used as a proxy for net income, investorsmust pay careful attention to the items that are included in the determination of this im-portant subtotal. In recent years, for example, many firms have reported items such as“restructuring charges” and “asset impairment losses” as operating expenses becausethe corporate downsizing efforts that lead to such write-offs have been occurring morefrequently. Yet, other firms report these items in the “other income and expenses” cat-egory, which is shown as a nonoperating item. Of course, it also is permissible (andquite common) to simply subtract total expenses from total revenues to arrive at net in-come without indicating a separate amount for income from operations.
Managers of those firms that do not report income from operations as a separateitem believe that other income and expense items (i.e., gains and losses) should receiveas much attention in the evaluation process as revenues and expenses from the firm’sprincipal operations. After all, nonoperating items do exist and do affect overall prof-itability. There is no single best presentation for all firms; this is another area in whichthe accountant’s judgment is used to select among equally acceptable financial report-ing alternatives.
Other Income and Expenses
Other income and expenses are reported after income from operations. These nonop-erating items include interest expense, interest income, gains, and losses.
Interest expense is the item of other income and expenses most frequently identi-fied separately. Most financial statement users want to know the amount of this ex-pense because it represents a contractual obligation that cannot be avoided. Asdiscussed in Chapter 7, interest expense is associated with financial leverage. Themore a firm borrows, the more interest expense it incurs, and the higher its financialleverage. Although this may lead to a greater ROE for stockholders, it also increasesthe riskiness of their investment.
Interest income earned from excess cash that has been temporarily invested is notordinarily subtracted from interest expense. Interest income is reported as a separateitem if it is material in amount relative to other nonoperating items. The full disclosureprinciple is applied to determine the extent of the details reported in this section of theincome statement. Significant items that would facilitate the reader’s understanding ofnet income or loss are separately identified, either in the statement itself or in the foot-notes or financial review. Items that are not significant are combined in an “other” or“miscellaneous” category. Examples of nonoperating gains or losses are those result-ing from litigation, the sale or disposal of depreciable assets (including plant closings),and inventory obsolescence losses.
Income before Income Taxes and Income Tax Expense
The income statement usually has a subtotal labeled “Income before income taxes,”followed by the caption “Income taxes” or “Provision for income taxes” and theamount of this expense. Some income statements do not use the “Income before in-come taxes” caption; income taxes are simply listed as another expense in these state-ments. There will almost always be a footnote or financial review disclosure of thedetails of the income tax expense calculation.
322 Part I Financial Accounting

Marshall: Accounting: What the Numbers Mean, Sixth Edition
9. The Income Statement and the Statement of Cash Flows
Text © The McGraw−Hill Companies, 2003
Net Income and Earnings per Share
Net income (or net loss), sometimes called the bottom line, is the arithmetic sum of therevenues and gains minus the expenses and losses. Because net income increases re-tained earnings, which is a necessary prerequisite to dividends, stockholders and po-tential investors are especially interested in net income. Reinforce your understandingof information presented in the income statement by referring again to Exhibit 9-1 andby studying the structure of income statements in other annual reports you may have.
To facilitate interpretation of net income (or loss), it also is reported on a per shareof common stock basis. Reported are basic earnings per share and, if the firm has is-sued stock options or convertible securities (long-term debt or preferred stock that isconvertible into common stock), diluted earnings per share. Basic EPS and dilutedEPS (if appropriate) are presented for both income from continuing operations or in-come before extraordinary items (discussed later in this chapter) and for net income.Basic earnings per share is calculated by dividing net income by the average numberof shares of common stock outstanding during the year. There are two principal com-plications in the calculation that should be understood. First, a weighted-average num-ber of shares of common stock is used. This is sensible because if shares are issuedearly in the year, the proceeds from their sale have been used longer in the income-generating process than the proceeds from shares issued later in the year. The weight-ing basis usually used is the number of months each block of shares has beenoutstanding. The weighted-average calculation is illustrated in Exhibit 9-6.
The other complication in the EPS calculation arises when a firm has preferredstock outstanding. Remember that preferred stock is entitled to its dividend before div-idends can be paid on common stock. Because of this prior claim to earnings, theamount of the preferred stock dividend requirement is subtracted from net income toarrive at the numerator in the calculation of earnings per share of common stock out-standing. Recall that dividends are not expenses, so the preferred stock dividend re-quirement is not shown as a deduction in the income statement. To illustrate the basicEPS calculation, assume that Cruisers, Inc., had net income of $1,527,000 for the yearended August 31, 2003, and had 80,000 shares of a 7%, $50 par value preferred stockoutstanding during the year. Using the weighted-average number of shares of commonstock outstanding from Exhibit 9-6, the earnings per share of common stock would becalculated as follows:
Net income . . . . . . . . . . . . . . . . . . . . . . . . . . . . . . . . . . . . . . $1,527,000
Less preferred stock dividend requirement (7% � $50 par value � 80,000 shares outstanding) . . . . . 280,000
Net income available for common stock . . . . . . . . . . . . . . . . $1,247,000
�
� $1,247,000/224,167� $5.56
Net income available for common stock
Weighted-average number of shares of common stock outstanding
Basic earnings per share of
common stock outstanding
Chapter 9 The Income Statement and the Statement of Cash Flows 323
QWhat DoesIt Mean?
2. What does it mean to look at the trend of the major subtotals on an incomestatement?
OBJECTIVE 6
Understand the
components of the
earnings per share
calculation and the
reasons for some of the
refinements made in
that calculation.

Marshall: Accounting: What the Numbers Mean, Sixth Edition
9. The Income Statement and the Statement of Cash Flows
Text © The McGraw−Hill Companies, 2003
Because of their significance, earnings per share amounts are reported on the incomestatement just below the amount of net income.
As stated above, in addition to the basic earnings per share, a firm may be re-quired to report diluted earnings per share. If the firm has issued long-term debt orpreferred stock that is convertible into common stock, it is possible that the conver-sion of the debt or preferred stock could result in a reduction of basic earnings pershare of common stock outstanding. This can happen because the increase in net in-come available for common stock (if interest expense is reduced, or preferred divi-dends are not required) is proportionately less than the number of additional commonshares issued in the conversion. If a firm has a stock option plan (see Chapter 10), theissuance of additional shares pursuant to the plan has the potential of reducing basicearnings per share. Other incentive and financing arrangements may also require is-suance of additional shares, which may also have the effect of reducing basic earningsper share. The reduction in basic earnings per share of common stock is referred to asdilution. The effect of the potential dilution is reported on the income statement byshowing diluted earnings per share of common stock as well as basic earnings pershare. Intel’s diluted earnings per share of $1.51 for 2001 represented a potential di-lution of $0.06 per share due primarily to the incremental shares that would be issuedupon the assumed exercise of employee stock options. In 2000, Intel’s diluted EPSwas exactly equal to its basic EPS of $0.19, implying that no potentially dilutive se-curities were outstanding at the end of the year. The notes to Intel’s financial state-ments confirm this by stating that the outstanding stock options were excluded fromthe 2001 diluted EPS calculation because they were considered antidilutive (meaningthat it would not have been beneficial for Intel’s option holders to have exercised theiroptions at that point in time). Refer to pages 20 and 26 in Intel’s annual report in theAppendix for details.
The income statement presentation of net income and EPS is shown below. Data arefrom the previous Cruisers, Inc., illustrations, which have no discontinued operations
324 Part I Financial Accounting
Exhibit 9-6
Weighted-AverageShares OutstandingCalculation
Assumptions:
On September 1, 2003, the beginning of its fiscal year, Cruisers, Inc., had 200,000shares of common stock outstanding.
On January 3, 2004, 40,000 additional shares were issued for cash.
On June 25, 2004, 15,000 shares of common stock were acquired as treasury stock(and are no longer outstanding).
Weighted-Average Calculation:
Number of Number of Shares Period Months Outstanding Months � Shares
9/1–1/3 . . . . . . . . . . . . . . 4 200,000 800,000
1/3–6/25 . . . . . . . . . . . . . 6 240,000 1,440,000
6/25–8/31 . . . . . . . . . . . . 2 225,000 450,000
Totals . . . . . . . . . . . . . . . . 12 2,690,000
Weighted-average number of shares outstanding � 2,690,000/12
� 224,167

Marshall: Accounting: What the Numbers Mean, Sixth Edition
9. The Income Statement and the Statement of Cash Flows
Text © The McGraw−Hill Companies, 2003
or extraordinary items. Note that the diluted earnings per share amount is assumed for il-lustration purposes.
Net income . . . . . . . . . . . . . . . . . . . . . . . . . . . . . . . . . . . . . . $1,527,000
Basic earnings per share of common stock . . . . . . . . . . . . . . $ 5.56
Diluted earnings per share of common stock . . . . . . . . . . . . . $ 4.98
If there are any unusual items on the income statement (discussed later in thischapter), the per share amount of each item is disclosed, and EPS is the sum of EPS be-fore the unusual items and the per share amounts of the unusual items. This is done forboth basic and diluted EPS data.
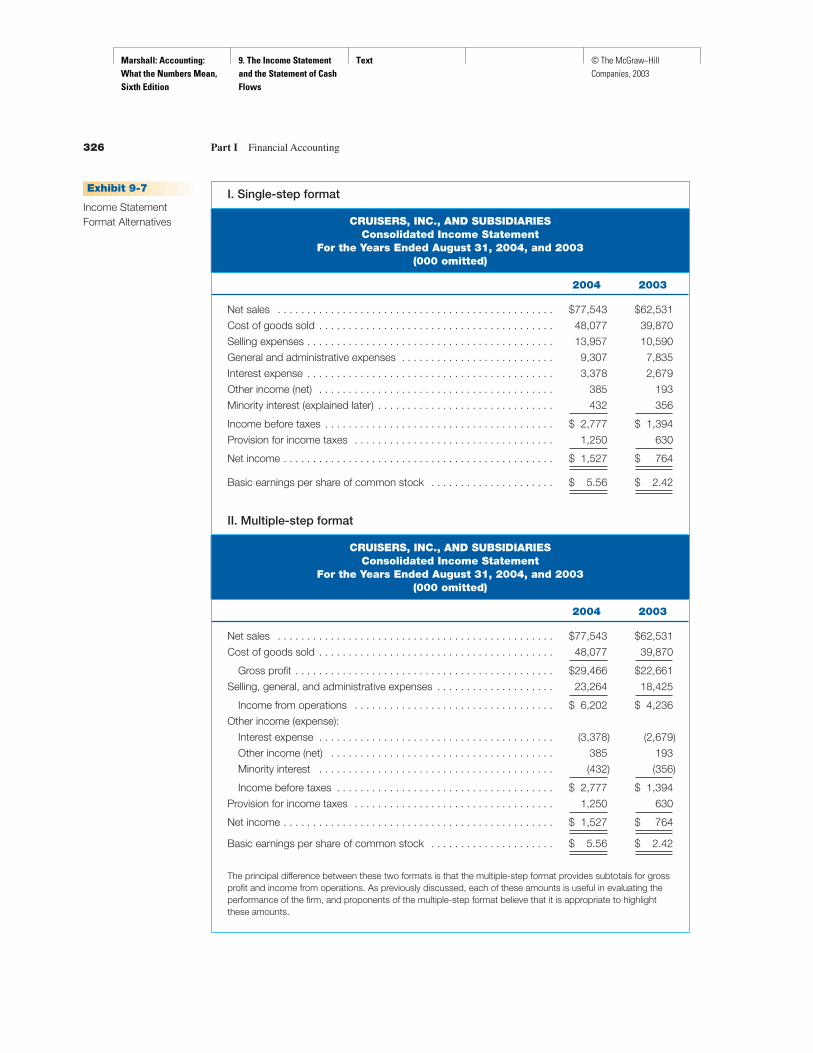
Income Statement Presentation Alternatives
There are two principal alternative presentations of income statement data: the single-step format and the multiple-step format. These are illustrated in Exhibit 9-7, usinghypothetical data for Cruisers, Inc., for fiscal years 2003 and 2004. (Examples of theunusual items that may appear on the income statement will be discussed in the nextsection of this chapter and illustrated in Exhibit 9-8.)
You may notice an inconsistency in the use of parentheses in the single-step andmultiple-step formats in Exhibit 9-7. No parentheses are used in the single-step format;the user is expected to know by reading the captions which items to add and which tosubtract in the calculation of net income. In the multiple-step format the caption for“Other income (expense)” indicates that in this section of the statement, items withoutparentheses are added and items in parentheses are subtracted. In other parts of thestatement the caption indicates the arithmetic operation. With either format, the state-ment reader must be alert to make sense of the information presented in the statement.
The recent trend has been for more companies to use the multiple-step incomestatement format. A survey of the year 2000 annual reports of 600 publicly owned in-dustrial and merchandising companies indicated that only 134 companies continued touse the single-step format (as compared to 232 companies in the 1989 survey, and 314in 1983).3 This trend apparently reflects the increasing complexity of business activi-ties and the demand for more detailed information.
Unusual Items Sometimes Seen on an Income Statement
One of the ways that investors and potential investors use the income statement is topredict probable results of future operations from the results of current operations.Nonrecurring transactions that have an effect on the predictive process are highlightedand reported separately from the results of recurring transactions. The reporting of un-usual items also facilitates users’ comparisons of net income for the current year withthat of prior years. Two of the more frequently encountered unusual items relate to dis-continued operations and extraordinary items. Other captions sometimes seen on an in-come statement relate to the cumulative effect of a change in the application of an
Chapter 9 The Income Statement and the Statement of Cash Flows 325
QWhat DoesIt Mean?
3. What does it mean when earnings per share are subject to dilution?
OBJECTIVE 7
Understand the
alternative income
statement presentation
models.
3 AICPA, Accounting Trends and Techniques (New York, 2001, 1990, and 1984), Table 3–2.
OBJECTIVE 8
Understand the
meaning and
significance of each of
the unusual items that
may appear on the
income statement.
Marshall: Accounting: What the Numbers Mean, Sixth Edition
9. The Income Statement and the Statement of Cash Flows
Text © The McGraw−Hill Companies, 2003
326 Part I Financial Accounting
Exhibit 9-7
Income StatementFormat Alternatives
I. Single-step format
CRUISERS, INC., AND SUBSIDIARIESConsolidated Income Statement
For the Years Ended August 31, 2004, and 2003(000 omitted)
2004 2003
Net sales . . . . . . . . . . . . . . . . . . . . . . . . . . . . . . . . . . . . . . . . . . . . . . . $77,543 $62,531
Cost of goods sold . . . . . . . . . . . . . . . . . . . . . . . . . . . . . . . . . . . . . . . . 48,077 39,870
Selling expenses . . . . . . . . . . . . . . . . . . . . . . . . . . . . . . . . . . . . . . . . . . 13,957 10,590
General and administrative expenses . . . . . . . . . . . . . . . . . . . . . . . . . . 9,307 7,835
Interest expense . . . . . . . . . . . . . . . . . . . . . . . . . . . . . . . . . . . . . . . . . . 3,378 2,679
Other income (net) . . . . . . . . . . . . . . . . . . . . . . . . . . . . . . . . . . . . . . . . 385 193
Minority interest (explained later) . . . . . . . . . . . . . . . . . . . . . . . . . . . . . . 432 356
Income before taxes . . . . . . . . . . . . . . . . . . . . . . . . . . . . . . . . . . . . . . . $ 2,777 $ 1,394
Provision for income taxes . . . . . . . . . . . . . . . . . . . . . . . . . . . . . . . . . . 1,250 630
Net income . . . . . . . . . . . . . . . . . . . . . . . . . . . . . . . . . . . . . . . . . . . . . . $ 1,527 $ 764
Basic earnings per share of common stock . . . . . . . . . . . . . . . . . . . . . $ 5.56 $ 2.42
II. Multiple-step format
CRUISERS, INC., AND SUBSIDIARIESConsolidated Income Statement
For the Years Ended August 31, 2004, and 2003(000 omitted)
2004 2003
Net sales . . . . . . . . . . . . . . . . . . . . . . . . . . . . . . . . . . . . . . . . . . . . . . . $77,543 $62,531
Cost of goods sold . . . . . . . . . . . . . . . . . . . . . . . . . . . . . . . . . . . . . . . . 48,077 39,870
Gross profit . . . . . . . . . . . . . . . . . . . . . . . . . . . . . . . . . . . . . . . . . . . . $29,466 $22,661
Selling, general, and administrative expenses . . . . . . . . . . . . . . . . . . . . 23,264 18,425
Income from operations . . . . . . . . . . . . . . . . . . . . . . . . . . . . . . . . . . $ 6,202 $ 4,236
Other income (expense):
Interest expense . . . . . . . . . . . . . . . . . . . . . . . . . . . . . . . . . . . . . . . . (3,378) (2,679)
Other income (net) . . . . . . . . . . . . . . . . . . . . . . . . . . . . . . . . . . . . . . 385 193
Minority interest . . . . . . . . . . . . . . . . . . . . . . . . . . . . . . . . . . . . . . . . (432) (356)
Income before taxes . . . . . . . . . . . . . . . . . . . . . . . . . . . . . . . . . . . . . $ 2,777 $ 1,394
Provision for income taxes . . . . . . . . . . . . . . . . . . . . . . . . . . . . . . . . . . 1,250 630
Net income . . . . . . . . . . . . . . . . . . . . . . . . . . . . . . . . . . . . . . . . . . . . . . $ 1,527 $ 764
Basic earnings per share of common stock . . . . . . . . . . . . . . . . . . . . . $ 5.56 $ 2.42
The principal difference between these two formats is that the multiple-step format provides subtotals for grossprofit and income from operations. As previously discussed, each of these amounts is useful in evaluating theperformance of the firm, and proponents of the multiple-step format believe that it is appropriate to highlightthese amounts.

Marshall: Accounting: What the Numbers Mean, Sixth Edition
9. The Income Statement and the Statement of Cash Flows
Text © The McGraw−Hill Companies, 2003
accounting principle or to the earnings of subsidiaries. When any of these items affectincome tax expense, the amount disclosed in the income statement is the amount of theitem net of the income tax effect. Each of these unusual items is discussed in the fol-lowing paragraphs.
Discontinued Operations. When a segment, or major portion of a business, is dis-posed of, it is appropriate to disclose separately the impact that the discontinued oper-ation has had on the current operations of the firm. This separate disclosure is made tohelp users of the financial statements understand how future income statements maydiffer because the firm will be operating without the disposed business segment. Thisis accomplished by reporting the income or loss, after income taxes, of the discontin-ued operation separately after a subtotal amount labeled income from continuing op-erations. (Income from continuing operations is the income after income taxes ofcontinuing operations.) By reporting discontinued operations as a separate item, net oftaxes, all of the effects of the discontinued business segment are excluded from the rev-enues, expenses, gains, and losses of continuing operations. This presentation is illus-trated in Exhibit 9-8. Note that earnings per share data are also reported separately fordiscontinued operations. If Cruisers, Inc., had issued dilutive securities or stock op-tions, diluted EPS data would also have been reported.
Chapter 9 The Income Statement and the Statement of Cash Flows 327
Exhibit 9-8
Income StatementPresentation of UnusualItems (continued fromExhibit 9-7)
Under either the single-step or multiple-step format (see Exhibit 9-7), the “Incomebefore taxes” caption would be shown as “Income from continuing operations beforetaxes,” and the rest of the income statement would appear as follows:
2004 2003
Income from continuing operations before taxes . . . . . . . . . . . . . . . . . . . $2,777 $1,394
Provision for income taxes . . . . . . . . . . . . . . . . . . . . . . . . . . . . . . . . . . . . 1,250 630
Income from continuing operations . . . . . . . . . . . . . . . . . . . . . . . . . . . . . $1,527 $ 764
Discontinued operations, net of income taxes:
Loss from operations . . . . . . . . . . . . . . . . . . . . . . . . . . . . . . . . . . . . . . (162) —
Loss on disposal . . . . . . . . . . . . . . . . . . . . . . . . . . . . . . . . . . . . . . . . . (79) —
Loss from discontinued operations . . . . . . . . . . . . . . . . . . . . . . . . . . . . . $ (241) —
Earnings before extraordinary item . . . . . . . . . . . . . . . . . . . . . . . . . . . . . . $1,286 $ 764
Extraordinary item:
Gain on termination of pension plan, net of income taxes . . . . . . . . . . . . . . . . . . . . . . . . . . . . . . . . . . . . . . . . . . 357 —
Net income . . . . . . . . . . . . . . . . . . . . . . . . . . . . . . . . . . . . . . . . . . . . . . . $1,643 $ 764
Basic earnings per share of common stock outstanding:
Continuing operations . . . . . . . . . . . . . . . . . . . . . . . . . . . . . . . . . . . . . $ 5.56 $ 2.42
Discontinued operations:
Loss from operations . . . . . . . . . . . . . . . . . . . . . . . . . . . . . . . . . . . . . . (.72) —
Loss on disposal . . . . . . . . . . . . . . . . . . . . . . . . . . . . . . . . . . . . . . . (.35) —
Extraordinary item . . . . . . . . . . . . . . . . . . . . . . . . . . . . . . . . . . . . . . . 1.59 —
Net income . . . . . . . . . . . . . . . . . . . . . . . . . . . . . . . . . . . . . . . . . . . . . $ 6.08 $ 2.42
Note: The cumulative effect of a change in accounting principle would appear after extraordinary items andwould be reported net of tax. EPS disclosure would also be required.

Marshall: Accounting: What the Numbers Mean, Sixth Edition
9. The Income Statement and the Statement of Cash Flows
Text © The McGraw−Hill Companies, 2003
Extraordinary Items. A transaction that is unusual in nature and occurs infrequentlyqualifies for reporting as an extraordinary item if the amount involved has a signifi-cant after-tax income statement effect. The reason for such separate reporting is to em-phasize that the item is extraordinary and that the income statements for subsequentyears are not likely to include this kind of item. Examples of extraordinary items aregains or losses from early repayment of long-term debt, pension plan terminations,some litigation settlements, and utilization of tax loss carryforwards.
When an extraordinary item is reported, basic and diluted (if applicable) earningsper share of common stock outstanding are reported for income before the extraordi-nary item, for the extraordinary item, and for net income (after the extraordinary item).This presentation is also illustrated in Exhibit 9-8 for basic EPS (it is assumed thatCruisers, Inc., has no dilutive securities or stock options).
Minority Interest in Earnings of Subsidiaries. As explained in Chapter 7, the fi-nancial statements of a subsidiary are consolidated with those of the parent eventhough the parent owns less than 100% of the stock of the subsidiary. The consoli-dated income statement includes all of the revenues, expenses, gains, and losses of thesubsidiary. However, only the parent company’s equity in the subsidiary’s earnings isincluded in consolidated net income. The minority share-owners’ equity in the sub-sidiary’s earnings is reported in the consolidated income statement as a deductionfrom income after income taxes when this minority interest is significant. When theminority interest in the earnings of the subsidiary is not significant, this deductionis included with other income and expense.
Cumulative Effect of a Change in Accounting Principle. A change from onegenerally accepted principle or method to another (from straight-line to accelerateddepreciation, for example) is permitted only if there has been a change promulgated bya standard-setting body (such as the FASB) or if the change can be justified by the en-tity based on its current economic circumstances. The cumulative effect of the changeon the reported net income of prior years, net of any income tax effect, is reported inthe income statement for the year of the change. This amount is reported at the bottomof the income statement, after income from continuing operations and any other un-usual items. Income statements of prior years that are presented for comparative pur-poses are not revised to reflect the change; however, the effect that the change wouldhave had on those years is disclosed in the explanatory notes to the financial statements(see Chapter 10). An exception to this procedure occurs for some changes mandated by
328 Part I Financial Accounting
Study
Suggestion
A wide variety of financial statement presentation alternatives for “unusual items” is encounteredin practice, depending on the specific combination of items reported by any given company. Donot attempt to memorize the language used in Exhibit 9-8 to describe these nonrecurringitems—instead, focus on the nature of each item and consider why it is reported after incomefrom operations.
QWhat DoesIt Mean?
4. What does it mean when income or loss from discontinued operations is shownin the income statement?

Marshall: Accounting: What the Numbers Mean, Sixth Edition
9. The Income Statement and the Statement of Cash Flows
Text © The McGraw−Hill Companies, 2003
the FASB, for which restatement of prior years’ financial statements is required. Inthese cases, the cumulative effect of the change is reflected in the beginning retainedearnings balance of the earliest year presented in the comparative financial statements.
Statement of Cash FlowsContent and Format of the Statement
The statement of cash flows is a relatively new financial statement that illustrates theway accounting evolves to meet the requirements of users of financial statements. Theimportance of understanding the cash flows of an entity has been increasingly empha-sized over the years. The accrual basis income statement is not designed to presentcash flows from operations and, except for related revenues and expenses, it shows noinformation about cash flows from investing and financing activities.
In the early 1960s, some companies began presenting information about changesin balance sheet items. In 1963 the Accounting Principles Board of the AICPA recom-mended that this statement be called the statement of source and application of funds.The term funds usually meant working capital (i.e., current assets minus current liabil-ities), and this statement explained the change in working capital that had occurred be-tween the dates of the balance sheets presented in the annual report. In 1971 theAccounting Principles Board made the statement mandatory and gave it the title“Statement of Changes in Financial Position.” In 1987 the FASB issued a standard re-quiring the presentation of a statement of cash flows, which replaced the statement ofchanges in financial position.
The primary purpose of the statement of cash flows is to provide relevant infor-mation about the cash receipts and cash payments of an enterprise during a period.4
The statement shows why cash (including short-term investments that are essentiallyequivalent to cash) changed during the period by reporting net cash provided or usedby operating activities, investing activities, and financing activities.
Cash Flows from Operating Activities. There are two alternative approaches topresenting the operating activities section of the statement of cash flows: the direct-method presentation and the indirect-method presentation. The direct method involveslisting each major class of cash receipts transactions and cash disbursements trans-actions for each of the three activity areas. The operating activity transactions includecash received from customers, cash paid to merchandise or raw material suppliers, cashpaid to employees for salaries and wages, cash paid for other operating expenses, cashpayments of interest, and cash payments for taxes. A direct-method statement ofcash flows is illustrated in Section I of Exhibit 9-9. Notice that under the direct method,each of the captions reported on the statement explains how much cash was received orpaid during the year for that item. For this reason, the FASB standard encourages en-terprises to use the direct method.
The indirect method explains cash flows from operating activities by explainingthe change in each of the noncash operating accounts in the balance sheet. A state-ment of cash flows prepared this way shows net income as the first source of operatingcash. However, net income is determined on the accrual basis and must be adjusted forrevenues and expenses that do not affect cash. The most significant noncash income
Chapter 9 The Income Statement and the Statement of Cash Flows 329
OBJECTIVE 9
Understand the purpose
and general format of
the statement of cash
flows.
OBJECTIVE 10
Understand the
difference between the
direct and indirect
methods of presenting
cash flows from
operating activities.
4 FASB, Statement of Financial Accounting Standards No. 95, “Statement of Cash Flows” (Stamford, CT,1987), para. 4. Copyright © by the Financial Accounting Standards Board, High Ridge Park, Stamford, CT06905, U.S.A. Quoted with permission. Copies of the complete document are available from the FASB.

Marshall: Accounting: What the Numbers Mean, Sixth Edition
9. The Income Statement and the Statement of Cash Flows
Text © The McGraw−Hill Companies, 2003
statement item is usually total depreciation and amortization expense. Effects of thesetransactions on the financial statements are:
The entries to record these items are:
Dr. Depreciation Expense . . . . . . . . . . . . . . . . . . . . . . . . . . . . . . xx
Cr. Accumulated Depreciation . . . . . . . . . . . . . . . . . . . . . . xx
Dr. Amortization Expense . . . . . . . . . . . . . . . . . . . . . . . . . . . . . . xx
Cr. Intangible Asset . . . . . . . . . . . . . . . . . . . . . . . . . . . . . . xx
Because the depreciation and amortization expense amounts do not affect cash, theseitems are added back to net income to determine more accurately the amount of cashgenerated from operations. Other income statement items that need to be considered ina similar way are:
• Income tax expense not currently payable (i.e., deferred income taxesresulting from temporary differences in the recognition of revenues andexpenses for book and tax purposes).
• Gains or losses on the sale or abandonment of assets. The proceeds from thesale, not the gain or loss, affect cash. Losses are added back to net income,and gains are subtracted from net income. The sale proceeds are reported asan investing activity, as described below.
• Increases (or decreases) to interest expense that result from the amortizationof discount (or premium) on bonds payable. Discount amortization is addedback to net income, and premium amortization is subtracted from net income.
Changes in the noncash operating accounts must also be shown. Thus increases incurrent assets and decreases in current liabilities are reported as operating uses of cash.Conversely, decreases in current assets and increases in current liabilities are reportedas operating sources of cash. An indirect-method statement of cash flows is illustratedin Section II of Exhibit 9-9.
Note that the difference between the two methods is in the presentation of cash flowsfrom operating activities. When the direct-method format is used, a separate schedulereconciling net income reported on the income statement with net cash provided byoperating activities is required. This reconciliation is in the form of the indirect-methodpresentation of net cash provided by operating activities. A survey of the annual reportsof 600 publicly owned merchandising and manufacturing companies for the year 2000indicated that 593 firms used the indirect-method presentation, while only 7 companies
330 Part I Financial Accounting
Assets � Liabilities � Owners’ equity ← Net income
Balance sheet Income statement
�� Revenues Expenses
Cash flows
� DepreciationExpense
NA� AccumulatedDepreciation
� IntangibleAsset
� AmortizationExpense
NA
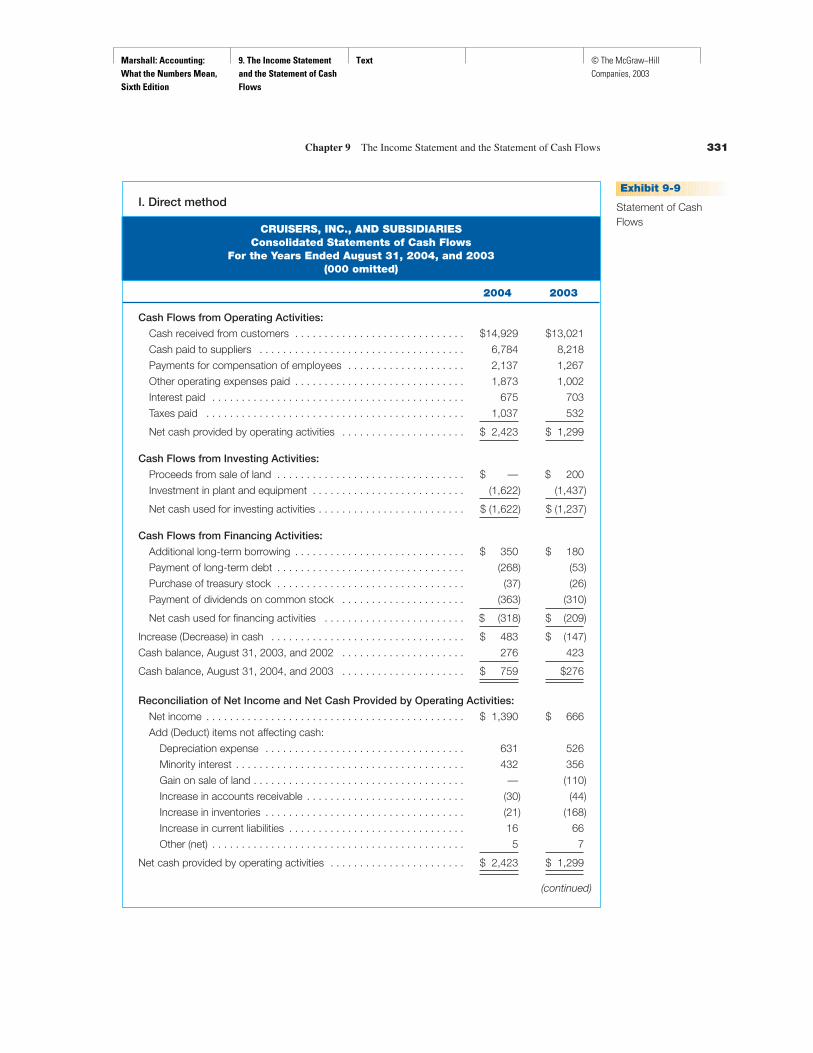
Marshall: Accounting: What the Numbers Mean, Sixth Edition
9. The Income Statement and the Statement of Cash Flows
Text © The McGraw−Hill Companies, 2003
Chapter 9 The Income Statement and the Statement of Cash Flows 331
Exhibit 9-9
Statement of CashFlows
I. Direct method
CRUISERS, INC., AND SUBSIDIARIESConsolidated Statements of Cash Flows
For the Years Ended August 31, 2004, and 2003(000 omitted)
2004 2003
Cash Flows from Operating Activities:
Cash received from customers . . . . . . . . . . . . . . . . . . . . . . . . . . . . . $14,929 $13,021
Cash paid to suppliers . . . . . . . . . . . . . . . . . . . . . . . . . . . . . . . . . . . 6,784 8,218
Payments for compensation of employees . . . . . . . . . . . . . . . . . . . . 2,137 1,267
Other operating expenses paid . . . . . . . . . . . . . . . . . . . . . . . . . . . . . 1,873 1,002
Interest paid . . . . . . . . . . . . . . . . . . . . . . . . . . . . . . . . . . . . . . . . . . . 675 703
Taxes paid . . . . . . . . . . . . . . . . . . . . . . . . . . . . . . . . . . . . . . . . . . . . 1,037 532
Net cash provided by operating activities . . . . . . . . . . . . . . . . . . . . . $ 2,423 $ 1,299
Cash Flows from Investing Activities:
Proceeds from sale of land . . . . . . . . . . . . . . . . . . . . . . . . . . . . . . . . $ — $ 200
Investment in plant and equipment . . . . . . . . . . . . . . . . . . . . . . . . . . (1,622) (1,437)
Net cash used for investing activities . . . . . . . . . . . . . . . . . . . . . . . . . $ (1,622) $ (1,237)
Cash Flows from Financing Activities:
Additional long-term borrowing . . . . . . . . . . . . . . . . . . . . . . . . . . . . . $ 350 $ 180
Payment of long-term debt . . . . . . . . . . . . . . . . . . . . . . . . . . . . . . . . (268) (53)
Purchase of treasury stock . . . . . . . . . . . . . . . . . . . . . . . . . . . . . . . . (37) (26)
Payment of dividends on common stock . . . . . . . . . . . . . . . . . . . . . (363) (310)
Net cash used for financing activities . . . . . . . . . . . . . . . . . . . . . . . . $ (318) $ (209)
Increase (Decrease) in cash . . . . . . . . . . . . . . . . . . . . . . . . . . . . . . . . . $ 483 $ (147)
Cash balance, August 31, 2003, and 2002 . . . . . . . . . . . . . . . . . . . . . 276 423
Cash balance, August 31, 2004, and 2003 . . . . . . . . . . . . . . . . . . . . . $ 759 $276
Reconciliation of Net Income and Net Cash Provided by Operating Activities:
Net income . . . . . . . . . . . . . . . . . . . . . . . . . . . . . . . . . . . . . . . . . . . . $ 1,390 $ 666
Add (Deduct) items not affecting cash:
Depreciation expense . . . . . . . . . . . . . . . . . . . . . . . . . . . . . . . . . . 631 526
Minority interest . . . . . . . . . . . . . . . . . . . . . . . . . . . . . . . . . . . . . . . 432 356
Gain on sale of land . . . . . . . . . . . . . . . . . . . . . . . . . . . . . . . . . . . . — (110)
Increase in accounts receivable . . . . . . . . . . . . . . . . . . . . . . . . . . . (30) (44)
Increase in inventories . . . . . . . . . . . . . . . . . . . . . . . . . . . . . . . . . . (21) (168)
Increase in current liabilities . . . . . . . . . . . . . . . . . . . . . . . . . . . . . . 16 66
Other (net) . . . . . . . . . . . . . . . . . . . . . . . . . . . . . . . . . . . . . . . . . . . 5 7
Net cash provided by operating activities . . . . . . . . . . . . . . . . . . . . . . . $ 2,423 $ 1,299
(continued)

Marshall: Accounting: What the Numbers Mean, Sixth Edition
9. The Income Statement and the Statement of Cash Flows
Text © The McGraw−Hill Companies, 2003
used the direct-method presentation.5 Business in Practice—Understanding Cash FlowRelationships—Indirect Method explains the cash flow relationships under the indirectmethod in more detail.
Cash Flows from Investing and Financing Activities. Investing activities relateprimarily to the purchase and sale of noncurrent assets. Cash is often used for the ac-quisition of assets such as land, buildings, or equipment during the year (these invest-ments are sometimes called capital additions). Investments in debt or equity securitiesof other entities are also shown as investing uses. Likewise, cash received from the saleof noncurrent assets is shown as an investing source of cash.
Financing activities relate primarily to changes during the year in noncurrent lia-bilities (such as bonds payable) and in owners’ equity accounts. Thus, the issuance of
332 Part I Financial Accounting
Exhibit 9-9
(concluded)II. Indirect method
CRUISERS, INC., AND SUBSIDIARIESConsolidated Statements of Cash Flows
For the Years Ended August 31, 2004, and 2003(000 omitted)
2004 2003
Cash Flows from Operating Activities:
Net income . . . . . . . . . . . . . . . . . . . . . . . . . . . . . . . . . . . . . . . . . . . . $ 1,390 $ 666
Add (Deduct) items not affecting cash:
Depreciation expense . . . . . . . . . . . . . . . . . . . . . . . . . . . . . . . . . . 631 526
Minority interest . . . . . . . . . . . . . . . . . . . . . . . . . . . . . . . . . . . . . . . 432 356
Gain on sale of land . . . . . . . . . . . . . . . . . . . . . . . . . . . . . . . . . . . . — (110)
Increase in accounts receivable . . . . . . . . . . . . . . . . . . . . . . . . . . . (30) (44)
Increase in inventories . . . . . . . . . . . . . . . . . . . . . . . . . . . . . . . . . . (21) (168)
Increase in current liabilities . . . . . . . . . . . . . . . . . . . . . . . . . . . . . . 16 66
Other (net) . . . . . . . . . . . . . . . . . . . . . . . . . . . . . . . . . . . . . . . . . . . 5 7
Net cash provided by operating activities . . . . . . . . . . . . . . . . . . . . . . . $ 2,423 $ 1,299
Cash Flows from Investing Activities:
Proceeds from sale of land . . . . . . . . . . . . . . . . . . . . . . . . . . . . . . . . $ — $ 200
Investment in plant and equipment . . . . . . . . . . . . . . . . . . . . . . . . . . (1,622) (1,437)
Net cash used for investing activities . . . . . . . . . . . . . . . . . . . . . . . . . $(1,622) $(1,237)
Cash Flows from Financing Activities:
Additional long-term borrowing . . . . . . . . . . . . . . . . . . . . . . . . . . . . . $ 350 $ 180
Payment of long-term debt . . . . . . . . . . . . . . . . . . . . . . . . . . . . . . . . (268) (53)
Purchase of treasury stock . . . . . . . . . . . . . . . . . . . . . . . . . . . . . . . . (37) (26)
Payment of dividends on common stock . . . . . . . . . . . . . . . . . . . . . (363) (310)
Net cash used for financing activities . . . . . . . . . . . . . . . . . . . . . . . . $ (318) $ (209)
Increase (Decrease) in cash . . . . . . . . . . . . . . . . . . . . . . . . . . . . . . . . . $ 483 $ (147)
Cash balance, August 31, 2003, and 2002 . . . . . . . . . . . . . . . . . . . . . 276 423
Cash balance, August 31, 2004, and 2003 . . . . . . . . . . . . . . . . . . . . . $ 759 $ 276
5 AICPA, Accounting Trends and Techniques (New York, 2001), Table 6–3.
Marshall: Accounting: What the Numbers Mean, Sixth Edition
9. The Income Statement and the Statement of Cash Flows
Text © The McGraw−Hill Companies, 2003
bonds or common stock will result in a financing source of cash, and the retirement ofbonds will be reported as a financing use. Cash dividends and treasury stock transac-tions also are reported as financing activities because they affect owners’ equity.
Interpreting the Statement of Cash Flows
The statement of cash flows focuses on cash receipts and cash payments during the pe-riod, so the first question to be answered is: “Did the company’s cash balance increaseor decrease during the year?” The answer is usually found near the bottom of the state-ment. In the annual report of a publicly owned corporation, comparative statements forthe most recent and prior two years will be presented, and the change in each of theyears can be noted. If the change in the cash balance during a year has been significant(more than 10% of the beginning cash balance), the financial statement user will try tounderstand the reasons for the change by focusing on the relative totals of each of thethree categories of cash flows—operating activities, investing activities, and financingactivities. Even if the change in the cash balance during a year is not significant, the re-lationship between these broad categories will be observed.
A firm should have a positive cash flow provided by operating activities. If oper-ating activities do not generate cash, the firm will have to seek outside funding to fi-nance its day-to-day activities, as well as its investment requirements. Althoughnegative cash flow from operating activities might apply to a firm just starting up, itwould be a sign of possible financial weakness for a mature company.
Virtually all financially healthy firms have growth in revenues as a financial ob-jective. This growth usually requires increasing capacity to manufacture or sell prod-ucts or provide services. Thus, a principal investing activity is the acquisition of plantand equipment. The total cash used for investing activities is compared to the total cashprovided by operating activities. If cash provided by operating activities exceeds cashused for investing activities, the indication is that the firm is generating the cash itneeds to finance its growth, and that is probably positive. If the cash used for investingactivities exceeds the cash provided by operating activities, the difference will have tobe provided by financing activities or come from the cash balance carried forwardfrom the prior year. This is not necessarily negative because investment requirementsin any one year may be unusually high. If, however, cash used for investing activitiesexceeds cash provided by operating activities year after year, and the difference is pro-vided from financing activities, a question about the firm’s ability to generate addi-tional funds from financing activities must be raised.
Financing activities include the issue and repayment of debt, the sale of stock andpurchase of treasury stock, and the payment of dividends on stock (although somecompanies report cash dividends separately in the reconciliation of beginning and end-ing cash). For most companies, it would be desirable to have the cash dividend coveredby the excess of cash provided from operating activities over cash used for investingactivities.
After the big picture of the entity’s cash flows has been obtained, it may be neces-sary to look at the details of each category of cash flows for clues that will explain theoverall change. For example, if cash flows provided by operating activities are lessthan cash used for investing activities or if operating cash flows are decreasing eventhough profits are increasing, it may be that accounts receivable and/or inventories areincreasing at a higher rate than sales. This is a signal that the firm may have liquidityproblems that would not necessarily be reflected by the change in working capital, thecurrent ratio, or the acid-test ratio. These liquidity measures include other items
Chapter 9 The Income Statement and the Statement of Cash Flows 333
OBJECTIVE 11
Understand why the
statement of cash flows
is significant to financial
analysts and investors.

Marshall: Accounting: What the Numbers Mean, Sixth Edition
9. The Income Statement and the Statement of Cash Flows
Text © The McGraw−Hill Companies, 2003
besides cash, and the firm’s inability to collect its accounts receivable and/or sell its in-ventory may artificially increase current assets and distort these relationships. Ofcourse, other interpretations of this same trend might also be possible, but the trend it-self might not have been observed without a careful analysis of cash flow data.
The details of an entity’s investing activities frequently describe its growth strat-egy. Besides investing in more plant and equipment, some firms acquire capacity bypurchasing other companies or by investing in the securities of other companies. Oc-casionally a firm will sell some of its plant and equipment, in which case cash is pro-vided. The reasons for and consequences of such a sale of assets are of interest to thefinancial statement user.
To illustrate these interpretation techniques, refer to Intel’s Consolidated State-ments of Cash Flows on page 22 in the annual report in the Appendix. Note that a largeadd-back is made to net income each year for depreciation since no out-of-pocket costsare incurred for this expense. Note also that the net cash provided by operating activi-ties exceeded net income in all three years. Net cash provided by operating activitiesalso exceeded the cash used for investing activities in all three years—a relationshipgenerally considered desirable. Intel invested considerable amounts in property, plant,and equipment each year, and its purchases of available-for-sale investments were
334 Part I Financial Accounting
Business in
Practice
Understanding Cash Flow Relationships—Indirect Method
As indicated by the AICPA study, most firms report the statement of cash flows using the indirectmethod. Most statements of changes in financial position prepared prior to 1988 also used theindirect method. The primary reason for this preference is that no separate accounting proce-dures are needed for companies to accumulate cash flow data when the indirect method is used.The statement of cash flows normally is prepared using balance sheet and income statementdata and other information readily available in the company’s accounting records. However, theoperating activities information reported under the direct method is not so readily determinable,and the cost of generating this information can be prohibitive.
The primary objective of the operating activities section of the statement of cash flows (indirectmethod) is to determine the net cash provided by operating activities. Although net income is de-termined on an accrual basis, it is ordinarily the most accurate proxy for operating cash flows andthus serves as the starting point in the calculation of this important amount. Note, however, thatnone of the adjustments shown in the operating activities section (indirect method) explain howmuch cash was actually received or paid during the year! The only operating activity items that con-vey independent meaning are the amounts shown for net income and net cash provided by oper-ating activities. Review the operating activities section of Exhibit 9-9 for the indirect method. Notice,for example, that accounts receivable increased during both years presented. Does this explainhow much cash was received from the collection of accounts receivable during these years? (No,but the direct method shows these amounts.) Once you understand this, the adjustment processfor the indirect method can be thought of in a rather mechanical fashion.
Net income is initially assumed to generate operating cash, and this assumption is then ad-justed for the effects of noncash (or nonoperating) income statement items. As already explained,the amounts shown for depreciation and amortization expense will be added back to net incomeeach year because cash is never paid for these expenses. Similar adjustments would be madeto remove the effects of noncash revenues or to remove the effects of most nonoperating trans-actions included in net income. Once these income statement adjustments are made, the cur-rent (i.e., operating) accounts on the balance sheet must be analyzed to determine their effectson cash during the year. To simplify the analysis, assume that all changes in account balancesfrom the beginning to the end of the year are attributable to cash transactions. If inventory (a cur-rent asset) increased during the year, then cash must have decreased (to pay for the increase ininventory). The financial statement effect of this assumed transaction would be:
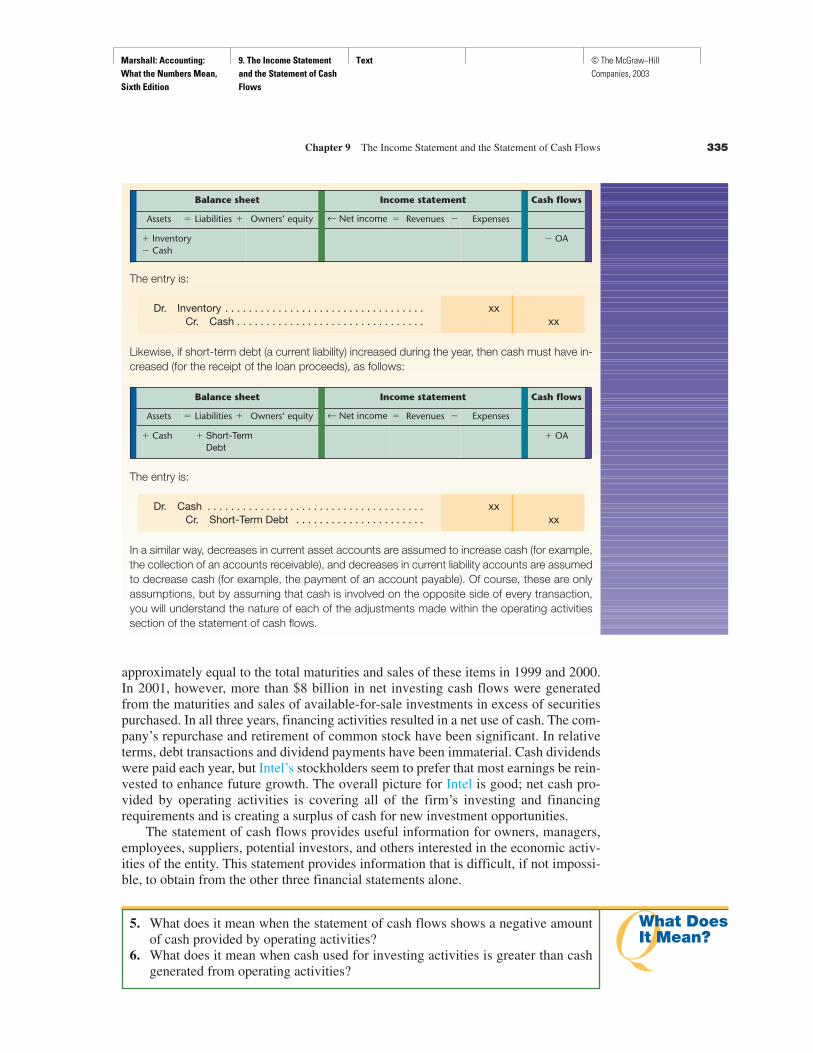
Marshall: Accounting: What the Numbers Mean, Sixth Edition
9. The Income Statement and the Statement of Cash Flows
Text © The McGraw−Hill Companies, 2003
approximately equal to the total maturities and sales of these items in 1999 and 2000.In 2001, however, more than $8 billion in net investing cash flows were generatedfrom the maturities and sales of available-for-sale investments in excess of securitiespurchased. In all three years, financing activities resulted in a net use of cash. The com-pany’s repurchase and retirement of common stock have been significant. In relativeterms, debt transactions and dividend payments have been immaterial. Cash dividendswere paid each year, but Intel’s stockholders seem to prefer that most earnings be rein-vested to enhance future growth. The overall picture for Intel is good; net cash pro-vided by operating activities is covering all of the firm’s investing and financingrequirements and is creating a surplus of cash for new investment opportunities.
The statement of cash flows provides useful information for owners, managers,employees, suppliers, potential investors, and others interested in the economic activ-ities of the entity. This statement provides information that is difficult, if not impossi-ble, to obtain from the other three financial statements alone.
Chapter 9 The Income Statement and the Statement of Cash Flows 335
Assets � Liabilities � Owners’ equity � Revenues �← Net income Expenses
Balance sheet Income statement Cash flows
� Inventory� Cash
� OA
The entry is:
Dr. Inventory . . . . . . . . . . . . . . . . . . . . . . . . . . . . . . . . . . xxCr. Cash . . . . . . . . . . . . . . . . . . . . . . . . . . . . . . . . xx
Likewise, if short-term debt (a current liability) increased during the year, then cash must have in-creased (for the receipt of the loan proceeds), as follows:
The entry is:
Dr. Cash . . . . . . . . . . . . . . . . . . . . . . . . . . . . . . . . . . . . . xxCr. Short-Term Debt . . . . . . . . . . . . . . . . . . . . . . xx
In a similar way, decreases in current asset accounts are assumed to increase cash (for example,the collection of an accounts receivable), and decreases in current liability accounts are assumedto decrease cash (for example, the payment of an account payable). Of course, these are onlyassumptions, but by assuming that cash is involved on the opposite side of every transaction,you will understand the nature of each of the adjustments made within the operating activitiessection of the statement of cash flows.
Assets � Liabilities � Owners’ equity � Revenues �← Net income Expenses
Balance sheet Income statement Cash flows
� Cash � Short-TermDebt
� OA
QWhat DoesIt Mean?
5. What does it mean when the statement of cash flows shows a negative amountof cash provided by operating activities?
6. What does it mean when cash used for investing activities is greater than cashgenerated from operating activities?

Marshall: Accounting: What the Numbers Mean, Sixth Edition
9. The Income Statement and the Statement of Cash Flows
Text © The McGraw−Hill Companies, 2003
Demonstration ProblemVisit the text website at www.mhhe.com/marshall6e to view aDemonstration Problem for this chapter.
SummaryThis chapter has described the income statement and the statement of cash flows. Theincome statement summarizes the results of the firm’s profit-generating or loss-gener-ating activities for a fiscal period. The statement of cash flows explains the change inthe firm’s cash from the beginning to the end of the fiscal period by summarizing thecash effects of the firm’s operating, investing, and financing activities during the period.
Revenues are reported at the beginning of the income statement. Revenues resultfrom the sale of a product or the provision of a service, not necessarily from the receiptof cash. The revenues of most manufacturing and merchandising firms are called sales.Net sales, which is gross sales minus sales returns and allowances and cash discounts,is usually the first caption of the income statement. Service entities will describe thesource of their revenues (e.g., rental fees or consulting fees).
Expenses are subtracted from revenues in the income statement. A significant ex-pense for many firms is cost of goods sold. The actual calculation of cost of goods soldis determined by the system used to account for inventories. With a perpetual inventorysystem, cost can be determined and recognized when a product is sold. With a periodicinventory system, cost of goods sold is calculated at the end of the fiscal period usingbeginning and ending inventory amounts, and the purchases (or cost of goods manu-factured) amount. Sometimes cost of goods sold is reported separately and subtractedfrom net sales to arrive at gross profit or gross margin in what is called a multiple-stepincome statement presentation. Other firms will include cost of goods sold with oper-ating expenses in a single-step income statement presentation.
Gross profit (or gross margin) is frequently expressed as a ratio. The gross profitratio can be used to monitor profitability, set selling prices, and estimate ending inven-tory and cost of goods sold.
Selling, general, and administrative expenses are the costs of operating the firm.They are deducted from gross profit to arrive at operating income, an important mea-sure of management performance.
Interest expense is usually shown as a separate item in the other income and ex-pense category of the income statement. Other significant gains or losses will also beidentified.
336 Part I Financial Accounting
Business on the
Internet
Recall that Lucent Technologies experienced severe cash flow problems during 1999 as a resultof having its inventory growth and receivables growth outpace sales growth. (Refer to BusinessIn Practice—Cash Flows versus Accrual Accounting on p. 47 in Chapter 2.) Using the search fa-cility at www.fool.com, locate, read, and outline for class discussion any subsequent Motley Foolarticles that refer to Lucent’s cash flow problems. Make notes of any points raised by these arti-cles that you do not understand, and ask your instructor for clarification.

Marshall: Accounting: What the Numbers Mean, Sixth Edition
9. The Income Statement and the Statement of Cash Flows
Text © The McGraw−Hill Companies, 2003
Income before income taxes is frequently reported as a subtotal before income taxexpense is shown, because taxes are a function of all items reported to this point in theincome statement.
Net income, or net earnings, is reported in total and on a per share of outstandingcommon stock basis. If there is potential dilution from convertible debt, convertiblepreferred stock, or stock options, diluted earnings per share will also be reported.
To facilitate users’ comparisons of net income with that of prior years, and to pro-vide a basis for future expectations, income or loss from discontinued operations andextraordinary items are reported separately in the income statement and on a per sharebasis.
The determination of cash flows from operating activities is essentially a conver-sion of the accrual accounting income statement to a cash basis income statement. Theprincipal reasons net income doesn’t affect cash directly are that not all accounts re-ceivable from sales are collected in the fiscal period of the sale and not all of the ex-penses reported in the income statement result in the disbursement of cash in the fiscalperiod in which the expenses are incurred.
Investing activities include purchases of plant and equipment, investments in othercompanies, and possibly the sale of noncurrent assets.
Financing activities include issuance and redemption of bonds and stock, includ-ing treasury stock transactions, and cash dividends on stock.
The statement of cash flows shows the change in cash during the year and reportscash provided from or used by operating activities, investing activities, and financingactivities.
There are two presentation formats for the statement of cash flows. The differencebetween the two is primarily in the presentation of cash flows from operating activi-ties. Most entities use the indirect method.
Interpretation of the statement of cash flows involves observing the relationshipbetween the three broad categories of cash flows (operating activities, investing activ-ities, and financing activities) and the change in the cash balance for the year. It is de-sirable to have cash provided from operating activities that is equal to or greater thancash used for investing activities, although large investment requirements in any oneyear may cause a reduction in the beginning-of-the-year cash balance. Cash can alsobe raised from financing activities to offset large investment requirements. The de-tailed activities of each cash flow category will be reviewed to assess their effect on theoverall cash position of the firm. The statement of cash flows provides important in-formation that is not easily obtained from the other financial statements.
Refer to the income statement and statement of cash flows for Intel Corporation inthe Appendix, and to these statements in other annual reports you may have, to observecontent and presentation alternatives.
Key Terms and Conceptsbasic earnings per share (p. 323) Net income available to common stockholders
divided by the weighted average number of shares of common stock outstandingduring the period.
cost of goods sold (p. 316) Cost of merchandise sold during the period; an expensededucted from net sales to arrive at gross profit.
cost of goods sold model (p. 317) The formula for calculating cost of goods soldby adding beginning inventory and purchases and subtracting ending inventory.
Chapter 9 The Income Statement and the Statement of Cash Flows 337

Marshall: Accounting: What the Numbers Mean, Sixth Edition
9. The Income Statement and the Statement of Cash Flows
Text © The McGraw−Hill Companies, 2003
diluted earnings per share (p. 323) An amount less than basic earnings per sharethat assumes that additional shares of common stock have been issued pursuant toconvertible debt, convertible preferred stock, and/or stock option plans.
dilution (p. 324) The reduction in “earnings per share of common stock” that mayoccur if convertible securities are actually converted to common stock and/or ifadditional shares of common stock are issued pursuant to a stock option plan.
earned (p. 312) A revenue recognition criterion that relates to completion of therevenue-generating activity.
expenses (p. 315) Outflows or other using up of assets or incurrences of liabilitiesduring a period from delivering or producing goods, rendering services, or carryingout other activities that constitute the entity’s major operations.
extraordinary item (p. 328) A gain or loss from a transaction that is both unusualin nature and occurs infrequently; it is reported separately in the income statement.
FOB destination (p. 315) The shipping term that means that title passes fromseller to buyer when the merchandise arrives at its destination.
FOB shipping point (p. 315) The shipping term that means that title passes fromseller to buyer when the merchandise leaves the seller’s premises.
freight collect (p. 315) A freight payment alternative meaning that freight is payablewhen the merchandise arrives at its destination.
freight prepaid (p. 315) A freight payment alternative meaning that freight is paidby the shipper.
gains (p. 315) Increases in net assets from incidental transactions and other eventsaffecting an entity during a period except those that result from revenues orinvestments by owners.
gross margin (p. 318) Another term for gross profit.gross margin ratio (p. 318) Another term for gross profit ratio.gross profit (p. 318) The difference between net sales and cost of goods sold.
Sometimes called gross margin.gross profit ratio (p. 318) The ratio of gross profit to net sales. Sometimes called
gross margin ratio.income before income taxes (p. 322) An income statement subtotal on which
income tax expense is based.income from continuing operations (p. 327) An income statement subtotal that is
presented before income or loss from discontinued operations.income from operations (p. 321) The difference between gross profit and
operating expenses. Also called operating income.inventory cost-flow assumption (p. 316) The application of FIFO, LIFO,
weighted-average, or specific identification procedures to determine the cost ofgoods sold.
inventory shrinkage (p. 316) Inventory losses resulting from theft, deterioration,and record-keeping errors.
losses (p. 316) Decreases in net assets from incidental transactions and other eventsaffecting an entity during a period except those that result from expenses ordistributions to owners.
matching principle (p. 315) The concept that expenses incurred in generatingrevenues should be “matched” against revenues earned during some period of time,usually one year, in determining net income or loss for the period.
338 Part I Financial Accounting

Marshall: Accounting: What the Numbers Mean, Sixth Edition
9. The Income Statement and the Statement of Cash Flows
Text © The McGraw−Hill Companies, 2003
ASolutions ToWhat Does
It Mean?
minority interest in earnings of subsidiary (p. 328) An income statement itemrepresenting the minority stockholders’ share of the earnings of a subsidiary thathave been included in the consolidated income statement.
multiple-step format (p. 325) An income statement format that includes subtotalsfor gross profit, operating income, and income before taxes.
net income (p. 323) The excess of revenues and gains over expenses and losses fora fiscal period.
net sales (p. 313) Gross sales, less sales discounts and sales returns andallowances.
operating expenses (p. 321) Expenses, other than cost of goods sold, incurred inthe day-to-day activities of the entity.
operating income (p. 321) The difference between gross profit and operatingexpenses. Also referred to as income from operations.
other income and expenses (p. 322) An income statement category that includesinterest expense, interest income, and gain or loss items not related to the principaloperating activities of the entity.
percentage-of-completion method (p. 314) A method of recognizing revenuebased on the completion percentage of a long-term construction project.
purchases returns and allowances (p. 318) Reductions in purchases fromproducts returned to the supplier or adjustments in the purchase cost.
realization (p. 312) A revenue recognition criterion that relates to the receipt ofcash or a claim to cash in exchange for the product or service.
revenues (p. 310) Inflows of cash or increases in other assets, or settlement ofliabilities, during a period from delivering or producing goods, rendering services,or performing other activities that constitute the entity’s major operations.
sales (p. 313) Revenues resulting from the sale of product.sales mix (p. 319) The proportion of total sales represented by various products or
categories of products.sales returns and allowances (p. 313) Reductions in sales from product returns or
adjustments in selling price.shipping terms (p. 315) The description of the point at which title passes from
seller to buyer.single-step format (p. 325) An income statement format that excludes subtotals
such as gross profit and operating income.statement of cash flows (p. 329) The financial statement that explains why cash
changed during a fiscal period. Cash flows from operating, investing, andfinancing activities are shown in the statement.
1. It means that although net income is not the literal bottom line on the income state-ment, many financial statement users consider it the most important amount on theincome statement.
2. It means that to have the “big picture” of the entity’s results, one must look at morethan the amounts opposite one or two captions. It is especially important to beaware of unusual items that may appear on the income statement.
Chapter 9 The Income Statement and the Statement of Cash Flows 339

Marshall: Accounting: What the Numbers Mean, Sixth Edition
9. The Income Statement and the Statement of Cash Flows
Text © The McGraw−Hill Companies, 2003
3. It means that additional shares of common stock may be issued because of the ex-istence of convertible bonds, convertible preferred stock, or stock options. Is-suance of shares for these items could cause a reduction of earnings per share ofcommon stock and a reduction in the market value of the common stock.
4. It means that future income statements will not be affected by the results of thediscontinued operations and that by highlighting this item it should be possible fora financial statement user to make adjustments when anticipating future results forthe firm.
5. It means that the firm has not generated cash from its operations—a situation thatshould not exist for long. In order to keep operating, the firm will need to havegenerated cash from investing or financing activities and/or used cash on hand atthe beginning of the reporting period.
6. It means that during the year, the firm may have made some significant invest-ments financed by creditors or owners and/or used cash on hand at the beginningof the reporting period.
Self-Study QuizVisit the text website at www.mhhe.com/marshall6e to take a self-studyquiz for this chapter.
ExercisesCalculate earned revenues. Big Blue University has a fiscal year that ends on June30. The 2004 summer session of the university runs from June 9 through July 28. To-tal tuition paid by students for the summer session amounted to $112,000.
Required:
a. How much revenue should be reflected in the fiscal year ended June 30,2004? Explain your answer.
b. Would your answer to a be any different if the university had a tuition refundpolicy that stated that no tuition would be refunded after the end of the thirdweek of summer session classes? Explain your answer.
Calculate earned revenues. Kirkland Theater sells season tickets for six events at aprice of $84. In pricing the tickets, the planners assigned the leadoff event a value of$20 because the program was an expensive symphony orchestra. The last five eventswere priced equally; 1,200 season tickets were sold for the 2004 season.
Required:
a. Calculate the theater’s earned revenue after the first three events have beenpresented.
b. About 95% of the season ticket holders attended the first event. Subsequentevents were attended by about 80% of the season ticket holders. To whatextent, if any, should the attendance data impact revenue recognition?Explain your answer.
340 Part I Financial Accounting
E9.1.LO 1
E9.2.LO 1

Marshall: Accounting: What the Numbers Mean, Sixth Edition
9. The Income Statement and the Statement of Cash Flows
Text © The McGraw−Hill Companies, 2003
Effects of inventory error. If the ending inventory of a firm is overstated by $50,000,by how much and in what direction (overstated or understated) will the firm’s operat-ing income be misstated? (Hint: Use the cost of goods sold model, enter hypothetically“correct” data, and then reflect the effects of the ending inventory error and determinethe effect on cost of goods sold.)
Effects of inventory error. Assume that the ending inventory of a merchandisingfirm is overstated by $40,000.
Required:
a. By how much and in what direction (overstated or understated) will thefirm’s cost of goods sold be misstated?
b. If this error is not corrected, what effect will it have on the subsequentperiod’s operating income?
c. If this error is not corrected, what effect will it have on the total operatingincome of the two periods (i.e., the period in which there is an error and thesubsequent period) combined?
Calculate gross profit ratio and cost of goods sold. Refer to the consolidated state-ments of income on page 20 of the Intel Corporation Annual Report in the Appendix.
a. Calculate the gross profit ratio for each of the past three years.b. Assume that Intel’s net revenues for the first four months of 2002 totaled
$12.6 billion. Calculate an estimated cost of goods sold and gross profit forthe four months.
Calculate gross profit, cost of goods sold, and selling price. MBI, Inc., had sales of$37.9 million for fiscal 2004. The company’s gross profit ratio for that year was 22.6%.
Required:
a. Calculate the gross profit and cost of goods sold for MBI, Inc., for fiscal2004.
b. Assume that a new product is developed, and that it will cost $485 tomanufacture. Calculate the selling price that must be set for this new productif its gross profit ratio is to be the same as the average achieved for allproducts for fiscal 2004.
c. From a management viewpoint, what would you do with this information?
Operating income versus net income. If you were interested in evaluating theprofitability of a company and could have only limited historical data, would youprefer to know operating income or net income for the past five years? Explain youranswer.
Operating income versus net income. Refer to the Ten-Year Financial Summary onpage 12 of the Intel Corporation Annual Report in the Appendix.
Required:Compare the trend of the operating income data with the trend of net income data from1997 through 2001. Which series of data is more meaningful? Explain your answer.
Chapter 9 The Income Statement and the Statement of Cash Flows 341
E9.3.LO 2
E9.4.LO 2
E9.5.LO 2, 3
E9.6.LO 2, 3
E9.7.LO 5
E9.8.LO 5

Marshall: Accounting: What the Numbers Mean, Sixth Edition
9. The Income Statement and the Statement of Cash Flows
Text © The McGraw−Hill Companies, 2003
Calculate basic EPS. Ringemup, Inc., had net income of $473,400 for its fiscal yearended October 31, 2004. During the year the company had outstanding 38,000 sharesof $4.50, $50 par value preferred stock, and 105,000 shares of common stock.
Required:Calculate the basic earnings per share of common stock for fiscal 2004.
Calculate basic EPS, and explain the EPS effect of convertible preferred. ThriftyCo. reported net income of $745,000 for its fiscal year ended January 31, 2004. At thebeginning of that fiscal year, 240,000 shares of common stock were outstanding. OnOctober 31, 2003, an additional 40,000 shares were issued. No other changes in com-mon shares outstanding occurred during the year. During the year the company paidthe annual dividend on the 30,000 shares of 5%, $40 par value preferred stock thatwere also outstanding the entire year.
Required:
a. Calculate basic earnings per share of common stock for the year endedJanuary 31, 2004.
b. If Thrifty Co.’s preferred stock was convertible into common stock, whatadditional calculation would be required?
Accrual to cash flows. For each of the items below, calculate the cash sources or cashuses that should be recognized on the statement of cash flows for Baldin Co. for theyear ended December 31, 2004.
a. Sales on account (all are collectible) amounted to $760,000, and accountsreceivable decreased by $24,000. How much cash was collected fromcustomers?
b. Income tax expense for the year was $148,000, and income taxes payabledecreased by $34,000. How much cash was paid for income taxes?
c. Cost of goods sold amounted to $408,000, accounts payable increased by$19,000, and inventories increased by $14,000. How much cash was paid tosuppliers?
d. The net book value of buildings increased by $240,000. No buildings weresold, and depreciation expense for the year was $190,000. How much cashwas paid to purchase buildings?
Cash flows to accrual. For each of the items below, calculate the amount of revenueor expense that should be recognized on the income statement for Pilkey Co. for theyear ended December 31, 2004.
a. Cash collected from customers during the year amounted to $812,000, andaccounts receivable increased by $45,000. How much were sales on accountfor the year ended December 31, 2004?
b. Cash payments for income taxes during the year were $210,000, and incometaxes payable increased by $41,000. How much was income tax expense?
c. Cash paid to suppliers during the year amounted to $678,000, accountspayable decreased by $32,000, and inventories decreased by $14,000. Howmuch was cost of goods sold?
d. The net book value of buildings increased by $150,000. No buildings weresold, and a new building costing $270,000 was purchased during the year.How much was depreciation expense?
342 Part I Financial Accounting
E9.9.LO 7
E9.10.LO 7
E9.11.LO 10
E9.12.LO 10

Marshall: Accounting: What the Numbers Mean, Sixth Edition
9. The Income Statement and the Statement of Cash Flows
Text © The McGraw−Hill Companies, 2003
Income statement format and EPS disclosures. Refer to the consolidated statementsof income on page 20 of the Intel Corporation Annual Report in the Appendix and an-swer the following questions:
a. Does Intel use the single-step format or the multiple-step format? Whichformat do you prefer? Explain your answer.
b. Refer to the basic and diluted earnings per share data on page 20 and therelated note disclosures on page 26. Explain why this disclosure isappropriate.
Statement of cash flows analysis. Refer to the consolidated statements of cash flowson page 22 of the Intel Corporation Annual Report in the Appendix.
Required:
a. Identify the four most significant sources of cash from operatingactivities during 2001. How much of a cash source amount do theseitems represent?
b. What were the firm’s investing activities during 2001, and how much cashdid they use or generate?
c. Identify the two most significant financing activities during 2001. What wasthe net effect on cash of these items?
d. What was the amount of dividends paid during 2001?
Statement of cash flows analysis. Refer to the statement of cash flows in the annualreport you have obtained either as a result of completing Exercise 1.1 or otherwise.
Required:
a. Which method, direct or indirect, is used in the statement?b. List the principal sources and uses of cash for this firm.c. Evaluate the change in cash. Has the firm generated most of its cash
requirements from operations, or has it had to borrow extensively? Have itsuses of cash been balanced between investment and dividends?
d. Has the cash balance been increasing or decreasing? What seem to be theimplications of this pattern for dividends?
Income statement analysis. Refer to the income statement in the annual report youhave obtained either as a result of completing Exercise 1.1 or otherwise.
Required:
a. Which method, single step or multiple step, is used in the statement?b. Calculate the gross profit ratio for the years reported.c. Is operating income increasing or decreasing for the years reported?d. Does the company report any unusual items? If so, what are the effects of
these items on net income and earnings per share?
ProblemsCalculate operating income and net income. The following information is availablefrom the accounting records of Manahan Co. for the year ended December 31, 2004:
Chapter 9 The Income Statement and the Statement of Cash Flows 343
E9.13.LO 6, 7
E9.14.LO 11
E9.15.LO 10, 11
E9.16.LO 3, 5, 7, 8
P9.17.LO 5

Marshall: Accounting: What the Numbers Mean, Sixth Edition
9. The Income Statement and the Statement of Cash Flows
Text © The McGraw−Hill Companies, 2003
344 Part I Financial Accounting
P9.18.LO 5
P9.19.LO 3
Net cash provided by financing activities . . . . . . . . . . . . . . . . . . . . . . . . . . . . . . . . . . $112,000Dividends paid . . . . . . . . . . . . . . . . . . . . . . . . . . . . . . . . . . . . . . . . . . . . . . . . . . . . . 18,000Extraordinary loss from flood, net of taxes of $35,000 . . . . . . . . . . . . . . . . . . . . . . . . 105,000Income tax expense . . . . . . . . . . . . . . . . . . . . . . . . . . . . . . . . . . . . . . . . . . . . . . . . . 26,000Other selling expenses . . . . . . . . . . . . . . . . . . . . . . . . . . . . . . . . . . . . . . . . . . . . . . . 13,000Net sales . . . . . . . . . . . . . . . . . . . . . . . . . . . . . . . . . . . . . . . . . . . . . . . . . . . . . . . . . 644,000Advertising expense . . . . . . . . . . . . . . . . . . . . . . . . . . . . . . . . . . . . . . . . . . . . . . . . . 45,000Accounts receivable . . . . . . . . . . . . . . . . . . . . . . . . . . . . . . . . . . . . . . . . . . . . . . . . . 62,000Cost of goods sold . . . . . . . . . . . . . . . . . . . . . . . . . . . . . . . . . . . . . . . . . . . . . . . . . . 368,000General and administrative expenses . . . . . . . . . . . . . . . . . . . . . . . . . . . . . . . . . . . . 143,000
Required:
a. Calculate the operating income for Manahan Co. for the year endedDecember 31, 2004.
b. Calculate the company’s net income for 2004.
Calculate operating income and net income. The following information is availablefrom the accounting records of Spenser Co. for the year ended December 31, 2004:
Selling, general, and administrative expenses . . . . . . . . . . . . . . . . . . . . . . . . . . . . . . $ 51,000Accounts payable . . . . . . . . . . . . . . . . . . . . . . . . . . . . . . . . . . . . . . . . . . . . . . . . . . . 85,000Extraordinary gain from early retirement of bonds,
net of tax expense of $28,000 . . . . . . . . . . . . . . . . . . . . . . . . . . . . . . . . . . . . . . . . 104,000Research and development expenses . . . . . . . . . . . . . . . . . . . . . . . . . . . . . . . . . . . 37,000Loss from discontinued operations net of tax savings of $5,000 . . . . . . . . . . . . . . . . 16,000Provision for income taxes . . . . . . . . . . . . . . . . . . . . . . . . . . . . . . . . . . . . . . . . . . . . 74,000Net sales . . . . . . . . . . . . . . . . . . . . . . . . . . . . . . . . . . . . . . . . . . . . . . . . . . . . . . . . . 579,000Interest expense . . . . . . . . . . . . . . . . . . . . . . . . . . . . . . . . . . . . . . . . . . . . . . . . . . . . 64,000Net cash provided by operations . . . . . . . . . . . . . . . . . . . . . . . . . . . . . . . . . . . . . . . 148,000Cost of goods sold . . . . . . . . . . . . . . . . . . . . . . . . . . . . . . . . . . . . . . . . . . . . . . . . . . 272,000
Required:
a. Calculate the operating income for Spenser Co. for the year ended December31, 2004.
b. Calculate the company’s net income for 2004.
Use gross profit ratio to calculate inventory loss. Franklin Co. has experiencedgross profit ratios for 2003, 2002, and 2001 of 33%, 30%, and 31%, respectively. OnApril 3, 2004, the firm’s plant and all of its inventory were destroyed by a tornado. Ac-counting records for 2004, which were available because they were stored in a pro-tected vault, showed the following:
Sales from January 1 thru April 2 . . . . . . . . . . . . . $142,680January 1 inventory amount . . . . . . . . . . . . . . . . 63,590Purchases of inventory from
January 1 thru April 2 . . . . . . . . . . . . . . . . . . . 118,652
Required:Calculate the amount of the insurance claim to be filed for the inventory destroyed inthe tornado. (Hint: Use the cost of goods sold model and a gross profit ratio that willresult in the largest claim.)

Marshall: Accounting: What the Numbers Mean, Sixth Edition
9. The Income Statement and the Statement of Cash Flows
Text © The McGraw−Hill Companies, 2003
Chapter 9 The Income Statement and the Statement of Cash Flows 345
P9.20.LO 3
P9.21.LO 10
P9.22.LO 10
Use gross profit ratio to calculate inventory loss. On April 8, 2004, a flood de-stroyed the warehouse of Stuco Distributing Co. From the waterlogged records of thecompany, management was able to determine that the firm’s gross profit ratio had aver-aged 29% for the past several years and that the inventory at the beginning of the yearwas $17,350. It also was determined that during the year until the date of the flood, saleshad totaled $32,700 and purchases totaled $21,860.
Required:Calculate the amount of inventory loss from the flood.
Cash flows from operations—indirect method. The financial statements of SimonCo. include the following items (amounts in thousands):
For the Year Ended
December 31, 2004
Income Statement
Net income . . . . . . . . . . . . . . . . . . . . . . . . . . . . . . . . . . . . . . $420Depreciation and amortization expense . . . . . . . . . . . . . . . . . 320
At December 312004 2003
Balance Sheets
Accounts receivable . . . . . . . . . . . . . . . . . . . . . . . . . . . . . $125 $170Inventory . . . . . . . . . . . . . . . . . . . . . . . . . . . . . . . . . . . . . . 170 150Accounts payable . . . . . . . . . . . . . . . . . . . . . . . . . . . . . . . 80 90Income taxes payable . . . . . . . . . . . . . . . . . . . . . . . . . . . . 50 15
Required:
a. Calculate the net cash flow provided by operations for Simon Co. for theyear ended December 31, 2004.
b. Explain why net income is different from the net cash provided by operations.
Prepare a statement of cash flows—indirect method. The financial statements ofPouchie Co. included the following information for the year ended December 31, 2004(amounts in millions):
Depreciation and amortization expense . . . . . . . . . . . . . . . . . . . . . . $130Cash dividends declared and paid . . . . . . . . . . . . . . . . . . . . . . . . . . 165Purchase of equipment . . . . . . . . . . . . . . . . . . . . . . . . . . . . . . . . . . 410Net income . . . . . . . . . . . . . . . . . . . . . . . . . . . . . . . . . . . . . . . . . . . 192Beginning cash balance . . . . . . . . . . . . . . . . . . . . . . . . . . . . . . . . . 60Proceeds of common stock issued . . . . . . . . . . . . . . . . . . . . . . . . . 74Proceeds from sale of building (at book value) . . . . . . . . . . . . . . . . . 106Accounts receivable increase . . . . . . . . . . . . . . . . . . . . . . . . . . . . . 8Ending cash balance . . . . . . . . . . . . . . . . . . . . . . . . . . . . . . . . . . . . 20Inventory decrease . . . . . . . . . . . . . . . . . . . . . . . . . . . . . . . . . . . . . 19Accounts payable increase . . . . . . . . . . . . . . . . . . . . . . . . . . . . . . . 22

Marshall: Accounting: What the Numbers Mean, Sixth Edition
9. The Income Statement and the Statement of Cash Flows
Text © The McGraw−Hill Companies, 2003
346 Part I Financial Accounting
Required:Complete the following statement of cash flows, using the indirect method:
POUCHIE CO.Statement of Cash Flows
For the Year Ended December 31, 2004
Cash Flows from Operating Activities:
Net income . . . . . . . . . . . . . . . . . . . . . . . . . . . . . . . . . . . . . . . . . . . . . . . . . . . . . . . $ 192Add (deduct) items not affecting cash:
. . . . . . . . . . . . . . . . . . . . . . . . . . . . . . . . . . . . . . . . . . . . . . . . . . . . . . . . . . . . . . . . . . . . . . . . . . . . . . . . . . . . . . . . . . . . . . . . . . . . . . . . . . . . . . . . . . . . . . . . . . . .
Net cash provided (used) by operating activities . . . . . . . . . . . . . . . . . . . . . . . . . . . . $
Cash Flows from Investing Activities:
. . . . . . . . . . . . . . . . . . . . . . . . . . . . . . . . . . . . . . . . . . . . . . . . . . . . . . . . . . . . . .
Net cash provided (used) by investing activities . . . . . . . . . . . . . . . . . . . . . . . . . . . . $
Cash Flows from Financing Activities:
. . . . . . . . . . . . . . . . . . . . . . . . . . . . . . . . . . . . . . . . . . . . . . . . . . . . . . . . . . . . . .
Net cash provided (used) by financing activities . . . . . . . . . . . . . . . . . . . . . . . . . . . . $
Net increase (decrease) in cash for the year . . . . . . . . . . . . . . . . . . . . . . . . . . . . . . . . $Cash balance, January 1, 2004 . . . . . . . . . . . . . . . . . . . . . . . . . . . . . . . . . . . . . . . . . 60
Cash balance, December 31, 2004 . . . . . . . . . . . . . . . . . . . . . . . . . . . . . . . . . . . . . . $ 20
Cash flows from operating, investing, and financing activities—direct method.The following information is available from Magdalyn Co.’s accounting records forthe year ended December 31, 2004 (amounts in millions):
Cash dividends declared and paid . . . . . . . . . . . . . . . . . . . . . . . . . . $ 340Interest and taxes paid . . . . . . . . . . . . . . . . . . . . . . . . . . . . . . . . . . 90Collections from customers . . . . . . . . . . . . . . . . . . . . . . . . . . . . . . . 1,350Payment of long-term debt . . . . . . . . . . . . . . . . . . . . . . . . . . . . . . . 220Purchase of land and buildings . . . . . . . . . . . . . . . . . . . . . . . . . . . . 170Cash paid to suppliers and employees . . . . . . . . . . . . . . . . . . . . . . 810Issuance of preferred stock . . . . . . . . . . . . . . . . . . . . . . . . . . . . . . . 300Proceeds from the sale of equipment . . . . . . . . . . . . . . . . . . . . . . . 40
Required:
a. Calculate net cash provided (used) by operating activities for Magdalyn Co.for the year ended December 31, 2004.
b. Calculate net cash provided (used) by investing activities.c. Calculate net cash provided (used) by financing activities.d. Calculate the net increase (decrease) in cash for the year.
P9.23.LO 10

Marshall: Accounting: What the Numbers Mean, Sixth Edition
9. The Income Statement and the Statement of Cash Flows
Text © The McGraw−Hill Companies, 2003
Chapter 9 The Income Statement and the Statement of Cash Flows 347
P9.24.LO 10
P9.25.LO 10, 11
Cash flows from operating, investing, and financing activities—direct method.The following information is available from Gray Co.’s accounting records for the yearended December 31, 2004 (amounts in millions):
Cash dividends declared and paid . . . . . . . . . . . . . . . . . . . . . . . . . . $ 140Retirement of bonds payable at maturity . . . . . . . . . . . . . . . . . . . . . 80Interest and taxes paid . . . . . . . . . . . . . . . . . . . . . . . . . . . . . . . . . . 60Proceeds of common stock issued . . . . . . . . . . . . . . . . . . . . . . . . . 220Proceeds from the sale of land . . . . . . . . . . . . . . . . . . . . . . . . . . . . 50Collections from customers . . . . . . . . . . . . . . . . . . . . . . . . . . . . . . . 1,270Cash paid to suppliers and employees . . . . . . . . . . . . . . . . . . . . . . ?Purchase of buildings and equipment . . . . . . . . . . . . . . . . . . . . . . . ?
Required:
a. The net cash provided by operating activities for Gray Co. for the year endedDecember 31, 2004, is $490 million. Calculate the cash paid to suppliers andemployees.
b. The increase in cash for the year was $100 million. Calculate the amount ofcash used to purchase buildings and equipment. (Hint: Set up a model of thestatement of cash flows to determine the net cash provided (used) byoperating and investing activities, and then solve for the missing amounts.)
Complete balance sheet and prepare a statement of cash flows—indirect method.Presented below is a partially completed balance sheet for Hoeman, Inc., at December31, 2004, together with comparative data for the year ended December 31, 2003. Fromthe statement of cash flows for the year ended December 31, 2004, you determine that:
Net income for the year ended December 31, 2004, was $94,000.Dividends paid during the year ended December 31, 2004, were $67,000.Accounts receivable decreased $10,000 during the year ended December 31, 2004.The cost of new buildings acquired during 2004 was $125,000.No buildings were disposed of during 2004.The land account was not affected by any transactions during the year, but thefair market value of the land at December 31, 2004, was $178,000.
HOEMAN, INC.Comparative Balance Sheets
At December 31, 2004, and 2003
2004 2003
AssetsCurrent assets:
Cash . . . . . . . . . . . . . . . . . . . . . . . . . . . . . . . . . . . . . . . . . . . . . . $ 52,000 $ 46,000Accounts receivable . . . . . . . . . . . . . . . . . . . . . . . . . . . . . . . . . . 134,000Inventory . . . . . . . . . . . . . . . . . . . . . . . . . . . . . . . . . . . . . . . . . . . 156,000 176,000
Total current assets . . . . . . . . . . . . . . . . . . . . . . . . . . . . . . . . . $ $ 356,000
Land . . . . . . . . . . . . . . . . . . . . . . . . . . . . . . . . . . . . . . . . . . . . . . . . $ 140,000Buildings . . . . . . . . . . . . . . . . . . . . . . . . . . . . . . . . . . . . . . . . . . . . . 290,000
Less: Accumulated depreciation . . . . . . . . . . . . . . . . . . . . . . . . . (120,000) (105,000)
Total land and buildings . . . . . . . . . . . . . . . . . . . . . . . . . . . . . . $ $ 325,000
Total assets . . . . . . . . . . . . . . . . . . . . . . . . . . . . . . . . . . . . . . . . . . . $ $ 681,000
(continued)

Marshall: Accounting: What the Numbers Mean, Sixth Edition
9. The Income Statement and the Statement of Cash Flows
Text © The McGraw−Hill Companies, 2003
348 Part I Financial Accounting
P9.26.LO 10, 11
LiabilitiesCurrent liabilities:
Note payable . . . . . . . . . . . . . . . . . . . . . . . . . . . . . . . . . . . . . . . . $ 155,000 $ 124,000Accounts payable . . . . . . . . . . . . . . . . . . . . . . . . . . . . . . . . . . . . 197,000
Total current liabilities . . . . . . . . . . . . . . . . . . . . . . . . . . . . . . . . $ 322,000 $ 321,000
Long-term debt . . . . . . . . . . . . . . . . . . . . . . . . . . . . . . . . . . . . . . . $ $ 139,000
Owners’ EquityCommon stock . . . . . . . . . . . . . . . . . . . . . . . . . . . . . . . . . . . . . . . . $ 50,000 $ 45,000Retained earnings . . . . . . . . . . . . . . . . . . . . . . . . . . . . . . . . . . . . . . 176,000
Total owners’ equity . . . . . . . . . . . . . . . . . . . . . . . . . . . . . . . . . . $ $ 221,000
Total liabilities and owners’ equity . . . . . . . . . . . . . . . . . . . . . . . . . . $ $ 681,000
Required:
a. Complete the December 31, 2004, balance sheet. (Hint: Long-term debt isthe last number to compute to make the balance sheet balance.)
b. Prepare a statement of cash flows for the year ended December 31, 2004,using the indirect method.
Complete balance sheet and prepare a statement of changes in retained earnings.Presented below is a statement of cash flows (indirect method) for Hartford, Inc., forthe year ended December 31, 2004. Also shown is a partially completed comparativebalance sheet as of December 31, 2004, and 2003.
HARTFORD, INC.Statement of Cash Flows
For the Year Ended December 31, 2004
Cash Flows from Operating Activities:Net income . . . . . . . . . . . . . . . . . . . . . . . . . . . . . . . . . . . . . . . . . . . . . . . . . . . . . . . $ 9,000
Add (deduct) items not affecting cash:Depreciation expense . . . . . . . . . . . . . . . . . . . . . . . . . . . . . . . . . . . . . . . . . . . . 45,000Decrease in accounts receivable . . . . . . . . . . . . . . . . . . . . . . . . . . . . . . . . . . . 23,000Increase in inventory . . . . . . . . . . . . . . . . . . . . . . . . . . . . . . . . . . . . . . . . . . . . (7,000)Increase in short-term debt . . . . . . . . . . . . . . . . . . . . . . . . . . . . . . . . . . . . . . . 5,000Increase in notes payable . . . . . . . . . . . . . . . . . . . . . . . . . . . . . . . . . . . . . . . . . 12,000Decrease in accounts payable . . . . . . . . . . . . . . . . . . . . . . . . . . . . . . . . . . . . . (6,000)
Net cash provided by operating activities . . . . . . . . . . . . . . . . . . . . . . . . . . . $ 81,000
Cash Flows from Investing Activities:Purchase of equipment . . . . . . . . . . . . . . . . . . . . . . . . . . . . . . . . . . . . . . . . . . . . $(50,000)Purchase of buildings . . . . . . . . . . . . . . . . . . . . . . . . . . . . . . . . . . . . . . . . . . . . . (48,000)
Net cash used by investing activities . . . . . . . . . . . . . . . . . . . . . . . . . . . . . . . . $(98,000)
Cash Flows from Financing Activities:Cash used for retirement of long-term debt . . . . . . . . . . . . . . . . . . . . . . . . . . . . . $(25,000)Proceeds from issuance of common stock . . . . . . . . . . . . . . . . . . . . . . . . . . . . . 10,000Payment of cash dividends on common stock . . . . . . . . . . . . . . . . . . . . . . . . . . . (3,000)
Net cash used by financing activities . . . . . . . . . . . . . . . . . . . . . . . . . . . . . . . . $(18,000)
Net decrease in cash for the year . . . . . . . . . . . . . . . . . . . . . . . . . . . . . . . . . . . . . . $(35,000)
(concluded )

Marshall: Accounting: What the Numbers Mean, Sixth Edition
9. The Income Statement and the Statement of Cash Flows
Text © The McGraw−Hill Companies, 2003
Chapter 9 The Income Statement and the Statement of Cash Flows 349
P9.27.LO 10, 11
HARTFORD, INC.Comparative Balance Sheets
At December 31, 2004, and 2003
2004 2003
AssetsCurrent assets:
Cash . . . . . . . . . . . . . . . . . . . . . . . . . . . . . . . . . . . . . . . . . . . . . . $ $ 88,000Accounts receivable . . . . . . . . . . . . . . . . . . . . . . . . . . . . . . . . . . 73,000Inventory . . . . . . . . . . . . . . . . . . . . . . . . . . . . . . . . . . . . . . . . . . . 56,000
Total current assets . . . . . . . . . . . . . . . . . . . . . . . . . . . . . . . . . $ $
Land . . . . . . . . . . . . . . . . . . . . . . . . . . . . . . . . . . . . . . . . . . . . . . . . $ $ 40,000Buildings and equipment . . . . . . . . . . . . . . . . . . . . . . . . . . . . . . . . 260,000
Less: Accumulated depreciation . . . . . . . . . . . . . . . . . . . . . . . . . (123,000)
Total land, buildings, and equipment . . . . . . . . . . . . . . . . . . . . $ $
Total assets . . . . . . . . . . . . . . . . . . . . . . . . . . . . . . . . . . . . . . . . . . $ $
LiabilitiesCurrent liabilities:
Short-term debt . . . . . . . . . . . . . . . . . . . . . . . . . . . . . . . . . . . . . $ 32,000 $Notes payable . . . . . . . . . . . . . . . . . . . . . . . . . . . . . . . . . . . . . . . 36,000Accounts payable . . . . . . . . . . . . . . . . . . . . . . . . . . . . . . . . . . . . 29,000
Total current liabilities . . . . . . . . . . . . . . . . . . . . . . . . . . . . . . . . $ $
Long-term debt . . . . . . . . . . . . . . . . . . . . . . . . . . . . . . . . . . . . . . . $ 85,000 $
Owners’ EquityCommon stock . . . . . . . . . . . . . . . . . . . . . . . . . . . . . . . . . . . . . . . . $ 40,000 $Retained earnings
Total owners’ equity . . . . . . . . . . . . . . . . . . . . . . . . . . . . . . . . . . $ $
Total liabilities and owners’ equity . . . . . . . . . . . . . . . . . . . . . . . . . . $ $
Required:
a. Complete the December 31, 2004, and 2003, balance sheets.b. Prepare a statement of changes in retained earnings for the year ended
December 31, 2004.
Prepare balance sheet and retained earnings statement using statement of cash flowsdata. Presented below is a statement of cash flows (indirect method) for Harris, Inc., forthe year ended December 31, 2004, and the firm’s balance sheet at December 31, 2003.
HARRIS, INC.Statement of Cash Flows
For the Year Ended December 31, 2004
Cash Flows from Operating Activities:Net income . . . . . . . . . . . . . . . . . . . . . . . . . . . . . . . . . . . . . . . . . . . . . . . . . . . . . . . . $13,000Add (deduct) items not affecting cash:
Depreciation expense . . . . . . . . . . . . . . . . . . . . . . . . . . . . . . . . . . . . . . . . . . . . . . 29,000Increase in accounts receivable . . . . . . . . . . . . . . . . . . . . . . . . . . . . . . . . . . . . . . (6,000)Decrease in merchandise inventory . . . . . . . . . . . . . . . . . . . . . . . . . . . . . . . . . . . . 30,000Decrease in short-term debt . . . . . . . . . . . . . . . . . . . . . . . . . . . . . . . . . . . . . . . . . (4,000)Decrease in notes payable . . . . . . . . . . . . . . . . . . . . . . . . . . . . . . . . . . . . . . . . . . (9,000)Increase in accounts payable . . . . . . . . . . . . . . . . . . . . . . . . . . . . . . . . . . . . . . . . 3,000
Net cash provided by operating activities . . . . . . . . . . . . . . . . . . . . . . . . . . . . . $56,000
(continued )

Marshall: Accounting: What the Numbers Mean, Sixth Edition
9. The Income Statement and the Statement of Cash Flows
Text © The McGraw−Hill Companies, 2003
350 Part I Financial Accounting
Cash Flows from Investing Activities:Purchase of buildings . . . . . . . . . . . . . . . . . . . . . . . . . . . . . . . . . . . . . . . . . . . . . . (90,000)Proceeds from sale of land at its cost . . . . . . . . . . . . . . . . . . . . . . . . . . . . . . . . . . 7,000
Net cash used by investing activities . . . . . . . . . . . . . . . . . . . . . . . . . . . . . . . . . $(83,000)
Cash Flows from Financing Activities:Proceeds from issuance of long-term debt . . . . . . . . . . . . . . . . . . . . . . . . . . . . . . 15,000Proceeds from issuance of common stock . . . . . . . . . . . . . . . . . . . . . . . . . . . . . . 8,000Payment of cash dividends on common stock . . . . . . . . . . . . . . . . . . . . . . . . . . . (5,000)
Net cash provided by financing activities . . . . . . . . . . . . . . . . . . . . . . . . . . . . . . $ 18,000
Net decrease in cash for the year . . . . . . . . . . . . . . . . . . . . . . . . . . . . . . . . . . . . . . . $ (9,000)
HARRIS, INC.Balance Sheet
December 31, 2003
AssetsCash . . . . . . . . . . . . . . . . . . . . . . . . . . . . . . . . . . . . . . . . . . . . . . . . . . . . . . . . . . . $ 15,000Accounts receivable . . . . . . . . . . . . . . . . . . . . . . . . . . . . . . . . . . . . . . . . . . . . . . . . 61,000Merchandise inventory . . . . . . . . . . . . . . . . . . . . . . . . . . . . . . . . . . . . . . . . . . . . . . 76,000
Total current assets . . . . . . . . . . . . . . . . . . . . . . . . . . . . . . . . . . . . . . . . . . . . . . . $152,000Land . . . . . . . . . . . . . . . . . . . . . . . . . . . . . . . . . . . . . . . . . . . . . . . . . . . . . . . . . . . . 34,000Buildings . . . . . . . . . . . . . . . . . . . . . . . . . . . . . . . . . . . . . . . . . . . . . . . . . . . . . . . . 118,000Less: Accumulated depreciation . . . . . . . . . . . . . . . . . . . . . . . . . . . . . . . . . . . . . . . (72,000)
Total land and buildings . . . . . . . . . . . . . . . . . . . . . . . . . . . . . . . . . . . . . . . . . . . $ 80,000
Total assets . . . . . . . . . . . . . . . . . . . . . . . . . . . . . . . . . . . . . . . . . . . . . . . . . . . . . . $232,000
LiabilitiesShort-term debt . . . . . . . . . . . . . . . . . . . . . . . . . . . . . . . . . . . . . . . . . . . . . . . . . . . $ 16,000Notes payable . . . . . . . . . . . . . . . . . . . . . . . . . . . . . . . . . . . . . . . . . . . . . . . . . . . . 33,000Accounts payable . . . . . . . . . . . . . . . . . . . . . . . . . . . . . . . . . . . . . . . . . . . . . . . . . . 58,000
Total current liabilities . . . . . . . . . . . . . . . . . . . . . . . . . . . . . . . . . . . . . . . . . . . . . $107,000Long-term debt . . . . . . . . . . . . . . . . . . . . . . . . . . . . . . . . . . . . . . . . . . . . . . . . . . . 50,000
Owners’ EquityCommon stock, no par . . . . . . . . . . . . . . . . . . . . . . . . . . . . . . . . . . . . . . . . . . . . . $ 20,000Retained earnings . . . . . . . . . . . . . . . . . . . . . . . . . . . . . . . . . . . . . . . . . . . . . . . . . 55,000
Total owners’ equity . . . . . . . . . . . . . . . . . . . . . . . . . . . . . . . . . . . . . . . . . . . . . . $75,000
Total liabilities and owners’ equity . . . . . . . . . . . . . . . . . . . . . . . . . . . . . . . . . . . . . . $232,000
Required:
a. Using the above information, prepare the balance sheet for Harris, Inc., atDecember 31, 2004.
b. Prepare a statement of changes in retained earnings for the year endedDecember 31, 2004.
(concluded)

Marshall: Accounting: What the Numbers Mean, Sixth Edition
9. The Income Statement and the Statement of Cash Flows
Text © The McGraw−Hill Companies, 2003
Chapter 9 The Income Statement and the Statement of Cash Flows 351
Prepare statement of cash flows (indirect method) using balance sheet data. Pre-sented below are comparative balance sheets for Millco, Inc., at January 31 and Feb-ruary 28, 2004.
MILLCO, INC.Balance Sheets
February 28 and January 31, 2004
February 28 January 31
AssetsCash . . . . . . . . . . . . . . . . . . . . . . . . . . . . . . . . . . . . . . . . . . . . . . $ 42,000 $ 37,000Accounts receivable . . . . . . . . . . . . . . . . . . . . . . . . . . . . . . . . . . 64,000 53,000Merchandise inventory . . . . . . . . . . . . . . . . . . . . . . . . . . . . . . . . 81,000 94,000
Total current assets . . . . . . . . . . . . . . . . . . . . . . . . . . . . . . . . . $187,000 $184,000Plant and equipment:
Production equipment . . . . . . . . . . . . . . . . . . . . . . . . . . . . . . . 166,000 152,000Less: Accumulated depreciation . . . . . . . . . . . . . . . . . . . . . (24,000) (21,000)
Total assets . . . . . . . . . . . . . . . . . . . . . . . . . . . . . . . . . . . . . . . . . $329,000 $315,000
LiabilitiesShort-term debt . . . . . . . . . . . . . . . . . . . . . . . . . . . . . . . . . . . . . $ 44,000 $ 44,000Accounts payable . . . . . . . . . . . . . . . . . . . . . . . . . . . . . . . . . . . . 37,000 41,000Other accrued liabilities . . . . . . . . . . . . . . . . . . . . . . . . . . . . . . . . 21,000 24,000
Total current liabilities . . . . . . . . . . . . . . . . . . . . . . . . . . . . . . . $102,000 $109,000Long-term debt . . . . . . . . . . . . . . . . . . . . . . . . . . . . . . . . . . . . . 33,000 46,000
Total liabilities . . . . . . . . . . . . . . . . . . . . . . . . . . . . . . . . . . . . $135,000 $155,000
Owners’ EquityCommon stock, no par value, 40,000 shares authorized,
30,000 and 28,000 shares issued, respectively . . . . . . . . . . . . $104,000 $ 96,000Retained earnings:
Beginning balance . . . . . . . . . . . . . . . . . . . . . . . . . . . . . . . . . . $ 64,000 $ 43,000Net income for month . . . . . . . . . . . . . . . . . . . . . . . . . . . . . . . 36,000 29,000Dividends . . . . . . . . . . . . . . . . . . . . . . . . . . . . . . . . . . . . . . . . (10,000) (8,000)
Ending balance . . . . . . . . . . . . . . . . . . . . . . . . . . . . . . . . . . . . $ 90,000 $ 64,000
Total owners’ equity . . . . . . . . . . . . . . . . . . . . . . . . . . . . . . . $194,000 $160,000
Total liabilities and owners’ equity . . . . . . . . . . . . . . . . . . . . . . . . $329,000 $315,000
Required:Prepare a statement of cash flows that explains the change that occurred in cash dur-ing the month. You may assume that the change in each balance sheet amount is dueto a single event (e.g., the change in the amount of production equipment is not the re-sult of both a purchase and sale of equipment). (Hints: What is the purpose of thestatement of cash flows? How is this purpose accomplished?) Use the space to theright of the January 31 data to enter the difference between the February 28 and Jan-uary 31 amounts of each balance sheet item; these are the amounts that will be in yoursolution.
P9.28.LO 10, 11
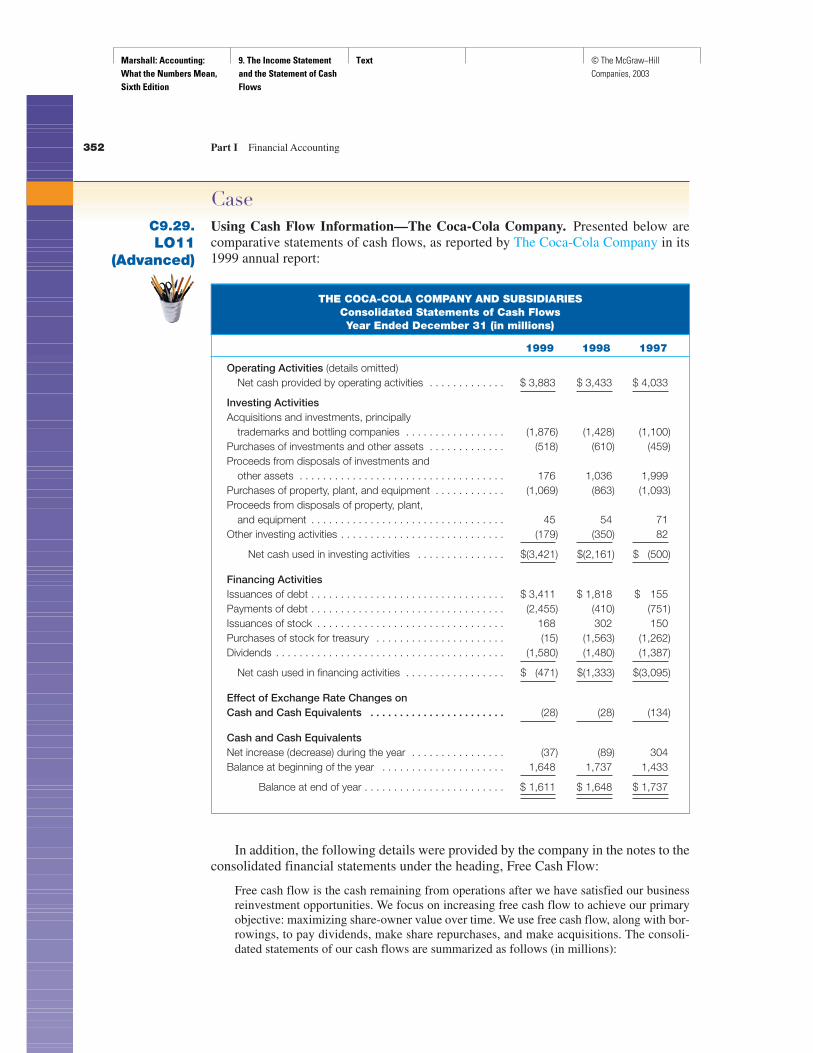
Marshall: Accounting: What the Numbers Mean, Sixth Edition
9. The Income Statement and the Statement of Cash Flows
Text © The McGraw−Hill Companies, 2003
352 Part I Financial Accounting
CaseUsing Cash Flow Information—The Coca-Cola Company. Presented below arecomparative statements of cash flows, as reported by The Coca-Cola Company in its1999 annual report:
THE COCA-COLA COMPANY AND SUBSIDIARIESConsolidated Statements of Cash FlowsYear Ended December 31 (in millions)
1999 1998 1997
Operating Activities (details omitted)Net cash provided by operating activities . . . . . . . . . . . . . $ 3,883 $ 3,433 $ 4,033
Investing ActivitiesAcquisitions and investments, principally
trademarks and bottling companies . . . . . . . . . . . . . . . . . (1,876) (1,428) (1,100)Purchases of investments and other assets . . . . . . . . . . . . . (518) (610) (459)Proceeds from disposals of investments and
other assets . . . . . . . . . . . . . . . . . . . . . . . . . . . . . . . . . . . 176 1,036 1,999Purchases of property, plant, and equipment . . . . . . . . . . . . (1,069) (863) (1,093)Proceeds from disposals of property, plant,
and equipment . . . . . . . . . . . . . . . . . . . . . . . . . . . . . . . . . 45 54 71Other investing activities . . . . . . . . . . . . . . . . . . . . . . . . . . . . (179) (350) 82
Net cash used in investing activities . . . . . . . . . . . . . . . $(3,421) $(2,161) $ (500)
Financing ActivitiesIssuances of debt . . . . . . . . . . . . . . . . . . . . . . . . . . . . . . . . . $ 3,411 $ 1,818 $ 155Payments of debt . . . . . . . . . . . . . . . . . . . . . . . . . . . . . . . . . (2,455) (410) (751)Issuances of stock . . . . . . . . . . . . . . . . . . . . . . . . . . . . . . . . 168 302 150Purchases of stock for treasury . . . . . . . . . . . . . . . . . . . . . . (15) (1,563) (1,262)Dividends . . . . . . . . . . . . . . . . . . . . . . . . . . . . . . . . . . . . . . . (1,580) (1,480) (1,387)
Net cash used in financing activities . . . . . . . . . . . . . . . . . $ (471) $(1,333) $(3,095)
Effect of Exchange Rate Changes on Cash and Cash Equivalents . . . . . . . . . . . . . . . . . . . . . . . (28) (28) (134)
Cash and Cash EquivalentsNet increase (decrease) during the year . . . . . . . . . . . . . . . . (37) (89) 304Balance at beginning of the year . . . . . . . . . . . . . . . . . . . . . 1,648 1,737 1,433
Balance at end of year . . . . . . . . . . . . . . . . . . . . . . . . $ 1,611 $ 1,648 $ 1,737
In addition, the following details were provided by the company in the notes to theconsolidated financial statements under the heading, Free Cash Flow:
Free cash flow is the cash remaining from operations after we have satisfied our businessreinvestment opportunities. We focus on increasing free cash flow to achieve our primaryobjective: maximizing share-owner value over time. We use free cash flow, along with bor-rowings, to pay dividends, make share repurchases, and make acquisitions. The consoli-dated statements of our cash flows are summarized as follows (in millions):
C9.29.LO11
(Advanced)

Marshall: Accounting: What the Numbers Mean, Sixth Edition
9. The Income Statement and the Statement of Cash Flows
Text © The McGraw−Hill Companies, 2003
Chapter 9 The Income Statement and the Statement of Cash Flows 353
Year ended December 31 1999 1998 1997
Cash flows provided by (used in):Operations . . . . . . . . . . . . . . . . . . . . . . . . . . . . . . . . . . . . $ 3,883 $ 3,433 $ 4,033Business reinvestment . . . . . . . . . . . . . . . . . . . . . . . . . . . (1,551) (1,557) (1,082)
Free cash flow . . . . . . . . . . . . . . . . . . . . . . . . . . . . . . . . . . . $2,332 $ 1,876 $ 2,951Cash flows (used in) provided by:
Acquisitions, net of disposals . . . . . . . . . . . . . . . . . . . . . . $(1,870) $ (604) $ 582Share repurchases . . . . . . . . . . . . . . . . . . . . . . . . . . . . . . (15) (1,563) (1,262)Other financing activities . . . . . . . . . . . . . . . . . . . . . . . . . (456) 230 (1,833)Exchange . . . . . . . . . . . . . . . . . . . . . . . . . . . . . . . . . . . . (28) (28) (134)
Increase (decrease) in cash . . . . . . . . . . . . . . . . . . . . . . . . . $ (37) $ (89) $ 304
• In 1999, net cash used in investing activities increased by $1.3 billion compared to1998.
• Our financing activities include net borrowings, dividend payments and share is-suances, and repurchases. The change between 1999 and 1998 was primarily due toa decrease in treasury stock repurchases due to our utilization of cash for acquisitionsduring 1999. The decrease between 1998 and 1997 was due to our net repayments ofdebt in 1997 from proceeds of disposals of investments and other assets.
Required:
a. Briefly review the consolidated statements of cash flows, and then providean overall evaluation of the “big picture” during the three years presented forCoca-Cola.1. Have operating cash flows been sufficient to meet investing needs and to
pay dividends?2. Were there significant changes to any of the specific line-item details that
you think would require further explanation or analysis?b. Using the statements of cash flows data, explain how Coca-Cola determined
the “Business reinvestment” amounts shown in its free cash flows schedule.Why do you think the company would consider these amounts to be areduction in free cash flows? (Note: Many companies include a discussion offree cash flows in their annual reports, but this concept is not currentlyrecognized or defined under generally accepted accounting principles; it isprovided for analytical purposes only.)
c. Explain the company’s assertion that, “In 1999, net cash used in investingactivities increased by $1.3 billion compared to 1998,” by reference to:1. The consolidated statements of cash flows.2. The free cash flows schedule. (Hint: Where do the investing activities
appear in this schedule?)d. Examine the details of the financing activities section of the consolidated
statements of cash flows to get an understanding of what occurred during thethree-year period presented. Compare your understanding to Coca-Cola’sexplanation of its financing activities in the paragraph above that beginswith, “Our financing activities include …” What additional explanation, ifany, would you like to see provided by the company?