the importance of liquidity - the public … pool and internalization 11 nyse-listed market shares...
TRANSCRIPT

THE IMPORTANCEOF LIQUIDITY
Howard K. Bos, CFAPresident, Portfolio Manager
Richmond Capital ManagementOctober 5, 2015

“When liquidity is scarce,
prices usually go down not up.”
Bill Gross
NEED FOR MARKET LIQUIDITYWHEN MARKETS ARE VOLATILE
1
“The problem is on the days when you need liquidity, it probably won’t be there.”
Gary Cohn, Goldman Sachs
“Despite these increased market discussions, a variety of metrics of liquidity in the nominal Treasury market do not indicate notable deterioration.”
Fed Report, June 2015
VIBRANT DISCUSSION ONCURRENT MARKET LIQUIDITY
2

• Market liquidity is a market’s ability to facilitate the purchase or sale of an asset without causing drastic changes in the asset’s prices.
• Marketability is a security’s ability to be bought or sold.
WHAT IS MARKET LIQUIDITY?
3

LIQUIDITY OF DIFFERENT INVESTMENTS
More Liquid Less Liquid
4

• Transaction Costs: Bid-Ask Spreads (Tightness)
• Immediacy: Easy Trade and Timely Settlement
• Volume: Breadth and Depth of Market
• Equilibrium: Resiliency
• Market Impact Measures
HOW DO WE DETERMINEMARKET LIQUIDITY?
5

HISTORICAL BID-ASK SPREADSU.S. EQUITIES
6
Source: Public Rule 605 Reports from Thomson, Market orders 100-9,999 sharesSource: NYSE TAQ data

VOLUME OF STOCK MARKET INU.S. DOLLARS AND NUMBER OF TRADES
7
0
20
40
60
80
100
120
140
160
180
200
0
1,000
2,000
3,000
4,000
5,000
6,000
7,000
8,000
1990
1991
1992
1993
1994
1995
1996
1997
1998
1999
2000
2001
2002
2003
2004
2005
2006
2007
2008
2009
2010
2011
2012
2013
2014
Stock Market Volume (Mill) Value Traded ($Bill)
Daily Avg., Mils. of Shares
Daily Avg., $ Billions
Source: SIFMA

HISTORICAL BID-ASK SPREADSU.S. TREASURIES AND
INVESTMENT GRADE CORPORATES
8
Source: MarketAxess, BASI TRACESource: Trade Web
Basis PointsBasis Points 10-Year Treasury Corporates
0
5
10
15
20
25
30
35
40
45
2008
2009
2009
2009
2010
2010
2010
2011
2011
2011
2012
2012
2012
2013
2013
2013
2014
2014
2014
2015
2015

Trading Volume($ Billions)
Trading Volume($ Millions)
VOLUME OF U.S. DEBT MARKETS
9
Source: SIFMA
0
5
10
15
20
25
30
0
100
200
300
400
500
600
1996
1997
1998
1999
2000
2001
2002
2003
2004
2005
2006
2007
2008
2009
2010
2011
2012
2013
2014
Treasury Agency MBS Corporate Debt
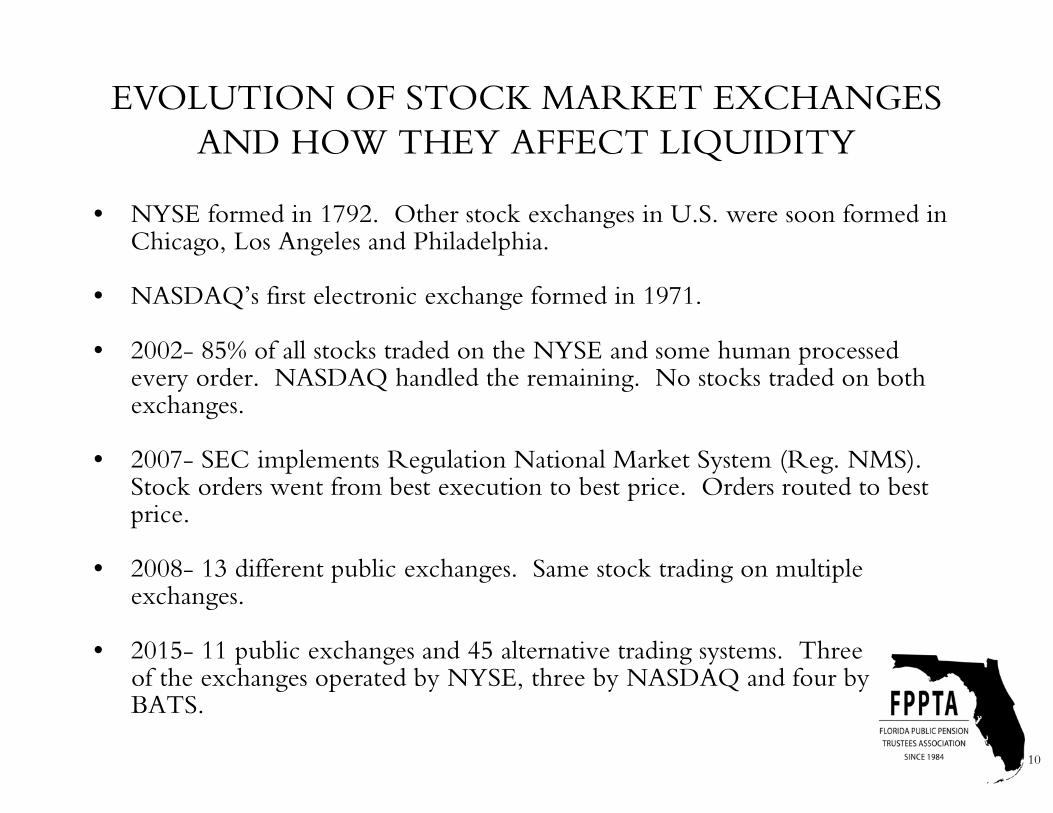
• NYSE formed in 1792. Other stock exchanges in U.S. were soon formed in Chicago, Los Angeles and Philadelphia.
• NASDAQ’s first electronic exchange formed in 1971.
• 2002- 85% of all stocks traded on the NYSE and some human processed every order. NASDAQ handled the remaining. No stocks traded on both exchanges.
• 2007- SEC implements Regulation National Market System (Reg. NMS). Stock orders went from best execution to best price. Orders routed to best price.
• 2008- 13 different public exchanges. Same stock trading on multiple exchanges.
• 2015- 11 public exchanges and 45 alternative trading systems. Three of the exchanges operated by NYSE, three by NASDAQ and four byBATS.
EVOLUTION OF STOCK MARKET EXCHANGESAND HOW THEY AFFECT LIQUIDITY
10

• Dark Pools are private forums for trading securities. They arose in the 1980’s when the SEC allowed brokers to bring together buyers and sellers of big blocks of stocks and now bonds.
• It came about primarily to facilitate block trading by institutional investors.
• No order book visible to the public.
• Trade execution details are only released to the consolidated tape after a delay.
• Non-exchange trading in equities has surged to about 40% of all U.S. stock trades compared with 16% just six years ago.
• Defenders of dark pools believe the venues in general provide protection against front running.
• Internalization involves a brokerage firm acting as the exclusive counterparty to its customers’ orders. Market practice is for broker/dealers to execute internalized orders at the national best bid oroffer.
LIMITED DISPLAY VENUES –DARK POOL AND INTERNALIZATION
11
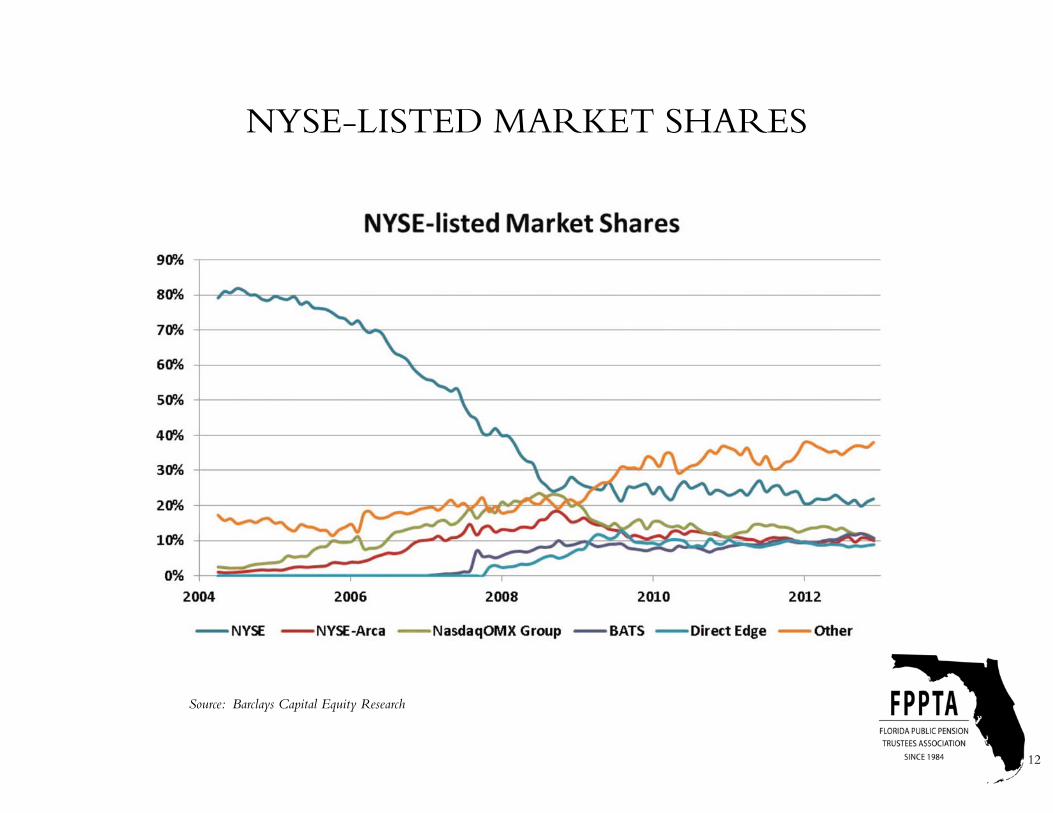
NYSE-LISTED MARKET SHARES
12
Source: Barclays Capital Equity Research
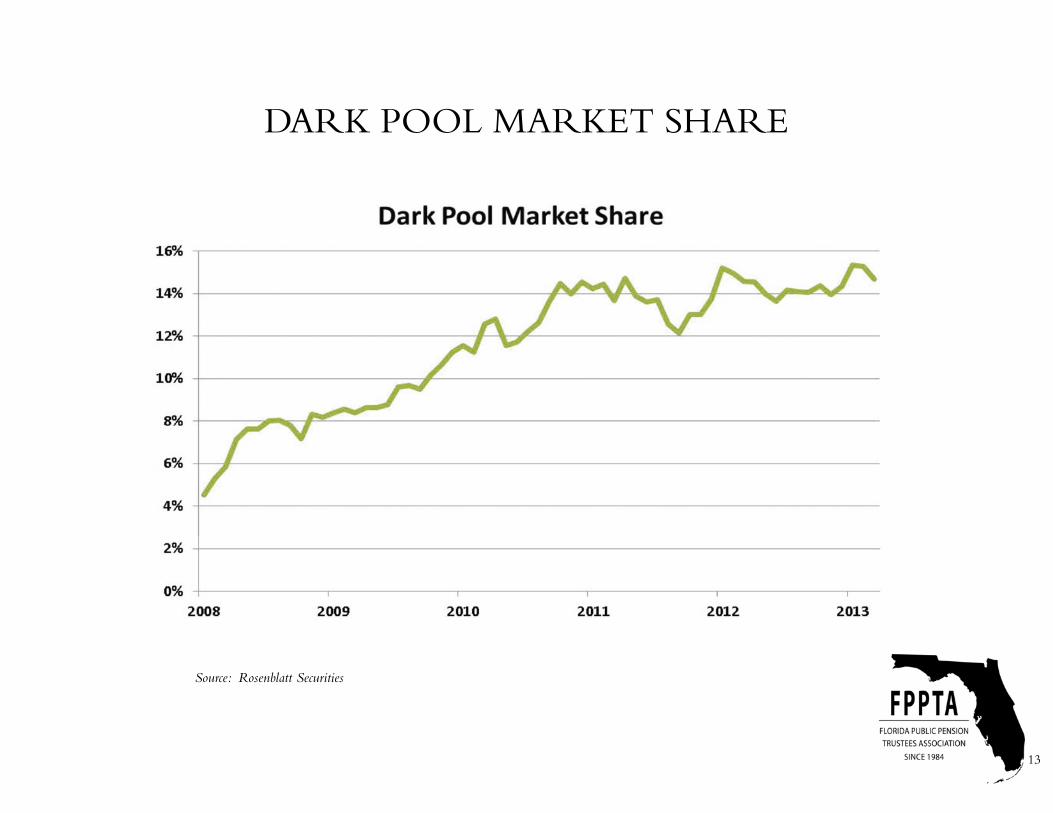
DARK POOL MARKET SHARE
13
Source: Rosenblatt Securities

• Bonds have historically traded over the counter not through an exchange. Network of Broker/Dealers.
• Primary dealers approved by the Federal Reserve act as liquidity agents for U.S. Treasuries. Currently 22 primary dealers today.
• Broker/Dealers have provided liquidity in the bond market by carrying inventory and making two-way markets.
• Telerate screens were the only source of providing pricing on U.S. Treasuries 25 years ago.
• Bloomberg terminals became the source of information on a variety of bonds in the mid to late 90’s.
• Electronic trading platforms to trade Treasuries (TradeWeb in 1999) and Corporate debt (Market Axess in 2000) took hold in early 2000’s.
• TRACE- Trade Reporting and Compliance Engine began posting transaction pricing in 2002 and has expanded this reporting for many corporate debt issues and municipal debtissues.
EVOLUTION OF BOND MARKETS
14

• Dodd-Frank Wall Street Reform and Consumer Protection Act of 2010
• Comprehensive regulation of financial markets including transparency of derivatives
• Capital Regulation and the Volcker Rule have shrunk dealer inventories and risk appetites
• Volcker Rule went into affect July 21, 2015 - bans proprietary trading and makes holding inventory more expensive, leading banks to reduce inventory, a traditional source of liquidity in the bond market
REGULATIONS AFFECTINGLIQUIDITY TODAY
15

• A flash crash is a very rapid, deep, and volatile fall in security prices occurring within an extremely short time period.
• In the course of 36 minutes starting just after 2:32 p.m. the S&P 500, the NASDAQ 100, and the Russell 2000 collapsed and then rebounded over the next thirty minutes.
• Dow Jones Industrials plunged almost 1,000 points or 9% mostly within minutes. The stock market lost close to a trillion dollars in market value at the bottom.
• Equity market was volatile that morning with the Dow Jones off 300 points. Between 2:32 p.m. and 2:45 p.m. the Dow dropped an additional 600 points. By a little after 3:00 p.m. the market had regained most of the 600 point loss.
• Some stocks like Proctor & Gamble traded as low as a penny.
• High Frequency traders were very active during the flash crash using a variety of algorithms to quickly buy and sell securities in both the cash, futures and ETF markets.
• One trader located in London has been indicted for fraud and market manipulation. The market manipulation includes “spoofing” or quickly placing and cancelling of orders. He is alleged to have modified 19,000 trade orders.
• Spoofing, layering and front running has since been banned.
FLASH CRASH STOCKSMAY 6, 2010
16
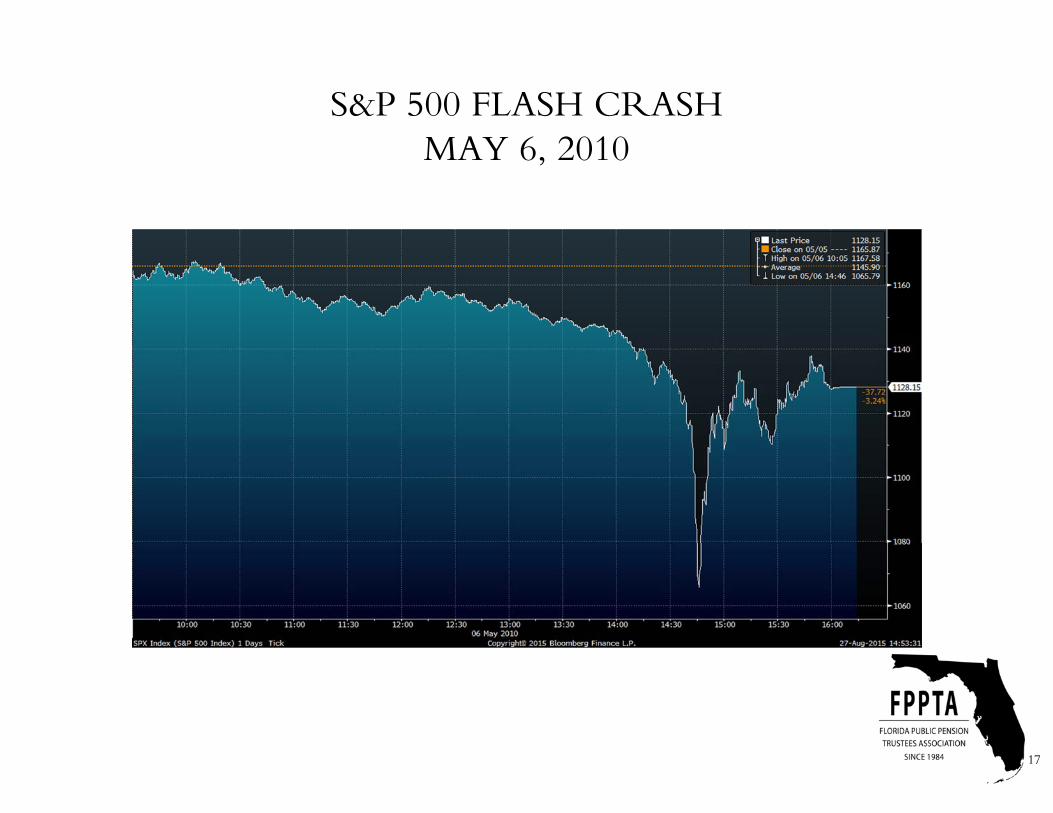
S&P 500 FLASH CRASH MAY 6, 2010
17

• On June 10, 2010 the SEC approved rules to govern single-stock circuit breakers if a stock’s price moves up or down sharply in a five minute window in response to the flash crash in May of 2010.
• The new Limit Up-Limit Down is intended to prevent trades in individual securities outside of a specified band. These bands will be 5%, 10%, 20% or the lesser of $.15 or 75% depending on the price of the stock. Price bands will double during the opening and closing periods of the day. If the stock does not move naturally back within the price band within 15 seconds, there will be a five minute trading pause. Implemented for all National Market System securities on October 8, 2013.
• SEC revised the market-wide circuit breakers to halt securities and futures exchanges if a severe market price decline reaches levels that exhaust market liquidity. A cross-market trading halt can be triggered at three circuit breaker thresholds- 7%, 13% and 20% from the prior day’s closing price of the S&P 500 index. A 7% and 13% market decline before 3:25 p.m. will halt trading for 15 minutes but after 3:25 p.m., they will not halt the market. A market decline of 20% at any time of the day will halt trading for the remainder of the day. Implemented February 2013.
NEW MEASURES TO ADDRESSEQUITY MARKET VOLATILITY
18

• On a calm trading morning of October 15, 2014 the Retail Sales report was released at 8:30 a.m., down slightly below consensus of -.3% month over month.
• In the narrow window between 9:33 a.m. and 9:45 a.m., yields exhibited a significant round-trip without a clear cause, with the ten year Treasury dropping 16 basis points and then rebounding.
• Volume doubled from the prior day in Treasury futures to over 10 million contracts.
• Algorithmic computerized trading and high frequency trading contributed the vast majority of the volume.
• Bid-Ask spreads on Treasuries continued to remain tight even as yields fell and then rebounded.
THE TREASURY FLASH CRASHOCTOBER 15, 2014
19

U.S. 10-YEAR TREASURY FLASH CRASHOCTOBER 15, 2014
20

NANOSECONDS
21
• Liquidity has drastically improved over the last 25 years in both stock and bond markets.
• Technology continues to pave the way in providing market participants with market intel.
• Technology double edge sword, giving advantages to many that can transact quicker.
• Market regulations continue to evolve as technology makes information more readily available.
WHERE DO WE GO FROM HERE?
22