the importance of being earnest · pdf fileimplications of saving, investing and future policy...
TRANSCRIPT
IMPLICATIONS OF SAVING, INVESTING AND FUTURE POLICY CHANGES ON TODAY'S WEALTHY INVESTOR
THE IMPORTANCE OF BEING EARNEST
2013 | EYE ON THE MARKET SPECIAL PUBLICATION

How do you summarize a year that was in many respects indefinable? On one hand, the European sovereign debt crisis, contracting housing markets and high unemployment weighed heavy on all of our minds. But at the same time, record corporate profits and strong emerging markets growth left reason for optimism.
So rather than look back, we’d like to look ahead. Because if there’s one thing that we’ve learned from the past few years, it’s that while we can’t predict the future, we can certainly help you prepare for it.
To help guide you in the coming year, our Chief Investment Officer Michael Cembalest has spent the past several months working with our investment leadership across Asset Management worldwide to build a comprehensive view of the macroeconomic landscape. In doing so, we’ve uncovered some potentially exciting investment opportunities, as well as some areas where we see reason to proceed with caution.
Sharing these perspectives and opportunities is part of our deep commitment to you and what we focus on each and every day. We are grateful for your continued trust and confidence, and look forward to working with you in 2011.
Most sincerely,
MARY CALLAHAN ERDOESChief Executive Officer
J.P. Morgan Asset Management
How do you plan for the unknown? In many respects, that’s the challenge we are all facing as
we move toward retirement. With longer life expectancies and an increasingly complex policy
environment, it’s more important than ever to have a current and informed perspective so you
can take an active role in your retirement planning.
In our new in-depth study, The Importance of Being Earnest, Michael Cembalest, Chairman
of Market and Investment Strategy for J.P. Morgan Asset Management, and a team of our top
economic, investment and retirement experts have left no stone unturned in identifying how
best to create and sustain your desired lifestyle in retirement.
Michael and his team look at how different savings levels, spending behaviors and investment
risk exposure can impact your ability to grow and manage retirement savings. The study also
considers the potential ramifications of new policy proposals in Washington. The good news
is, whatever the outcome of these policies, we’ve found that a successful retirement is within
reach for families who recognize the “importance of being earnest” with careful planning and
the right investment solutions.
Families around the world are increasingly being expected to control their own financial
destiny. But that doesn’t mean you have to do it alone. We hope this study provides you with
new ideas and insights, and we look forward to helping you achieve a secure retirement.
As always, we thank you for your continued trust and confidence in us.
Most sincerely,

MICHAEL CEMBALESTChairman of Market and Investment StrategyJ.P. Morgan Asset Management
Michael Cembalest is Chairman of Market and Investment Strategy for J.P. Morgan Asset Management, a global leader in investment management and private banking with $2.0 trillion of client assets worldwide. He is responsible for leading the strategic market and investment insights across the firm’s Institutional, Funds and Private Banking businesses.
Mr. Cembalest is also a member of the J.P. Morgan Asset Management Investment Committee and a member of the Investment Committee for the J.P. Morgan Retirement Plan for the firm’s 260,000 employees.
Mr. Cembalest was most recently Chief Investment Officer for the firm’s Global Private Bank, a role he held for eight years. He was previously head of a fixed income division of Investment Management, with responsibility for high grade, high yield, emerging markets and municipal bonds.
Before joining Asset Management, Mr. Cembalest served as head strategist for Emerging Markets Fixed Income at J.P. Morgan Securities. Mr. Cembalest joined J.P. Morgan in 1987 as a member of the firm’s Corporate Finance division.
Mr. Cembalest earned an M.A. from the Columbia School of International and Public Affairs in 1986 and a B.A. from Tufts University in 1984.
JANINE R AC ANELLIGlobal Head of Advice LabJ.P. Morgan Asset Management
Janine Racanelli is Global Head of J.P. Morgan Private Bank’s Advice Lab and Wealth Advisory practice. Ms. Racanelli’s expertise encompasses U.S. and cross-border tax, wealth transfer and charitable-giving strategies. In 2005, she assumed responsibility for Advice Lab, the Private Bank’s think tank, staffed with a multidisciplinary team of experts responsible for developing innovative strategies in the areas of taxation, executive compensation, philanthropy, analytical techniques and global ownership structures.
Ms. Racanelli is an attorney admitted to practice law in New York and before the U.S. Tax Court. Before joining J.P. Morgan in 1993, she practiced law at Paul, Weiss, Rifkind, Wharton and Garrison, specializing in tax, estate planning and administration and representation of fiduciaries.
Ms. Racanelli is a frequent author and speaker on investment and wealth planning topics. She has been featured in national publications such as Barron’s, BusinessWeek, The Wall Street Journal and Forbes, and has appeared on CNBC’s Power Lunch. Ms. Racanelli is the co-author of Stocker and Rikoon on Drawing Wills and
Trusts, published by the Practicing Law Institute, and an adjunct professor of law at Fordham University School of Law. She serves on the Memorial Sloan-Kettering Cancer Center Trust and Estate Advisory Committee, the New York-Presbyterian Hospital Planned Giving Advisory Council and the Metropolitan Museum of Art Professional Advisory Council.
Ms. Racanelli received her B.A. from St. John’s University and her J.D. from St. John’s University of Law.
ANTHONY WOODSAdvice LabJ.P. Morgan Asset Management
Anthony E. Woods is an Executive Director in the Advice Lab group at J.P. Morgan Private Bank. Since joining the Private Bank 12 years ago, Mr. Woods has been responsible for analyzing legislative developments and their implications for wealth and estate planning.
During this time, Mr. Woods has published articles in Trusts & Estates on legislative developments and estate tax decoupling. He has also co-authored several ALI-ABA papers on new developments in international estate planning. A graduate of Kalamazoo College, Mr. Woods also has an M.A. and Ph.D. in History from Michigan State University.

J.P. MORGAN | 3
S U M M A R Y
Many Americans live for two to three decades after they retire. Without adequate planning, even some wealthy families may not be able to sustain the standard of living they had become accustomed to during their working years. This paper examines retirement dynamics for wealthy families whose retirement assets range from $5–$10 million in 2012 dollars.1 We focus on the availability and use of qualified retire-ment plans, the balance between savings and spending, and the level of portfolio risk. Given the long-term outlook for the Federal debt and the search for a “grand bargain,” future retirees may need to increase precautionary savings given the policy options under discussion, many of which may impact them substantially. Some of our observations:
• Know what your savings rate is, including all your pre-tax contributions to savings plans. Ideally, it should be north of 20%.
• Monitor investment risk in the assets you put aside for retirement. Underinvesting and overspending are a potentially toxic combination.
• You should generally maximize all available forms of pre-tax savings that allow for tax-free compounding.
• Policy risks facing wealthy families and longer lifespans increase the amount of assets families are likely to need in retirement.
1 There are of course very wealthy families whose assets will almost certainly outlive them, and whose investment focus is often on structuring assets with an eye toward the next generation and/or their philanthropic interests. This paper is not geared to such families. Instead, for purposes of this analysis, we assume a wealthy family that retires with $5–$10 million in assets (in 2012 dollars), and analyze the prospects for their wealth sustaining them to the end of retirement, rather than surviving them.
In addition to this document, we have also prepared similar analyses of retirement dynamics for affluent and median income families. Please contact your J.P. Morgan coverage team if you would like to receive them.

4 | THE IMPORTANCE OF BEING EARNEST
THE WEALTHY FAMILY:
ON THE IMPORTANCE OF BEING EARNEST
Retirement income is the byproduct of factors over which families have no control (market returns, policy regarding taxation, savings and entitlements), some control (longevity, employment) and total control (consumption vs. savings, and portfolio risk). A framework based on history is a good place to start, as it allows us to understand the scope of what’s possible. Let’s examine the Browns when they retire in 2013 at age 62 (see sidebar for background).
How much post-retirement cash flow do the Browns need? For wealthy families like the Browns, we assume they need 80% of what they lived on before retirement. Here’s how it works: in 2012, they earn $670,000, put $22,500 in a 401(k) plan, pay their taxes, invest $72,000 out of after-tax income and live on what is left, which is ~$410,000. Using the 80% target, the Browns would be able to live off of ~$330,000 beginning in 2013. We grow this target each year by inflation so that their post-retirement income maintains its purchasing power.
Exhibit 1 looks at the Browns’ financial assets. They accumulate $7 million by retirement, which they gradually deplete. Exhibit 2 shows how they finance their cash flow target: they run down after-tax savings first and do not draw from their 401(k) (to retain pre-tax compounding benefits) until the minimum 401(k) mandatory distributions begin. Note that the Browns need to come up with enough cash to meet their income target, and taxes payable on 401(k) distributions.
By making consistent pre-tax contributions to savings and sticking to a balanced portfolio approach, the Browns are able to live out their retirement to age 90 with their cash flow target intact, and with a substantial sum left for the next generation. Life’s emergencies and unexpected hardships can get in the way, but this outcome is well within the realm of the possible. Note that the Browns’ savings rate is around 26%, which is 4% above our rough estimate for their income demographic. Appendix 1 contains a description of what savings rates mean, how they are computed, and what “average” is for a wealthy family. The Browns demonstrate the importance of being earnest about saving and investing: families that don’t do this as aggressively face greater challenges in retirement, as we’ll explain.
T H E B R O W N S :
• Have one working spouse that since 1975 consistently earns 12x the median income (in 2012, 12x MI = $670,000)
• Buy a home once they save enough for a down payment and which they own free and clear by retirement
• Max out pre-tax 401(k) contributions and benefit from a 3% employer match
• Put aside another 15% of after-tax income in a savings account, for a total lifetime savings rate of 26% (4% above our rough estimate of “average” for their income demographic; see Appendix 1 for more details)
• Invest in a balanced portfolio of 65% equities at age 25, declining to 45% by age 62 (remainder in fixed income)
• Intend to spend $330,000 in 2013 when they retire, adjusted upward for inflation each year
$0
$100,000
$200,000
$300,000
$400,000
$500,000
$600,000
$700,000 Withdrawal from after-tax savingsMandatory 401(k) distribution Social Security benefits
2037203320292025202120172013
Income target
EXHIBIT 2: Baseline case: how the Browns meet their cash flow needs in retirement
Source: TPC, BEA, NAR, BLS, JPMAM, Census, Bloomberg.
EXHIBIT 1: Baseline case: high lifetime savings rate and balanced investing gets the Browns through retirement
1972 1982 1992 2002 2012 2022 2032
Retirement
Baseline
$0
$1,000,000
$2,000,000
$3,000,000
$4,000,000
$5,000,000
$6,000,000
$7,000,000
$8,000,000
Source: TPC, BEA, NAR, BLS, JPMAM, Census, Bloomberg.
Value of financial assets

J.P. MORGAN | 5
Spending conservation in retirement
Many retirement studies suggest only a modest decline in post-retirement spending needs relative to pre-retirement patterns. The reason: most median income retirees have greater inelastic spending needs that cannot be easily cut. For wealthier families in the Browns’ demographic, we assume greater conservation potential such that post-retirement cash flow needs can fall to 80% of pre-retirement levels. Sources of spending conservation often include a decline in graduate and post-graduate assistance for children now in the workforce; charitable contributions; mortgage costs; work-related apparel, transportation, entertainment and food expenses; and an eventual end to the need for financial assistance to aging parents.
The concept of post-retirement spending is a critical one in retirement dynamics. Even if the Browns are diligent about saving and investing, should they set a spending target equal to 100% of pre-retirement spending, their assets would be depleted much more quickly, requiring the family to monetize some of the value of their home (Exhibit 3). Of course, a family would not maintain such a high spending rate, and would cut back at some point before exhausting their assets; the point is that without any plans to reduce spending, a lot more saving would need to take place beforehand. A family intending to spend 100% of pre-retirement cash flow would need a lifetime savings rate of 31% rather than 26% to recapture the cushion of the baseline case.
A note on the family home. In some cases we analyze, after the family’s financial assets are exhausted, the family is assumed to sell their home and live off the proceeds for as long as they last. For some families, that decision might take place earlier in retirement as a means of boosting savings (when, for example, the family downsizes into a less expensive home). Such a step would allow tax-advantaged savings balances such as their 401(k) to accrue for a longer period of time before being withdrawn. Another means of accessing home equity would be to borrow against the appreciated value in the house, which, for some families, is substantial after a couple of decades of home price appreciation. Even with the recent home price collapse factored in, the Browns’ house tripled in value since 1979 (rising at 3.5% per year).
Home sale
1972 1982 1992 2002 2012 2022 2032$0
$1,000,000
$2,000,000
$3,000,000
$4,000,000
$5,000,000
$6,000,000
$7,000,000
$8,000,000
Baseline 100%spend target
Baseline 80%spend target
EXHIBIT 3: Maintaining pre-retirement spending levels in retirement is often unsustainable
Source: TPC, BEA, NAR, BLS, JPMAM, Census, Bloomberg.
Value of financial assets
6 | THE IMPORTANCE OF BEING EARNEST
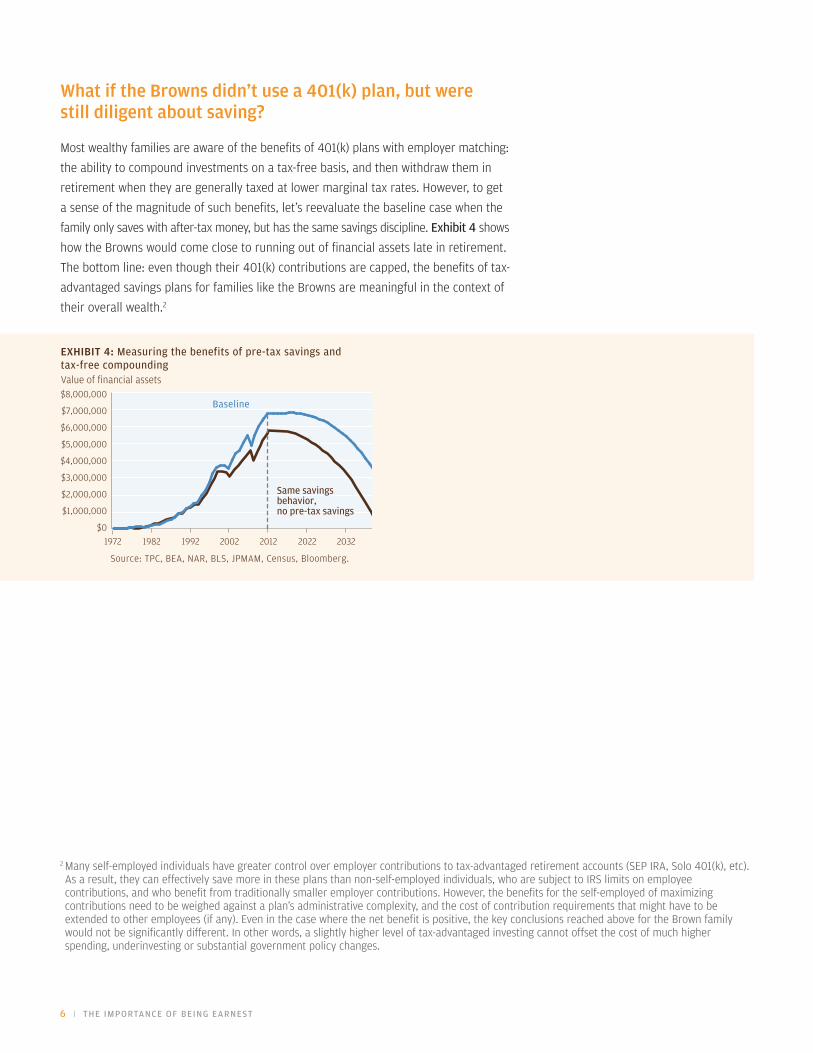
What if the Browns didn't use a 401(k) plan, but were still diligent about saving?
Most wealthy families are aware of the benefits of 401(k) plans with employer matching: the ability to compound investments on a tax-free basis, and then withdraw them in retirement when they are generally taxed at lower marginal tax rates. However, to get a sense of the magnitude of such benefits, let’s reevaluate the baseline case when the family only saves with after-tax money, but has the same savings discipline. Exhibit 4 shows how the Browns would come close to running out of financial assets late in retirement. The bottom line: even though their 401(k) contributions are capped, the benefits of tax-advantaged savings plans for families like the Browns are meaningful in the context of their overall wealth.2
2 Many self-employed individuals have greater control over employer contributions to tax-advantaged retirement accounts (SEP IRA, Solo 401(k), etc). As a result, they can effectively save more in these plans than non-self-employed individuals, who are subject to IRS limits on employee contributions, and who benefit from traditionally smaller employer contributions. However, the benefits for the self-employed of maximizing contributions need to be weighed against a plan’s administrative complexity, and the cost of contribution requirements that might have to be extended to other employees (if any). Even in the case where the net benefit is positive, the key conclusions reached above for the Brown family would not be significantly different. In other words, a slightly higher level of tax-advantaged investing cannot offset the cost of much higher spending, underinvesting or substantial government policy changes.
EXHIBIT 4: Measuring the benefits of pre-tax savings and tax-free compounding
1972 1982 1992 2002 2012 2022 2032$0
$1,000,000
$2,000,000
$3,000,000
$4,000,000
$5,000,000
$6,000,000
$7,000,000
$8,000,000
Same savings behavior, no pre-tax savings
Baseline
Source: TPC, BEA, NAR, BLS, JPMAM, Census, Bloomberg.
Value of financial assets
J.P. MORGAN | 7
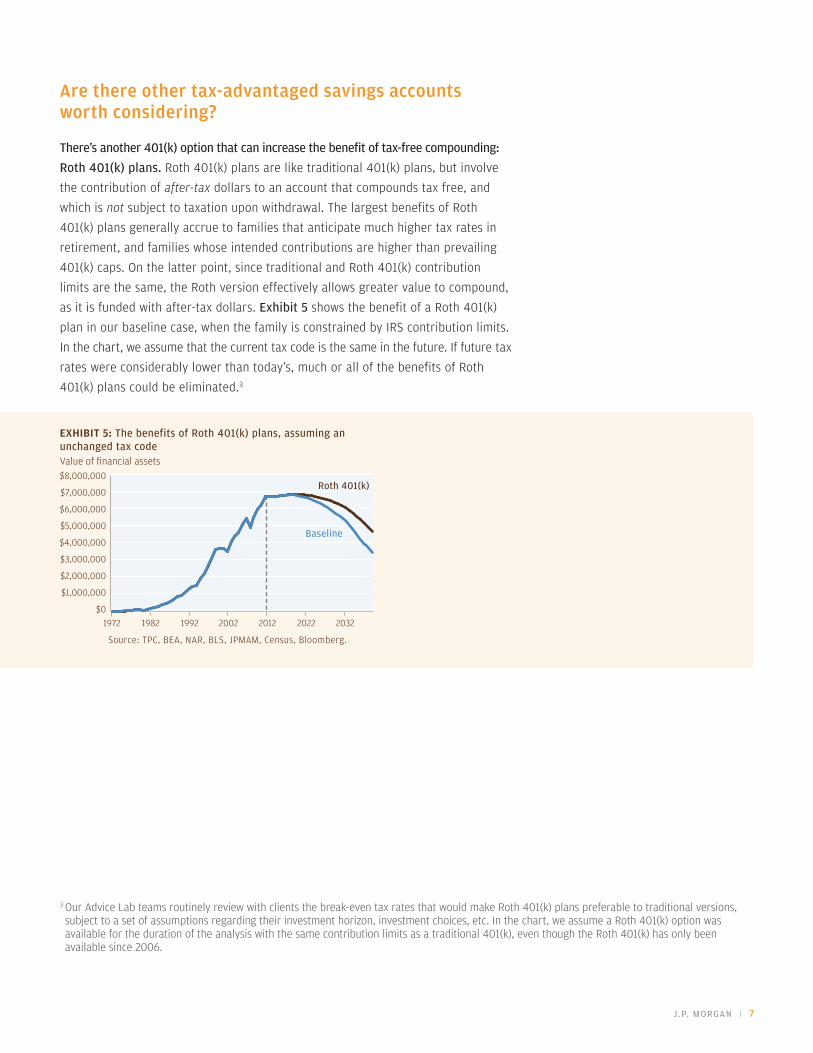
Are there other tax-advantaged savings accounts worth considering?
There’s another 401(k) option that can increase the benefit of tax-free compounding: Roth 401(k) plans. Roth 401(k) plans are like traditional 401(k) plans, but involve the contribution of after-tax dollars to an account that compounds tax free, and which is not subject to taxation upon withdrawal. The largest benefits of Roth 401(k) plans generally accrue to families that anticipate much higher tax rates in retirement, and families whose intended contributions are higher than prevailing 401(k) caps. On the latter point, since traditional and Roth 401(k) contribution limits are the same, the Roth version effectively allows greater value to compound, as it is funded with after-tax dollars. Exhibit 5 shows the benefit of a Roth 401(k) plan in our baseline case, when the family is constrained by IRS contribution limits. In the chart, we assume that the current tax code is the same in the future. If future tax rates were considerably lower than today’s, much or all of the benefits of Roth
401(k) plans could be eliminated.3
3 Our Advice Lab teams routinely review with clients the break-even tax rates that would make Roth 401(k) plans preferable to traditional versions, subject to a set of assumptions regarding their investment horizon, investment choices, etc. In the chart, we assume a Roth 401(k) option was available for the duration of the analysis with the same contribution limits as a traditional 401(k), even though the Roth 401(k) has only been available since 2006.
1972 1982 1992 2002 2012 2022 2032$0
$1,000,000
$2,000,000
$3,000,000
$4,000,000
$5,000,000
$6,000,000
$7,000,000
$8,000,000
Baseline
Roth 401(k)
EXHIBIT 5: The benefits of Roth 401(k) plans, assuming an unchanged tax code
Source: TPC, BEA, NAR, BLS, JPMAM, Census, Bloomberg.
Value of financial assets

8 | THE IMPORTANCE OF BEING EARNEST
Some families can add pre-tax dollars to savings plans that are not subject to any IRS contribution limits, if they have access to non-qualified deferred compensation plans through their employer. Additional pre-tax compounding is beneficial to family wealth dynamics, but families should be conscious of the credit risks associated with non-qualified plans and monitor their concentrations accordingly.
Some analysts assess the risk of non-qualified deferred compensation plans by looking at the magnitude of compositional changes in the Dow or S&P over 20- and 30-year periods. However, these index changes occur not just as a result of bankruptcy, but also due to mergers, acquisitions and spin-offs. As a result, the default risk on investment-grade and high yield bonds is a better way to understand the credit risk associated with non-qualified deferred compensation plans. Historically, such default risks have been highly cyclical, and reflect the swings in the business cycle. In Appendix 2, we include a chart on high yield default rates since 1981; they trough at 2% during the peaks of the cycle, and rise to 10%-12% during recessions. The incidence of investment-grade defaults are much lower, as shown in a separate chart in Appendix 2.
Families accumulating large amounts of after-tax savings can also try to increase investment and tax efficiency by investing in a non-deductible IRA. The benefits vs. ordinary after-tax savings accounts: the IRA would compound on a pre-tax basis. However, some income that would have been taxed as capital gains is taxed as ordinary income (net of original basis) upon withdrawal. The net benefit depends on the time horizon (the longer, the better), and the nature of the investment in the IRA (the less tax-efficient, the better). Investments that generate a lot of ordinary income (fixed income, many hedge funds, etc.) are good choices for non-deductible IRAs, annuities and other savings plans funded with after-tax dollars.
In the following sections, we analyze changes in the Browns’ savings and investment behavior relative to the baseline case, all assuming retirement at age 62, a traditional 401(k) plan, and without any benefit from non-qualified deferred compensation plans.
Are there other tax-advantaged savings accounts worth considering? (Continued)

J.P. MORGAN | 9
EXHIBIT 6: The more conservative investor
1972 1982 1992 2002 2012 2022 2032$0
$1,000,000
$2,000,000
$3,000,000
$4,000,000
$5,000,000
$6,000,000
$7,000,000
$8,000,000
More conservative investor
Baseline
Source: TPC, BEA, NAR, BLS, JPMAM, Census, Bloomberg.
EXHIBIT 7: The big spender
1972 1982 1992 2002 2012 2022 2032$0
$1,000,000
$2,000,000
$3,000,000
$4,000,000
$5,000,000
$6,000,000
$7,000,000
$8,000,000
Big spender
Baseline
Source: TPC, BEA, NAR, BLS, JPMAM, Census, Bloomberg.
What if the Browns maximized the use of their 401(k), but invested more conservatively? Assume an equity allocation of 50% at age 25, declining to 35% by retirement. Their assets do not accumulate as rapidly, and unless future fixed income returns match the past, their assets will decline more rapidly (Exhibit 6). We think it’s unlikely: the trailing 35-year real return on 5-year Treasuries at the end of 2012, for example, was the highest since 1926.
The big spender is an even bigger problem: what if the Browns were balanced investors, but their lifetime savings rate were lower? First we need to figure out what a wealthy big spender would look like. In the baseline case, the Browns had a lifetime savings rate in the neighborhood of 26%. So, let’s assume a big spender with a savings rate of 21% instead. In this case, the Browns accumulate $2 million less by retirement, run down savings much faster, and need to access their home equity (Exhibit 7). The takeaway here: if your retirement relies mostly on your own asset growth (rather than on Social Security or defined benefit pension payments), it is suboptimal to either underinvest or overspend. Of course, combining overly conservative investing and excessive spending would simply compound their retirement problem.
Challenges for retirees: very conservative long-term investing and too much spending
R E S I S T I N G T E M P TAT I O N
Saving is a constant battle against the temptation to overspend. Perhaps more than any other country, the United States effectively encourages its citizens to spend, which may explain why consumption is so high relative to GDP (71%). Examples of pro-spending policies include:
• Lower sales, VAT, excise and import duties on a wide range of goods and services, including fuel, food, wine, electronics, accountants and lawyers
• Favorable tax treatment of housing (mortgage interest deduction, capital gains exemption on sale of residence), which results in lower population densities, greater suburban sprawl and increased household spending on home improvements, transportation, etc.
• Lack of single-payer healthcare leads to greater healthcare consumption (U.S. private sector healthcare expenditures are more than twice every other OECD country)
Value of financial assets Value of financial assets
10 | THE IMPORTANCE OF BEING EARNEST
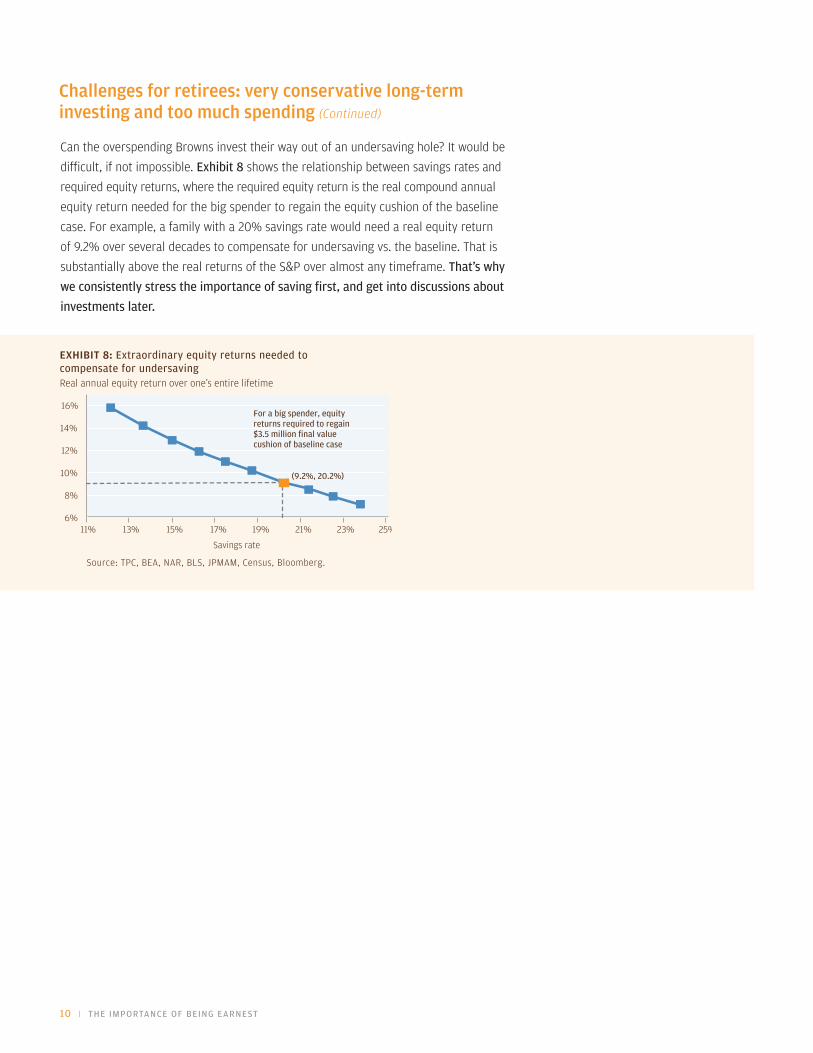
Can the overspending Browns invest their way out of an undersaving hole? It would be difficult, if not impossible. Exhibit 8 shows the relationship between savings rates and required equity returns, where the required equity return is the real compound annual equity return needed for the big spender to regain the equity cushion of the baseline case. For example, a family with a 20% savings rate would need a real equity return of 9.2% over several decades to compensate for undersaving vs. the baseline. That is substantially above the real returns of the S&P over almost any timeframe. That’s why we consistently stress the importance of saving first, and get into discussions about investments later.
EXHIBIT 8: Extraordinary equity returns needed to compensate for undersaving
Savings rate
6%
8%
10%
12%
14%
16%
11% 13% 15% 17% 19% 21% 23% 25%
For a big spender, equityreturns required to regain$3.5 million final valuecushion of baseline case
(9.2%, 20.2%)
Source: TPC, BEA, NAR, BLS, JPMAM, Census, Bloomberg.
Real annual equity return over one’s entire lifetime
Challenges for retirees: very conservative long-term investing and too much spending (Continued)
J.P. MORGAN | 11
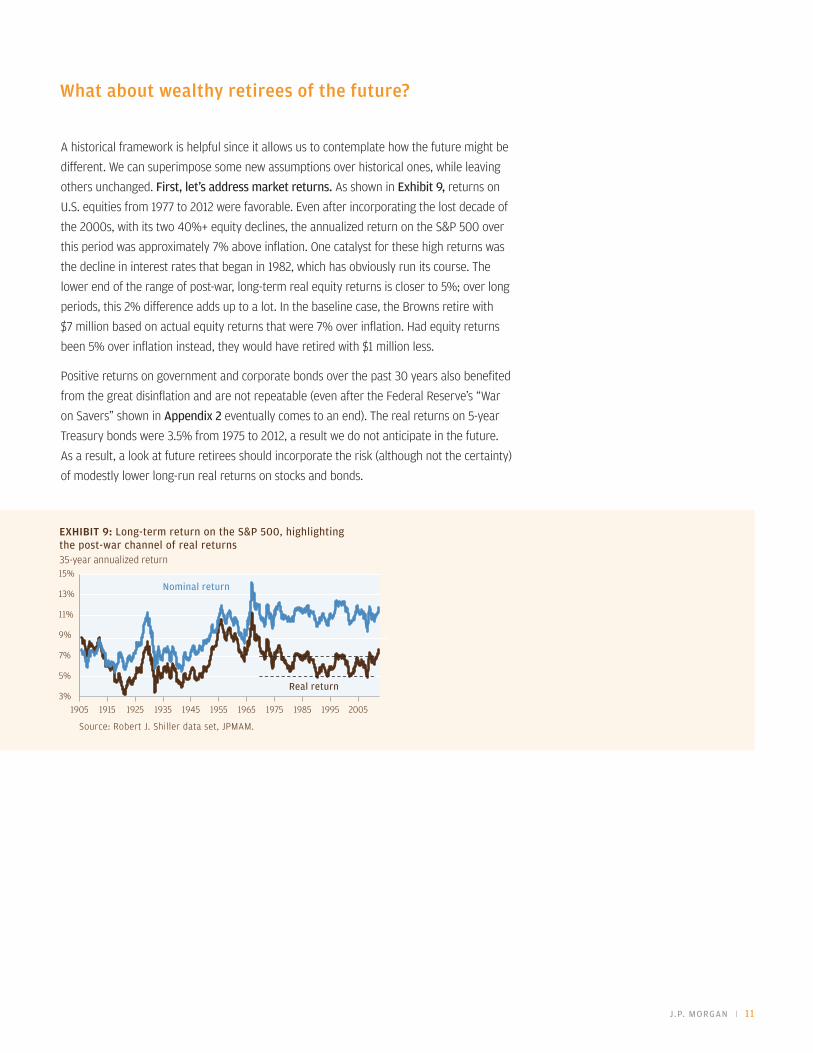
EXHIBIT 9: Long-term return on the S&P 500, highlighting the post-war channel of real returns
15%
13%
11%
9%
7%
5%
3%1905 1925 1955 19751915 1935 1945 1965 1985 1995 2005
Nominal return
Real return
Source: Robert J. Shiller data set, JPMAM.
What about wealthy retirees of the future?
A historical framework is helpful since it allows us to contemplate how the future might be different. We can superimpose some new assumptions over historical ones, while leaving others unchanged. First, let’s address market returns. As shown in Exhibit 9, returns on U.S. equities from 1977 to 2012 were favorable. Even after incorporating the lost decade of the 2000s, with its two 40%+ equity declines, the annualized return on the S&P 500 over this period was approximately 7% above inflation. One catalyst for these high returns was the decline in interest rates that began in 1982, which has obviously run its course. The lower end of the range of post-war, long-term real equity returns is closer to 5%; over long periods, this 2% difference adds up to a lot. In the baseline case, the Browns retire with $7 million based on actual equity returns that were 7% over inflation. Had equity returns been 5% over inflation instead, they would have retired with $1 million less.
Positive returns on government and corporate bonds over the past 30 years also benefited from the great disinflation and are not repeatable (even after the Federal Reserve’s “War on Savers” shown in Appendix 2 eventually comes to an end). The real returns on 5-year Treasury bonds were 3.5% from 1975 to 2012, a result we do not anticipate in the future. As a result, a look at future retirees should incorporate the risk (although not the certainty) of modestly lower long-run real returns on stocks and bonds.
35-year annualized return
12 | THE IMPORTANCE OF BEING EARNEST
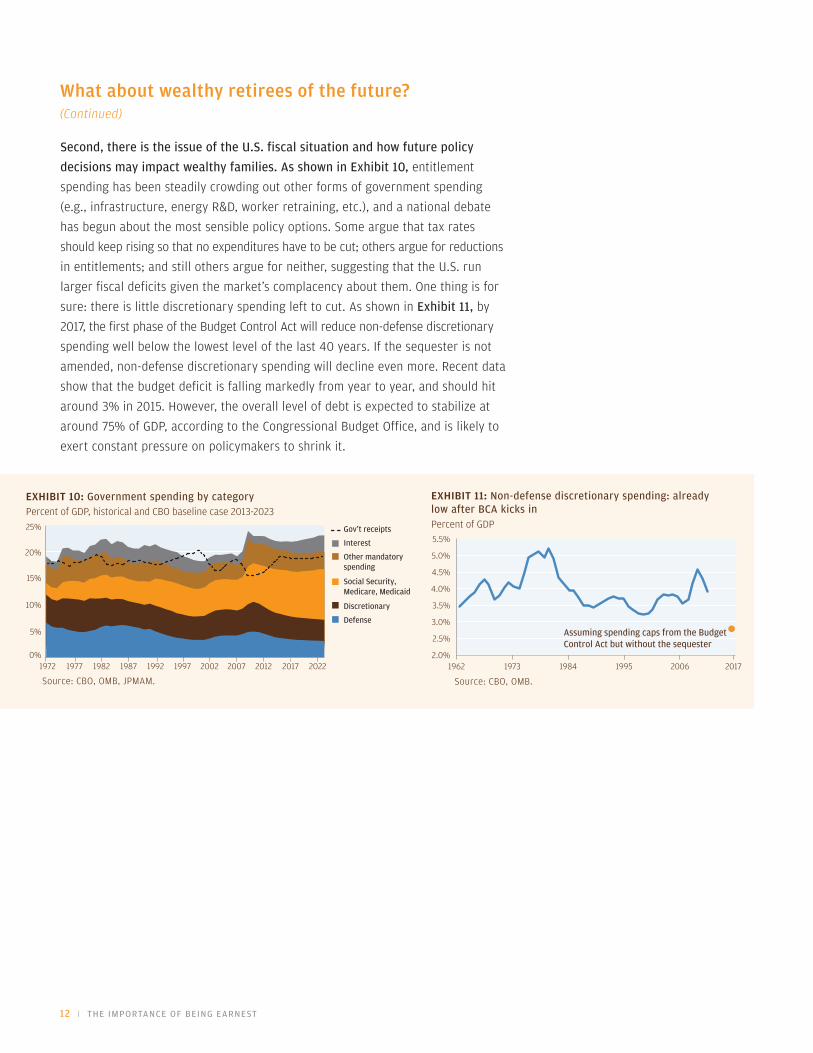
EXHIBIT 11: Non-defense discretionary spending: already low after BCA kicks in
5.5%
5.0%
4.5%
4.0%
3.5%
3.0%
2.5%
2.0%1962 1973 1984 1995 2006 2017
Assuming spending caps from the Budget Control Act but without the sequester
Source: CBO, OMB.
Second, there is the issue of the U.S. fiscal situation and how future policy decisions may impact wealthy families. As shown in Exhibit 10, entitlement spending has been steadily crowding out other forms of government spending (e.g., infrastructure, energy R&D, worker retraining, etc.), and a national debate has begun about the most sensible policy options. Some argue that tax rates should keep rising so that no expenditures have to be cut; others argue for reductions in entitlements; and still others argue for neither, suggesting that the U.S. run larger fiscal deficits given the market’s complacency about them. One thing is for sure: there is little discretionary spending left to cut. As shown in Exhibit 11, by 2017, the first phase of the Budget Control Act will reduce non-defense discretionary spending well below the lowest level of the last 40 years. If the sequester is not amended, non-defense discretionary spending will decline even more. Recent data
show that the budget deficit is falling markedly from year to year, and should hit around 3% in 2015. However, the overall level of debt is expected to stabilize at around 75% of GDP, according to the Congressional Budget Office, and is likely to exert constant pressure on policymakers to shrink it.
EXHIBIT 10: Government spending by category
Assuming spending caps from the Budget Control Act but without the sequester
0%
5%
10%
15%
20%
25%
20222017201220072002199719921987198219771972
Interest
Social Security, Medicare, Medicaid
Discretionary
Defense
Gov’t receipts
Other mandatory spending
Source: CBO, OMB, JPMAM.
Percent of GDP, historical and CBO baseline case 2013-2023Percent of GDP
What about wealthy retirees of the future?(Continued)
J.P. MORGAN | 13
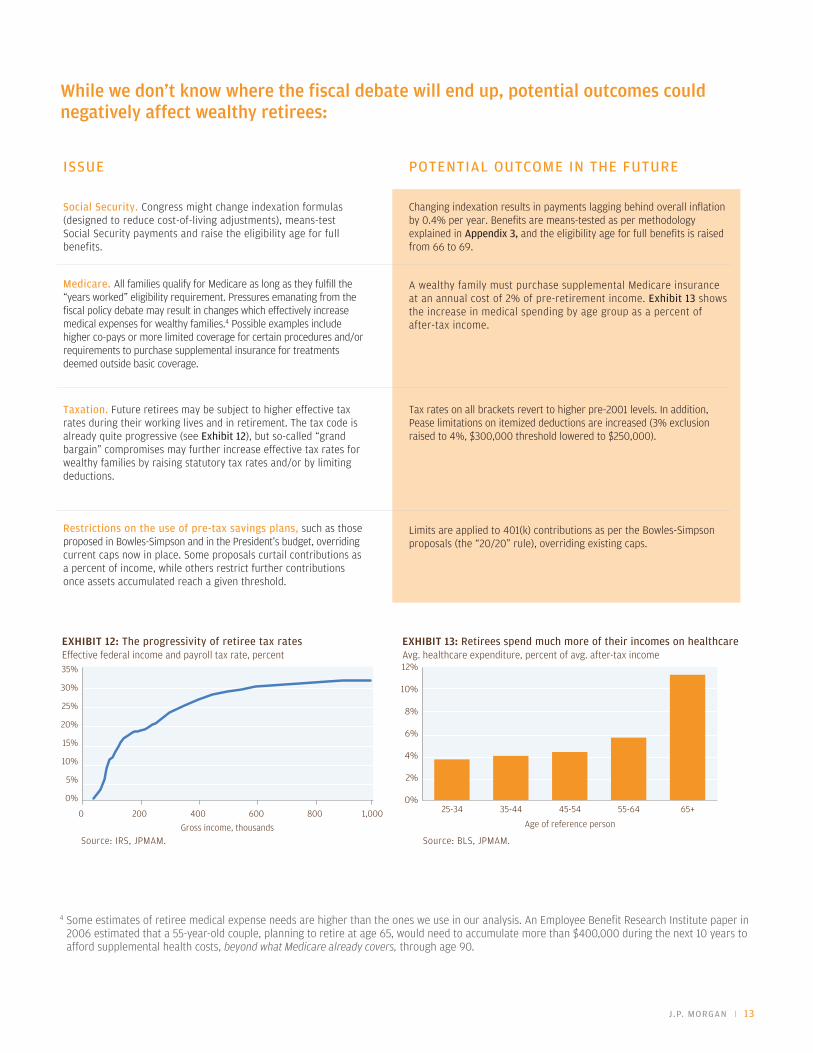
EXHIBIT 13: Retirees spend much more of their incomes on healthcare
0%
2%
4%
6%
8%
10%
12%
25-34 35-44 45-54 55-64 65+
Age of reference person
Source: BLS, JPMAM.
EXHIBIT 12: The progressivity of retiree tax rates
0%
5%
10%
15%
20%
25%
30%
35%
0 200 400 600 800 1,000Gross income, thousands
Source: IRS, JPMAM.
While we don't know where the fiscal debate will end up, potential outcomes could negatively affect wealthy retirees:
ISSUE
Social Security. Congress might change indexation formulas (designed to reduce cost-of-living adjustments), means-test Social Security payments and raise the eligibility age for full benefits.
Medicare. All families qualify for Medicare as long as they fulfill the “years worked” eligibility requirement. Pressures emanating from the fiscal policy debate may result in changes which effectively increase medical expenses for wealthy families.4 Possible examples include higher co-pays or more limited coverage for certain procedures and/or requirements to purchase supplemental insurance for treatments deemed outside basic coverage.
Taxation. Future retirees may be subject to higher effective tax rates during their working lives and in retirement. The tax code is already quite progressive (see Exhibit 12), but so-called “grand bargain” compromises may further increase effective tax rates for wealthy families by raising statutory tax rates and/or by limiting deductions.
Restrictions on the use of pre-tax savings plans, such as those proposed in Bowles-Simpson and in the President’s budget, overriding current caps now in place. Some proposals curtail contributions as a percent of income, while others restrict further contributions once assets accumulated reach a given threshold.
POTENTIAL OUTCOME IN THE FUTURE
Changing indexation results in payments lagging behind overall inflation by 0.4% per year. Benefits are means-tested as per methodology explained in Appendix 3, and the eligibility age for full benefits is raised from 66 to 69.
A wealthy family must purchase supplemental Medicare insurance at an annual cost of 2% of pre-retirement income. Exhibit 13 shows the increase in medical spending by age group as a percent of after-tax income.
Tax rates on all brackets revert to higher pre-2001 levels. In addition, Pease limitations on itemized deductions are increased (3% exclusion raised to 4%, $300,000 threshold lowered to $250,000).
Limits are applied to 401(k) contributions as per the Bowles-Simpson proposals (the “20/20” rule), overriding existing caps.
4 Some estimates of retiree medical expense needs are higher than the ones we use in our analysis. An Employee Benefit Research Institute paper in 2006 estimated that a 55-year-old couple, planning to retire at age 65, would need to accumulate more than $400,000 during the next 10 years to afford supplemental health costs, beyond what Medicare already covers, through age 90.
Effective federal income and payroll tax rate, percent Avg. healthcare expenditure, percent of avg. after-tax income
14 | THE IMPORTANCE OF BEING EARNEST
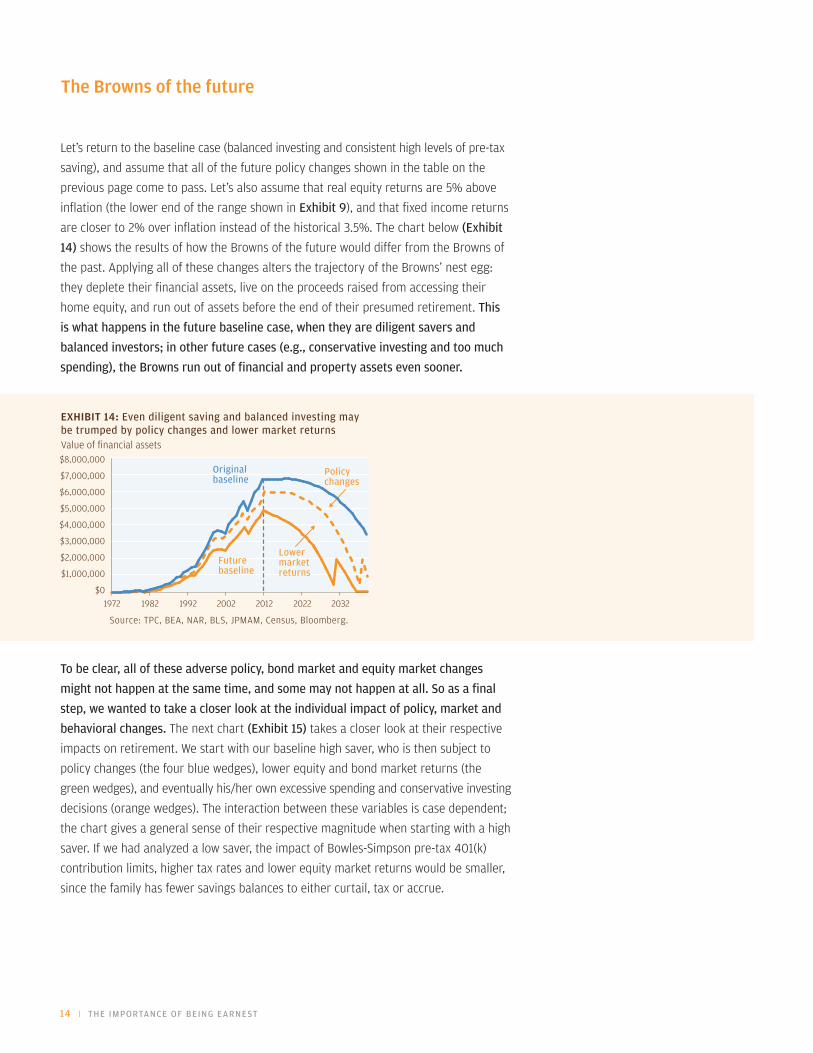
EXHIBIT 14: Even diligent saving and balanced investing may be trumped by policy changes and lower market returns
1972 1982 1992 2002 2012 2022 2032$0
$1,000,000
$2,000,000
$3,000,000
$4,000,000
$5,000,000
$6,000,000
$7,000,000
$8,000,000
Lower marketreturns
Originalbaseline
Policychanges
Futurebaseline
Source: TPC, BEA, NAR, BLS, JPMAM, Census, Bloomberg.
Let’s return to the baseline case (balanced investing and consistent high levels of pre-tax saving), and assume that all of the future policy changes shown in the table on the previous page come to pass. Let’s also assume that real equity returns are 5% above inflation (the lower end of the range shown in Exhibit 9), and that fixed income returns are closer to 2% over inflation instead of the historical 3.5%. The chart below (Exhibit 14) shows the results of how the Browns of the future would differ from the Browns of the past. Applying all of these changes alters the trajectory of the Browns’ nest egg: they deplete their financial assets, live on the proceeds raised from accessing their home equity, and run out of assets before the end of their presumed retirement. This is what happens in the future baseline case, when they are diligent savers and balanced investors; in other future cases (e.g., conservative investing and too much spending), the Browns run out of financial and property assets even sooner.
The Browns of the future
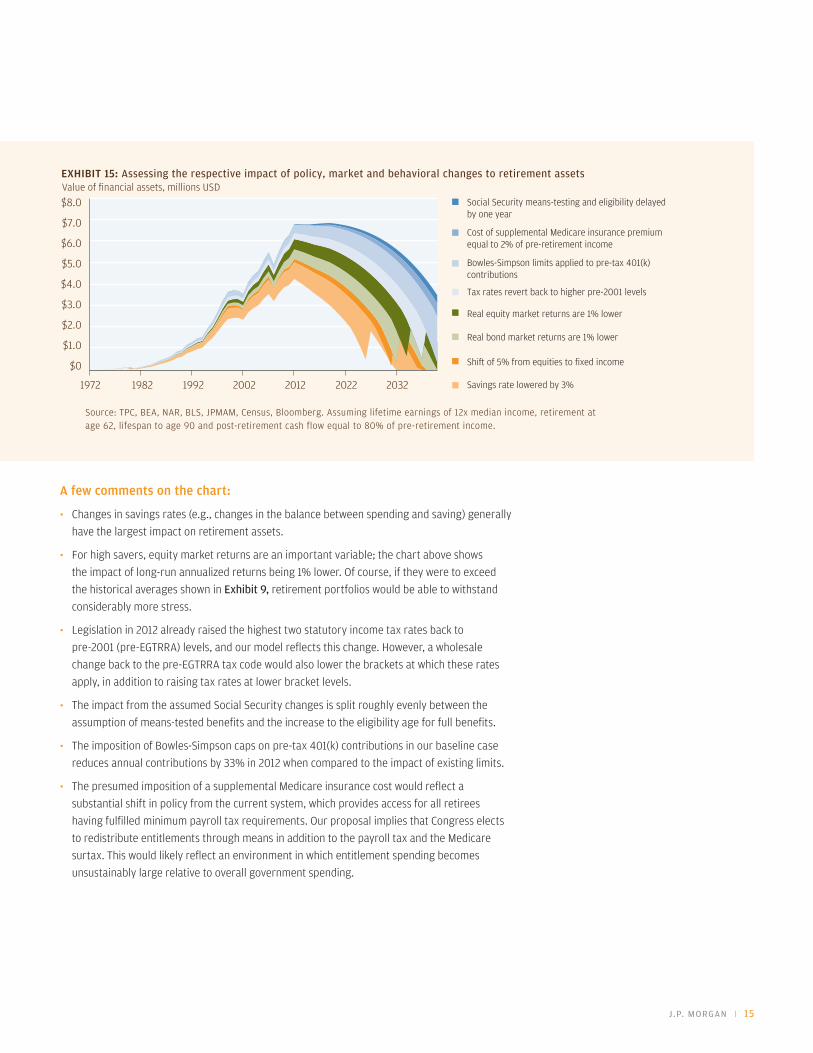
To be clear, all of these adverse policy, bond market and equity market changes might not happen at the same time, and some may not happen at all. So as a final step, we wanted to take a closer look at the individual impact of policy, market and behavioral changes. The next chart (Exhibit 15) takes a closer look at their respective impacts on retirement. We start with our baseline high saver, who is then subject to policy changes (the four blue wedges), lower equity and bond market returns (the green wedges), and eventually his/her own excessive spending and conservative investing decisions (orange wedges). The interaction between these variables is case dependent; the chart gives a general sense of their respective magnitude when starting with a high saver. If we had analyzed a low saver, the impact of Bowles-Simpson pre-tax 401(k) contribution limits, higher tax rates and lower equity market returns would be smaller, since the family has fewer savings balances to either curtail, tax or accrue.
Value of financial assets
J.P. MORGAN | 15
A few comments on the chart:
• Changes in savings rates (e.g., changes in the balance between spending and saving) generally have the largest impact on retirement assets.
• For high savers, equity market returns are an important variable; the chart above shows the impact of long-run annualized returns being 1% lower. Of course, if they were to exceed the historical averages shown in Exhibit 9, retirement portfolios would be able to withstand considerably more stress.
• Legislation in 2012 already raised the highest two statutory income tax rates back to pre-2001 (pre-EGTRRA) levels, and our model reflects this change. However, a wholesale change back to the pre-EGTRRA tax code would also lower the brackets at which these rates apply, in addition to raising tax rates at lower bracket levels.
• The impact from the assumed Social Security changes is split roughly evenly between the assumption of means-tested benefits and the increase to the eligibility age for full benefits.
• The imposition of Bowles-Simpson caps on pre-tax 401(k) contributions in our baseline case reduces annual contributions by 33% in 2012 when compared to the impact of existing limits.
• The presumed imposition of a supplemental Medicare insurance cost would reflect a substantial shift in policy from the current system, which provides access for all retirees having fulfilled minimum payroll tax requirements. Our proposal implies that Congress elects to redistribute entitlements through means in addition to the payroll tax and the Medicare surtax. This would likely reflect an environment in which entitlement spending becomes unsustainably large relative to overall government spending.
EXHIBIT 15: Assessing the respective impact of policy, market and behavioral changes to retirement assets
$1.0
$2.0
$3.0
$4.0
$5.0
$6.0
$7.0
$8.0
$0
1982 1992 2002 2012 2022 2032
Social Security means-testing and eligibility delayed by one year
Cost of supplemental Medicare insurance premium equal to 2% of pre-retirement income
Bowles-Simpson limits applied to pre-tax 401(k)contributions
Tax rates revert back to higher pre-2001 levels
Real equity market returns are 1% lower
Real bond market returns are 1% lower
Shift of 5% from equities to fixed income
Savings rate lowered by 3%
1972
Source: TPC, BEA, NAR, BLS, JPMAM, Census, Bloomberg. Assuming lifetime earnings of 12x median income, retirement at age 62, lifespan to age 90 and post-retirement cash flow equal to 80% of pre-retirement income.
$1.0
$2.0
$3.0
$4.0
$5.0
$6.0
$7.0
$8.0
$0
1982 1992 2002 2012 2022 2032
Social Security means-testing and eligibility delayed by one year
Cost of supplemental Medicare insurance premium equal to 2% of pre-retirement income
Bowles-Simpson limits applied to pre-tax 401(k)contributions
Tax rates revert back to higher pre-2001 levels
Real equity market returns are 1% lower
Real bond market returns are 1% lower
Shift of 5% from equities to fixed income
Savings rate lowered by 3%
1972
Value of financial assets, millions USD
16 | THE IMPORTANCE OF BEING EARNEST
The benefits of working (a little) longer
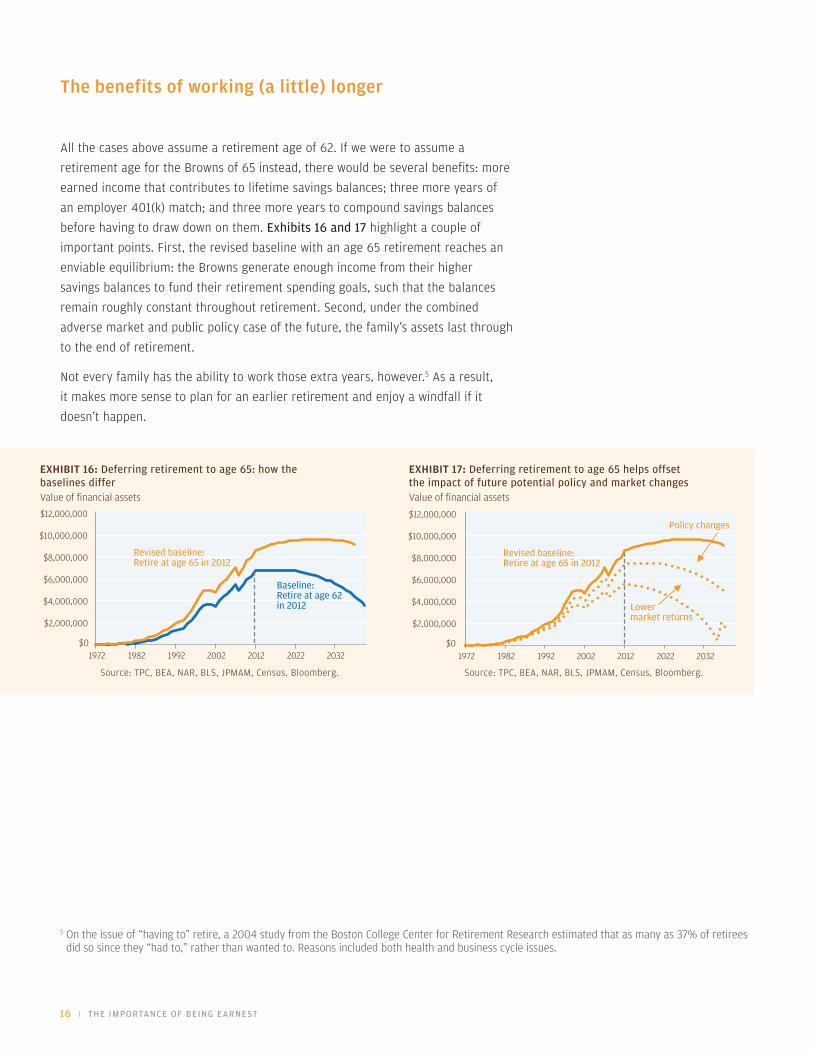
All the cases above assume a retirement age of 62. If we were to assume a retirement age for the Browns of 65 instead, there would be several benefits: more earned income that contributes to lifetime savings balances; three more years of an employer 401(k) match; and three more years to compound savings balances before having to draw down on them. Exhibits 16 and 17 highlight a couple of important points. First, the revised baseline with an age 65 retirement reaches an enviable equilibrium: the Browns generate enough income from their higher savings balances to fund their retirement spending goals, such that the balances remain roughly constant throughout retirement. Second, under the combined adverse market and public policy case of the future, the family’s assets last through to the end of retirement.
Not every family has the ability to work those extra years, however.5 As a result, it makes more sense to plan for an earlier retirement and enjoy a windfall if it doesn’t happen.
5 On the issue of “having to” retire, a 2004 study from the Boston College Center for Retirement Research estimated that as many as 37% of retirees did so since they “had to,” rather than wanted to. Reasons included both health and business cycle issues.
EXHIBIT 16: Deferring retirement to age 65: how the baselines differ
$0
$2,000,000
$4,000,000
$6,000,000
$8,000,000
$10,000,000
$12,000,000
1972 1982 1992 2002 2012 2022 2032
Revised baseline:Retire at age 65 in 2012
Policy changes
Lower market returns
$0
$2,000,000
$4,000,000
$6,000,000
$8,000,000
$10,000,000
$12,000,000
1972 1982 1992 2002 2012 2022 2032
Revised baseline:Retire at age 65 in 2012
Baseline:Retire at age 62 in 2012
Source: TPC, BEA, NAR, BLS, JPMAM, Census, Bloomberg.
EXHIBIT 17: Deferring retirement to age 65 helps offset the impact of future potential policy and market changes
Source: TPC, BEA, NAR, BLS, JPMAM, Census, Bloomberg.
Value of financial assets Value of financial assets

J.P. MORGAN | 17
S O M E C O N C L U S I O N S F O R W E A L T H Y F A M I L I E S
• Know what your savings rate is, including all your pre-tax contributions to savings plans. Ideally, it should be north of 20% for wealthy families like the Browns.
− Wealthy families generally spend 2.5x more in retirement than they initially contribute to savings
• Monitor investment risk in the assets you put aside for retirement. Underinvesting and overspending are a potentially toxic combination.
− Our overly conservative investor would need to spend 10% less in retirement or save 2% more every year to match the baseline case
• Be aware that deferring retirement by 2 to 3 years can substantially improve the trajectory of retirement assets, and allows for less savings in advance, and/or more post-retirement spending.
− Accelerating retirement by 2 years requires either a lifetime savings rate that’s 2% higher, or a 10%-15% further reduction in spending in retirement
• You should generally maximize all available forms of pre-tax savings that allow for tax-free compounding.
• The prior four decades of equity and bond market returns benefited from the Volcker disinflation, a phenomenon that is unlikely to repeat itself. As a result, long-term real returns over inflation may be modestly lower than in the past.
− For every 1% decline in lifetime savings rates, real equity returns need to rise by roughly 0.5% (it is hard to invest your way out of a hole)
• Congress has focused much of the deficit reduction burden on wealthy families earning more than $250,000 in adjusted gross income. In the future, they may continue to do so, through policies that increase effective tax rates, and limit pre-tax contributions to savings. Congress may also means-test the largest component of retiree spending (medical).
• Lifespans are gradually increasing, thus increasing the amount of assets families need in retirement.
− Every additional year you work adds financial assets sufficient to support an additional 3-4 years in retirement
In other words, being earnest about investing and saving, and frequently reassessing the viability of a retirement plan, is more important than ever.
18 | THE IMPORTANCE OF BEING EARNEST
Appendix 1: Savings rates, and what's ªnormalº for wealthy families
One of the most widely used concepts in economics is a “savings rate.” It’s meant to capture how much a family (or country) saves out of their potential ability to do so, with the remainder going to consumption, taxes and interest on debt. It sounds simple, but there are some important details that affect how it’s computed, particularly for wealthy families.
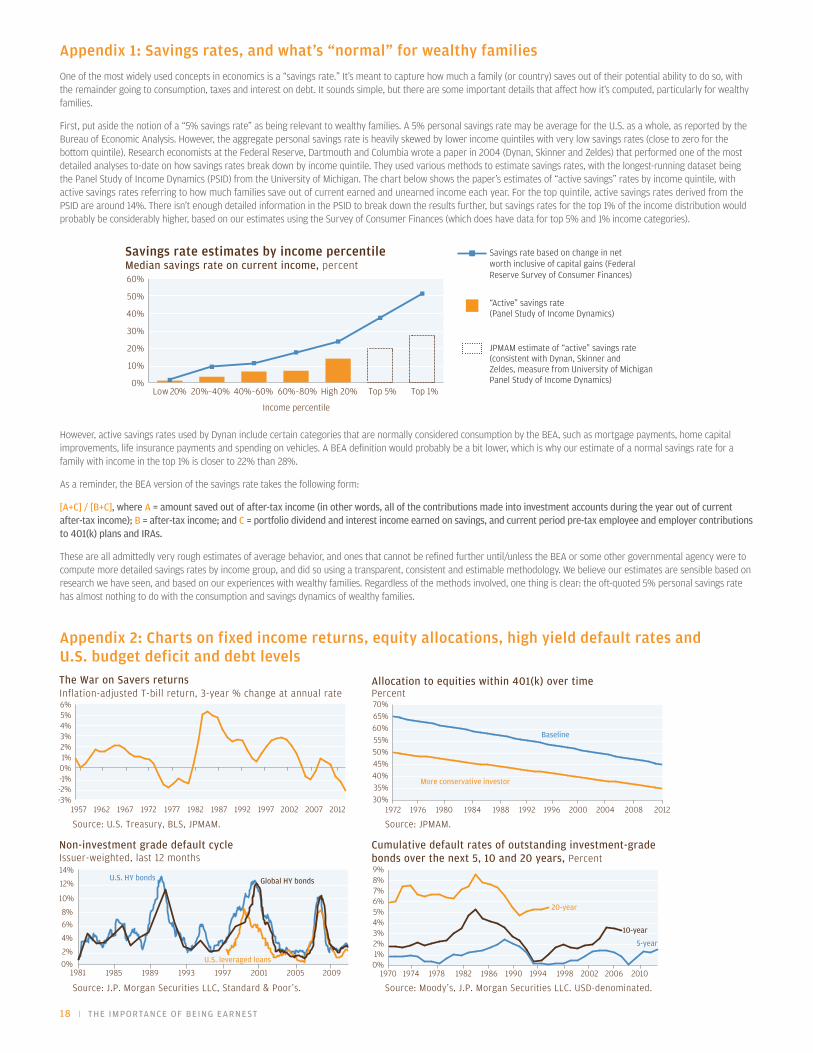
First, put aside the notion of a “5% savings rate” as being relevant to wealthy families. A 5% personal savings rate may be average for the U.S. as a whole, as reported by the Bureau of Economic Analysis. However, the aggregate personal savings rate is heavily skewed by lower income quintiles with very low savings rates (close to zero for the bottom quintile). Research economists at the Federal Reserve, Dartmouth and Columbia wrote a paper in 2004 (Dynan, Skinner and Zeldes) that performed one of the most detailed analyses to-date on how savings rates break down by income quintile. They used various methods to estimate savings rates, with the longest-running dataset being the Panel Study of Income Dynamics (PSID) from the University of Michigan. The chart below shows the paper’s estimates of “active savings” rates by income quintile, with active savings rates referring to how much families save out of current earned and unearned income each year. For the top quintile, active savings rates derived from the PSID are around 14%. There isn’t enough detailed information in the PSID to break down the results further, but savings rates for the top 1% of the income distribution would probably be considerably higher, based on our estimates using the Survey of Consumer Finances (which does have data for top 5% and 1% income categories).
Appendix 2: Charts on fixed income returns, equity allocations, high yield default rates and U.S. budget deficit and debt levels
However, active savings rates used by Dynan include certain categories that are normally considered consumption by the BEA, such as mortgage payments, home capital improvements, life insurance payments and spending on vehicles. A BEA definition would probably be a bit lower, which is why our estimate of a normal savings rate for a family with income in the top 1% is closer to 22% than 28%.
As a reminder, the BEA version of the savings rate takes the following form:
[A+C] / [B+C], where A = amount saved out of after-tax income (in other words, all of the contributions made into investment accounts during the year out of current after-tax income); B = after-tax income; and C = portfolio dividend and interest income earned on savings, and current period pre-tax employee and employer contributions to 401(k) plans and IRAs.
These are all admittedly very rough estimates of average behavior, and ones that cannot be refined further until/unless the BEA or some other governmental agency were to compute more detailed savings rates by income group, and did so using a transparent, consistent and estimable methodology. We believe our estimates are sensible based on research we have seen, and based on our experiences with wealthy families. Regardless of the methods involved, one thing is clear: the oft-quoted 5% personal savings rate has almost nothing to do with the consumption and savings dynamics of wealthy families.
Low 20% 20%–40% 40%–60% 60%–80% High 20% Top 5% Top 1%
Income percentile
0%
10%
20%
30%
40%
50%
60%
Savings rate based on change in net worth inclusive of capital gains (Federal Reserve Survey of Consumer Finances)
“Active” savings rate (Panel Study of Income Dynamics)
JPMAM estimate of “active” savings rate (consistent with Dynan, Skinner and Zeldes, measure from University of Michigan Panel Study of Income Dynamics)
Savings rate estimates by income percentileMedian savings rate on current income, percent
1981 1985 1989 1993 1997 2001 2005 2009
U.S. leveraged loans
Global HY bondsU.S. HY bonds
0%2%
4%
6%8%
10%
12%
14%
1957 1962 1967 1972 1977 1982 1987 1992 1997 2002 2007 2012-3%-2%-1%0%1%2%3%4%5%6%
1970 1974 1978 1982 1986 1990 1994 1998 2002 2006 2010
5-year
10-year
20-year
0%1%2%3%4%5%6%7%8%9%
1972 1976 1980 1984 1988 1992 1996 2000 2004 2008 2012
More conservative investor
Baseline
30%35%40%45%50%55%60%65%70%
The War on Savers returns Inflation-adjusted T-bill return, 3-year % change at annual rate
Allocation to equities within 401(k) over timePercent
Non-investment grade default cycle Issuer-weighted, last 12 months
Cumulative default rates of outstanding investment-grade bonds over the next 5, 10 and 20 years, Percent
Source: U.S. Treasury, BLS, JPMAM. Source: JPMAM.
Source: J.P. Morgan Securities LLC, Standard & Poor’s. Source: Moody’s, J.P. Morgan Securities LLC. USD-denominated.

J.P. MORGAN | 19
• “Do The Rich Save More?,” Dynan, Skinner and Zeldes, Journal of Political Economy, 2004.
• “Are You Sure You’re Saving Enough for Retirement?,” J. Skinner, Journal of Economic Perspectives, Summer 2007.
BEA = Bureau of Economic Analysis; BLS = Bureau of Labor Statistics; COBRA = Consolidated Omnibus Budget Reconciliation Act; CBO = Congressional Budget Office; COLA = Cost of living adjustments; EGTRRA = Economic Growth and Tax Relief Reconciliation Act of 2001; IRA = Individual Retirement Account; NAR = National Association of Realtors; OMB = Office of Management and Budget; TPC = Tax Policy Center; JPMAM = J.P. Morgan Asset Management
Sources
Appendix 3: Notes on the assumptions and calculations in our retirement model
SCENARIO ANALYSIS:
• Analyses are based on historical median income levels, home prices, caps on 401(k) and IRA contributions, equity, Treasury bonds and T-bill returns, tax rates by income quintile, and Social Security benefits accumulation formulas. In the scenario analyzing the future, we use the same historical data, modified by policy options discussed above (e.g., lower caps on pre-tax savings plans, higher tax rates and lower market returns).
AGES AND EARNINGS:
• The family is assumed to begin their savings journey at age 25 with no accumulated financial assets.
• The family does not have any sources of earned income during retirement. While most Americans over age 65 no longer work, significant subsets do. BLS data show that 30%, 18% and 7% of those aged 65–69, 70–74 and 75+ were employed in 2012.
• The model estimates a family’s financial assets until age 90. We picked this age since it is roughly five years beyond the life expectancy for wealthy individuals that reach the age of 70.
SOCIAL SECURITY PAYMENTS:
• We computed Social Security benefits using actual historical indexing factors and income growth, and added benefits paid at a rate of 50% to non-working spouses.
• The recipients take Social Security payments when they are eligible for full payments at age 66. A substantial amount of Americans take accelerated Social Security (eligibility begins at 62), but such payments are paid at a discount.
• Means-testing of Social Security, when applied in our model, takes two forms. First, current law taxes a maximum of 85% of Social Security benefits. Means-testing would probably subject 100% of Social Security benefits to taxation. Second, Social Security means-testing would probably curtail benefits for higher income individuals. Currently, there are caps on income subject to Social Security and on benefits received. In our model, when means-testing takes place, the cap on taxes is effectively raised higher than the cap for monthly benefits, creating a net loss for high income recipients.
CASH FLOW MANAGEMENT AND HOME OWNERSHIP:
• Families are assumed to avoid making discretionary 401(k) distributions whenever possible, drawing down on after-tax savings accounts first to meet their spending needs. Mandatory 401(k) distributions are assumed to take place starting at age 71; both mandatory and discretionary 401(k) distributions are taxed when received.
• The family is assumed to make “catch-up contributions” to their 401(k) plan. Such contributions allow individuals who are age 50 or over to make additional contributions above the normal limit.
• When the sum of mandatory distributions, Social Security benefits and home sale proceeds are greater than the targeted cash flow for that year, the difference is deposited into the family’s savings account.
• The down payment required for the home is 20%; by retirement, the home is assumed to be owned free and clear with no debt. In all scenarios included in this paper, the family purchases a home that is worth ten times the median home price. They are assumed to postpone employee and employer 401(k) contributions until they have saved enough for the down payment, using both foregone contributions and other after-tax savings as down payment proceeds. If the family cannot afford the full down payment by year 10, they are assumed to purchase a home at the implied prorated value. During retirement, if both savings accounts and 401(k) balances have been depleted, the home is sold at prevailing prices. We do not assume any future increase in the current $500K residence exclusion for capital gains tax purposes.
RETURNS AND INFLATION:
• Annual equity, bonds/T-bill, inflation and home price appreciation estimates for the post-retirement period: 7%, 4%, 2% and 2%, respectively. For tax purposes, 80% of equity gains in after-tax savings accounts are assumed to be realized each year.
TAXATION:
• The model applies the prevailing tax code to retirement cash flows, incorporating base and personal exemptions, itemized deductions and applicable limits, Medicare surtaxes on unearned income, AMT considerations, etc. Tax brackets are indexed to inflation.
• Pease limitations were first introduced as part of the Omnibus Budget Reconciliation Act of 1990. They were designed to limit itemized deductions (i.e., mortgage interest, state and local taxes, charitable contributions) for high income earners. These limitations were scaled back in 2001 as part of the Economic Growth and Tax Relief Reconciliation Act. They were then restored in 2013 in order to raise revenue once again. They limit certain itemized deductions by the lesser of (a) 3% of the amount by which adjusted gross income exceeds a given threshold ($300,000 in 2013) and (b) 80% of itemized deductions.

IRS Circular 230 Disclosure: JPMorgan Chase & Co. and its affiliates do not provide tax advice. Accordingly, any discussion of U.S. tax matters contained herein (including any attachments) is not intended or written to be used, and cannot be used, in connection with the promotion, marketing or recommendation by anyone unaffiliated with JPMorgan Chase & Co. of any of the matters addressed herein or for the purpose of avoiding U.S. tax-related penalties. Note that J.P. Morgan is not a licensed insurance provider.The material contained herein is intended as a general market commentary. Opinions expressed herein are those of Michael Cembalest and may differ from those of other J.P. Morgan employees and affiliates. This information in no way constitutes J.P. Morgan research and should not be treated as such. Further, the views expressed herein may differ from that contained in J.P. Morgan research reports. The above summary/prices/quotes/statistics have been obtained from sources deemed to be reliable, but we do not guarantee their accuracy or completeness, any yield referenced is indicative and subject to change. Past performance is not a guarantee of future results. References to the performance or character of our portfolios generally refer to our Balanced Model Portfolios constructed by J.P. Morgan. It is a proxy for client performance and may not represent actual transactions or investments in client accounts. The model portfolio can be implemented across brokerage or managed accounts depending on the unique objectives of each client and is serviced through distinct legal entities licensed for specific activities. Bank, trust and investment management services are provided by JPMorgan Chase Bank, N.A., and its affiliates. Securities are offered through J.P. Morgan Securities LLC (JPMS), member NYSE, FINRA and SIPC, and its affiliates globally as local legislation permits. Securities products purchased or sold through JPMS are not insured by the Federal Deposit Insurance Corporation (FDIC); are not deposits or other obligations of its bank or thrift affiliates and are not guaranteed by its bank or thrift affiliates; and are subject to investment risks, including possible loss of the principal invested. Not all investment ideas referenced are suitable for all investors. Speak with your J.P. Morgan Representative concerning your personal situation. This material is not intended as an offer or solicitation for the purchase or sale of any financial instrument. Private Investments may engage in leveraging and other speculative practices that may increase the risk of investment loss, can be highly illiquid, are not required to provide periodic pricing or valuations to investors and may involve complex tax structures and delays in distributing important tax information. Typically such investment ideas can only be offered to suitable investors through a confidential offering memorandum that fully describes all terms, conditions and risks. High yield bonds are speculative non-investment-grade bonds that have higher risk of default or other adverse credit events that are appropriate for high-risk investors only. Investments in commodities carry greater volatility than investments in traditional securities. There are additional risks associated with international investing and may not be suitable for all investors. This material is distributed with the understanding that J.P. Morgan is not rendering accounting, legal or tax advice. You should consult with your independent advisors concerning such matters. Bank products and services are offered by JPMorgan Chase Bank, N.A. and its affiliates. Securities are offered by J.P. Morgan Securities LLC, member NYSE, FINRA and SIPC, and other affiliates globally as local legislation permits.In the United Kingdom, this material is approved by J.P. Morgan International Bank Limited (JPMIB) with the registered office located at 25 Bank Street, Canary Wharf, London E14 5JP, registered in England No. 03838766 and is authorized by the Prudential Regulation Authority and regulated by the Financial Conduct Authority and Prudential Regulation Authority. In addition, this material may be distributed by: JPMorgan Chase Bank, N.A. (JPMCB) Paris branch, which is regulated by the French banking authorities Autorité de Contrôle Prudentiel and Autorité des Marchés Financiers; J.P. Morgan (Suisse) SA, regulated by the Swiss Financial Market Supervisory Authority; JPMCB Dubai branch, regulated by the Dubai Financial Services Authority; JPMCB Bahrain branch, licensed as a conventional wholesale bank by the Central Bank of Bahrain (for professional clients only).In Hong Kong, this material is distributed by JPMorgan Chase Bank, N.A. (JPMCB) Hong Kong branch except to recipients having an account at JPMCB Singapore branch and where this material relates to a Collective Investment Scheme, in which case it is distributed by J.P. Morgan Securities (Asia Pacific) Limited (JPMSAPL). Both JPMCB Hong Kong branch and JPMSAPL are regulated by the Hong Kong Monetary Authority. In Singapore, this material is distributed by JPMCB Singapore branch except to recipients having an account at JPMCB Singapore branch and where this material relates to a Collective Investment Scheme, in which case it is distributed by J.P. Morgan (S.E.A.) Limited (JPMSEAL). Both JPMCB Singapore branch and JPMSEAL are regulated by the Monetary Authority of Singapore. With respect to countries in Latin America, the distribution of this material may be restricted in certain jurisdictions. Receipt of this material does not constitute an offer or solicitation to any person in any jurisdiction in which such offer or solicitation is not authorized or to any person to whom it would be unlawful to make such offer or solicitation. Each recipient of this presentation, and each agent thereof, may disclose to any person, without limitation, the U.S. income and franchise tax treatment and tax structure of the transactions described herein and may disclose all materials of any kind (including opinions or other tax analyses) provided to each recipient insofar as the materials relate to a U.S. income or franchise tax strategy provided to such recipient by JPMorgan Chase & Co. and its subsidiaries. Should you have any questions regarding the information contained in this material or about J.P. Morgan products and services, please contact your J.P. Morgan private banking representative. Additional information is available upon request. “J.P. Morgan” is the marketing name for JPMorgan Chase & Co. and its subsidiaries and affiliates worldwide. This material may not be reproduced or circulated without J.P. Morgan’s authority. © 2013 JPMorgan Chase & Co. All rights reserved. 0513-0578-01

E U R O P EFrance GermanyItalySpainSwitzerlandUnited Kingdom
A S I A Hong KongSingapore
A M E R I C A SUnited StatesBrazil ChileColombiaMexicoPeru
M I D D L E E A S TDubai
W O R L D H E A D Q U A R T E R S 270 Park AvenueNew York, NY 10017