the implications of digital agriculture and big data for
TRANSCRIPT

research report
August 2018
The impacts of energy costs on the Australian agriculture sector
© 2018 Australian Farm InstituteISBN 978-1-921808-43-2

© Australian Farm Institute, August 2018
This publication is protected by copyright laws. Apart from any use permitted under the Copyright Act 1968, no part may be reproduced by any process without the written permission of the publisher:
Australian Farm Institute Limited
Suite 73, 61 Marlborough StreetSurry Hills NSW 2010AUSTRALIAABN 29 107 483 661T: 61 2 9690 1388F: 61 2 9699 7270E: [email protected]: www.farminstitute.org.au
All rights reserved
The views and opinions expressed in this publication are those of the authors and do not necessarily reflect those of the Board of the Australian Farm Institute or the Institute’s members or corporate sponsors.
Disclaimer
The material in this Report is provided for information only. At the time of publication, information provided is considered to be true and correct. Changes in circumstances after publication may impact on the accuracy of this information. To the maximum extent permitted by law, the Australian Farm Institute disclaims all liability for any loss, damage, expense and/costs incurred by any person arising from the use of information contained in this Report.
This project was funded by Energy Consumers Australia (www.energyconsumersaustralia.com.au) as part of its grants process for consumer advocacy projects and research projects for the benefit of consumers of electricity and natural gas.
The views expressed in this document do not necessarily reflect the views of Energy Consumers Australia.
Publication Data
Heath, R, Darragh, L & Laurie, A (2018), The impacts of energy costs on the Australian agriculture sector, Research Report, Australian Farm Institute.
ISBN 978-1-921808-43-2 (Print and Web)
Editor: Katie McRobert Designer: Sally Beech
Images: iStock, grandriver

iii
The impacts of energy costs on the Australian agriculture sector | August 2018
Foreword
The impact of energy costs on the Australian agriculture sector
The cost of energy as a proportion of production costs in Australian agriculture has significantly increased in the past five years. Australian farm businesses have been becoming more energy efficient for some time, however recent energy price rises – up to 100% in the last five years in some examples – have outstripped the sector’s ability to match price rises with efficiency gains. The significance of energy costs to agriculture is being amplified by moves in many sectors to more energy-intensive practices, for example pressurised irrigation, to achieve efficiency gains in other areas such as water use.
Energy price rises are an economy-wide problem and have fuelled intense political debate about appropriate policy to provide reliable and affordable energy. Australian industry – including agriculture – is rapidly becoming uncompetitive against countries with cheaper and more reliable power.
Data on the cost of energy to Australian agriculture at a sectoral level is surprisingly sparse. The energy policy debate has thus occurred in an environment where there has been limited ability to estimate the sectoral and value chain impact of policy changes affecting the price of energy.
The research reported here has compiled available data and estimated the overall cost of energy to agriculture and for sub-sectors and value chain components. The data has been built into the Energy Cost Calculator (available at www.farminstitute.org.au) which can be used to model the impact of energy price changes on Australian agriculture. The Energy Cost Calculator will be a useful and timely aid for providing impact context to the ongoing discussion about energy policy.
Richard Heath
Executive Director
Australian Farm Institute
August 2018

August 2018 | The impacts of energy costs on the Australian agriculture sector
iv
Table of contents
Foreword iii
Table of contents iv
List of figures vi
List of tables vii
Executive summary viii
1. Introduction 1
Background 1 Methods 3 Common cross-sectoral inputs 4
2. Sector analysis 7
Summary 7 Beef 8 Energy cost analysis 11
Sheep 13 Energy cost analysis 15
Pork 17 Energy cost analysis 18
Poultry – Chicken meat 20 Energy cost analysis 21
Poultry – Eggs 23 Energy cost analysis 24
Dairy 25 Energy cost analysis 27
Grains 29 Energy cost analysis 30
Cotton 31 Energy cost analysis 33

The impacts of energy costs on the Australian agriculture sector | August 2018
v
Table of contents (continued)
Sugar 34 Energy cost analysis 36
Horticulture 38 Energy cost analysis 39
Wine grapes 41 Energy cost analysis 42
3. Results and discussion 44
Results 44 Discussion 46
4. Impact of future practice, renewables and alternative energy sources 47
Case Study: Chillamurra Solar Farm, Meralli Projects 48
Case Study: Solar Pumping at Waverleigh, Narromine 50
Case Study: Nectar Farms High-tech Glasshouse and Bulgana Green Power Hub 52
5. Conclusion 54
6. References 56

August 2018 | The impacts of energy costs on the Australian agriculture sector
vi
Listoffigures
Figure 1: Indexed energy productivity performance of industry. 1
Figure 2: The beef value chain. 9
Figure 3: Energy use efficiency in red meat processing. 10
Figure 4: Sheepmeat supply chain. 13
Figure 5: Typical steps and procedures in the chain of production of wool fibres. 14
Figure 6: The wool supply chain from Australia to global consumer. 16
Figure 7: Dairy supply chain map. 28

The impacts of energy costs on the Australian agriculture sector | August 2018
vii
List of tables
Table 1: Average electricity and gas use per tonne of manufactured feed. 4
Table 2: Average energy input: gigajoules per tonne product. 5
Table 3: Impact of an energy price change on the red meat sector. 11
Table 4: Impact of energy price change on the sheep (meat and wool) sector. 15
Table 5: Impact of energy price change on the pork sector. 18
Table 6: Impact of energy price change on the chicken meat sector. 21
Table 7: Impact of energy price change on the egg sector. 24
Table 8: Impact of energy price change on the dairy sector. 27
Table 9: Impact of energy price change on the grains sector. 30
Table 10: Breakdown of the median energy use results across 40 growers for the seven major processes in irrigated cotton production,. 32
Table 11: Impact of energy price changes on cotton sector. 33
Table 12: Impact of energy price changes on the sugar sector. 36
Table 13: Impact of energy price changes to horticulture sector. 39
Table 14: Impact of energy price change on the wine and grape sector. 42
Table 15: Estimated impact of energy costs on the Australian agricultural sector. 44
Table 16: Total estimated cost of energy (by energy source) used by the Australian agricultural sector (by supply chain sector). 45
Table 17: Total estimated cost of energy used by the Australian agricultural sector (excluding processing) as a proportion of GVP. 45
viii
X.0 XXXXX
August 2018 | The impacts of energy costs on the Australian agriculture sector
Executive summary
Energy is a critical component and significant cost of agricultural production. Traditionally, energy inputs have formed a relatively small proportion of overall production and post-farm and processing costs. However, the trend of increasing energy costs, particularly electricity, and the impact of these costs on production and profitability are becoming increasingly important issues. Access to affordable reliable energy is imperative for continued sustainability and enhanced growth in the agricultural sector.
Australian farms and agribusinesses operate in a highly competitive business environment, and as production systems intensify and utilise additional energy-intensive technology, their dependence on energy inputs increases. Thus, the ability of agricultural businesses to remain globally competitive in this environment will be heavily dependent on the proportionate cost of energy.
The fluctuation of energy costs is not a new issue for agriculture. Until recently, the relative importance of energy as an agricultural business cost has been mitigated by strong business performance and efficiency. A significant driver of the research reported here was the rapidly increasing energy prices experienced by consumers over the past two decades, as well as the factors influencing future price changes, which are currently the subject of intense public and political debate. With a dramatic increase (based on consumer price index) of 80 to 90% in retail electricity prices in the past decade (ACCC, 2017), it is expected that energy cost as a proportion of agricultural production costs has increased consequentially, particularly in the intensive sub-sectors.
Despite the increasing impact of energy costs on farm business profitability, there have been few recent investigations into energy use in the agricultural sector specifically related to the cost burden and sectoral impacts of changing energy prices. Previous studies into energy use in agriculture have predominately focused on life cycle assessments and efficiency measures, rather than financial impact.
The aim of this research was to provide an analysis of the financial cost of energy used in Australian agriculture suitable for evaluating the impact of energy price changes on the agricultural sector overall, as well as commodity sub-sectors. This will enable a more informed discussion of the economic impact of changes in the price of energy on the sector.
A comprehensive review of literature was conducted in an effort to find the best available official sources of quantitative data on energy use in agriculture. Sub-sector data comprised farm level audits, industry benchmarking reports, life cycle assessment studies and Australian Bureau of Agricultural and Resource Economics and Sciences (ABARES) and Australian Bureau of Statistics (ABS) audit and survey data. There was a large variation in data sources in terms of units and scale of reporting, level of segregation of the data, extent of the supply chain the data covered and sampling framework. A significant amount of aggregation, disaggregation, conversion and extrapolation was required to be able to build a database that reported in a consistent fashion across sub-sectors.
The aggregated energy use data is detailed in the Energy Cost Calculator which is the primary output from this research. The calculator allows

Executive Summary ix
The impacts of energy costs on the Australian agriculture sector | August 2018
interrogation of the energy use data with user-inputted energy price points. To demonstrate the purpose and operation of this tool, a calculation has been performed to estimate the total cost of energy for the Australian agriculture sector using current average energy price benchmarks. The calculator is available for use at www.farminstitute.org.au
The values used to model price increases were selected on the basis that they are representative of the scale of recent increases. Investigation and commentary on potential price changes as a result of various policy positions was beyond the scope of this report, however the Energy Cost Calculator has been designed so that the impact of any price changes (either up or down) to energy inputs can be calculated.
The sectors included in the analysis were grains, beef, dairy, chicken meat, sheep, horticulture (vegetables), cotton, sugar, wine grapes, pork and eggs. Energy costs were categorised into four value chain segments: inputs, production, transport and post-farm / processing. The total cost of energy for these sectors and value chain segments was estimated to be $5.8 billion annually. This is likely to be a conservative estimate as there were many data gaps, particularly in the post-farm and processing components of the agricultural value chain.
The relative impact of energy costs on agriculture was assessed by comparing the cost of energy in each sector relative to corresponding gross values of production (GVP). Pre-processing energy costs were equal to 9% of the GVP of the sectors evaluated. Energy- intensive sectors such as sugar and dairy had energy costs equivalent to 16% and 13% of GVP respectively, while lower intensity sectors such as beef and sheep incurred respective energy costs equal to 7% and 6% of GVP.
The results of the research show that fuel (diesel, petrol and oil) is the biggest cost of energy for Australian agriculture at $2.5 billion annually and electricity costs are marginally behind at a total of $2.4 billion, or a direct cost to farm businesses of approximately $1.4 billion and $1.2 billion respectively.
For the purpose of this report and to demonstrate the use of the calculator a price increase of 30% for electricity and 5% for all other sources was calculated, reflecting the recent experiences of energy consumers. A price rise of this scale would result in $863 million in increased annual energy costs for the agricultural sector.
The authors recognise that individual business exposure to energy price impacts on profitability will vary enormously.
The absence of reliable energy use data, the complex nature of tariff structures and network and supply charges, and the differences in energy pricing and policy settings across Australian states have required this report to adopt a ‘big picture’ approach to quantifying energy costs for agriculture.
Key points• Analysisofthefinancialcostofenergy
used in Australian agriculture will enable a more informed discussion of the economic impact of changes in the price of energy on the sector.
• Industry-level data on the cost impact of energy prices for Australian farm businesses is inconsistent and piecemeal. For more informed debate on the cost impact of energy price changes,aunifiedapproachtocollectingconsistent data on the cost of energy use as a critical farm input is required.
• The cost of energy used by the Australian agricultural sector is estimated as $5.85 billion pa.
• Energy costs incurred pre-processing are equal to 9% of the gross value of production of the sectors analysed.
• The annual cost of electricity to Australian farm businesses is $1.2 billion.


1
The impacts of energy costs on the Australian agriculture sector | August 2018
X.0 XXXXX
1
1. Introduction
BackgroundAgriculture is the fourth most energy-intensive industry in Australia, behind manufacturing, transport and mining (Clean Energy Finance Corporation, 2015). Most sectors of Australian industry have experienced significant gains in energy productivity over the past decade, except for agriculture, where energy productivity has declined by more than 21% since 2008 (Figure 1) (Agriculture Industries Energy Taskforce, 2017). This trend is likely to continue, despite advances in technology and investment in efficiency measures which have resulted in production and processing optimisation throughout supply chains.
In a submission to the Standing Committee on Environment and Energy enquiry into Modernising Australia’s Electricity Grid, the Australian Agriculture Industries Energy Taskforce (2017) suggested that an increased reliance on alternative methods of energy generation, such as diesel, is
responsible for declining energy productivity in the sector. The Australian Agriculture Industries Energy Taskforce (2017), Eyre (2016), and the National Irrigators’ Council (2014) blame the continual rise in network and supply charges for this shift in dependence, claiming that network charges typically represent around 50% of farmers’ electricity bills (environmental charges make up around 20% and electricity usage less than 26%, with the remaining 4% being administration charges).
Energy productivity and costs are not new issues, although their importance to business profitability in recent years may have been overshadowed by a series of generally good farm business performance data and the orientation of many agricultural industries towards more environmental, sustainability-driven efficiency gains. As a result, the competitive advantage associated with relatively low production costs previously held by Australian producers and agribusinesses has diminished and
Figure 1: Indexed energy productivity performance of industry. Source: Agriculture Industry Energy Taskforce (2017).

August 2018 | The impacts of energy costs on the Australian agriculture sector
SECTION 1: Introduction2
continues to decline as rising energy costs impact production systems and their constituent supply chains. Energy costs cannot be redistributed easily along supply chains, meaning that more energy-intensive segments of the supply chain are likely to incur a proportionally higher cost than less intensive segments.
Improving agricultural energy productivity largely depends on access to affordable electricity, however over-investment to enhance reliability comes at the expense of affordability. Compounding the issue of Australian energy policy, or lack thereof, is insufficient information regarding current and potential impacts on agriculture as a result energy price rises, and subsequent effects on individual sub-sectors.
Energy use in agricultural production has been widely reported as part of life cycle assessment (LCA) studies. Renouf and Fujita-Dimas (2013) report that between 2003–13 there were approximately 75 agriculture-related LCAs published, covering 38 of Australia’s 47 key agricultural commodities. Livestock (including beef and dairy) was most widely investigated, followed by wheat and sugarcane, and good coverage was reported for poultry and pigs. It was noted that with relatively standardised production systems, a small number of well-selected studies can provide a good representation of the industry in general. For other commodities, case studies and regional assessments have been completed and provide limited insight into energy use across the agricultural sector.
Broadly, there have been few recent investigations into the cost of energy used by the agricultural sector, and even less on cost impacts related to predicted energy price increases. However, some initiatives do exist, with current projects including:
• National Centre for Engineering in Agriculture (NCEA)
• NSW Farmers AgInnovators
Solar Powered Pumping Initiative
Reducing Energy Costs in Dairy
Water and Energy Nexus Initiative
Farm Energy Innovation Program (EEIG)
• Australian Alliance for Energy Productivity
• Queensland Farmers’ Federation (QFF) Energy Savers Program
Commissioned by the Rural Industries Research and Development Corporation (RIRDC) – now AgriFutures Australia – Chen, Maraseni, Banhazi, and Bundschuh (2015) established on-farm energy use benchmarks for a range of agricultural industries. The Benchmarking Energy Use On Farm report analysed direct energy demands for key agricultural industries to the farm gate. The study focused on the need to reduce energy use and associated greenhouse gas (GHG) emissions, rather than address the steep rise in energy prices. The research considers the wider body of literature on energy in agriculture, where key findings include large variations in direct on-farm energy use due to differences in methodology and assumptions as well as data collection processes.
Despite believing that it may be appropriate to draw conclusions from overseas research, the authors also warn that it is difficult to rely on or apply overseas research results due to variability in climate, farming systems and industry structures. Therefore, it is important for key industry groups and the wider agricultural community to become more engaged in understanding energy use, how energy prices are currently affecting agriculture and how agriculture will remain sustainable in the long run, given the likelihood of continued growth in energy prices.
Research on quantifying energy use and costs throughout supply chains is limited. Most of the recent work on energy use in agriculture has been undertaken as part of broader LCA studies and the measurement of GHG emissions for environmental sustainability reporting. Subsequently, this research has focused on increasing energy efficiency, mostly at the farm and processing level, to meet energy reduction targets for industries, rather than an assessment on cost impacts and reduced costs for producers/operators.
Most case study data and consultation with industry to date has indicated significant increases in energy

The impacts of energy costs on the Australian agriculture sector | August 2018
SECTION 1: Introduction 3
costs as a proportion of production costs, providing evidence of increases of up to 100% in the past five years, rising on average by 35% in the past two years alone. The Australian Bureau of Agricultural and Resource Economics and Sciences (ABARES) has forecast a 21% reduction in the real net value of farm production to $19 billion in 2017–18, due to lower crop production and prices and expected input cost increases, such as electricity and fuel (ABARES, 2017a). In the September quarter of 2017, retail electricity prices increased by 11% year-on-year, reflecting large increases in wholesale energy prices. Retail prices for diesel and unleaded petrol have increased since June 2017 in line with international crude oil prices, which are expected to average higher in 2017–18. Higher oil prices are expected to flow through to the cost of fertilisers.
Given the upward projections of energy prices, understanding energy use and costs at the whole of agriculture, sectoral and sub-sectoral level is essential for assessing both the current impacts of energy price rises on the viability of businesses within the sector and the future state of Australian agriculture. More importantly, a thorough understanding of the current situation and outlook is fundamental to the creation and implementation of fair, affordable and sustainable energy policies and encourage the industry to be more involved in ongoing debates on energy strategy.
MethodsIn the absence of standardised guidelines for the collection and reporting of data on energy use and cost, four broad cross-sectoral value chain segments were selected to categorise energy inputs, processes, and the associated costs:
1. Inputs
• The energy required to produce the inputs used in agricultural production. This segment was split into four common cross-sectoral inputs;
Stock feed
Fertiliser
Crop and pasture chemicals
Livestock materials
2. Production
• The energy required for on-farm production activities
3. Transport
• Diesel use and costs associated with transport of the commodity across the supply chain
4. Post-farm/processing
• The energy required for primary processing of agricultural goods.
This broad categorisation ensured some level of consistency in analysis and data reporting, while providing enough differentiation to be able to identify differences in levels of energy intensity between the value chain segments of different sectors.
Energy use data for each of the segments and sub-segments were compiled into the Energy Cost Calculator which allows conversion of use to cost. A base analysis was then performed using a standard set of energy prices, sourced from various publications.
To demonstrate the functionality of the calculator, embedded formulas were used to model the cost impact of an increase to energy prices, against baseline energy costs. A 30% increase in the baseline electricity price was modelled with a 5% increase to all other energy sources, respectively. This scenario was selected in consideration of the current policy environment and the reported price trends of electricity. A consideration in modelling gas, diesel and petrol prices was the volatility of markets in which these commodities operate. For example, petrol, diesel and gas are bought and sold in their own markets, each being regionally based with linkages and transactions between these markets. Prices in regional markets are impacted by international wholesale markets and reflect the supply and demand balance in each market, competition, transport and services as

August 2018 | The impacts of energy costs on the Australian agriculture sector
SECTION 1: Introduction4
well as the physical characteristics and quality of each commodity. Due to the price volatility, it is inherently difficult to account for all circumstances using variable energy costs, meaning that focussing on relevant longer-term price trends is more important than focusing on volatile price movements (i.e. daily or week-to-week) (Australian Institute of Petroleum, 2018).
Detailed assumptions are given to clearly define the scope of the project. It has remained important throughout the research to clearly communicate how total energy use and costs for agriculture have been calculated and what components have been included in the calculations. This is due to the limitations in accessing energy use data, the complexities associated with energy pricing and cost implications determined by consumption, in addition to the complexity of tariff structures. A series of conversion factors adopted in the analysis are also presented. The research has assumed energy use as constant. This is due to the lack of time series energy use data for sub-sectors.
The set of base energy prices used were selected after extensive investigation of available information of national energy prices and official international energy prices. These prices serve as basis for all energy cost estimates displayed in the Energy Cost Calculator and have been applied throughout the work. Every effort was taken to determine an average price for each selected energy source that was reflective of the prices paid by a wide range of agricultural industry stakeholders.
Determining energy price points for whole of agriculture analysis was almost as problematic as collecting the energy use data. Electricity prices are particularly difficult to define in average terms as the price paid by individual businesses comprises several components, each of which can be influenced by factors such as business size, contract arrangements, and state government policy.
Common cross-sectoral inputs
Feed (manufactured feed)
The domestic animal feed industry supplies inputs for beef and dairy cattle, layer and poultry
chickens, pigs, sheep, horses, aquaculture and other smaller industries, with the bulk of feed consumed by the beef, dairy cattle, and chicken industries respectively. The Stock Feed Manufacturers Council of Australia (SFMCA) predict that total feed demand is likely to increase from around 13 million tonnes reported in 2015–16 to in excess of 14 million tonnes by 2024–25 (Spragg, 2016).
In the manufacture of feed, energy input is high. The SFMCA reports on energy consumption related to the manufacturing process of stock feeds (excluding pasture grazing, hay and silage) (Table 1).
Table 1: Average electricity and gas use per tonne of manufactured feed.
Source: SFMCA, 2017.
Source Use
Electricity 27.9 kWh/T
Gas (combined natural gas and LPG) 0.22 GJ/T
The SFMCA Energy Use Survey Report (2017) provided the most suitable energy estimates for the purpose of the research. The quoted average electricity and gas use per tonne of manufactured feed were referenced throughout the Energy Cost Calculator.
Average use estimates were based on data submitted by 48 feed mills on a voluntary basis. The majority of mills which participated produce both mash and pellet feed. There was a significant range of electricity and gas used per tonne of feed. This reflected the different mill types, feeds manufactured, boiler installation and product mix, including the length of production runs (Stock Feed Manufacturers’ Council of Australia, 2017).
Fertiliser
The Australian fertiliser industry is made up of manufacturers (who also import inputs), importers, agents, overseas suppliers and distributors. Industrial fertilisers for use in agricultural production are sourced from both domestic and international fertiliser manufacturers and distributors.

The impacts of energy costs on the Australian agriculture sector | August 2018
SECTION 1: Introduction 5
The manufacture of fertiliser products is energy intensive. Prices are linked broadly to those of the energy market and more closely to the natural gas market. Fertiliser application varies greatly depending on production region, climate conditions and production system.
Energy use associated with the manufacturing of selected fertiliser processes and products was sourced from the International Fertiliser Industry Association (IFIA). An average energy input, gigajoule per tonne (GJ/tonne), was based on the energy input per tonne of production for urea, monoammonium phosphate (MAP) and diammonium phosphate (DAP) (International Fertiliser Industry Association, 2009). A breakdown of the energy input for each selected fertiliser is reported in Table 2.
Table 2: Average energy input: GJ/tonne product.
Source: International Fertiliser Industry Association, 2009.
Product Energy input (accumulated in process)
Urea 24.3
MAP 2.2
DAP 5.7
Average 10.73
Natural gas is the main feedstock for fertiliser production worldwide. It is assumed throughout the research that natural gas is the primary cost component of fertiliser manufacturing. For reporting purposes, an average natural gas price was applied for all fertiliser components of the calculator.
Crop and pasture chemicals
The Australian Pesticides and Veterinary Medicines Authority (APVMA) (2017) reported that agricultural (pesticides) product sales for the 2015–2016 financial year were around $2.9 billion. Total sales for veterinary medicines were almost $874 million, however the proportion associated with agricultural production has not been reported.
In the absence of public information on energy consumption associated with manufacture of agricultural crop and pasture chemicals, several data sources were included in the analysis to provide a sensible energy cost estimate.
In deriving an energy cost for crop and pasture chemicals for each sector, energy data was collected from ABARES Agsurf data and from Syngenta. A per farm average for the cost of crop and pasture chemicals was sourced from ABARES (2018b). An energy intensity factor in the form megajoules (MJ)per dollar of sales and percentage of electricity and gas use were applied to estimate a total energy cost (Syngenta, 2017).
Livestock materials (drenches and dips)
Average per farm cost estimates for livestock materials were sourced from ABARES Agsurf data and reported for the beef, sheep and dairy sectors. Energy input information for the manufacture of livestock materials was not available therefore the research has assumed the same energy intensity factor as for crop and pasture chemicals, with the same percentage factors for electricity and gas applied to total cost for livestock materials.
Transport
Transport costs were derived from the Commonwealth Scientific and Industrial Research Organisation (CSIRO) report TraNSIT: Unlocking Options For Efficient Logistics Infrastructure In Australian Agriculture (Higgins et al., 2017). The report utilised a ‘ground up’ approach to the analysis of transport logistics costs, providing a detailed analysis of industry production and product movements data at the enterprise level, with extensive representation of most agriculture sectors. Simulation modelling was adopted to develop statistical probabilities using actual historic data.
The report covers 32 commodities representing 98% of agriculture and comprises movements of 142 million tonnes of either crop or livestock between production location, storage, processing facilities, ports and domestic markets. The data from 220,000 enterprises was analysed, and included:

August 2018 | The impacts of energy costs on the Australian agriculture sector
SECTION 1: Introduction6
• 216,000 farms and production locations
• 350 processors
• 500 feedlots and saleyards
• 530 storage facilities
• 3600 distribution centres and supermarkets.
The transport costs reported in the TraNSIT report include all the cost components to operate a vehicle:
• Fuel
• Driver salaries
• Maintenance
• Registration and insurance
• Capital costs and depreciation
• Overheads
• Tyres, etc.
For the purpose of the report, a diesel cost as a percentage of the total transport cost was applied. An average diesel cost as a percentage of the total transport cost was calculated for a combination of vehicle types. These include:
• Heavy Rigid
• Semi-trailer – 6-axle
• B-Double
• A-Double
• A-Triple

7
The impacts of energy costs on the Australian agriculture sector | August 2018
X.0 XXXXX
7
2. Sector analysis
SummaryAs part of an analysis of energy consumption and costs in the Australian agriculture sector, a literature review was conducted and qualitative data on energy use across sub-sectors was collected where available. This information formed the basis of use and functionality of the Energy Cost Calculator and database, the findings and modelled output of which are detailed in Section 3.
Vast differences in energy demand and intensity were observed between sectors, reflecting the different processes and the share of energy across the supply chain. Among the top energy consumers at the farm level are sectors involved with irrigation, and intensive industries who have a heavy reliance on uninterrupted power. Importantly thought, higher energy intensity does not necessarily imply inefficient energy use. This is because most industries engaged the physical transformation of raw materials will use more energy. In addition, a number of other factors influence the extent of energy cost impacts across
the supply chain, including scale, purchasing power, tariffs, consumption patterns and, tax benefits. While these factors are determinants of cost impact, contextualising them at an industry scale and assessing their individual contributions to energy cost (and thus exposure to impacts of energy prices), is beyond the scope of this report, however these factors are assumed to have been accounted for in any reported data.
Initially, the sub-sector analysis was intended to distinguish energy consumption and costs for applicable industries by activity (production and processing) and irrigated and rainfed production. Due to reporting methods and the general absence of information reported in this way, information pertaining to irrigated and rainfed production was indistinguishable and not readily broken down into constituent factors. Despite best efforts, this prevented consistency of reporting and analysis of the data this way and as a result, data was reported mainly in aggregate for these sectors, unless otherwise stated in the primary report and Energy Cost Calculator.

August 2018 | The impacts of energy costs on the Australian agriculture sector
SECTION 2: Sector analysis8
BeefIntroduction
The Australian red meat1 industry (RMI) value chain contributes $18 billion annually to Australia’s gross domestic product (GDP) from production, processing and sales (Red Meat Advisory Council, 2017). In addition to regulatory costs and labour, energy is regarded as one the most significant costs to the RMI. Industry-obtained data estimates the combined costs of energy along the Australian RMI value chain to be approximately $1.58 billion per annum (pa). In 2017, Meat and Livestock Australia (2017b) reported the three highest costs associated with the production of red meat to retail-ready product as:
1. On-farm diesel use ($298 million pa)
2. Red meat processor power ($278 million pa)
3. On-farm embodied energy2 ($267 million pa).
In general, energy use is reported at the farm and feedlot level as megajoules per head (MJ/ head), and at the processing level as energy use per tonne of hot standard carcase weight (HSCW). Whole-of-industry figures detailing energy consumption are most widely available at the post-farm stage, i.e. meat processing, primarily due to its significant contribution to overall operating costs.
Energy is used in processing for slaughtering, boning, processing and rendering, as well as for heating, lighting and refrigeration. As productivity parameters in the processing sector tend to be measured by throughput, most industry data at this stage in the supply chain is reported on a unit of production basis by tonnes of hot standard carcase weight (tHSCW).
In a report on energy consumption in small to medium red meat processing facilities compiled for the Australian Meat Processors Corporation (AMPC), Tang & Jones (2013) reported that energy consumption for processing and site activities is the greatest source of costs for these facilities.
1 Includes beef, sheepmeat and goatmeat.2 Embodied energy includes all energy in non-direct energy
products as services including commodity use, fertiliser, fodder, feed purchases, supplementary feeding, farm services and transport.
This report was part of a wider AMPC initiative, the Domestic Processors Energy Efficiency Program, which was developed to assist small to medium-sized domestic processors in understanding and managing energy costs and use. Additional components of the program included an energy management plan for processing facilities and a literature review of energy efficiency benchmarks and technologies. The program was set up to validate strategy which had been proposed to manage energy efficiency by benchmarking consumption patterns. However, these studies were limited by sample size, utilising data obtained from as little as 10 sites across NSW and Queensland.
Common to most RMI data, and reinforced by the other sector reviews that follow, is the frequent failure to disaggregate industry-level energy use data to provide information on energy required per unit of output, thus making it difficult to accurately assess the impact of energy price increases across industry supply chains.
Beef (pasture-based and feedlot)
Beef production is Australia’s second largest agricultural sector after wheat, contributing around $20.3 billion to agriculture industry turnover3 (Red Meat Advisory Council, 2017). It is Australia’s most valuable export commodity by production value.
The beef supply chain in Australia is relatively complex and involves a number of participants across a range of functional levels (Australian Competition and Consumer Commission, 2016). The beef value chain starts with calf production. Calves are either processed as vealers or are fattened and finished either on pasture or (more predominately) grain, to be processed for domestic and export markets, or alternatively enter the live export trade (Figure 2).
Significant energy inputs occur throughout the value chain, typically at and between the farm, feedlot and post-farm/processing. At the farm level, the location of operations has a significant bearing on the production system, size of operation and end market, and hence energy consumption and
3 Includes cattle from mixed enterprises

The impacts of energy costs on the Australian agriculture sector | August 2018
SECTION 2: Sector analysis 9
related production costs. The greatest differences are related to production intensity, climate, pasture, industry infrastructure and proximity to markets. The key variable costs associated with energy (e.g. crop and pasture chemicals, fertiliser, fodder and fuel) often differ significantly between production systems. The primary sources of energy consumption across the supply chain include input manufacturing (i.e. fertiliser, feed and agriculture/veterinary chemicals), feed processing (milling/steam flaking) and delivery, water supply, feed and waste management, as well as processing operations that involve heating and cooling.
To date, limited information specific to energy consumption and costs has been reported, except in the instance of environmental and sustainability reporting (primarily in response to consumer demands related to environmental impact). This information however, tends to be emissions-focused. For example, in a series of extensive studies, Wiedemann et al. (2016) used LCA to investigate the impacts from grass-fed
beef production (including resource use and environmental impacts) to the farm gate in eastern Australia. Mean fossil fuel energy demand was found to vary from 5.6 to 8.4 MJ per kilogram (kg) liveweight (LW). The studies analysed data extracted over five years to 2010. Energy demand was determined from purchased fossil fuels and electricity use, commodity use, feed purchases and farm services.
Meat and Livestock Australia (MLA) has commissioned extensive audits and reviews related to farm and feedlot energy efficiency. The most recent of these studies aimed to determine the extent to which energy costs (heating, electricity, and transport) contribute to operating costs within the red meat production and processing sectors, and how these costs are likely to trend; the total addressable market for energy efficiency, renewable energy, and energy storage technologies in the Australian RMI; and to highlight the energy intensive processes across the supply chain to direct high impact research and development (R&D) projects.
Figure 2: The beef value chain (2018).Source: www.sustainableaustralianbeef.com.au
August 2018 | The impacts of energy costs on the Australian agriculture sector
SECTION 2: Sector analysis10
The AMPC conducts frequent environmental performance reviews (approximately every five years), the earliest being 1998 and the latest released in 2015. These reports focus on key performance indicators (KPIs) associated with improvement in resource use efficiency and environmental performance, such as the impact of energy and water use efficiency on production costs, profitability and competitiveness. These reviews are publicly available for benchmarking individual performance and to support development and expansion activities, particularly in processing. Unique to these reports is the disaggregation of industry-level electrical energy data in the processing sector to determine the average electrical energy use associated with variation in processes, i.e. rendering. The 2015 report, however, is limited to just 14 case study sites.
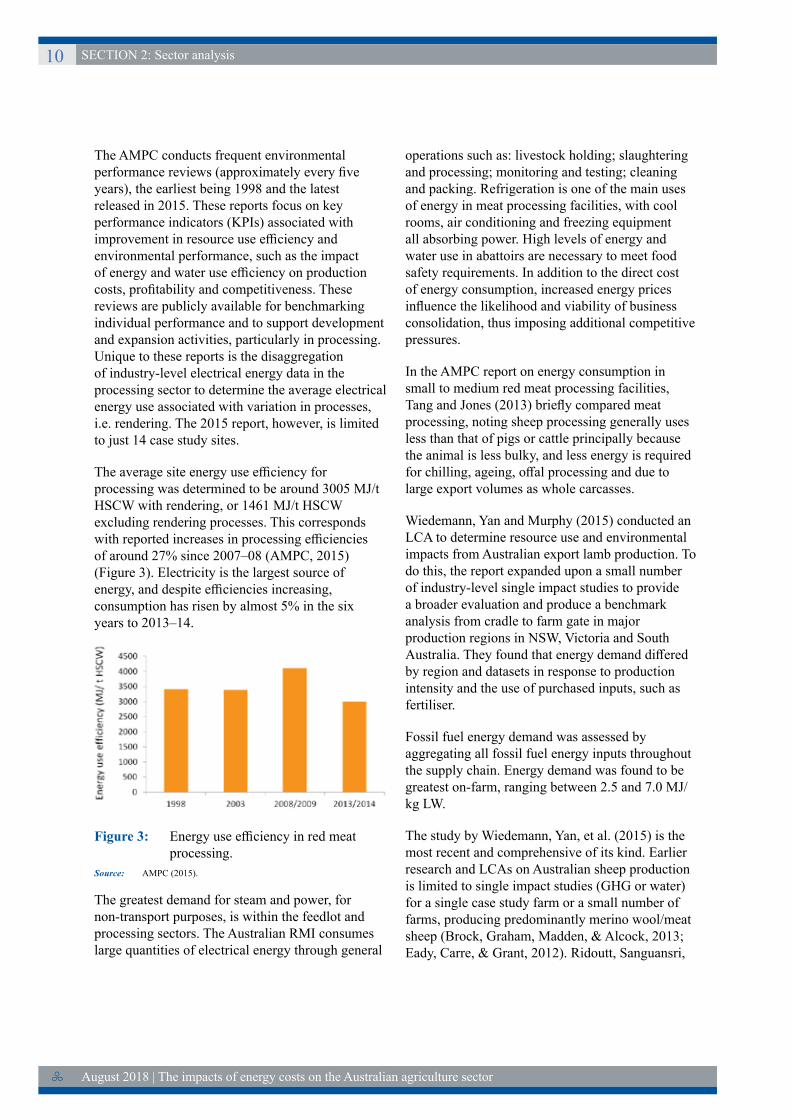
The average site energy use efficiency for processing was determined to be around 3005 MJ/t HSCW with rendering, or 1461 MJ/t HSCW excluding rendering processes. This corresponds with reported increases in processing efficiencies of around 27% since 2007–08 (AMPC, 2015) (Figure 3). Electricity is the largest source of energy, and despite efficiencies increasing, consumption has risen by almost 5% in the six years to 2013–14.
Figure 3: Energy use efficiency in red meat processing.
Source: AMPC (2015).
The greatest demand for steam and power, for non-transport purposes, is within the feedlot and processing sectors. The Australian RMI consumes large quantities of electrical energy through general
operations such as: livestock holding; slaughtering and processing; monitoring and testing; cleaning and packing. Refrigeration is one of the main uses of energy in meat processing facilities, with cool rooms, air conditioning and freezing equipment all absorbing power. High levels of energy and water use in abattoirs are necessary to meet food safety requirements. In addition to the direct cost of energy consumption, increased energy prices influence the likelihood and viability of business consolidation, thus imposing additional competitive pressures.
In the AMPC report on energy consumption in small to medium red meat processing facilities, Tang and Jones (2013) briefly compared meat processing, noting sheep processing generally uses less than that of pigs or cattle principally because the animal is less bulky, and less energy is required for chilling, ageing, offal processing and due to large export volumes as whole carcasses.
Wiedemann, Yan and Murphy (2015) conducted an LCA to determine resource use and environmental impacts from Australian export lamb production. To do this, the report expanded upon a small number of industry-level single impact studies to provide a broader evaluation and produce a benchmark analysis from cradle to farm gate in major production regions in NSW, Victoria and South Australia. They found that energy demand differed by region and datasets in response to production intensity and the use of purchased inputs, such as fertiliser.
Fossil fuel energy demand was assessed by aggregating all fossil fuel energy inputs throughout the supply chain. Energy demand was found to be greatest on-farm, ranging between 2.5 and 7.0 MJ/kg LW.
The study by Wiedemann, Yan, et al. (2015) is the most recent and comprehensive of its kind. Earlier research and LCAs on Australian sheep production is limited to single impact studies (GHG or water) for a single case study farm or a small number of farms, producing predominantly merino wool/meat sheep (Brock, Graham, Madden, & Alcock, 2013; Eady, Carre, & Grant, 2012). Ridoutt, Sanguansri,

The impacts of energy costs on the Australian agriculture sector | August 2018
SECTION 2: Sector analysis 11
The Australian RMI is a significant user of energy, particularly at the post-farm/processing stages of the supply chain. Energy is used in processing for slaughtering, boning, processing and rendering, as well as for lighting and refrigeration. The most energy-intensive stages of red meat production are on-farm diesel use, embodied energy associated with farm inputs and thermal energy for feedlots, particularly milling.
Most of the energy used across the RMI supply chain is derived from:
• Grid electricity (31.6%)
• Natural gas (37%)
• Coal (19%).
The three highest costs associated with the production of red meat to retail-ready product are:
• On-farm diesel use
• Red meat processor power
• On-farm embodied energy (inputs etc.).
Beef
Pasture fed and feedlot
Beef production is Australia’s second largest agricultural sector after wheat, contributing around $20.3 billion to agriculture industry turnover (RMAC, 2017).
In 2016, Australia’s national beef herd was approximately 27 million head. In the same year, around 7.8 million cattle were slaughtered, producing 2 million tonnes cwt of beef and veal (MLA, 2017; MLA, 2018; RMAC, 2017). While Australia is considered a relatively small beef producer in a global context, contributing around 4% to world beef supply, around 70% of production is exported, making it the third largest exporter of beef after India and Brazil (AgriFutures Australia, 2017b).
Approximately 40% of Australia’s total beef supply and 80% of beef sold in major domestic supermarkets is sourced from Australia’s $2.5 billion cattle feedlot sector (ALFA, 2018). There are currently around 393 feedlots throughout
Nolan, and Marks (2012) investigated prime lamb production, however methodology was based on a case study approach and covered water only. One other multi-impact study has been performed (Peters et al., 2010, 2011), however this covered only a single farm in Western Australia producing lamb for domestic consumption. Wiedemann et al. (2015) also used the previous study to expand their analysis on red meat production supply chains, using LCA to determine the environmental impacts and resource use of Australian lamb (and beef) exported to the USA (Wiedemann, McGahan, et al., 2015). The study covered the production phase in Australia, the meat processing stage in Australia, and transport and warehousing through the supply chain to the USA. Energy data was obtained using the 2010 Industry Environmental Sustainability Review prepared for the AMPC and MLA by GHD. Impacts associated with purchased inputs such as fertiliser and fuel were modelled using processes from the Australian National Life Cycle Inventory (LCI) Database and the European Ecoinvent database. Wiedemann used feed grain inventory data published in previous study on pork production (Wiedemann, McGahan, & Murphy, 2016).
Energy cost analysisTable 3: Impact of energy price change on the
red meat sector.
Aggregated supply chain
sectors
Base cost per annum
Modelled cost scenario pa*
Input (Beef) $ 132,715,109 $ 148,971,424
Production $ 521,256,320 $ 569,742,056
On-farm $ 19.42 /head $ 21.22 /head
Transport (Beef - grassfed + feedlot) $ 150,131,192 $ 157,637,751
Processing (includes sheepmeat)
$ 532,111,580 $ 671,128,818
$ 194.34 /t $ 245.12 /t
Total $ 1,336,214,200 $ 1,547,480,050
Cost impact $ 211,265,849
*of a 30% cost increase in electricity and a 5% increase in all other major energy sources

August 2018 | The impacts of energy costs on the Australian agriculture sector
SECTION 2: Sector analysis12
Australia with the majority located within close proximity to cattle and grain supplies. Queensland is the predominant feedlot state, with approximately 60% of cattle on feed, followed by NSW with 30%, Victoria with 7%, and the remainding 3% shared between South Australia and Western Australia.
Feedlotting involves intensive grain-based ration feeding of cattle in a managed facility to guarantee nutrition and the production of premium and consistent quality beef. At any one time around 2% of Australia’s cattle population are located in feedlots. The average period cattle spend in a feedlot is between 50–120 days or around 10–15% of their lifespan (ALFA, 2018). The primary sources of energy consumption in a feedlot include feed processing (milling/steam flaking) and feed delivery, and water supply, feed and waste management, administration, and repairs and maintenance.
Input
According to Spragg (2016), the Australian stock feed market is the largest domestic user of Australian grain, accounting for around 26% of total national grain purchases, and around 3.8 million tonnes of feed is manufactured for the beef industry annually, with a large proportion consumed by the beef feedlot sector which relies on grain feeding for export and domestic markets. Feed cost influences the length of time an animal remains on feed. In addition to feed used for finishing in feedlots, supplementary feeding also occurs on-farm to sustain production through periods of low pasture availability.
Production
Grass and grain-fed beef production is highly diverse in Australia. In grass-fed beef production, there are considerable differences in cattle breed, soil fertility, pasture quality, farm size, topography and climatic conditions. Grain-fed beef production involves a similar degree of variance given differences in cattle breeds, climatic conditions, feedlot size and market requirements.
Fuel, oil and grease use were found to be a significant cost for beef farms. Based on an average
cost per farm, it was estimated to cost the industry $431,564,460 per year. This figure is inclusive of fuel, oil and grease used for on-farm use of machinery and vehicles.
Transport
The total diesel cost for beef was $150,131,192 per annum. The diesel costs include the movement of grains from storage to feedlots. This component is important to include in the energy analysis with grain having to be sourced from much longer distances during seasons of low grain production.
Diesel costs for the sheep industry were estimated at $55,115,721. This figure is reflective of both production property locations taken from property identification code data and the number of sheep and goat movements between properties aggregated from the National Livestock Identification Scheme data. Transport costs are also inclusive of live exports. This covers export numbers through each port.
Post-farm/processing
Over 90% of Australian livestock are processed domestically producing meat, edible offal, hides and skins, meat and bone meal, pharmaceuticals, and tallow. Processing facilities include abattoirs, boning rooms and rendering plants.
Meat processing facilities have specific characteristics based on the quantity of raw materials processed, production technology, degree of mechanisation of production and space utilisation. For small to medium red meat processing facilities, energy use, opportunities and KPIs vary significantly based on factors such as species mix, level of processing (rendering or non-rendering) and throughput.
The primary energy sources consumed at meat processing sites include electricity, natural gas and diesel generation. Energy intensity varies significantly between rendering vs. non-rendering sites. This is because rendering sites consume more natural gas and liquefied petroleum gas (LPG) due to additional steam requirements for both rendering and wash-down activities.

The impacts of energy costs on the Australian agriculture sector | August 2018
SECTION 2: Sector analysis 13
SheepSheepmeat – Introduction
Australia is the world’s largest exporter of sheepmeat, and the second largest producer of lamb and mutton. In 2016–17 the off-farm meat value (domestic expenditure plus export value) of the Australian sheepmeat industry was approximately $5.23 billion (Meat & Livestock Australia, 2017). In the same year, Australia produced 506,239 tonnes carcase weight (cwt) of lamb and 163,365 tonnes cwt of mutton with the gross value of Australian lamb and mutton production (including live exports) estimated at $3.9 billion (ABARES, 2017b).
The sheepmeat supply chain begins on-farm with breeding and fattening and moves to marketing and export or primary and secondary processing, followed by distribution and sale by a wholesaler/retailer (Figure 4). As with most meat production processes, processing and post-processing activities demand the most energy in the supply chain sequence. Following processing, the temperature of the meat is quickly reduced to an optimal storage temperature that is maintained until the product reaches the intended market. Meat is transported between establishments and to ports under active refrigeration to ensure the integrity and safety of the product and prolong its shelf life.
Figure 4: Sheepmeat supply chain.Source: AgricWA (2018).

August 2018 | The impacts of energy costs on the Australian agriculture sector
SECTION 2: Sector analysis14
Wool – Introduction
Australia is the largest exporter and one of the world’s largest producers of high quality wool. Australia produces approximately 25% of the greasy wool sold on the world market (Department of Agriculture and Water Resources, 2016). Production in Australia is carried out across 86 million hectares (ha) and is characterised by high and low rainfall production systems with most producers involved in mixed farming operations. Producers in high rainfall areas typically operate smaller farms, however they can produce improved pasture to feed high numbers of sheep year-round. In comparison, low rainfall farms produce a lower quality pasture with a lower nutritional value (largely native shrub) therefore cannot provide for as many sheep on the same amount of land.
Energy use is one of the most significant environmental impacts related to wool production. To date, there is virtually no detailed study on quantifying energy inputs and the energy cost impact on producers and processors across the wool supply chain in Australia. The current available literature deems that data on energy use remains an important knowledge gap for the wide range of sheep farming and wool processing systems.
In support of this view, Wiedemann, Yan, Henry, and Murphy (2016) acknowledge that to date there has been a lack of detailed farm scale data included in the analysis of the environmental impacts of Australian wool. Previous environmental impact studies on wool production report on the single GHG emissions impact but fail to comment on consumption of energy or on what impacts the rising costs of energy are having on the industry.
Russell (2010) briefly describes the environmental aspects of Australian wool production, particularly on the use of eco-labelling. While providing
a narrow insight into energy use across the wool supply chain, the study fails to report any quantitative energy use data. The findings on energy relate to processing stages, where it is reported that a significant portion of energy use occurs at the finishing stages. Energy use at the finishing stages is required to produce clean fibres ready for spinning and blending.
To help better understand the environmental impacts of wool and other fibres, Henry (2012) presents a review of available LCA studies. The review involved evaluating methodologies and quality of data to deliver insight into the validity of current analyses. It covers energy use across the wool fibre chain of production (Figure 5).
The review provided conclusions and recommendations to ensure the development of LCA studies facilitate a more accurate representation of the environmental impact of wool. These included consolidating existing data and closing data gaps as well as a stronger communication strategy to establish the most up-to-date record of environmental metrics, including energy use. The study goes so far as to comment on how the wool industry could progress research into energy, water and land use and the need to improve data availability however provides minimal insight on specific energy inputs or consumption for the Australian wool industry.
Wiedemann, Yan, et al. (2016) present a unique multiple-impact LCA for three types of Australian merino wool. One specific aim of the work was to quantify resource use for energy, water and land across three distinct wool production regions. These regions included:
• NSW high rainfall zone producing superfine merino wool
Figure 5: Typical steps and procedures in the chain of production of wool fibres.Source: Henry (2012).

The impacts of energy costs on the Australian agriculture sector | August 2018
SECTION 2: Sector analysis 15
• Western Australia wheat sheep zone with fine merino wool production
• South Australian southern pastoral zone producing medium merino wool
The research involved analysis of all supply chain processes up to the farm gate. Energy data was collected from 10 case study farms through site visits, farm surveys and interviews. A regional farm average was constructed and reported using specialist sheep farm data from the ABARES Australian agriculture and grazing industries survey. To account for seasonal variation, five years of data was included dating from 2006–10. Major inputs of energy included electricity, diesel and petrol use. Energy demand for the case study farms ranged from 12.5 MJ/kg wool produced in the SA southern pastoral zone to 22.5 MJ/kg wool across the WA wheat/sheep zone. Variations in energy use between regions were a result of different grazing intensity.
Energy cost analysis Table 4: Impact of energy price change on the
sheep (meat and wool) sector.
Aggregated supply chain
sectorsBase cost Modelled cost
scenario*
Input $ 94,601,926 $ 101,398,105
Production $ 281,482,520 $ 310,721,851
$ 4.17 /head $ 4.60 /head
Transport $ 55,115,721 $ 57,871,507
Total $ 431,200,167 $ 469,991,462
Cost impact $ 38,791,295
*of a 30% cost increase in electricity and a 5% increase in all other major energy sources
Australia is the world’s largest exporter of sheepmeat and the second largest producer of lamb and mutton. In 2015–16, Australia produced 516,366 tonnes cwt of lamb and 196,040 tonnes cwt of mutton. Fossil fuel energy demand is dominated by on-farm energy demand, which differs between regions in response to production intensity and the use of purchased inputs, such as fertiliser.
Wool producing enterprises typically vary by geography (high or low rainfall system) and land size, enterprise mix, and flock size, and consequently in energy intensity. Wool may be the primary focus of the farming business, or it may be part of a mixed farming system, most typically a sheep/cereal cropping system. In 2015–16 there were around 73 million sheep (shorn) in Australia, producing an average of 4.4 kg of wool per head per cut, and a total wool yield of 325 million kilograms greasy (shorn wool prior to treatment) (Australian Wool Innovation, 2017).
The Australian wool production supply chain (Figure 6) is underpinned by good infrastructure (sheds, stores, sampling, testing, handling, assembly and distribution). At the farm level, husbandry management operations attract the greatest energy consumption requirements with operations including feeding, crutching and shearing. Because of the vast differences in production systems and farming practices, there is little to no understanding about the extent of energy consumption or the significance of energy costs associated with inputs across the major supply chain segments. Differences in technologies and efficiencies for processing and manufacture also remain relatively unexplored.

August 2018 | The impacts of energy costs on the Australian agriculture sector
SECTION 2: Sector analysis16
Figure 6: The wool supply chain from Australia to global consumer.Source: NSW DPI (2015a).
energy demand, however most studies do not incorporate this in assessments as they deem animal health insignificant to overall energy consumption and cost impact across the supply chain.
Production
Energy intensity on-farm is primarily determined by flock size and includes fuel and electricity use associated with husbandry activities, such as crutching and shearing.
Transport
Transport (of wool and sheep to and from farm) has not yet been considered in any study.
Post-farm/processing
Energy demand and intensity for wool production is at its greatest post-farm, due to the processes of spinning, weaving and knitting, dying in garment manufacture.
An energy cost for wool processing was excluded from the analysis due to limited data availability.
Input
Around 246,320 tonnes of feed is manufactured for the sheep industry per year4 (Spragg, 2016). The amount of feed designated to either sheepmeat or wool production is not distinguished and is likely to vary considerably between seasons and production systems. For example, depending on production system and climate, growing season pasture (whether improved or native) may not meet feed requirements of the flock, and supplementary feed such as conserved fodder, legumes and cereal grain or formulated feed pellets may be required. Some mineral nutrition may also be supplied as ‘licks’ and ‘blocks’.
Regardless of whether wool production forms part of a mixed enterprise, if grazing is on improved pastures, there will be a level of energy demand associated with crop/pasture nutrition (fertiliser). Animal health (including the use of vaccines) and products for pest/disease control also incorporate
4 Sheep industry includes lamb feedlot intake, supplementary feeds for breeding stock and live sheep export feeds.

The impacts of energy costs on the Australian agriculture sector | August 2018
SECTION 2: Sector analysis 17
Pork Introduction
The pork industry is Australia’s smallest livestock industry. It is predominantly based on intensive systems, which account for more than 90% of pork produced in Australia. Australia produces around 400,000 tonnes of pig meat per year of which around 10% is exported, 58% is consumed fresh and 30% is processed into other products such as ham, bacon and other small goods (AgriFutures Australia, 2017a).
Energy is a significant and growing input cost for all piggeries. The NSW Department of Primary Industries (DPI) reports that the main costs of production currently faced by the pork industry include power and energy costs (NSW DPI, 2015b). In order to maintain a strong food safety guarantee, pork producers must engage in the appropriate food health and safety practices – this means that energy and water are a key requirement on-farm and into the processing element of pig meat. Pork producers are faced with growing cost pressure from rising energy prices while upholding industry health and safety standards. According to Australian Pork Limited (2014), energy costs have increased between 25–40% in recent years across the majority of primary pig producing areas.
Similar to other industries, LCA studies dominate the current research environment, with a focus particularly prevalent within the pork industry on GHG emissions and less so on assessing the current use of energy and the impact of rising energy prices on the viability of agricultural producers and business. Amongst the current studies on energy usage, more detailed reporting has been completed at the farm level compared to pre- and post-farm stages.
A comprehensive assessment of energy use on piggeries by McGahan, Warren, and Davis (2014) for Australian Pork involved energy monitoring of six case study farms in Queensland and Victoria. Strong emphasis was placed on monitoring direct electricity consumption. The case study farms were assumed to provide a representative sample of housing and ventilation systems, climate and
capacity. Energy data was obtained in many forms, including electricity, gas, diesel and petrol. Only total direct energy usage on-site was included in the study, namely lighting, heating, cleaning, water and feed management.
Variations in energy use were recorded between housing systems. Farrow-to-finish piggeries recorded the highest energy use, ranging between 600–1500 MJ/tonne live weight while energy use amongst breeder systems were in the range of 14–67 MJ per weaned pig. A key observation from the analysis was that for each site, electrical energy was the predominant energy use, accounting for 75% of the total. Diesel fuel was reported as the second highest use source, accounting for 15% of total energy use on-farm for operation of motors and pumps.
In a separate report, Australian Pork (2015) examined the six case study energy analyses reported by McGahan et al. (2014). The findings concluded that conventional piggeries have a much higher energy usage than deep litter systems and outdoor piggeries. Another significant area of energy use noted in the report was mechanical ventilation, contributing up to 60–80% of the total power requirement of the piggery.
Wiedemann, McGahan, et al. (2016 ) and Wiedemann, McGahan, & Murphy (2017) have conducted valuable research on energy consumption along the pork supply chain. They assessed the environmental impact and resource use from Australian pork production assessed using LCA. The 2016 analysis includes a national assessment of energy use that involved average energy data over 12 months from a sample of farms and scaled to national herd size. Total energy input was found to be 0.082 GJ per 100 kg of live weight (lwt).
The later report estimates fossil fuel energy demand by analysing the energy demand involved aggregation of all fossil fuel energy inputs throughout the system. The primary production supply chain assessed included breeding through to finishing as well as meat processing. Again, a national assessment was performed using national herd statistics from 2010. A key finding of the

August 2018 | The impacts of energy costs on the Australian agriculture sector
SECTION 2: Sector analysis18
research was that fossil fuel energy demand at the farm gate ranged between 12.9–17.4 MJ/kg lwt. The national average for fossil fuel energy demand was estimated at 14.5 MJ/kg lwt. The research also identified processes along the pork supply chain that dominate energy demand, which included:
• Feed production (46.8%)
• Piggery energy use (23%)
• Feed milling (16.2%)
• Meat processing (14%).
An observation from assessment of the current literature on energy use in pork production is that there is huge variation in energy use per kilogram live weight, due to a range of factors. Size and type of piggery play largely into the variance of energy use across farms. Energy use and cost variations also arise due to seasonality. Heating and cooling requirements will adjust according to season and this will influence the energy demand, but generally energy demand will peak over summer periods due to increased fan activity to control temperature (Australian Pork, 2014).
Energy cost analysisTable 5: Impact of energy price change on the
pork sector.
Aggregated supply chain
sectors
Base cost per annum
Modelled cost scenario pa*
Input $ 14,659,979 $18,743,350
Production $ 106,790,014 $ 137,645,318
$ 20.70 /head $26.68 /head
Transport $ 7,210,144 $7,570,651
Processing $ 42,099,444 $ 52,773,210
$ 106.04 /t $132.93 /t
Total $ 170,759,582 $ 216,732,530
Cost impact $ 45,972,948
*of a 30% cost increase in electricity and a 5% increase in all other major energy sources
The Australian pork industry is one of the largest
users of feed grain. Feed milling is amongst the most energy-intensive processes along pork supply chain, with up to 40–60% of total energy use across the supply chain associated with feed production. Energy consumption for a feed ration is largely determined by the age of the animal and type of farming operation. Primary energy data for a range of feed rations across different classes of pig (breeder, weaner, grower) has been used to determine the energy use associated with feed inputs into the pork supply chain. The inclusion of different feed rations for pig classes is important in highlighting where rising energy prices may have the greatest impact.
Production
There are approximately 2700 pig producers Australia-wide (Australian Pork, 2018), ranging from small scale producers to large commercial facilities. Pork production systems fall into three main categories: indoor housing, outdoor bred and free range. Energy is a significant and growing cost across all piggeries, with the main cost of production currently faced by the pork industry being power and energy costs (NSW DPI, 2015b).
At the farm level, diesel and electricity are the two main sources of energy. At 75% of total energy costs, electrical energy is the predominant type of energy use. Diesel use has been reported as the second highest use source, with large quantities required for motors and pumps.
The size, type of housing system and number of sows play largely into the variance of energy use reported across farms. However, the key energy use activities that concern all piggery systems include heating, ventilation and irrigation. The use of heat lamps and electric heat pads is particularly an energy cost concern for farrowing sheds for growth of young piglets. In terms of ventilation, piggeries with tunnel or mechanical ventilation tend to use more energy than those that are naturally ventilated, therefore are more exposed to increases in energy prices.
The impacts of energy costs on the Australian agriculture sector | August 2018
SECTION 2: Sector analysis 19
Transport
Energy is also used indirectly in the pork industry through freight and transportation of livestock. Transport data incorporated in the analysis comprised of movements from both property to export abattoir, saleyard or port and domestic abattoir to saleyards, distributor or supermarket. Diesel costs for the pork industry total approximately $7,210,144 per annum.
Processing
Meat processing is the third largest contributor to energy demand after feed production and on-farm operations (Wiedemann et al., 2017). The pork industry is dominated by large processing facilities, representing 5% of operators in the industry but making up more than 60% of production (Buloke Shire Council, 2017). The majority of pigs (85%) are slaughtered at seven export abattoirs and are processed for both export and domestic markets, and the remainder are slaughtered at a large number of small abattoirs.
Site energy consumption for processing is heavily attributed to machine operations, refrigeration and the production of hot water. The primary energy costs for processors are electricity and LPG. Refrigeration is classified as the largest electricity use in meat processing plants, making up between 15–30% of the total energy consumption (Tang & Jones, 2013) while steam and hot water for heating, scalding and singeing are some of the common LPG applications. It has been estimated that over 80% of the total energy consumed at processing is required for heating, scalding and singeing of the carcase (Tang & Jones, 2013).
The level of processing is an important determinant of energy use. Major in-house operations that require energy are slaughter, boning, processing and rendering. Energy use will also vary depending on the end market. Meat destined for the export market will require additional chilling and freezing throughout transportation to extend the shelf life of products.

August 2018 | The impacts of energy costs on the Australian agriculture sector
SECTION 2: Sector analysis20
Poultry – Chicken meatIntroduction
Chicken meat is the most widely consumed meat in Australia. In 2016, the Australian chicken meat industry contributed $2.7 billion to the gross value of agricultural production (GVP) with production exceeding 1.2 million tonnes cwt and a retail value of around $6.6 billion (AgriFutures Australia, 2017c).
The Australian chicken meat industry’s supply chain is extensive and comprised of multiple links between the feed mill, breeding farm, hatchery, grow-out farm and processing plant. Commercial meat chicken production is almost exclusively undertaken under contract to a processor, where the processor provides the birds, feed and veterinary care and the contract farmer provides the housing, day-to-day management of the farm, bedding, water, gas and electricity and in return is paid (as part of a pool system) an agreed fee per bird. Processing companies generally own, control and invest across the supply chain, including breeding farms, feed mills, broiler farms and processing plants. The industry is highly concentrated and vertically integrated with modern, efficient production systems (Wiedemann, McGahan, & Murphy, 2017).
The chicken meat industry is highly reliant on energy, primarily electricity, which is a significant component of the production, health, safety and welfare of meat chickens. Despite this, benchmark data on energy – be it use, cost or reliability – in the Australian meat chicken industry is almost non-existent.
Some studies have incorporated energy use to farm level assessments, however the research involved focuses on response to environmental concerns, using an LCA and GHG emissions analysis approach (MacLeod et al., 2013; Wiedemann et al., 2017). Similarly, industry research (RIRDC, 2014) tends to be oriented towards ‘energy strategy’ to improve energy efficiency and cost reduction, and waste-to-energy opportunities, with no detailed assessment on the implications of energy consumption and cost factors at a whole-of-industry scale.
Earlier research by Wiedemann, McGahan, Poad, and Rural Industries Research and Development Corporation (RIRDC) (2012) has provided a valuable contribution to the information on chicken meat production, particularly that pertaining to energy use data at the farm level of two contrasting, broadly representative regions of Australian chicken meat production: South Australia and Queensland. The report described research undertaken to quantify the annual energy usage of several chicken grow-out farms throughout a year, in an attempt to benchmark energy usage and identify opportunities for enhanced energy use efficiency, and subsequent cost savings. The study reports energy usage by energy sink (i.e. shed cooling, lighting etc.) and considers shedding management and design from an energy efficiency perspective. It aimed to quantify actual energy usage of grow-out farms and categorise this, based on shedding system and aspects of shed operation.
The study included a detailed analysis of feed use and milling, including commodity inputs, energy and water use, transport and inputs associated with breeding and hatching activities. Energy consumption was reported by fossil fuel energy demand, then assessed by aggregating all fossil fuel energy inputs throughout the system and reporting them per MJ of energy, using lower heating values. Of these, the most significant energy expenses were associated with the heating and cooling requirements of sheds on-farm.
The study concluded that electrical energy use ranged from 60 to 137 kWh per tonne lwt produced for the Queensland supply chains, and 75 to 126 kWh for the South Australian supply chains. LPG usage also varied considerably, from 8.9 to 21.6 L/kg lwt and 6.6 to 56 L/kg lwt produced for the Queensland and South Australian supply chains respectively.
MacLeod et al. (2013) also conducted an LCA on the chicken meat industry from a global perspective, however the assessment did not include any detailed investigation of on-farm energy consumption or associated costs and was limited to GHG emissions.

The impacts of energy costs on the Australian agriculture sector | August 2018
SECTION 2: Sector analysis 21
Wiedemann et al., (2017) quantified resource use, environmental impacts and hotspots for Australian chicken meat production using updated inventories and newer methods than previous LCAs (Wiedemann et al., 2012) – this is the most recent and comprehensive analysis to date. Conventional (indoor housing with tunnel ventilation) and free-range housing systems were assessed and compared by region (Queensland and South Australia) per kilogram of chicken meat produced, taking into account fossil fuel energy, GHG and fresh water consumption. Fossil fuel energy consumption of meat produced in South Australia was 18.1 MJ/kg lwt and 21.4 MJ in Queensland, with feed the greatest contributing factor.
Energy cost analysisTable 6: Impact of energy price change on the
chicken meat sector.
Aggregated supply chain
sectors
Base cost per annum
Modelled cost scenario pa*
Input $ 31,989,748 $ 40,900,130
Production $ 396,331,668 $ 502,831,176
$ 0.61 /bird $ 0.77 /bird
Transport $ 7,007,431 $ 7,357,802
Processing $ 172,689,636 $ 221,305,268
$ 140 /t $180 /t
Total $ 608,018,483 $ 772,394,376
Cost impact $ 164,375,893
*of a 30% cost increase in electricity and a 5% increase in all other major energy sources
According to ABARES (2018a), in 2016 around 653 million chickens (1.19 million tonnes cwt) were produced and processed for chicken meat, accounting for approximately 42% of total national livestock meat production. Chicken meat production is projected to continue growing over the medium term, reaching 1.4 million tonnes in 2021–22, with low retail prices for chicken meat (relative to other meats) expected to lead to an increase in per person consumption.
The commercial production of chicken meat in Australia tends to follow a farm sequence consisting of:
• Breeding farm
• Hatchery
• Feeding mill
• Grow-out farm
• Processing plant.
Due to the highly efficient and integrated nature of poultry production, energy consumption and costs (and the impact of these factors on production) are difficult to ascertain.
Input
The chicken meat sector is a significant consumer of grains, accounting for around 5% of total national grain purchases. Feed is made up of 85–90% grains, such as wheat, sorghum, barley, oats, lupins, soybean meal, canola and other oilseed meals and grain legumes.
The SFMCA (Spragg, 2016) estimates that in 2015–16 feed use for poultry meat5 was 3,176,233 tonnes – however, there is little to no data distinguishing between manufactured feed for poultry by SFMCA and produced on-farm/feed mill within industry. Most manufactured broiler feeds are steam pelleted, which involves ingredients being ground, mixed, steam-conditioned and compressed into beak-sized, well-formed pellets. To ensure feeding efficiency and waste reduction, meat chickens are always fed pelleted feed (rather than mash). At feed milling, the major energy inputs include electricity, LPG and natural gas, as well as transport fuels.
At the farm level, birds are phase-fed and diets may change during the course of the year in response to variability in commodities (Wiedemann et al., 2017). Most companies operate their own feed mill and manage documentation of commodity inputs, energy and water use, and transport.
5 Largely chicken, however includes duck, turkey and minor poultry species and breeding flocks to support these industries.

August 2018 | The impacts of energy costs on the Australian agriculture sector
SECTION 2: Sector analysis22
Production
On-farm (broiler farm), where birds are raised for 35–55 days, the primary factors that affect total energy use include shed design and construction, with relative energy usage derived from shed operation (including use of heaters, ventilation fans, lighting, feeding system and cooling pumps). It is also important to consider seasonal variation as well as specific conditions at sites, as small nuances such as increased propensity for heating or ventilation beyond industry averages can affect expected power costs beyond extrapolated values.
At breeding and hatching facilities, the greatest energy sources include electricity, diesel, LPG and petrol, compared with the grow-out phase where the most significant inputs required include electricity, LPG, natural gas, petrol and diesel.
Transport
The majority of chicken meat (95%) is consumed by national markets. Broiler farms are typically located within 100 km of their contracted
processing facilities and processing facilities within 80 km proximity of metropolitan centres, to minimise transport costs, improve access to infrastructure and labour and be near their customer bases.
A diesel cost for the chicken meat industry was estimated at $7,007,341.
Post-farm/processing
Once broilers reach slaughter weight they are collected from the farm and transported directly to large, highly mechanised chicken meat processing plants for processing into various meat products. At the processing site, chickens are unloaded, slaughtered, plucked, cleaned, cooled and graded before being packed or further processed into various products prior to distribution and sale.
Energy requirements during processing are predominately electricity, followed by natural gas, LPG, diesel and petrol for primary activities such as refrigeration, packing and sanitisation.

The impacts of energy costs on the Australian agriculture sector | August 2018
SECTION 2: Sector analysis 23
Poultry – EggsIntroduction
The Australian egg industry is characterised by intensive, modern, highly efficient production systems and a growing free-range production sector. Egg farms are diverse in energy consumption depending on the way the layers (hens) are kept, with lighting, ventilation and the motors that supply feed the primary drivers of energy use.
The egg industry is particularly exposed to implications of energy prices as most hens are kept in climate-controlled sheds. Solar is an effective source of energy for egg farms, as the size and timing of daily peak demand mirrors peak energy production with more energy used to cool sheds during the middle of the day (Australian Eggs, 2018). The business case for commercial solar in the egg industry has become compelling, as the price of solar technology has decreased, and energy efficiency has increased while egg prices have been relatively static. Despite this, there is little information for the industry regarding the cost benefit of solar as an alternative to electricity from the grid.
Mitigation strategies and efficiency measures that reduce feed use have been identified as a potential benefit to the industry. However, considering the high degree of feed efficiency achieved to date, substantial further gains are expected to be more difficult to achieve (Wiedemann & McGahan, 2011).
Globally, the egg industry has received considerable attention in terms of production efficiencies and environmental assessment compared to many other agricultural sectors, and many detailed egg LCA studies have been conducted (McGahan, Davis, Warren & Cheallaigh, 2013; Sonesson, Cederberg, Flysjö & Carlsson, 2008; Wiedemann & McGahan, 2011). These studies investigated a number of different production systems including caged, aviary, free-range and organic production systems, though only results from cage and free-range systems were covered in the review. All studies investigated total GHG emissions, however reports of energy use were inadequate.
With a focus on Australian production, and commissioned by the Australian Egg Industry, Wiedemann and McGahan (2011) conducted the first Australian egg production system LCA, which identified feed grain production and use as the largest impact source, followed by on-farm water and energy use, and manure management (for GHG only). Cumulative energy demand6 for egg production from environmentally controlled caged production was 10.7 +/- 0.9 MJ / kg. The largest contributor to energy demand was feed production for layer hens and pullets. Farm electricity usage – for housing (layers and pullets), feed milling and grading – was the second largest contributor to total energy use. Most of the energy used at the farm level was used for hen housing.
Expanding on earlier research by Wiedemann and McGahan (2011), McGahan et al. (2013) evaluated energy usage and ventilation performance of tunnel ventilated layer sheds. The study used a representative Australian caged egg farm and investigated energy use and ventilation performance of an environmentally controlled shed at that farm. Most importantly, the study noted advances to production systems, noting that to comply with stringent animal welfare requirements, caged egg producers have invested in new sheds or retrofitted older sheds that are fully environmentally controlled. These sheds are fitted with ventilation fans at one end of the shed, with air inlets along the length of the shed and cooling pads at the opposite end of the shed, to provide optimal environmental conditions for the hens. These sheds are more energy-intensive than naturally ventilated sheds.
With rising energy prices, energy efficiency is an important focus area for the Australian egg industry. Electricity consumption dominates energy usage for environmentally controlled sheds. Electricity is required for running fans and lighting, and for running feed and water lines. High temperatures during the summer monitoring period may have contributed to a high demand in electrical energy use to operate the ventilation system. Electrical energy monitoring at the selected farm showed that electrical energy use ranged from an average of 1500 kilowatt hours per day (kWh/d) in winter to
6 Energy use for the whole supply chain

August 2018 | The impacts of energy costs on the Australian agriculture sector
SECTION 2: Sector analysis24
2500 kWh/d in summer. Peak loads of between 140 and 185 kW were recorded during warmer periods of the day. Operating ventilation fans required 60–70% of the total energy, while lighting required 17%.
Energy cost analysisTable 7: Impact of energy price change on the
egg sector.
Aggregated supply chain
sectors
Base cost per annum
Modelled cost scenario pa*
Input $ 9,166,254 $ 11,719,410
Production $ 62,140,900 $ 80,225,946
$ 0.19 /dozen $0.24 /dozen
Total $ 71,307,154 $ 91,945,356
Cost impact $ 20,638,202
*of a 30% cost increase in electricity and a 5% increase in all other major energy sources
The egg industry is made up of large vertically integrated companies, medium-sized businesses and small lifestyle farms. In 2016–17 approximately 335 million dozen eggs were produced by businesses operating caged, barn-raised and free-range systems (ABARES, 2018a).
All systems require climate-controlled housing, with a minimum requirement of three-phase power from the electricity grid. Continuity is also critical to ensure hen welfare can be maintained, meaning egg farms require industrial diesel generators on site as backup in the event of a blackout.
Production
Electricity consumption dominates energy usage for environmentally controlled sheds. Electricity is required for running fans and lighting, and for running feed and water lines (McGahan et al., 2013).
• Energy use on-farm (housing, collection)
• Grading and packing
• Storage (cold).
Post-farm/processing
The supply chain consists mostly of whole shell egg to retail, however other markets for producers include wholesale (for supply to manufacturing, food service and catering sectors), egg suppliers and distributors, smaller retailers, direct to restaurants and food services and public sales and markets. Most eggs are sold as fresh shell eggs, but a small proportion is processed to make egg products such as pulp (‘liquid eggs’) or powder. Adequate information on the energy costs of transport for the egg industry was not available.

The impacts of energy costs on the Australian agriculture sector | August 2018
SECTION 2: Sector analysis 25
industry benchmarks for energy use and cost on-farm. Data was collected from 1400 dairy farms nationwide (21% of farms across Australia) between 2012–15 and included dairy shed energy use across a mix of milking systems. It was found that, on average, 48 kWh of energy are used to produce 1000 litres (L) of milk. The cost of energy per 1000 L of milk totals $11.
Dairy Australia note that scale is important, with energy use per kilolitre (kL) falling with larger herd sizes. National dairy herd sizes range from 250–600 head depending on state. Findings from the Smarter Energy Use On Australian Dairy Farms project highlight variations in energy use due to milking systems and herd sizes (e.g. automatic milking systems use a greater amount of energy for milk harvesting). Dairy Australia also reported on the main contributors to energy use on-farm, concluding that the most energy-intensive activities include water heating, milk cooling and milk harvesting. These three components make up to 80% of the energy use and cost on-farm (Dairy Australia, 2013). The remaining 20% of energy costs are allocated to cleaning, irrigation and lighting.
Chen et al. (2015) also provides a valuable insight into energy use in the dairy industry. The research focused primarily on direct energy use at the farm stage of the supply chain. To quantify energy use on-farm, the report presented a hypothetical farm scenario detailing number of cows, milk production, electricity, irrigation, diesel and transport amongst other factors. The total estimated direct energy use on-farm varies between 0.41–0.82 MJ per kilogram of milk solids. The predicted energy cost per year is $275–$300 per cow.
The results highlight that the greatest use of energy in dairy is electricity, making up 67% of the total energy use on-farm, while 47% of electricity is used for water irrigation pumping. In terms of field operations, irrigation was identified as the largest contributor to energy use, while in respect of shed operations, milk cooling accounts for a large proportion of energy use.
Dairy Introduction
The Australian dairy industry is a farming, manufacturing and export industry which contributes $13.7 billion to total agricultural GVP. Dairy is the third-largest Australian agricultural industry behind wheat and beef, based on farm gate value of production (Dairy Australia, 2016). The local dairy supply chain includes raw milk production, processing, manufacturing, marketing, distribution and domestic retail and export of dairy products.
The dairy industry uses energy both directly and indirectly. Rising overall energy bills and stable consumption is common for both dairy farmers and processors. Dairy Australia (2016) has reported significant increases in energy costs which have the potential to reduce farm gate prices by $89 million.
Energy is a vital input for many stages along the dairy supply chain, particularly at the farm and processing levels. In light of the present threat of rising energy prices, the industry’s status as a low-cost producer is becoming difficult to maintain. Currently, there is insufficient data on energy use across the dairy industry. While there has been no detailed assessment quantifying energy use and costs, and identification of the impacts of energy price rises across the dairy industry more broadly, a limited amount of energy use and production data is available from LCA studies and energy assessment projects. The industry is experiencing a slight rise in energy use data, due to external reporting requirements mandated in legislation (e.g. the National Greenhouse and Energy Reporting scheme introduced in 2007). This has resulted in energy consumption being more closely measured and monitored.
Dairy Australia has been leading the industry in assessing energy use and costs on Australian dairy farms. Some of their most recent work has been associated with the Smarter Energy Use On Australian Dairy Farms (2015) project. As part of this project, Dairy Australia collected national energy assessment data and presented national

August 2018 | The impacts of energy costs on the Australian agriculture sector
SECTION 2: Sector analysis26
Dairy manufacturers are particularly vulnerable to energy price rises. At the processing and manufacturing level, the Australian Dairy Industry Council (ADIC) and Dairy Australia (2014) highlighted that dairy processing companies are among the top 300 highest energy users in Australia. Again, Dairy Australia has been active in providing data on energy for processing companies.
The Australian Dairy Industry Response to the Productivity Commission Study Costs of Doing Business: Dairy Product Manufacturing (ADIC & Dairy Australia, 2014) provides a number of estimates from industry studies on the use of energy for different dairy consumer products. These include drinking milk, butter, cheese, milk powder and whey products. Estimates are included in full detail in the main report. Energy use in dairy factories is dependent on the types of products manufactured.
Changes in the cost structure of dairy manufacturing have been observed in recent years, with several relating to energy (ADIC & Dairy Australia, 2014). The most pressing of these changes are increased electricity prices, projected increases in gas prices and increased diesel prices. Less recent work was undertaken by the Dairy Manufacturers Sustainability Council (DMSC) (2011) to assess the environmental performance of the dairy manufacturing industry. The report included energy consumption analysis from a survey of eight companies, representing 88% of all milk processed in Australia during 2010–11. Energy consumption findings were reported for the participating companies. Total energy consumption for the sites surveyed totalled 10.7 million GJ. The two main sources of energy reported by dairy manufacturers in 2010–11 were electricity and natural gas.
As milk is a highly perishable product – raw milk requires processing 48 hours after pick-up – the dairy industry is heavily reliant on road transport. Fuel use depends on a number of factors,
including the type of product being transported (e.g. transporting milk costs less than transporting manufactured dairy products). The distance from farm to processor is another major consideration. The recent period of strong milk supply has seen the expansion of processing capacity and new milk processing sites coming on line, particularly in Australia’s south-east. These sites are in close proximity to approximately 80% of Australia’s milk supply, shortening the distance between farm and processor.
The DMSC reported that in 2010–11, diesel fuel represented the largest component of transport energy in the dairy industry.
Advantia Transport Consulting (2016) conducted a study on behalf of Dairy Australia to address supply chain inefficiencies for the Australian dairy industry. Eight milk processing companies and two transport companies were consulted for the study. The supply chain map presented on page 30 (Figure 7) illustrates the transport channels post-farm. Efficient transport must not only run from farm to processor but from processing plant to domestic market, secondary processor and port for export.
Current research suggests that travel distances between farm and processor vary between dairy production regions. Both a mix of short and long-haul movements of milk and dairy products make up the total transportation of milk across Australia. Advantia Transport Consulting (2016) provides a detailed description of the truck fleet, average travel distances and associated trips for the Australian dairy industry. The dairy truck fleet is made up of six-axle, seven-axle, B-double and A-double vehicles. Average travel distances range from less than 50 km across Northern NSW and Southern Queensland to more than 350 km for the WA dairy region. The number of trips between farm and processor can fall between 9000 for WA to more than 25,000 per year in the Northern Tasmanian region.

The impacts of energy costs on the Australian agriculture sector | August 2018
SECTION 2: Sector analysis 27
Energy cost analysisTable 8: Impact of energy price change on the
dairy sector.
Aggregated supply chain
sectors
Base cost per annum
Modelled cost scenario pa*
Input $ 102,023,012 $ 114,707,325
Production $ 142,797,600 $ 185,636,880
$ 94.57 /head $ 122.94 /head
Transport $ 219,131,237 $ 230,087,799
Processing $ 127,240,326 $ 159,228,971
$ 14.11 /kL $ 17.66 /kL
Total $ 591,192,175 $ 689,660,975
Cost impact $ 98,468,800
*of a 30% cost increase in electricity and a 5% increase in all other major energy sources
Input
Manufactured feed demand from dairy production is strong. Although dairy farms are largely pasture based, with 70–75% of feed requirements coming from grazing during a normal season, there is a reliance on supplementary feeding during drier seasons and periods of low pasture growth. Feed demand varies depending on the extent to which bought in, manufactured feed substitutes for pasture grown on-farm.
Australian dairy producers also heavily rely on crop nutrition products for strong pasture growth. It is estimated that the dairy industry accounts for approximately 25–30% of the total fertiliser used in Australia (Fertilizer Use on Australian Dairy Farms, 2013). The most common fertiliser products applied across the bulk of dairies include urea (nitrogen based) and superphosphate. The manufacture of these fertiliser products is energy intensive and prices are increasingly linked to prices in the natural gas market.
The dairy industry has shifted from hot water sanitising to chemical sanitising recently, resulting
in a strong surge in demand for chemical products. This is the case more strongly for some production regions including Gippsland and West Victoria regions with more than 50% of farmers using a chemical sanitiser at least once per day (Dairy Australia, 2018).
Production
Australia has eight dairy production regions operating across all states. A dairy is an extremely energy-intensive operation. Although energy use and costs depend largely on the individual operations of a dairy system and herd size, the most common highest dairy shed energy costs include milk harvesting, milk cooling and water heating (Dairy Australia, 2016). These activities account for an 80% portion of total energy use and costs on-farm, with cooling requirements being the highest cost for most dairy operations.
Dairy is a major water user in the agriculture industry. It is the second largest user of irrigation water in Australia, with irrigated dairy farming representing 18% of total irrigated land (Khan, Abbas, Rana, & Carroll, 2010).Water is used on-farm for three main activities: growing pasture, dairy shed operations and drinking water for cattle. The greatest amount of water is needed for growing pastures through irrigation and requires a significant amount of either electricity or gas for pump operations.
Transport
Transport is one of the most significant costs for dairy manufacturers (Australian Dairy Industry Council & Dairy Australia, 2014). Milk is highly perishable and requires processing 48 hours after pickup, therefore the dairy industry is heavily reliant on efficient means of transport to deliver both fresh and manufactured products to market. Road transport is dominant, involving transfer of raw milk from farm to processing facility, as well as from factory to domestic market and port for export. The location of factories has evolved near dairy farming regions, meaning lower use of fuel for transport in some cases.

August 2018 | The impacts of energy costs on the Australian agriculture sector
SECTION 2: Sector analysis28
Diesel is the largest component of dairy transport energy use and cost. Higgins et al. (2017) report an annual average transport cost for the entire industry as $881,736,430 inclusive of road costs only. These costs are assumed to be associated with fuel use (diesel) alone and are associated with the two main supply chain paths, milk and cheese.
There is large variation in travel distances between farm and processor across the different dairy production regions with both a mix of short- and long-haul movements. Geographical spread among some dairy production regions means that some factories require milk to be transported long distances (and are therefore more exposed to diesel prices).
Processing and manufacturing (milk, butter, cheese, milk powder)
Australia produces a range of high quality dairy consumer products, including fresh drinking milk as well as manufactured products such as cheese, butter, yoghurt and milk powders. The processing sector has approximately 400 dairy manufacturers with six large dominating companies. Dairy
processing companies are among the top 300 energy users in (ADIC & Dairy Australia, 2014), with sector-wide energy costs in the range of $170 million per year. The increase in energy prices will have an even greater impact on manufacturers of the more energy-intensive dairy products such as milk powders.
Energy use at the dairy processing stage varies greatly depending on type of product. Different energy intensities have been included in the energy cost modelling. Whey and milk powders are the most energy intensive to manufacture, therefore the cost impact is likely to be greater for whey and milk powder manufacturers and less for manufacturers of other dairy products.
The two main sources of energy used by dairy manufacturers are natural gas and grid electricity. The cost mix for processors is spread roughly 50:50 between electricity and gas. ADIC and Dairy Australia have identified several changes in the cost structure of dairy manufacturing, notably: an increase in electricity prices, projected increases in gas prices and increased diesel prices.
Figure 7: Dairy supply chain map.Source: http://www.advantia.com.au/project/dairy-industry-transport-priorities/

The impacts of energy costs on the Australian agriculture sector | August 2018
SECTION 2: Sector analysis 29
GrainsIntroduction
Australian grain production is characterised by production of predominantly winter cereals, produced across a wide geographic area with differing climate, soil characteristics and management requirements. Approximately 80% of Australian grain is produced from rainfed production systems. Irrigated grains production, while significantly smaller in production area, typically produces higher yield per hectare (up to three times that of rainfed production). Like most industries in the Australian agricultural sector, recent information on energy consumption is limited.
In 2015, RIRDC released the Benchmarking energy use on-farm report (Chen et al., 2015). The grains section of this report investigated energy consumption in winter wheat and barley, and sorghum under rainfed and irrigated production conditions. For systems operating under rainfed conditions, data was segregated by system type (conventional or zero-tillage). The data was reported by characterising national grains production for three agro-ecological zones (AEZs):
1. The Southern Region covering south-eastern Australia, including central and southern NSW, Victoria, Tasmania, and south-eastern South Australia
2. The Northern Region covering Queensland and northern NSW
3. The Western Region covering Western Australia.
Khan, Khan, and Latif (2010) investigated energy use for wheat and barley production based on farm survey data from Coleambally Irrigation Area (CIA) and Murrumbidgee Irrigation Area (MIA) of NSW. They calculated the total life cycle energy inputs for wheat and barley as 3028 and 2175 kWh/ha or 10.9 and 7.8 GJ/ha, respectively.
Chen et al. (2015) report on a study which investigated the energy-saving opportunities for various farming enterprises in Western Australia. The energy use data is based on the published data of Western Australian agriculture enterprises contained in the Planfarm Bankwest Benchmarks 2011–12 report. This was further complemented by seven case studies of typical farming enterprises. It was shown that diesel was by far the largest (at 85–90%) on-farm energy source and cost for all enterprises. The average on-farm energy use was 0.83 GJ/ha, consisting of 20 L diesel, 1.5 L petrol and 2.4 kWh of electricity. Another study identified in the report found that this can be as low as 0.35 GJ/ha in south-western Australia.
Due to the highly variable and opportunistic nature of grains production systems, consistent energy data is difficult to find and measure. The most recent information from RIRDC on the grains industry is limited by its methodology and standard reporting of fuel use as diesel only, and is restricted to farm-level reporting. The variability in operational tasks at the farm level makes it difficult to validate this data in real terms and to compare findings in a broader context. The report provides insufficient information on the impact or association of this data with cost of production, and does not identify any meaningful strategy to reduce energy costs.
The study reported diesel usage by averaging the three production regions, calculating that wheat (42.7 L/ha) and barley (39.2 L/ha) under rainfed conventional tillage systems require the greatest volume of diesel per hectare, followed by sorghum (19.3 L/ha). The corresponding numbers using the zero-tillage system were 20.3, 19.6, 24.1 L/ha respectively. Where irrigation was practiced, the required average energy inputs for field operations (except for irrigation fuel) was 34.5 L/ha for barley, 30.3 L/ha for wheat and 28.5 L/ha for sorghum.

August 2018 | The impacts of energy costs on the Australian agriculture sector
SECTION 2: Sector analysis30
Energy cost analysisTable 9: Impact of energy price change on the
grains sector.
Aggregated supply chain
sectors
Base cost per annum
Modelled cost scenario pa*
Input $ 352,228,467 $ 358,961,100
Production $ 609,978,846 $ 652,126,776
$ 10.11 /t $ 10.81 /t
Transport $ 534,271,041 $ 560,984,593
Processing $ 95,680,200 $ 122,330,835
$ 1.59 /t $ 2.03 /t
Total $ 1,592,158,555 $ 1,694,403,305
Cost impact $ 102,244,750
*of a 30% cost increase in electricity and a 5% increase in all other major energy sources
Around 25 million hectares are planted annually to commercial grain crops (wheat, coarse grains, pulses and oilseeds) across Australia, primarily as part of either summer- or winter-dominant (or both) production systems in the northern and southern grain growing regions, respectively. In 2015–16, 22.3 million tonnes of wheat were produced, equating to around 56% of total grain production (approximately 40 million tonnes).
Direct energy use on-farm is greatest for operations such as tillage, fertiliser application, boom spraying, planting, aerial spraying and irrigations (water pumping). A large amount of indirect energy is also required for production, packaging, storing and transportation of various farm inputs such as fertilisers, chemicals (herbicides, insecticides, fungicides and plant regulator), fuels and farm machinery; and post-harvest operations such as transportation, storage and processing of harvested products.
Input
The greatest energy demand in grains production is typically associated with the major inputs associated with crop nutrition, and pest and disease control.
Production
At the farm level, fuel use (diesel and petrol) is the most significant source of energy. The majority of fuel is used for irrigation and as part of sowing, harvest, post-harvest and maintenance operations.
Transport
The annual diesel cost for transport in the Australian grains industry is approximately $534,271,041. This cost covers transport movements between on-farm storage facilities, off farm siloes, export ports, stock feed manufacturers, feedlots and flour mills. Grain is transported from storage facilities to port by both road and rail.
Post-farm/processing
Following harvest, grain not retained for seed or consumed on-farm will enter the domestic and/or export supply chains or direct to buyer. The domestic market comprises a human consumption market, a feed grain market and a small industrial market (primarily ethanol), all of which require significant energy inputs during transformation, e.g. grain milling and processing involves a number of processes, including flour milling, (animal) feed milling, breakfast cereal production, oils and other grain products, including alcoholic beverages.
The current analysis was not inclusive of energy inputs for flour milling due to complex secondary processing where limited data was available.

The impacts of energy costs on the Australian agriculture sector | August 2018
SECTION 2: Sector analysis 31
Cotton Introduction
The Australian cotton industry is one of the most highly mechanised sectors of the Australian broadacre agricultural industries. The irrigated component of cotton production is subject to high levels of direct energy consumption in the form of diesel fuel and electricity. Generally, the more water-efficient an irrigation system is, the more energy it requires. The costs associated with this higher energy usage have been the subject of ongoing debate, and questions have been raised about the trade-off between water efficiency and energy intensity which present a dilemma to farmers facing water scarcity, high water charges and high energy costs. These factors make cotton one of the most extensively audited industries in the Australian agriculture sector.
According to CottonInfo and the Cotton Research and Development Corporation (CRDC) benchmarking report (Foley et al. 2015), Improving Energy Efficiency on Australian Irrigated Cotton Farms, around 50% of energy consumption at the farm level is for irrigation and about 25% is for high-load tractor operations during the field preparation and post-harvest phases of cotton production, with around 90% of a farm’s energy consumption derived from diesel. The benchmarking report is one of many conducted with the primary aim of establishing and promoting a more energy-efficient sector, resulting in initiatives developed for cotton growers which include energy efficiency tips, case studies and fact sheets. In addition, CottonInfo have also established ‘MyBMP’, the cotton industry’s best management practices program, an online platform for individual on-farm benchmarks. MyBMP takes into account region, water usage, irrigation system type, water source and pump type, as well as pumping practices.
Most industry data is reported by the CRDC in conjunction with the National Centre for Engineering in Agriculture at the University of Southern Queensland and CottonInfo. The Improving Energy Efficiency on Irrigated Australian Cotton Farms study presents farm level data derived from 198 whole-of-farm energy assessments on diesel and electricity for irrigation. Information was reported on a per hectare and per bale basis, adhering to the parameters that:
• One litre of diesel contains 38.6 MJ or 0.0386 GJ of energy
• One kWh of electricity contains 3.6 MJ or 0.0036 GJ of energy.
The authors reported that in terms of industry pumping values, the average pump efficiency is about 80%, the average drive train efficiency is 95%, the average large diesel motor efficiency is about 35% and the average electrical motor efficiency is about 90%. The median direct energy use per hectare was determined as 11.2 GJ/ha to produce 10.7 bales/ha, around 1.1 GJ direct energy use per bale.
Diesel fuel provided at least 90% of the direct energy used on-farm, making up at least 85% of the total direct energy expenditure. The median direct energy expenditure across 198 farms audited was $298/ha across the two separate data sets, representing 8.5% of 2013 average cotton production costs (reported as $3627/ha). The study reported that the total direct energy expenditure represented in this data set of 158 results was around $77 million, which would only represent a small proportion of the total direct energy expenditure of the Australian cotton industry.
The study also included a Level 2 analysis of 40 cotton producing farms and provided a breakdown of median energy (diesel) use and cost at an operational level (Table 10).

August 2018 | The impacts of energy costs on the Australian agriculture sector
SECTION 2: Sector analysis32
process is lower than 15%. The cost of gas in producing one bale ranges between $0.98–3.39/bale. Overall, the gas and electricity usage comprise approximately 39% and 61% respectively of the total energy usage (GJ/bale) in the cotton ginning process. On average, the total national benchmark energy cost (both electricity and gas) was $10.70/bale. This thesis was the basis for further research and resulted in the publishing of a research report expanding the study to include more farms (Ismail, Chen, Baillie, & Symes, 2011), and was also incorporated into an LCA (Khabbaz, 2010).
NSW Irrigators Council (NSWIC) (Schulte, 2012) released a briefing note in 2012 that provided a background on the development of electricity prices, and the impact they had on irrigated agricultural production. The document was designed to address the principles that must be considered when designing and implementing a suitable framework for electricity price setting in NSW. It covered considerations from regulation to competition and tariffs, and proposed potential recommendations for changes in policy to reduce energy costs across the sector.
In 2014, Cotton Australia and CRDC released an industry first, Australian-grown cotton sustainability report. It contained information on energy and
The project outlines important discrepancies in industry-level data and difficulty obtaining data collected by consistent methods. Unlike an LCA, the methodology used in these benchmarking studies does not require all sources of fuel use on-farm to be accounted for, therefore leading to discrepancies when comparing data to sources.
Post-farm, some analyses have been conducted for the process of ginning (Ismail, 2009), which is an energy-intensive process. Ginning includes drying, cleaning, gin standing and baling/pressing, with electricity consumption closely correlated with bale numbers produced. Ismail (2009) evaluated the energy usage of Australian cotton gins, using previously benchmarked electricity use of 44–66 kWh per bale, and a national average of 52.3 kWh (years 2007 and 2008). At the time of the study Ismail noted the significant cost of electricity network charges for ginning operations, an issue which is still persistent today.
Gas usage for drying was another factor highlighted. Gas usage is strongly influenced by the amount of moisture removed from the incoming cotton, as well as the regulated drying temperature. The drying process uses some 0.74–3.90 meters cubed of natural gas or 2.27–5.61 L of LPG per bale. Overall thermal efficiency of the drying
Table 10: Breakdown of the median energy use results across 40 growers for the seven major processes in irrigated cotton production, with the costs of energy per hectare for a common $1 per litre for diesel as a percentage of total costs.
Whole farm and crop operation level
Direct energy use (GJ/ha)
Cost of energy use ($/ha) at $1/L
Percentage of total (%)
Ground preparation 0.90 23.40 10.3
Plant establishment 0.12 3.12 1.40
Irrigation 4.40 114.40 50.6
In-season in-field 0.41 10.66 4.70
General/Maintenance 0.47 12.22 5.40
Harvesting process 1.20 21.20 13.8
Post-harvest crop destruction 1.20 21.20 13.20
Total for green cotton area 8.70 226.20 100

The impacts of energy costs on the Australian agriculture sector | August 2018
SECTION 2: Sector analysis 33
noted that cotton production consumes on average 10.9 GJ/ha (or 1.18 GJ/bale) at a cost of $310/ha, equivalent to $34/bale.
To help farmers identify their potential for saving energy costs, the industry has developed protocols and web-based tools known as EnergyCalc for measuring and assessing on-farm energy use. EnergyCalc allows cotton farmers to evaluate their energy performance and identify potential energy savings, with individual assessments reporting energy cost savings as high as 30%. These figures are likely to have increased in the past three years.
Energy cost analysisTable 11: Impact of energy price change on the
cotton sector.
Aggregated supply chain
sectors
Base cost per annum
Modelled cost scenario pa*
Input $ 43,175,310 $ 46,044,866
Production $ 129,800,000 $ 141,157,500
$ 31 /bale $ 34 /bale
Transport $ 22,410,271 $ 23,530,785
Processing $ 74,204,096 $ 96,052,675
$ 18 /bale $ 23 /bale
Total $ 269,589,678 $ 306,785,826
Cost impact $ 37,196,148
*of a 30% cost increase in electricity and a 5% increase in all other major energy sources
In 2016–17, the Australian cotton industry produced around 4.2 million bales of cotton on 472,000 ha across around 1500 farms (Cotton Australia, 2017). Australia is the fifth largest exporter in the world, behind the USA, India, Brazil and Uzbekistan, and
99% of Australia’s raw cotton is exported, with around 55% destined for China. On average, the Australian cotton industry employs around 6500 individuals, or 10,000 in a non-drought year.
The cotton industry is highly mechanised and, as such, is a significant user of electricity, LPG and diesel. At the input stage, the primary energy demand is derived from the manufacture of fertilisers and agricultural chemicals for crop nutrition and pest and disease control. Energy consumed as part of on-farm production activities is dominated by electricity for irrigation and fuel, namely diesel, used for pre-harvest, harvest and post-harvest and maintenance operations. Total diesel costs for the cotton industry were calculated at $22,410,271.
Post-farm or processing of cotton involves ginning, where harvested cotton is separated into raw fibre (lint) (35%), seed and waste (65%). A seasonal operation, ginning is typically carried out between March and August. The major processes at ginning are in-feed and initial drying, cleaning and second moisture control, ginning, moisture conditioning and baling. During the ginning season, while most gins operate 24 hours per day every day, energy consumption is highly sporadic (along with outages) which has been reported to impact the base statistical relevance of base-load and peak-load values (Auscott, Energy and Management Services Pty Ltd, & Office of Environment and Heritage, 2012). The most significant energy use post-farm at ginning is electricity consumed for drive-motors (e.g. fans, conveyors and cotton presses). Other electricity-consuming systems are lighting, air conditioning, and ‘miscellaneous processes’, which can make up as little as 1% of total energy consumption. LPG is a significant source of energy (possibly more than electricity) and is used for gas burners for drying cotton.

August 2018 | The impacts of energy costs on the Australian agriculture sector
SECTION 2: Sector analysis34
Sugar Introduction
The Australian sugar industry covers 4600 growers supplying 24 raw sugar mills owned by eight separate milling companies. The Australian Sugar Milling Council (2017) estimates that in the 2016 season there were 36,500,000 tonnes of cane crushed and 4,770,000 tonnes of sugar produced; 95% of this was produced in Queensland, with the balance from Northern NSW. Australia exports around 80–85% of its raw sugar, and most of the refined sugar produced is sold in the domestic market.
A range of energy inputs are required at different stages of the supply chain, the most intensive stage being use of electricity to pump water on-farm for irrigation. However, the industry has a strong utilisation of waste streams. Therefore the bulk of current studies focus on transitioning to a low carbon economy, with research primarily based on energy generation and co-generation, namely bioenergy and biofuels. Other areas of research include energy efficiencies and savings. The use of the renewable cane residue bagasse (e.g. for biofuel) has been the focal point of many recent studies undertaken by the industry, partly due to the high level of attention given to fossil fuel exploitation and climate change.
While the industry is already transitioning to a clean energy economy, producing enough renewable energy to supply surplus electricity back to the grid, it is a significant user of fossil fuel-based energy in the growing, harvest and transport stages of the supply chain. However, research on measuring energy use and consumption across the sugar supply chain and at the industry level is limited, despite its increasing importance given the industry’s energy intensiveness.
As part of the Queensland Farmers’ Federation (QFF) Energy Savers Program (2016), QFF has conducted more than 130 audits of on-farm irrigation and processing systems throughout Queensland. The objective of the program is to assist farmers in reducing energy costs, to identify suitable energy efficiency opportunities and to support the accelerated adoption of renewable
energy alternatives. A series of case studies have been completed as part of the program, which include six cane sugar farms. These studies look at the type of irrigation system and annual pump operating cost.
Samson (2017) indicated irrigation as an energy hotspot for sugarcane farmers. Cane growing regions rely on supplementary or full-time irrigation to grow crops, and irrigation challenges have recently arisen due to high (and increasing) energy prices. The cost of energy has been acknowledged as major disincentive for producers to use water as needed, even to the extent that growers are not irrigating. High pressure irrigation systems are becoming uneconomic and, as a result of high energy costs, are being phased out.
Current research undertaken by Sugar Research Australia (SRA), some of which is detailed in Opportunities for energy innovation in Australian irrigated sugarcane (Welsh & Powell, 2017), aims to identify productivity improvements through energy innovation in the Australian sugar industry. This is likely to provide some clarity to growers on how to remain viable in the short term, but is unlikely to offer the appropriate evidence needed for industry to engage in constructive discussion on energy policy over the medium to longer term.
Renouf and Wegener (2007) conducted research aiming to quantify life cycle environmental impacts of raw sugar production and put the environmental impact of cane production into perspective. The environmental information generated on raw sugar production included energy input. Energy inputs were based on production practices in Queensland, in which the state accounts for approximately 95% of total production and the results presented show the life cycle impact of producing one tonne of raw cane sugar in Queensland.
Cropping practices were found to have a significant influence on LCA results for agro-industrial systems, therefore three cane growing scenarios were constructed and considered in the analysis. These included a state average and two distinct cane growing regions with differing farming practices and climate conditions. Brief outlines of the

The impacts of energy costs on the Australian agriculture sector | August 2018
SECTION 2: Sector analysis 35
scenarios are described below:
1. Wet tropics – low nitrogen input, no irrigation, high levels of ratooning, lower cane and sugar yields
2. Burdekin – high nitrogen input, high irrigation requirements, lower levels of ratooning, higher cane and sugar yields
3. State average – area weighted state averages for cane yields and inputs such as fertiliser, chemicals, water, fuel etc.
Large variations in energy input were recorded between the wet tropics, Burdekin and the state average. Energy input was lowest for the wet tropics and highest for the state average. The wet tropics recorded an energy requirement of 2500 MJ/tonne of raw sugar, Burdekin recorded 3000 MJ/tonne, and on average the state energy requirement is approximately 3800 MJ/tonne of raw sugar.
The variations were attributed to differences in irrigation between the regions and state average. The differences were largely due to the type of irrigation system adopted. For example, for the Burdekin region the volume of irrigation is high, but furrow irrigation systems are predominant and have relatively low energy demand. Across Queensland as a whole, high pressure systems are employed more commonly and require greater quantities of energy to operate.
The research also provided a breakdown of the contributing activities. Contributors to overall energy input, based on state averages, saw the most significant factors being electricity used for irrigation (41%), fertiliser production (26%) and on-farm fuel use (22%).
Sugar mills have the potential to be self-sufficient in energy. As a valuable by-product of the sugar cane production process, bagasse is available as a
fuel to generate electricity and steam for factory operations. The LCA identified the growing potential for bagasse, particularly at the processing stage, which was determined to account for all energy requirements from milling to processing into sugar. There is a small quantity of fuel used for boiler start-up. Accordingly, there is virtually no fossil fuel energy input for cane processing.
In light of the growing concern about energy policy and the implications on cane farmers and the industry more generally, the Queensland Cane Growers Association (Canegrowers) has become an important advocate for improved energy policy. More specifically, the group is pushing for an electricity generation and distribution system that efficiently, sustainably and affordably delivers electricity to all Queenslanders.
Electricity was a standout issue in the Canegrowers Annual Report 2016–17 (Canegrowers, 2017). Canegrowers reported that over the past nine years, electricity costs for the industry have risen more than 130%, despite the industry becoming more efficient in electricity use through the use of new technology. The exponential growth in electricity prices has seriously threatened farm productivity and competitiveness. Currently, Canegrowers is calling for a 30% reduction in electricity prices from 2015–16 levels.
Canegrowers has joined with other members of the Australian Agricultural Industries Energy Taskforce who are working to examine the crippling cost of electricity on agricultural industries. As part of its energy advocacy effort, Canegrowers has also joined the Chamber of Commerce and Industry Queensland (CCIQ) and QFF in forming the Queensland Industry Energy Alliance (QIEA). The QIEA has stressed the growing cost of energy. Between 2007–08 and 2013–14 Queensland electricity prices have doubled, largely driven by network charges. Network charges were found to have contributed to more than 95% of the total

August 2018 | The impacts of energy costs on the Australian agriculture sector
SECTION 2: Sector analysis36
electricity price increases over the period.
Energy cost analysisTable 12: Impact of energy price change on the
sugar sector.
Aggregated supply chain
sectors
Base cost per annum
Modelled cost scenario pa*
Input $ 38,072,764 $ 39,976,402
Production $ 198,026,934 $ 251,722,761
$ 44.20 /t $ 44.13 /t
Transport $ 15,457,354 $ 16,230,222
Total $ 251,557,053 $ 307,929,385
Cost impact $ 56,372,332
*of a 30% cost increase in electricity and a 5% increase in all other major energy sources
The most energy-intensive aspects along the sugar cane supply chain are fertiliser, irrigation and on-farm fuel use. Despite being at the forefront of bioenergy developments, with a number of partnership opportunities present with the bioenergy sector, the sugar industry is a significant user of fossil fuel based energy throughout the growing, harvesting and transport stages of the supply chain.
Energy is used indirectly through the use of energy-intensive crop nutrition and agrochemical products. One of the most significant cost factors is electricity used in the production of fertiliser (Renouf & Wegener, 2007). The most common fertiliser expenses used in sugar cane production are for urea and diammonium phosphate (DAP), as well as a variety of prescription blends. Lime is an additional fertiliser applied to sugar cane crops. Lime production is extremely energy-intensive, where the quality of lime depends directly on the quality of fuel. The fuels most widely used in lime production are coal and natural gas. Natural gas kilns are predominantly used for lime production as they deliver consistent, high quality lime, however they use 10% more energy than coal-fired kilns (Crump, 2000).
Production
Irrigation activities are the most energy-intensive stage along the sugar supply chain. A significant energy hotspot for producers is electricity used to pump water. Sugar cane producers rely on some form of irrigation, either supplementary or full-time, to grow crops. Energy use varies greatly between irrigation systems, with particular cost concerns for those operating high-pressure systems compared to furrow irrigation. There has been a common shift to diesel for irrigation pumping in order to combat the growing costs of electricity.
Transport
The sugar industry depends heavily on efficient transport systems. Freshly harvested cane requires transportation to the sugar mill ideally within six to 12 hours and no later than 24 hours for processing. The road and rail network is utilised differently depending on production region. In some cases, mills are completely reliant on road transport, while others utilise a combination of road and rail transport with short road transport for delivery of sugar at a rail load point.
Direct rail is the most frequently used method of transport. The transportation of sugar cane from farm to the mill is achieved through a substantial cane railway network. The network operates over 4000 km of narrow gauge railway, moving 95% of the cane crop to mills. There is only a small tonnage of sugar transported via the road network, however road transport plays an important role within industry. Due to capacity, there are smaller loads moved via road transport, therefore more trips are required to transport a given amount of cane.
Diesel fuel is used for both rail and road transport. The type of vehicles used for transport are diesel hydraulic cane trains. Cane trains are the most fuel-efficient means of transport, consuming less fuel per tonne of cane. Generally, sugar is transported to the nearest mill depending on contractual arrangements. Raw sugar for the export market is transported to the nearest suitable port with the appropriate storage capacity. The current analysis assumes a diesel cost (road and rail) of $15,457,354 for the

The impacts of energy costs on the Australian agriculture sector | August 2018
SECTION 2: Sector analysis 37
sugar industry. Rail costs exclude sugar transported via narrow gauge railway. Also excluded from the total cost are NSW mills, which are geared to the domestic market.
Processing
The sugar industry is at the fore of bioenergy developments, particularly at the processing and manufacturing end of the supply chain. Sugar cane is recognised as an efficient source of renewable biofuel. The processing stage consists of a number of activities including cane preparation, juice extraction, clarification and sugar crystallisation and drying as well as packing and delivery. Sugar mills are generally self-sufficient with virtually no fossil fuel energy inputs. During processing, rollers separate sugar juice from the fibrous cane material, and this cane by-product (bagasse) is recycled as a fuel. It is commonly used to generate electricity and steam for a range of factory operations. This is the case except for the small quantities of natural gas required for boiler operations.

August 2018 | The impacts of energy costs on the Australian agriculture sector
SECTION 2: Sector analysis38
HorticultureIntroduction
Australia’s horticulture industry covers 140 commodities including but not limited to fruits, vegetables, nuts, table and wine grapes, flowers, turf and nursery products. Horticultural production in Australia exceeded 5.7 million tonnes in 2014–15 (Rural Bank, 2017). At the year ending June 2015, the value of horticultural production was approximately $10.59 billion (Horticulture Innovation Australia, 2017). It is the third largest agriculture sector in Australia by value behind livestock and broadacre farming. The horticultural industry can be grouped into the following broad product categories (Horticulture Innovation Australia, 2016), listed below with their respective GVP:
• Fruit and nuts ($3.5 billion)
• Vegetables ($3.9 billion)
• Nursery, cut flowers and turf ($1.4 billion)
• Table and dried grapes ($351 million).
The industry has placed a strong research focus on environmental impacts with some detail of energy inputs. With a wide range of products to be covered, recent publications have tended to report energy use estimates for a certain crop or group of crops, however there has been no recent study on the environmental impact from horticulture in aggregate. Of the published material available, there are examples of the environmental impact of major horticulture crops, namely vegetables (potatoes and tomatoes) and the temperate fruit industry (stone fruit, apple, pear and cherries).
The potato industry is an important contributor to the value of the wider horticulture industry in Australia. The industry can be separated into two sectors: potatoes grown for use in processed foods and for fresh market production. One of the few studies that records energy use in horticulture, undertaken by Norton et al. (2008), involves two different models to quantify and model the environmental footprint of the potato processing industry.
A review of environmental concerns associated with the potato processing industry revealed several pressing environmental issues, notably the use of fertiliser and pesticides, energy use and GHG emissions. The work aimed to investigate the significance of these issues across the supply chain from farm to factory, energy use being a major focus. Several case studies from various regions were included:
• Tas 1 (Tasmania)
• Tas 2 (Tasmania)
• Tas 3 (Tasmania)
• Mallee (Victoria)
• Lockyer Valley (Queensland).
Energy productivity of the crop was reported in MJ per tonne of marketable crop and included both direct energy and embedded energy. Energy requirements of potato crops varied widely from 26,249 MJ/ha in the Lockyer Valley to 55,458 MJ/ha in Tas 3 (processing variety Russet Burbank). The main contributors to energy use in Australian potato cropping were diesel, the manufacturing of fertiliser products and electricity.
Diesel made up a significant portion of energy use on-farm, contributing 54% to energy use in Australian potato crops. The type of irrigation pump had a significant influence on the results of diesel use on-farm. Diesel use in potato crops varied from 326.9 L in Lockyer Valley to 551.5 L in the Mallee crop. The Mallee crop recorded a high diesel use due to operating a diesel irrigation pump, compared to electric pumps adopted for all other cropping regions.
Electricity is another major contributor to total energy use in potato production. Electricity is required for pumping for irrigation. Irrigation in the vegetable industry is predominantly centre pivot, linear move or big gun travelling irrigator, all with different energy requirements. Electricity use for irrigation varied from 532.4 kWh delivering 2.2 ML/ha in the Lockyer Valley to 1525 kWh delivering 5.1 ML/ha in Tas 3.

The impacts of energy costs on the Australian agriculture sector | August 2018
SECTION 2: Sector analysis 39
Page, Bellotti and Ridoutt (2011) investigated the environmental impacts from tomato production systems. The research undertaken involved collection of life cycle inventory data collected from interviews with both growers and managers from two regions. Information was collected on the general inputs and outputs including the use of fertiliser, pesticides, electricity and fuels. Three systems were described in the study, which included one field production system located in the Bundaberg region of Queensland and two greenhouse systems in Sydney, NSW. For the greenhouse systems analysed, one low and one medium tech facility were chosen due to differences in level of automation and yields.
The total energy footprint was expressed per kilogram of fresh tomato for the Sydney market. Energy is consumed indirectly during the manufacture of farm inputs, for example, diesel and fertilisers. It was observed that the energy footprint varies significantly across systems, ranging from 4.95–19.1 MJ/kg of tomatoes.
In 2013 Apple and Pear Australia Limited (APAL) developed the Watts in Your Business program in partnership with KMH Environmental Pty Ltd (KMH), funded by the Commonwealth Government’s Energy Efficiency Information Grant (EEIG). The program was set up to assist the temperate fruit industry (covering apple, pear, summerfruit and cherries) and address the knowledge gap on how to reduce energy use.
As part of the program, energy audits of 30 representative small to medium packhouses and orchards were completed. The program identified that these 30 enterprises consumed more than 42 million kWh of energy per annum at a total cost of over $5.7 million dollars. APAL (2014) provided an analysis of the energy audits and has developed KPIs to help industry understand their energy performance. Energy KPIs were based on electricity, LPG and fuel use and were reported per tonne. It was found that on average the industry consumes 309 kWh at a cost of $41 per tonne of fruit produced.
Crop type has a significant impact on energy performance. APAL (2014) provide a breakdown of KPI by crop type with some fruits being more energy-intensive than others, e.g., fruit harvested in summer was found to be more energy-intensive and stone fruits and cherries were reported to be the most energy-intensive. The higher energy consumption for these types of fruit is due to periods of intensive cooling and the operation of hydro coolers.
Energy cost analysisTable 13: Impact of energy price change on the
horticulture sector.
Aggregated supply chain
sectors
Base cost per annum
Modelled cost scenario pa*
Input $ 8,409,035 $ 9,423,602
Production $ 209,115,960 $ 241,766,857
$ 59.70 /t $ 69.02 /t
Transport $ 101,355,383 $ 106,423,152
Total cost $ 318,880,378 $ 357,613,611
Cost impact $ 38,733,233
*of a 30% cost increase in electricity and a 5% increase in all other major energy sources
Horticulture is a highly diverse industry, and throughout various commodity supply chains, different primary energy is employed. Strong energy use is present at both primary production and processing stages of the supply chain. Despite this, electricity is typically regarded as the major energy source across the supply chain. Energy consumption is more significant for protected cropping and increases dramatically towards the final stages of the supply chain.
Production
Overall, the most electricity-intensive operations across the horticulture supply chain are cold chain operations and irrigation. Cold chain operations represent approximately 70% of the total energy used across the supply chain (Estrada-Flores, 2010). In vegetable production, there are three broad areas

August 2018 | The impacts of energy costs on the Australian agriculture sector
SECTION 2: Sector analysis40
of cold chain operations. These features are similar for many other sensitive horticulture products that must be immediately cooled after harvest.
The primary stage of processing involves pre-cooling. Immediate post-harvest cooling management is critical to ensure product quality for sensitive products. However, a large range of fruit and vegetable products are stored at ambient temperatures. Secondary stages of processing require elements of energy for chilling and freezing requirements.
Horticultural commodities are heavily reliant on irrigation. Approximately 90% of Australian horticulture is under irrigation (ANZ, 2015). High energy costs for water pumping are common within the industry, primarily for diesel and electricity use.
Energy use varies greatly depending on production system. Protected cropping and greenhouse agriculture is one of the fastest growing food-producing sectors in Australia. Growth in the sector is attributed as a response to climate risk, however the viability of the sector is being tested given the rise in energy costs. With greater heating, cooling and climate control needs, energy requirements and costs are strongest for these producers. Field cropping enterprises consumed energy from three key sources, electricity, fuel for machinery and fertiliser (Estrada-Flores, 2010). Electricity is the major source of energy use due to the adoption of electrical powered pumps for irrigation.
Transport
Energy is also vital for refrigeration and storage activities associated with distribution. The often-delicate nature of produce renders an efficient and safe horticultural freight network essential. Transport costs have been estimated at 20% of the total cost of production and a significant cost for the industry. Approximately 80% of produce requires cold freight (ANZ, 2015).
A diesel cost of $101,355,383 for road transport was calculated for horticulture. The transport cost is modelled from selected crops. For the report, production locations and transport volumes for the selected crops were derived from the Australian land use and management (ALUM) dataset and ABS. Diesel fuel for transport contributes $153,538,762 to the total horticulture transport cost.
Transport costs per individual commodity were difficult to assess given that horticulture commodities are grouped by generic commodity group.
Post-farm (processing & manufacturing)
The fresh domestic segment is the main market for vegetables, however a significant proportion of vegetable and fruit is processed into frozen, tinned and dried products. The manufacturing of certain fruit and vegetable commodities necessitates a greater energy input. For example, potato processing requires both cooling (freezing) and heating (blanching and frying) (Estrada-Flores, 2010).

The impacts of energy costs on the Australian agriculture sector | August 2018
SECTION 2: Sector analysis 41
Wine grapesIntroduction
Australia is the sixth largest wine producer in the world (Wine Australia, 2016). The industry has 65 wine growing regions with 6251 grape growers and 2468 wineries. In 2016, the total wine grape crush was 1.8 million tonnes, of which South Australia accounted for 926,430 tonnes or 51% of the total crush. Winemakers produced approximately 1.3 billion litres of wine (Wine Australia, 2016).
Wineries are energy- and water-intensive businesses, with electricity, fuel and refrigeration all major costs in winemaking. The Australian Wine Research Institute (AWRI) has placed significant attention on energy, as the success of the Australian wine industry is strongly tied to its long-term relationship with the natural environment. Their recent report (AWRI, 2017) states ‘improving environmental performance’ as a key industry focus. In particular, targets have been set for the closer monitoring of natural resource metrics including energy, water, fertilisers and agri-chemicals.
The Australian wine industry’s commitment to environmental performance is not new. In 2009 the Winemakers’ Federation developed Entwine, an environmental assurance program aimed to help wine producers communicate their commitment to improving environmental management. Members of Entwine report environmental data on an annual basis. Primary production data is collected for electricity, fuel and water use from both grape growing and winemaking businesses. LCA has been applied to aggregated data from the Entwine database to develop a picture of the overall environmental footprint of the Australian wine industry. At December 2016, the Entwine database covered 516,511 tonnes of wine grapes, approximately 30% of the 2016 wine-grape crush (AWRI, 2016), providing a significant sample size to assess the industry’s energy consumption.
AWRI have also been active in conducting energy audits. A number of case studies are documented detailing energy use components. Audits have revealed that heating and refrigeration account
for very high percentages of a wineries energy consumption (AWRI, 2016). It is estimated that heating and refrigeration make up 45–70% of winery total electricity use.
The South Australian Wine Industry Association (SAWIA) has taken the lead on energy and are actively investigating energy use across the wine industry. Energy has become an important focal point for South Australia as the state accounts for 51% of the total wine grape crush. According to SAWIA, the main use of electricity in vineyards is for irrigation, particularly to drive water pumps. In 2015, it was estimated to represent 25% of total production costs (SAWIA, 2017).
The Winery Resource Efficiency Benchmark Report, prepared by 2XE consulting group in conjunction with Green Industries SA (2016), provides average resource efficiency performance benchmarks for the South Australian wine industry. Benchmarks are based on the performance of 32 wineries across South Australia during the 2014 and 2015 vintages. Electricity use per kL of wine produced was based on 18 wineries and reported as 350 kWh per 1000 kL of wine produced. Fuel use per kL was based off 14 wineries, with an estimated average use of 175 MJ per 1000 kL.
The benchmark report identified high energy use activities across the supply chain for electricity and fuel. The findings concluded that refrigeration systems typically consume the largest quantities of electricity for a winery. AWRI reports that refrigeration accounts for as much as 50–70% of winery electricity consumption (AWRI, 2017). Several different fuels are used in the wine production process including natural gas, LPG, petrol and diesel. The primary use of fuel on-site is heating water for cleaning or for warming wines during vintage.
Amienyo, Camilleri, & Azapagic (2014) presented a life cycle environmental impact of red wine produced in Australia. The research involved primary input data received from one of the largest producers of wine in South Australia, with the results used to estimate the environmental impact at the sectoral level. The South Australian wine

August 2018 | The impacts of energy costs on the Australian agriculture sector
SECTION 2: Sector analysis42
producer was assumed to be a strong representative of Australian red wine in general. Energy use was based on the functional unit of 0.75 L of wine.
Life cycle inventory (LCI) data was sourced from Ecoinvent database dated 2010 and was inclusive of grape viticulture, vinification and wine bottling. For viticulture, inputs recorded included water, nitrogen and phosphorous fertiliser, pesticides, electricity, diesel and petrol. Electricity was also reported for vinification and bottling. The study determined that bottled wine requires 21 MJ of primary energy.
The Energy Efficiency Information Grant program, funded by the Australian Government, has developed a Winery Energy Savers Toolkit (WEST) to help identify energy efficiency opportunities. Energy profiles were published that identify energy use and cost for wineries in South Australia.
An industry profile was completed on two participating wineries, McLaren Vintners, located in the South Australian Wine region of McLaren Vale, and Taylors Wines located in the Clare Valley north of Adelaide. McLaren Vintners crush close to 4700 tonnes of grapes per year, consuming approximately 1,000,000 kWh of energy, the most energy-intensive period being vintage between January and April. Refrigeration makes up a large proportion of energy consumption not only during vintage but throughout the entire year. To run 44 tanks over the 18-week summer period takes over 235,000 kWh, or 24% of annual consumption, at a cost of $63,330, representing 22% of annual electricity cost (SAWIA, 2013). The Taylors Wines site consumes approximately 1,700,000 kWh annually, with peak consumption recorded at vintage between February and May (SAWIA, 2013).
Energy cost analysisTable 14: Impact of energy price change on the
wine and grape sector.
Aggregated supply chain
sectors
Base cost per annum
Modelled cost scenario pa*
Input $ 8,310,482 $8,726,006
Production $ 126,787,077 $ 154,572,200
$ 0.093 /L $0.113 /L
Processing $ 69,322,000 $90,118,600
$ 0.051 /L $0.066 /L
Total $ 204,419,559 $ 253,416,806
Cost impact $ 48,997,247
*of a 30% cost increase in electricity and a 5% increase in all other major energy sources
Energy is used at every stage of the winemaking process. Supply chain analysis of the wine and grape industry highlights energy as a major cost for producers. Electricity, fuel and refrigeration are the top three major costs for winemakers and are a growing proportion of total costs. The major energy sources for grape and wine producers are electricity and fuel. The growth in energy prices may be more of a focal point for South Australia as the state accounts for around 51% of total wine grape crush. However, given this is an industry-level analysis, energy costs have not been assessed for individual states.

The impacts of energy costs on the Australian agriculture sector | August 2018
SECTION 2: Sector analysis 43
Production
Fuel use and electricity are the major sources of energy on-farm. Several different fuels are used in the wine production process including natural gas, LPG, petrol and diesel. The primary use of fuel on site is for heating water for cleaning and warming wine during vintage season. Fuel use on-farm is also required for field preparation, harvest, post-harvest and crop maintenance.
The largest quantity of electricity consumed on site is for refrigeration systems. Refrigeration accounts for as much as 50–70% of a winery’s electricity consumption (AWRI, 2017). Refrigeration systems are integral to cooling, juice extraction, fermentation, cold stabilisation and storage operations.
The main use of electricity in the vineyard is for irrigation, particularly to drive water pumps. Although grape growers are efficient users of water, the bulk of grapes are grown with assistance of irrigation water. Electricity for irrigation represents up to 25% of total production costs (Gishen & Gishen, 2017). The most recent figures for water use in vineyards across Australia are reported
by ABS. In 2015, 440,000 megalitres (ML) of water was used to irrigate vineyards. Water use has increased by 18% from 2012 levels. The most popular methods of irrigation nationally are drip and micro spray, followed by furrow and flood systems. Various irrigation systems have a significant effect on water and energy use at the individual business level. For example, drip irrigation promotes water efficiencies in vineyards (compared to flood systems).
Heating requirements are quite different across the range of wines produced in Australia. Different temperature controls are needed for red and white wine production, particularly throughout the fermentation process. For white wine, a low temperature is crucial to preserve flavour and aroma. The opposite is true for red wine, with a high temperature fermentation require to achieve colour. In addition to different energy needs, the reliability and consistency in supply is also important for the careful control of fermentation temperatures of extended periods of time. Both the intensity of energy required and the duration for which it is needed are important considerations for wine processing at the individual enterprise level.

44
X.0 XXXXX
August 2018 | The impacts of energy costs on the Australian agriculture sector
3. Results and discussion
ResultsThe results of the sub-sector analysis of the Australian agriculture sector are detailed in Table 15 and indicate the estimated annual cost of energy for the Australian agricultural sector at approximately $5.85 billion.
The Energy Cost Calculator developed for this report, which was used to quantify the impact of energy costs on the Australian agricultural sector, can be downloaded at www.farminstitute.org.au. A scenario modelling the impact of a 30% increase to electricity and a 5% increase to all other major energy sources (applied to the baseline data) resulted in a 15% increase to total energy costs, or an impact of an additional $863 million annual cost to the Australian agricultural sector. Users can input different percentage costs impacts (positive or negative) on the materials and methods tab of the downloaded spreadsheet to see the results of different cost impact models.
NB: Due to the limited availability of sub-sectoral data for input into the Energy Cost Calculator and the relatively conservative increases chosen for the model, the modelled cost impact demonstrated in Table 15 could be an underestimation.
Table 15: Estimated impact of energy costs on the Australian agricultural sector.
Sector Baseline cost ($million) Modelled cost ($million) Cost impact ($million)
Grains 1,592 1,694 102
Beef* 1,336 1,547 211
Chicken meat 608 772 164
Dairy 591 690 98
Sheep 431 470 39
Horticulture (vegetables) 319 358 39
Cotton 270 307 37
Sugar 252 308 56
Wine & Grapes 204 253 49
Pork 171 217 46
Eggs 71 92 21
Total 5,845 6,708 863*Includes sheepmeat processing

The impacts of energy costs on the Australian agriculture sector | August 2018
SECTION 3: Results and discussion 45
Table 16 summarises the estimated cost of energy used by the Australian agriculture sector, distinguishing them by energy source and supply chain sector.
Table 16: Total estimated cost of energy (by energy source) used by the Australian agricultural sector (by supply chain sector).
Total estimated cost of energy for each supply chain segment (all sectors) ($millions)
Supply chain segment Electricity Gas* Diesel** Total
Input 155 680 - 835
Production 1,218 185 1,382 2,785
Transport - - 1,112 1,112
Processing 980 124 9 1,113
Total 2,353 990 2,503 5,845
* Includes all gas types ** Includes diesel, petrol and oil
The relative impact of energy costs was assessed by comparing the cost of energy in each sector relative to corresponding gross values of production (GVP) (Table 17). Energy costs and GVP associated with processing were excluded.
Table 17: Total estimated cost of energy used by the Australian agricultural sector (excluding processing) as a proportion of GVP.
Sector Energy costs ($ million)*
Sector value (GVP) ($million) **
Energy costs as a proportion of GVP
Chicken meat 435 2,729 16%
Sugar 252 1,622 16%
Dairy 464 3,687 13%
Wine grapes 135 1,040 13%
Cotton 195 1,934 10%
Pork 129 1,342 10%
Grains 1,496 16,972 9%
Eggs 71 808 9%
Horticulture (vegetables) 319 3,904 8%
Beef 804 12,139 7%
Sheep 431 7,367 6%
Total 4,732 53,544 9%* Excludes post-farm/processing ** Data for post-farm/processing sectors is included only for the red meat (beef and sheep), dairy, chicken meat, cotton, wine grapes and pork sectors;
Grains industry processing costs includes grains used for milling feed only.

August 2018 | The impacts of energy costs on the Australian agriculture sector
SECTION 3: Results and discussion46
DiscussionThe Energy Cost Calculator was used to quantify the impact of energy costs on the Australian agricultural sector. Table 15 shows the results generated using the baseline energy costs data from each sub-sector and indicates that the total annual cost of energy used by the Australian agricultural sector is approximately $5.8 billion. A scenario modelling the impact of a 30% increase to electricity and a 5% increase to all other major energy sources applied to baseline data resulted in a 15% increase to energy costs, or an impact of a further $863 million on the Australian agricultural sector.
Recent discussion on energy costs in agriculture has tended to focus on the cost of electricity, due to substantial increases in energy bills over the past few years (Agriculture Industries Energy Taskforce, 2017). While it has not been the focus of this report to directly compare the costs of energy sources, the combined costs of electricity versus diesel (Table 16), suggests that there is the potential for more in-depth research to describe the relationship between energy costs and the sources of energy used by the Australian agricultural sector.
The baseline energy costs calculated for each of the evaluated sub-sectors accurately reflect the differences in energy intensity between industries and the share of energy throughout the sector, such as the intensity of inputs, production activities (e.g. irrigation or housing needs) and requirements for transport.
The combined total energy cost of the evaluated agricultural sub-sectors (excluding processing) represents 9% of the agricultural sector’s total GVP (Table 17). For the plant-based sectors, sugar was the most energy-intensive, followed by wine grapes, cotton, grains and vegetables. Likewise, for the animal-based sectors, intensive industries such as chicken meat, dairy, pork and eggs, which require significant inputs and energy for production
operations, were determined to have greater energy costs as a proportion of GVP when compared with extensive beef and sheep industries.
Data gaps
Due to inconsistencies in data collection, reporting methods and the limited availability of sub-sectoral data for input into the Energy Cost Calculator, the energy costs to agriculture and impact of cost increases could be underestimations. Additionally, the scenario used to model the potential cost impact of an increase in energy costs on the Australian agricultural sector is relatively conservative, given the general trend in energy prices over the past decade which on average have increased between 30–100% (and up to 300% in some cases) (Agriculture Industries Energy Taskforce, 2017).
The most comprehensive data available for input into the Energy Cost Calculator was that associated with activities relevant to the production segment of the supply chain. This type of data is collected by ABARES farm surveys and the ABS and is also available through industry-produced gross margin budgets and profitability studies. LCAs conducted to demonstrate environmental credentials and the carbon footprint of some sectors also report appropriate farm energy use information. However, evaluating studies of this nature is difficult given the way energy data is formatted and reported to different standards. In this case, LCA data and information was cross-referenced with industry information and, where appropriate, was supplemented for where data was not available. This was necessary to provide the most suitable estimate of the impact of energy costs on Australian agriculture.
It is acknowledged that there are many inputs which contribute to the overall energy use requirement for agriculture, however due to data availability and accessibility challenges, as discussed previously, this level of detail was not assessed or reported in the energy analysis.

47
The impacts of energy costs on the Australian agriculture sector | August 2018
47
4. Impact of future practice, renewables and alternative energy sources
The following section offers an overview of how energy use in agriculture is changing and the trends that are emerging right across the sector. It includes three case studies detailing solar power projects and protected cropping, which are indicative of a general trend occurring throughout the economy.
The protected cropping industry is the fastest growing food production sector in Australia (Protected Cropping Australia, 2018). Greenhouse production is a major driver of growth in the horticulture sector with a large shift from field grown to greenhouse production. This shift has been facilitated by productivity improvements in water and fertiliser use and the advantage of being able to supply a consistent stream of high-quality produce to satisfy processor, supermarket and consumer needs. However, the cost of energy has become an increasingly important factor in determining greenhouse profitability. High-tech structures are more at risk given their reliance on a constant supply of traditional energy sources for the functioning of automated controls and features.
Solar power generation is becoming a cheaper and more reliable alternative to traditional energy sources. As farm businesses face becoming uncompetitive due to the cost of traditional energy sources, many have considered renewable energy and off grid solutions. Solar power generation is a relatively old technology, however in combination with newer technologies (such as smart irrigation pumps, energy management software and new battery storage technology) it is experiencing a renaissance. Although it incurs high up-front costs, solar is a strong financial investment as it has a relatively short payback period and long-lasting infrastructure (e.g. 25 years for panels and 10–15 years for a pump).
Although solar delivers a compelling investment case, a major shift to a more renewably powered agriculture has not yet eventuated. The Climate Institute (2014) believes that this can be explained by the lack of a comprehensive Commonwealth or State Government framework for the uptake of new generation technologies and low government support in the form of subsidies.
Australian agriculture has also experienced a trend toward diesel generation and bioenergy development. A switch to diesel is being experienced in many sectors including dairy, industrial crops and intensive irrigated horticulture. Electrified irrigation systems are preferred due to greater efficiency, lower maintenance costs and ease of control, but small-scale diesel generation is turning out to be an attractive and cost-effective option.
Bioenergy generation is well suited to Australian agriculture. Despite bioenergy being received positively by agriculture, and having notable potential to extract value from agricultural waste, energy from waste technologies is not heavily deployed in Australia. Some industries have been more receptive to adoption than others. The Australian sugar industry is the largest and longest running user of bioenergy in Australia. Approximately 60% of Australia’s installed bioenergy electricity generation capacity uses bagasse as a feedstock (CEFC, 2015). The poultry and pork sectors have also significantly invested in forms of bioenergy, including biogas and digestion systems. Much the same as the renewable energy industry, the bioenergy industry does not receive the same level of support as fossil fuels. Instead, government policy has acted to reduce the limited financial resources available to the sector.

48
August 2018 | The impacts of energy costs on the Australian agriculture sector
SECTION 4: Impact of future practice, renewables and alternative energy sources48
Case Study: Chillamurra Solar Farm, Meralli Projects
d. demonstrate the value of unique and revolutionary farming systems
e. attract regional investment.
From conception to completion, Chillamurra Solar Farm was several years in the making. With no applicable grants available for the development of the project, it was privately funded as a viable commercial investment, making it the first in a series of solar projects not reliant on state and federal grants. Projects since have been refined to the proof of concept and are limited by regulatory process. With development costs of $5 million, Dave and Methuen agree that the acquisition of specific intellectual and human resource skills (and their personal development in these areas) were prerequisites and ongoing drivers for the successful completion of the project.
Chillamurra Solar Farm, located at Boggabilla NSW, is a greenfield project piloted by Dave Mailler and Methuen Morgan of Meralli Projects. Now operating as a fully commercial business model, generating a spot price on the open market against other National Energy Market (NEM) generators, Chillamurra Solar Farm was developed with some enduring goals:
1. Commercial development and investment opportunity.
2. As a proof of concept to:
a. demonstrate the viability of smaller renewable generators
b. address the domestic capacity to develop renewables
c. demonstrate the potential for distributed networks
CHILLAMURRA SOLAR FARM
Photovoltaic generator 4.8MW DC 3.6MW AC grid connection
Two SMA HV Transformer 1.8
Sixty SMA Inverters 80KV

49
The impacts of energy costs on the Australian agriculture sector | August 2018
SECTION 4: Impact of future practice, renewables and alternative energy sources 49
The return on investment (ROI) is expected to be 10–12% over the life of project, which is 25 years. Following the initial investment and installation, operations and maintenance are limited and remotely monitored for the purpose of repairs, with expected scheduled maintenance and inspection of HV, LV and site maintenance costs of less than 0.5% of ROI. The decision to move off the grid and/or implement renewables is driven by a multitude of factors, attached to a number of variables. Dave and Methuen’s decisions regarding the Chillamurra Solar Farm were based on the significant relevance of the project, particularly to large-scale stand alone and behind the meter projects. The low cost of the framing system and speed of installation at Chillamurra are an important demonstration of what is possible with some lateral thinking in relation to renewable technology.
Considerations around the development of large-scale solar solutions also raise questions about the socio-economic implications, not only for those benefiting from their utilisation but also for the residual grid users. As individuals and businesses move off the grid, or are no longer reliant on the electricity grid, the financial burden for network maintenance, supply and security falls to a decreasing number of consumers. These consumers are the least able to afford the initial investment cost of domestic renewable supply and will be the least able to afford the cost of network electricity supply. Other considerations include storage, which Dave mentioned was a consequence of the size of demand and commercial viability - amply demonstrated by the installation of the South Australian Tesla battery in 2017.
The greatest challenges associated with the project to date were noted as navigating the fluidity and
instability of the policy environment dictated by federal and state regulators. The regulators are seemingly unable to accept the commercial reality that renewables meet a number of consumer and market expectations around price and emissions targets, said Dave and Methuen. There are also potential implications for developments if electricity prices meet forecast declination. According to Dave, the move to renewables is not a matter of if or when you might be losing out on your investment, but more about buffering the effects of regulation, policy and the NEM. For example, the ROI on the Chillamurra Solar Farm, considered to be conservative, is modelled on the wholesale electricity price with an expectation that electricity prices will fall over the longer term. However, it also does not take into consideration the increasing demand for electricity.
Renewable and alternate energy investments also raise queries about whether these developments have the potential to replace existing energy needs or stimulate new energy demand. Chillamurra Solar Farm was developed to replace exist ageing fossil fuel generators nearing the end of their productive life.
An opportunity for regional Australia exists in the capacity to generate affordable renewable electricity for value-add businesses and generate new industry applications. The emerging global trend towards electric transportation indicates an increasing new energy demand not currently being met. Significantly higher investment in renewable technologies is essential to both to address the existing demand and meet new targets, particularly if Australia is going to meet its international commitment to the Paris Agreement.

50
August 2018 | The impacts of energy costs on the Australian agriculture sector
SECTION 4: Impact of future practice, renewables and alternative energy sources50
Jon Elder is a producer at Waverleigh, an operation located 35 km south west of Narromine NSW and characterised by the relatively larger than average land holding of 2500 ha, spread across three properties. Predominately a cotton operation, 1100 ha is developed for flood irrigation and 1100 ha dryland production. Grown on around 550 ha each year and at an average yield approaching 12 bales/ha, irrigated cotton contributes around 80% of gross income, and cereals the remaining 20%.
Diesel is the greatest cost to Jon’s operation. Waverleigh uses in excess of 350,000 litres annually to pump its bore water entitlements. In response to the impact of soaring costs associated with diesel pumping and the emerging opportunities presented by renewables - along with learnings from the application of a small proof of concept alternative pumping system by a neighbouring property just two years ago - Jon decided to invest in solar and has replaced one of his diesel bores with a hybrid solar/diesel system.
Case Study: Solar Pumping at Waverleigh, Narromine
WAVERLEIGH SOLAR/DIESEL HYBRID
250 KW Electric motor
250 KW Solar Inverter/Drive
500 KW Control Panel
Solar Panel
CAT 500KVA Genset

51
The impacts of energy costs on the Australian agriculture sector | August 2018
SECTION 4: Impact of future practice, renewables and alternative energy sources 51
With the capacity to pump up to 15 megalitres (ML) per day, the new 500 kW solar/diesel hybrid bore is believed to be the largest application of its kind for agricultural purposes in NSW, and potentially Australia. The development is significant, both as an example and in practice, with present diesel consumption of around 100 L per ML of bore water extracted. The decision to change systems was based almost exclusively on the business opportunities presented, including the projected ROI of less than five years (based on diesel savings), the reliability and durability of the system, serviceability and access to ongoing support.
Operating on a 3500 ML groundwater licence, Jon intends to pump using 100% solar from March to September to fill reservoirs to their combined capacity of 1100 ML. When irrigating cotton between October–February, the bore will operate 24 hours per day to deliver 15 ML per day, 40% via solar. Based on the water licence and daily output derived from ‘blending’ power sources, this equates to 900ML from solar alone over the peak season. The 2000 ML pumped annually via solar equates to around 55% of Jon’s water licence and a 55% reduction in diesel used in its extraction.
Substituting diesel for sunlight, the project advanced in several stages, including the replacement of one diesel bore and replacement of an electric motor with a diesel Genset, followed by installation of solar panels, update of the control panel and integration of the system. The greatest challenges associated with the project to date were
attributed to scale. While the concept was initially proven at a smaller scale, the novel size of this particular project provided some minor problems, although those were easily overcome, according to Jon. A number of other important considerations in the changeover were associated with water harvesting, income generated through Large Scale Energy Certificates, finance costs, and eligibility for Farm Innovation funding from the Rural Assistance Authority.
Jon believes that the declining cost of solar power offers new options for farmers who are sourcing alternate energy sources to diesel. In addition, knowledge and expertise have become available which are applicable and complementary to multiple requirements for production operation, including combined pumping and solar expertise, and after-sales service. Although Jon recognises the potential for solar or solar-diesel hybrid systems on-farm based on his experience, he indicated that according to a survey of growers the greatest barriers to investment in solar energy for pumping irrigation still include:
• uncertainty in the feasibility of such developments under variable circumstances
• uncertainty around credibility and capability of supplier/installer
• cost of solar system for specific irrigation requirements
• low priority (at this stage)
• cost of batteries.

52
August 2018 | The impacts of energy costs on the Australian agriculture sector
SECTION 4: Impact of future practice, renewables and alternative energy sources52
Nectar Farms is an Australian hydroponic vegetable grower establishing a 30 ha high-tech glasshouse project, with a vision to be Australia’s leading protected cropping operation. The development serves as a pilot for agriculture and renewable energy, with promise of a project that is replicable and scalable. The glasshouse will be located at Joel Joel, about 15-20 km east of Stawell, Victoria.
Construction is due to commence in October 2018, with the project being delivered in three 10 ha stages. The fully established facility will require 70 Gwh of electricity to supply the variable spectrum LED lighting system. Nectar Farms will supply the Australian domestic market with tomatoes and other vine-grown fruits and aims to create more than 300 stable, full-time jobs in regional Australia.
Case Study: Nectar Farms High-tech Glasshouse and Bulgana Green Power Hub
The glasshouse will be co-located with the Bulgana Green Power Hub (wind farm), which is operated by the global renewable energy company, Neoen. Bulgana is comprised of 56 wind turbines together with a 20 MW battery storage unit. Nectar Farms will use up to 15% of the 750,000 MWh of renewable electricity generated by Bulgana Wind Farm per year and will work closely with Neoen upon completion to match load with supply as closely as possible.
Partnering with Neoen has rendered the Nectar glasshouse project economically viable. Under this arrangement, Nectar Farms is able to avoid ‘poles and wires’ charges and has secured a globally competitive price for electricity (by the standards of the protected cropping industry) under a fixed price purchase power agreement (PPA) with Neoen.
NECtAR FARMS & BULGANA GREEN POWER HUB
30 ha / 100,000 m² high-tech glasshouse
194 MW Bulgana Green Power Hub
20 MW / 34 MWh Tesla battery storage facility

53
The impacts of energy costs on the Australian agriculture sector | August 2018
SECTION 4: Impact of future practice, renewables and alternative energy sources 53
Financing of the project has been supported by Regional Development Victoria, who have provided a $1 million grant, payable in line with the construction program.
Nectar Farms is aware that the current policy environment does not work in favour of investments in high-tech protected cropping systems. The electricity market is not sufficiently reliable enough to support investments of this nature. Settings are in place to ensure that residential customers take priority during winter, with natural gas supplies directed to these individuals. During summer months, industrial electricity users are faced with load shedding demands.
In the case of steady supply, Nectar Farms states that the cost associated with grid connection is higher by a factor of 10 compared with other advanced nations. With no guarantee of gas and electricity supply and in addition to the cost of electricity, grid connection was not an economically feasible option for Nectar Farms.
After detailed assessment of the current energy market and policy environment, and a series of discussions with the government of Victoria, Bulgana Wind Farm was found to be the best option. Planning for the joint glasshouse and wind farm development subsequently commenced in late 2016. The entire process for Nectar Farms has been lengthy. It has taken approximately 18 months, from initial discussions up until execution of contracts, to finalise the project.
Separation between development of the glasshouse and the Bulgana Wind Farm has been an important factor for Nectar Farms and has added to the viability of the glasshouse project. Nectar Farms has no capital expenditure exposure to the Bulgana project. This has removed the risks and associated managerial responsibility for the operation of the wind farm and the battery storage system. As a consumer of electricity, Nectar’s costs are strictly limited to the energy consumed by the glasshouse.
The glasshouse operation will have no connection to the grid, and several dynamics are in play to guarantee the supply of electricity. In addition to electricity supply and the battery storage at Bulgana, the Nectar Farms glasshouse will also be fitted with a gas boiler. The boiler will burn both LPG and natural gas for heating purposes. Flue gases will be captured and stripped of CO2, which can then be added to the atmosphere within the glasshouse. To supplement energy requirements in the event that wind-derived power falls short, an open cycle turbine will generate back-up electricity as required.
Nectar Farms shares in the longstanding frustration of other actors entering the renewable energy market, including agribusinesses, farmers and energy generators. In particular, Nectar Farms are concerned that seeking off-grid energy solutions necessitates a significant investment of both time and money. This situation is likely to continue indefinitely unless there is a radical departure away from current policies towards a more stable energy policy which welcomes and enables the generation of new industry applications.

54
X.0 XXXXX
August 2018 | The impacts of energy costs on the Australian agriculture sector
5. Conclusion
As Australian agricultural businesses intensify production systems and utilise additional digital technology, their dependence on energy inputs and exposure to energy cost risk is increasing. Australian energy costs have increased significantly over the past decade, both in nominal and real terms. These dramatic energy cost increases have important implications for the competitiveness of Australian agriculture, and the sector needs to engage in the debates associated with this issue using sensible, evidence-based arguments to optimise policy outcomes.
• This report estimates the cost of energy to the Australian agriculture sector to be $5.8 billion annually.
• Excluding processing, energy costs are $4.56 billion – which is equal to 9% of the gross value of production of the sectors analysed.
• The cost of energy has become a significantfactorimpactingtheprofitabilityand potentially the global competitiveness of Australian agriculture – any policy change likely to impact on energy prices needs to be considered in this context.
The research has taken a broad industry approach to the collection of energy use and cost data, enabling evidence of the impact of these energy costs on a larger scale. This is the first study to investigate the cost of energy to Australian agriculture across multiple sectors and value chain segments.
Previous studies have focused on energy audits and lifecycle assessments for the purpose of emissions reporting, or increasing energy efficiency and reducing greenhouse gas emissions. These studies have recommended that energy costs can be reined in by reducing consumption through increasing energy efficiency (e.g. via metering arrangements, systems improvements, updated monitoring of energy usage and understanding of tariff structures). Efficiency measures are practical solutions and have been effective in alleviating rising energy costs. However, with prolonged growth in energy prices, cost savings achieved through improved energy efficiency are gradually being offset.
The literature review highlights inconsistencies in data collection, collation and cross-referencing methods, as well as inconsistencies in reporting of metrics and conversion factors used. Data on energy use in agriculture is still patchy and haphazard, which limits the ability of the sector to engage meaningfully with policymakers until this is rectified.
In response to the threat to profitability posed by rising energy prices and decreasing competitiveness, Australian farm businesses are increasingly implementing off-grid or alternative energy solutions in an attempt to increase control over energy prices. Ongoing collection of energy cost data needs to account for these changes so that official energy use and cost statistics accurately reflect how energy is used in the agricultural value chain.

The impacts of energy costs on the Australian agriculture sector | August 2018
SECTION 5: Conclusion 55
• Lack of data is the biggest barrier to understanding the impact of energy policy changes on Australian agriculture.
• This research highlights the need for improvement in the collection and management of energy statistics for the sector, particularly given that the industry needs to urgently construct a compelling case for energy policy change.
• Thedatagapsidentifiedinthisresearchprovide a strong platform to launch further investigation and collect data on energy costs across the supply chain.
Correspondence with industry also highlighted different levels of engagement across sectors, weakening the collective voice of the agricultural sector on the energy cost issue. Lack of data and cohesion have hindered the development of practical, long-term solutions by industry on energy use/cost management to date, and current responses tend to suggest short-term fixes which can side-track material change.
Solutions to address the issue of rising energy costs for agriculture have so far largely been contained within the industry, for example sector-specific efficiency measures. However, to deal with the fundamental long-term issues – i.e. network charges and cheaper, reliable power – unified cross-industry lobbying efforts (with the inclusion of detailed evidence of consequences) are required in order to drive long-term, macro-level policy change.
The modelled impact of even a conservative estimate of an energy cost rise (i.e. 30% increase in electricity and 5% in all other energy sources) demonstrated an annual cost impact of $863 million. While the impact on individual business may not be great (given variances in circumstances, production system, location and markets), the impact of increasing energy costs on the sector as a whole is substantial and therefore it is in everyone’s interest to collectively pursue energy policy improvements.

56
X.0 XXXXX
August 2018 | The impacts of energy costs on the Australian agriculture sector
6. References
2XE. (2016). Winery Resource Efficiency Benchmark Report. Green Industries SA.
ABARES. (2017a). Agricultural Commodities December Quarter 2017.
ABARES. (2017b). Agricultural Commodities March Quarter 2017.
ABARES. (2018a). Agricultural Commodities March Quarter 2018, 255.
ABARES. (2018b, April). Agsurf Data - Australian Bureau of Agricultural and Resource Economics and Sciences. Retrieved from http://apps.daff.gov.au/agsurf/
ACCC. (2017). Retail Electricity Inquiry - Preliminary report (p. 177). Australian Competition and Consumer Commission.
Advantia Transport Consulting. (2016, March). Transport infrastructure priority development for the Australian dairy industry.
Agriculture Industries Energy Taskforce. (2017, May). Agriculture Industries Energy Taskforce: Submission to House of Representatives inquiry. Modernising Australia’s Electricity Grid.
AgricWA. (2018). Sheep Meat Value Chain, Retrieved from https://www.agric.wa.gov.au/sheep/sheep-meat-value-chain-training-program
AgriFutures Australia. (2017a). Pigs for meat (pork). Retrieved from http://www.agrifutures.com.au/farm-diversity/pigs-for-meat-pork/
AgriFutures Australia. (2017b, May 24). Beef cattle | AgriFutures Australia. Retrieved July 30, 2018, from https://www.agrifutures.com.au/farm-diversity/beef-cattle/
AgriFutures Australia. (2017c, May 24). Meat chickens | AgriFutures Australia. Retrieved from http://www.agrifutures.com.au/farm-diversity/meat-chickens/
Amienyo, D., Camilleri, C. & Azapagic, A. (2014). Environmental impacts of consumption of Australian red wine in the UK. Journal of Cleaner Production, 72, 110–119. https://doi.org/10.1016/ j.jclepro.2014.02.044
AMPC. (2015, May), Environmental Performance Review: Red Meat Processing Sector 2015, Final Report, Australian Meat Processor Corporation.
ANZ. (2015). Horticulture growing/ processing industry.
Apple and Pear Australia Limited. (2014, November). Watts in Your Business: Technical Report.
Auscott, Energy and Management Services Pty Ltd, & Office of Environment and Heritage. (2012). Level 2 Energy Audit Report.
Australian Competition and Consumer Commission. (2016). Cattle and beef market study (Interim Report).
Australian Dairy Industry Council & Dairy Australia. (2014, May). Australian Dairy Industry Response to the Productivity Commission Study, Costs of Doing Business: Dairy Product Manufacturing.
Australian Eggs. (2018, June 2). Egg industry switches to on-farm solar. Retrieved from https://www.australianeggs.org.au/news/egg-industry-switches-to-on-farm-solar/
Australian Institute of Petroleum. (2018, June 5). Facts About Petrol Prices. Retrieved from https://www.aip.com.au/resources/facts-about-petrol-prices-0

The impacts of energy costs on the Australian agriculture sector | August 2018
SECTION 6: References 57
Australian Lot Feeders’ Association. (2018). About the Australian Feedlot Industry. Retrieved from http://www.feedlots.com.au/industry/feedlot-industry/about
Australian Meat Processor Corporation. (2015). Environmental Performance Review Red Meat Processing Sector 2015 – Final report.
Australian Pesticides and Veterinary Medicines Authority. (2017). Final Pesticide and Veterinary Medicines Product Sales 2015–16 Financial Year. Commonwealth of Australia. Retrieved from https://apvma.gov.au/sites/default/files/21032017.pdf
Australian Pork. (2014, December). Piggery Total Energy Usage - Fact Sheet. Retrieved from http://australianpork.com.au/wp-content/uploads/2013/ 09/FACT-SHEET-Piggery-Total-Energy-Usage-Dec-14.pdf
Australian Pork. (2015). Reducing Energy Costs in Piggeries. Retrieved from http://australianpork.com.au/wp-content/uploads/2013/10/BMP04_RECPP_ 03_lr.pdf
Australian Pork. (2018). Aussie Pig Farmers. Retrieved from https://aussiepigfarmers.com.au/
Australian Sugar Milling Council. (2017). Sugarcane Statistics – Australian Sugar Milling Council. Retrieved from https://asmc.com.au/industry-overview/statistics/
Australian Wine Research Institute (AWRI). (2016, April). Improving winery energy efficiency – fact sheet. Retrieved from https://www.awri.com.au/wp-content/uploads/2014/06/fact-sheet-improving-winery-energy-efficiency.pdf
Australian Wool Innovation. (2017, April). Sheep Numbers By State. Retrieved from https://www.wool.com/market-intelligence/sheep-numbers-by-state/
AWRI. (2016). Assessing the Environmental Credentials of Australian Wine. Retrieved from https://www.awri.com.au/wp-content/uploads/2013/01/1792-abbott-WVJ-31-1-2016.pdf
AWRI. (2017). Australian Wine Research Institute: Research, Development and extension plan. Retrieved from https://www.awri.com.au/wp-content/uploads/2013/07/awri-rde-plan-2017-2025.pdf
Brock, P. M., Graham, P., Madden, P. & Alcock, D. J. (2013). Greenhouse gas emissions profile for 1 kg of wool produced in the Yass Region, New South Wales: A Life Cycle Assessment approach. Animal Production Science, 53(6), 495. https://doi.org/10.1071/AN12208
Buloke Shire Council. (2017). Buloke Intensive Livestock Investment Guide – Pig Production Investment Guide.
Canegrowers. (2017). Canegrowers Annual Report 2016/2017. Retrieved from http://www.canegrowers.com.au/icms_docs/274355_canegrowers-annual-report-2016-17.pdf
CEFC. (2015, November). The Australian bioenergy and energy from waste market, CEFC market report.
Chen, G., Maraseni, T., Banhazi, T. & Bundschuh, J. (2015, June). Benchmarking Energy Use on Farm.
Clean Energy Finance Corporation. (2015). CEFC factsheet Agribusiness.
Cotton Australia. (2017). COTTON ANNUAL 2017. Retrieved from http://cottonaustralia.com.au/uploads/publications/COTTON_ANNUAL_2017_final.pdf
Cotton Australia & CRDC. (2014). Sustainability Report. Retrieved from http://cottonaustralia.com.au/uploads/publications/Sustainability_Report_low_res_for_printing.pdf
Crump, E. L. (2000). Lime production: industry profile. US Environmental Protection Agency.
Dairy Australia. (2013). Saving energy on dairy farms. Dairy Australia Limited.
Dairy Australia. (2016). Australian Dairy Industry in Focus 2016. Dairy Australia Limited.
Dairy Manufacturers Sustainability Council. (2011). Dairy Manufacturers Sustainability Council Sustainability Report 2010–11.
Department of Agriculture and Water Resources. (2016, July). Wool. Retrieved from http://www.agriculture.gov.au:80/ag-farm-food/meat-wool- dairy/wool

SECTION 6: References58
August 2018 | The impacts of energy costs on the Australian agriculture sector
Eady, S., Carre, A. & Grant, T. (2012). Life cycle assessment modelling of complex agricultural systems with multiple food and fibre co-products. Journal of Cleaner Production, 28, 143–149. https://doi.org/10.1016/j.jclepro.2011.10.005
Estrada-Flores, D. S. (2010). Opportunities and challenges faced with emerging technologies in the Australian vegetable industry (Technology Platform 2: Environmental Technologies). Retrieved from https://ausveg.com.au/app/data/technical-insights/docs/VG08087-2.pdf
Eyre, D. (2016). New thinking needed about regional electricity supply (Ag Innovators blog).
Fertilizer Use on Australian Dairy Farms. (2013, February 8). Retrieved from http://anz.ipni.net/article/ANZ-3132
Foley, J. P., Sandell, G. R., Szabo, P. M., Scobie, M. & Baillie, C. P. (2015, June). Improving energy efficiency on irrigated Australian cotton farms – Farm level benchmarking report of direct energy consumption in Australian irrigated cotton production.
Gishen, M. (2017). South Australian Wine Industry Association Incorporated submission to Australian Competition and Consumer Commission Inquiry into Retail Electricity Supply and Pricing.
Henry, B. (2012, May). Understanding the Environmental Impacts of Wool: A review of life cycle assessment studies.
Higgins, A., McFallan, S., McKeown, A., Bruce, C., Marinoni, O., Chilcott, C., … Beaty, M. (2017). TraNSIT: Unlocking options for efficient logistics infrastructure in Australian agriculture. CSIRO.
Horticulture Innovation Australia. (2016, April). Horticulture Innovation Strategic Plan. Retrieved from https://horticulture.com.au/wp-content/uploads/2016/06/Hort-Innovation-Strategic-Plan -Web.pdf
Horticulture Innovation Australia. (2017, May). Australian Horticulture Statistics Handbook Other horticulture 2015/16. Retrieved from http://horticulture.com.au/wp-content/uploads/2016/09/Horticulture-Statistics-Handbook-2015-16-Other.pdf
International Fertilizer Industry Association. (2009). Fertilizers, climate change and enhancing agricultural productivity and sustainability.
Ismail, S. A. (2009). Assessment of energy usage for cotton gins in Australia. University of Southern Queensland.
Ismail, S. A., Chen, G., Baillie, C. & Symes, T. (2011). Energy uses for cotton ginning in Australia. Biosystems Engineering, (109), 140–147. http://dx.doi.org/10.1016/j.biosystemseng.2011.02.010
Khabbaz, B. G. (2010). Life cycle energy use and greenhouse gas emissions of Australian cotton: Impact of farming systems. University of Southern Queensland.
Khan, S., Khan, M. A. & Latif, N. (2010). Energy requirements and economic analysis of wheat, rice and barley production in Australia. Soil Environ, 29(1), 61–68.
Khan, Shahbaz, Abbas, A., Rana, T. & Carroll, J. (2010). Dairy water use in Australian dairy farms: Past trends and future prospects, 93.
MacLeod, M., Gerber, P., Motette, A., Tempio, G., Falcucci, A., Opio, C., … Steinfeld, H. (2013). Greenhouse gas emissions from pig and chicken supply chains: a global life cycle assessment.
McGahan, E. J., Davis, R. J., Warren, B. R. & Cheallaigh, A. N. (2013). Evaluation of energy usage and ventilation performance of tunnel ventilated layer sheds. Australian Egg Corporation Limited.
McGahan, E. J., Warren, B. R. & Davis, R. J. (2014). Establishing Energy Usage on Australian Piggeries to Enable Implementation of Energy Reduction Strategies (Final Report). Australian Pork Limited.
Meat & Livestock Australia. (2017). MLA Sheep Fast Facts 2017. Retrieved from https://www.mla.com.au/prices-markets/Trends-analysis/fast-facts/
Meat and Livestock Australia. (2017a). MLA Beef Fast Facts 2017. Retrieved from https://www.mla.com.au/prices-markets/Trends-analysis/fast-facts/
Meat and Livestock Australia. (2017b). Review of renewable energy technology adoption within the Australian Red Meat Industry (No. V.SCS.0003).

The impacts of energy costs on the Australian agriculture sector | August 2018
SECTION 6: References 59
Milk quality - dairy hygiene and cleaning practices. (n.d.). Retrieved from https://www.dairyaustralia.com.au/farm/animal-management/milking/milk-quality
MLA. (2018). Australian Cattle Industry Projections 2018. Meat & Livestock Australia. Retrieved from https://www.mla.com.au/globalassets/mla-corporate/prices--markets/documents/trends--analysis/cattle-projections/mla_australian-cattle-industry-projections-2018.pdf
National Irrigators’ Council. (2014). National Irrigators’ Council 2013-14 Annual Report. Retrieved from https://www.irrigators.org.au/wp-content/uploads/2018/03/National_Irrigators_Council_2013-14_Annual_Report.pdf
Norton, T. & Horticulture Australia. (2008). Enhancing environmental sustainability in the processing potato industry. Horticulture Australia.
NSW DPI. (2015a). NSW Wool Industry and Future Opportunities: A report to the NSW Department of Primary Industries. from Miracle Dog, Poimena Analysis, Scott Williams Consulting and DAFWA
NSW DPI. (2015b). Pork Industry Overview. Retrieved from https://www.dpi.nsw.gov.au/__data/assets/pdf_file/0011/578747/pork-industry-overview-2015.pdf
Page, G., Bellotti, B. & Ridoutt, B. (2011). Exploring hotspots in the carbon footprint and energy use profiles of tomatoes grown for the Sydney market. In Proceedings of the 5th World congress on Conservation Agriculture incorporating 3rd International Farming Systems Design Conference.
Peters, G. M., Rowley, H. V., Wiedemann, S., Tucker, R., Short, M. D. & Schulz, M. (2010). Red meat production in Australia: life cycle assessment and comparison with overseas studies. Environmental Science & Technology, 44(4), 1327–1332.
Peters, G. M., Wiedemann, S., Rowley, H. V., Tucker, R., Feitz, A. J. & Schulz, M. (2011). Assessing agricultural soil acidification and nutrient management in life cycle assessment. The International Journal of Life Cycle Assessment, 16(5), 431–441. https://doi.org/10.1007/s11367-011-0279-5
Protected Cropping Australia. (2018). Industry Overview | Protected Cropping Australia. Retrieved from http://www.protectedcroppingaustralia.com/?page_id=94
QFF. (2016). Queensland Farmers Federation Energy Savers Program. Retrieved from https://www.qff.org.au/projects/energy-savers/
Red Meat Advisory Council. (2017, October). State of the Industry Report: The Australian Red Meat and Livestock Industry.
Renouf, M. & Wegener, M. (2007). Environmental Life Cycle Assessment of Sugarcane production and processing in Australia. Retrieved from https://www.assct.com.au/media/pdfs/2007_Ag_23_Renouf.pdf
Renouf, M. & Fujita-Dimas, C. (2013). Application of LCA in Australian agriculture – a review.
Ridoutt, B. G., Sanguansri, P., Nolan, M. & Marks, N. (2012). Meat consumption and water scarcity: beware of generalizations. Journal of Cleaner Production, 28, 127–133. https://doi.org/10.1016/ j.jclepro.2011.10.027
Rural Bank. (2017, March). Australian Horticulture Report. Retrieved from https://www.ruralbank.com.au/assets/responsive/pdf/publications/hort-report.pdf
Rural Industries Research and Development Corporation. (2014). Chicken meat program five year RD&E plan 2014-19. Retrieved from http://www.agrifutures.com.au/wp-content/uploads/2017/07/chicken-meat-r-amp-d-plan-2014-15.pdf
Russell, I. (2010). Wool production, processing and use - Environmental aspects (pp. 18–23). Presented at the 12th International Wool Research Conference, Shanghai, China: 12th International Wool Research Conference. Retrieved from https://publications.csiro.au/rpr/download?pid=csiro:EP102882&dsid=DS2
Samson, P. (2017). Irrigation in Sugarcane Forum. Retrieved from https://sugarresearch.com.au/wp-content/uploads/2017/02/Irrigation-Forum-Report-2017.pdf
SAWIA. (2013). Winery Energy Savers Toolkit Industry Profile - McLaren Vintners.

August 2018 | The impacts of energy costs on the Australian agriculture sector
SECTION 6: References60
Schulte, S. (2012). Energy Policy - Electricity tariffs and charges. NSW Irrigators’ Council. Retrieved from http://www.nswic.org.au/pdf/policy_documents/130308%20-%20Energy%20Policy.pdf
Smarter energy use on Australian dairy farms - Independent analysis of national energy assessment data. (2015). Dairy Australia Limited.
Sonesson, U., Cederberg, C., Flysjö, A. & Carlsson, B. (2008). Life cycle analysis (LCA) of Swedish eggs (ver. 2).
Spragg, J. (2016). Australian Feed Grain Supply and Demand Report 2016. Feed Grain Partnership. Retrieved from http://www.sfmca.com.au/items/1093/FGP%20Report%20October%202016.pdf
Stock Feed Manufacturers’ Council of Australia. (2017). SFMCA Energy Use Survey Report 2017. Retrieved from http://www.sfmca.com.au/items/ 1127/SFMCA%20Energy%20Survey%20Report%202017.pdf
Syngenta. (2017). Syngenta Sustainable Business Report 2017.
Tang, P. & Jones, M. (2013). Energy Consumption Guide for Small to Medium Red Meat Processing Facilities. Australian Meat Processor Corporation Ltd.
The Climate Institute. (2014). Counting all the costs: Recognising the carbon subsidy to polluting energy. Retrieved from http://www.climateinstitute.org.au/verve/_resources/TCI_SocialCostOfCarbon_PolicyBrief_September2014.pdf
Welsh, J. & Powell, J. (2017). Energy in irrigated cane 2017 (2017/011, Productivity improvements through energy innovation in the Australian sugar industry.). Ag Econ & Sugar Research Australia.
Wiedemann, S., McGahan, E. J., Poad, G. & RIRDC. (2012). Using life cycle assessment to quantify the environmental impact of chicken meat production. Rural Industries Research and Development Corporation.
Wiedemann, S., McGahan, E., Murphy, C. & Yan, M. (2016). Resource use and environmental impacts from beef production in eastern Australia investigated using life cycle assessment. Animal Production Science, 56(5), 882. https://doi.org/10.1071/AN14687
Wiedemann, S., McGahan, E., Murphy, C., Yan, M.-J., Henry, B., Thoma, G. & Ledgard, S. (2015). Environmental impacts and resource use of Australian beef and lamb exported to the USA determined using life cycle assessment. Journal of Cleaner Production, 94, 67–75. https://doi.org/10.1016/ j.jclepro.2015.01.073
Wiedemann, S., Yan, M.-J. & Murphy, C. M. (2015). Resource use and environmental impacts from Australian export lamb production: a life cycle assessment. Animal Production Science, 56(7), 1070. https://doi.org/10.1071/AN14647
Wiedemann, S.G, & McGahan, E. J. (2011). Environmental assessment of an egg production supply chain using life cycle assessment – Final Project Report (No. 1FS091A). Australian Egg Corporation Limited.
Wiedemann, S.G., McGahan, E. J. & Murphy, C. M. (2017). Resource use and environmental impacts from Australian chicken meat production. Journal of Cleaner Production, 140, 675–684. https://doi.org/10.1016/j.jclepro.2016.06.086
Wiedemann, S.G., Yan, M.-J., Henry, B. K. & Murphy, C. M. (2016). Resource use and greenhouse gas emissions from three wool production regions in Australia. Journal of Cleaner Production, 122, 121–132. https://doi.org/10.1016/ j.jclepro.2016.02.025
Wiedemann, Stephen G., McGahan, E. J. & Murphy, C. M. (2016). Environmental impacts and resource use from Australian pork production assessed using life-cycle assessment. 1. Greenhouse gas emissions. Animal Production Science, 56(9), 1418–1431. https://doi.org/10.1071/AN15881
Wiedemann, Stephen G., McGahan, E. J. & Murphy, C. M. (2017). Environmental impacts and resource use from Australian pork production determined using life cycle assessment. 2. Energy, water and land occupation. Animal Production Science, 58(6), 1153. https://doi.org/10.1071/AN16196
Wine Australia. (2016). Australian wine sector 2016 at a glance. Retrieved from https://www.wineaustralia.com/getmedia/5602534f-60ee-4470-8f92-d42432a921e9/MI_SectorReport_April2017.

The impacts of energy costs on the Australian agriculture sector | August 2018
SECTION 6: References 61
Australian Farm Institute PublicationsResearch Reports and Discussion PapersThe Australian Farm Institute publishes research reports and discussion papers arising from the annual research program. These publications aim to identify strategic farm sector issues and promote potential solutions to policy-makers and agribusiness leaders. Research topics are initially formulated at the Institute’s annual Australian Agriculture Roundtable Conference, which involves Australian farm and agribusiness leaders, researchers and policy-makers, members of the Institute and guest speakers, as well as members of the Institute’s Board, Research Advisory Committee and staff.
Recent Reports• Accelerating Precision Agriculture to Decision Agriculture – Analysis of the Economic Benefit and
Strategies for Delivery of Digital Agriculture in Australia• Enhancing Private-Sector Investment in Agricultural R,D&E in Australia• A Review of Farm Funding Models and Business Structures in Australia• Review of Australian Agriculture’s Trade Performance 2016• The Implications of Digital Agriculture and Big Data for Australian Agriculture • Designing Balanced and Effective Farm Animal Welfare Policies for Australia• Optimising Future Extension Systems in the Australian Grains Industry:
– Part 1: Background, Literature and Demographics of the Australian Grain Production Sector– Part 2: The Public and Private Sector Grain Advisory Systems in Australia– Part 3: International Grains Extension Models and Future Directions for the Australian Grains Industry
Extension System• Opportunities to Improve the Effectiveness of Australian Farmers’ Advocacy Groups – A Comparative
Approach• Is Counting Farmers Harder than Counting Sheep? A Comparison of the Agricultural Statistical Systems
of Australia, the United States and France• Assessing the Opportunities for Achieving Future Productivity Growth in Australian Agriculture• Does Australia Need a National Policy to Preserve Agricultural Land?• Transport Costs for Australian Agriculture
Farm Policy JournalVol. 15 | No. 2 | 2018 Is agriculture ready for autonomy?Vol. 15 | No. 1 | 2018 Accelerating precision agriculture to decision agricultureVol. 14 | No. 4 | 2017 Consolidation and competition in agricultural marketsVol. 14 | No. 3 | 2017 Getting regional infrastructure rightVol. 14 | No. 2 | 2017 Twenty years on, the GM debate continuesVol. 14 | No. 1 | 2017 The changing agricultural workforceVol. 13 | No. 4 | 2016 Farm stewardship programs in AustraliaVol. 13 | No. 3 | 2016 Can Australia’s biosecurity standards survive in a free trade era?Vol. 13 | No. 2 | 2016 Understanding the value of agricultural landVol. 13 | No. 1 | 2016 Switching on farm innovationVol. 12 | No. 4 | 2015 Australian agriculture, pursuing premium markets or productivity

New thinking about agriculture
ABN 29 107 483 661
Suite 73, 61 Marlborough Street, Surry Hills NSW 2010
T: 61 2 9690 1388 F: 61 2 9699 7270
E: [email protected] W: www.farminstitute.org.au
The impacts of energy costs on the Australian agriculture sector
A report prepared by the Australian Farm Institute
with funding from Energy Consumers Australia