the impact of xbrl on earnings management · pdf fileelaborates models for detecting earnings...
TRANSCRIPT

Erasmus University of Rotterdam
Erasmus School of Economics
Master Thesis
Accounting, auditing and control
FEM 11032-11
<title>The impact of XBRL on Earnings
Management</title>
Studentname: Xian Cheng Leow
Studentnumber: 346687
E-mail [email protected]
Date: 15th of August 2012
Supervisor Erasmus University: Mr. J. Pasmooij RE RA RO
Co-reader: Mr. R. van der Wal RA
Supervisor Ernst & Young: Mr. R. Weber

2
ABSTRACT On December 17th, 2008 the Securities and Exchange Commission (SEC) adopted a rule that
requires public listed companies as of 2009 to report their financial statement information in
XBRL form to improve the usefulness of information to investors. The aim of this paper is to
investigate the mandatory XBRL adoption effects of the S&P500 firms on earnings
management in period 2006 to 2011. With help of the Modified Jones Model the amount of
discretionary accruals, which serve as a proxy for earnings management, are measured. The
results suggest that the level of discretionary accruals significantly has decreased after the
XBRL adoption. In addition, the results indicate that the financial crisis does not affect the
number of discretionary accruals but only the number of non-discretionary accruals. Insights
drawn from this study are especially valuable for regulators and standard setters since it
provides evidence of the benefits, costs and consequences of the mandatory XBRL filing rule.
Keywords: Discretionary accruals, Earnings management, Modified Jones model, SEC,
United States, XBRL
3
TABLE OF CONTENT
ABSTRACT 2
TABLE OF CONTENT 3
PREFACE 5
1 INTRODUCTION 6
1.1 Background 6
1.2 Problem definition 6
1.3 Relevance 7
1.4 Research approach 8
1.5 Structure 8
2 EXTENSIBLE BUSINESS REPORTING LANGUAGE 9
2.1 Introduction 9
2.2 Concept of XBRL 9
2.2.1 Taxonomy ............................................................................................................. 10
2.2.2 Instance document ............................................................................................... 10
2.2.3 Stylesheets ........................................................................................................... 10
2.2.4 Linkbases .............................................................................................................. 12
2.2.5 Mapping ............................................................................................................... 12
2.3 Benefits and limitations 12
2.4 SEC filing 14
2.5 Reporting process 15
2.6 Global developments 17
2.7 Summary 18
3 LITERATURE REVIEW 19
3.1 Introduction 19
3.2 Introduction to XBRL 19
3.3 Technical aspects 19
3.4 Voluntary adoption 20
3.5 Issues concerning XBRL 21
3.6 Mandatory adoption 22
3.7 Summary 22
4 DETECTING EARNINGS MANAGEMENT 24
4.1 Introduction 24
4.2 Earnings management 24
4.3 Earnings management techniques 25
4.4 Accruals 27
4.5 Earnings management models 28
4.6 Other earnings management models 31
4.7 XBRL and accruals 32

4
4.8 Factors that could influence the results 33
4.9 Summary 34
5 HYPOTHESES 36
5.1 Introduction 36
5.2 Expectations 36
5.3 Hypotheses 37
5.4 Summary 37
6 RESEARCH DESIGN 38
6.1 Introduction 38
6.2 Research method 38
6.3 Sample selection 38
6.4 Research model 39
6.4.1 Testing the variables ............................................................................................ 41
6.4.2 Statistical analysis ................................................................................................. 42
6.5 Limitations 43
6.6 Summary 43
7 RESEARCH RESULTS 44
7.1 Introduction 44
7.2 Data testing 44
7.2.1 Descriptive statistics ............................................................................................. 44
7.2.2 Test of assumptions ............................................................................................. 45
7.3 Results 48
7.3.1 Pearson correlations ............................................................................................ 48
7.3.2 Univariate data analysis ....................................................................................... 51
7.3.3 Multivariate data analysis .................................................................................... 52
7.4 Analysis 55
7.5 Summary 56
8 CONCLUSIONS 57
8.1 Summary and conclusions 57
8.2 Limitations 59
8.3 Contribution and further research 59
GLOSSARY 60
REFERENCES 61
APPENDIX 64
A: Sample list 65
B: Voluntary XBRL adopters 67
C: Overview literature 69

5
PREFACE I gratefully acknowledge the helpful suggestions and comments provided by my supervisor
Mr. J. Pasmooij RE RA RO. He encouraged me during the master thesis process. Also, I would
like to express my gratitude to Mr. R. Weber for his valuable advice and arranging contacts
with whom I could discuss with about the concept of XBRL. Therefore, I would also like to
thank Mr. H. Lucassen for informing me about the latest XBRL developments. I gratefully
thank the authors Mr. E. Boritz and Mr. J.H. Lim for their input by answering my questions
every time I confronted a complex issue. I would like to give my special thanks to R.
Kranendonk for his helpful comments and for checking my master thesis on grammar
mistakes. I want to thank the co-reader R. van der Wal RA in advance for reading my master
thesis. At last, I am grateful to all those I did not mention who gave me the possibility to
write and complete this master thesis.
Xian Cheng Leow
Puttershoek, August 2012

6
1 INTRODUCTION
1.1 Background
Firms exchange business information within the company and to third parties in various
ways. This can be on printed paper, but also in electronic files such as excel or pdf. A few
years ago there was no standard to exchange all this data, which restricts the company to
collect and analyze the data in an efficient way. Therefore, a new standard XBRL (eXtensible
Business Reporting Language) has been introduced to mitigate these problems. “XBRL, the
eXtensible Business Reporting Language, is an open standards-based reporting system being
built to accommodate the electronic preparation and exchange of business reports around
the World.” (Richards, Smith and Saeedi, 2007, p.1). The purpose of XBRL is providing a
standard business reporting language in order to improve data analyses and exchange of
business information within and between entities. According to XBRL International (2012)
this new business reporting format provides a lot of advantages, such as reduce cost, an
increase of data reliability, increase efficiency, increase comparability of business data and
an increase of information usefulness for decision makers and investors.
On December 17th, 2008 the Securities and Exchange Commission (SEC) adopted a rule that
requires public listed companies as of 2009 to report their financial statement information in
XBRL form to improve the usefulness of information to investors. In the final rule of SEC
(2008) is stated that this new rule apply to “public companies and foreign private issuers that
prepare their financial statements in accordance with U.S. generally accepted accounting
principles (U.S. GAAP), and foreign private issuers that prepare their financial statements
using International Financial Reporting Standards (IFRS) as issued by the International
Accounting Standards Board (IASB)” (SEC, 2008).
1.2 Problem definition
Before the final rule several studies have investigated the effects of XBRL voluntary filing in
XBRL across the financial information environment. For instance, the study of Premuroso
and Bhattacharya (2008) suggests that firms that have XBRL implemented are more likely to
have superior corporate governance structures in place. Another study for example, Pinsker
and Li (2008) found out that “XBRL used as an investor search technology has been found to
increase the transparency of the reported information in an experimental context” (Pinsker
and Li, 2008). While most investigators have focused on the voluntary adopting of XBRL to
confirm the advantages mentioned by the SEC; Kim, Lim and No (2012) have examined the
effect of mandatory XBRL reporting across the financial information environment. Their
findings show an increase in information efficiency, decrease in event return volatility and a
reduction of change in stock returns volatility (Kim, Lim and No, 2012). With respect to the
advantages of XBRL, the reduce cost and increase information efficiency lead to better
analyses by investors. According to Peng, Shon and Tan (2011), this may discourage

7
managers to engage in earnings management. They found empirical evidence that the level
of total accruals is lower in the post-XBRL period compared to the pre-XBRL period. To
contribute to the existing literature, this paper is going to explore the influence of
mandatory XBRL filing on the level of discretionary accruals of the US listed S&P500 firms, as
there are not a lot of empirical studies that have focused on the mandatory XBRL filing by
the SEC. This study will also be limited to the S&P500 firms, which were the first mandated
to fill in XBRL. The reason for this limitation is that when other companies are also taken into
account, it could influence the results. Regarding to the recognized problem stated above a
research question can be formulated, which will be answered during the progress of this
study. The research question is as follows:
“Does the mandatory adoption of XBRL decrease the level of discretionary accruals of the
S&P500 US listed firms?”
In order to answer the research question, several questions have been formulated. Each of
these sub questions answers a part of the research question.
1. What is XBRL and what are the developments regarding XBRL?
2. What research has been conducted regarding XBRL?
3. What are discretionary accruals and earnings management and what is the most
appropriate model for detecting discretionary accruals?
4. What are the expectations and hypotheses of XBRL on accruals?
5. How can the mandatory adoption of XBRL on accruals be measured?
6. What is the impact of XBRL on earnings management?
1.3 Relevance
Since there are not a lot of empirical studies on the mandatory XBRL adoption, the findings
from this study greatly contribute to the existing literature by providing insight into the issue
of the mandatory XBRL implementation and relating benefits. The results will be valuable to
preparers of financial statements, since the bolt-on approach will slowly vanish and repress
by the embedded approach. Also the regulators and standard setters can benefit from this
study by informing them the benefits, costs and consequences of the mandatory XBRL
adoption. Lastly, the findings from this research could be a good foundation for those who
want to investigate the effects of the adoption.

8
1.4 Research approach
The research approach will be based on the Positive Accounting Theory (PAT), since this
study seeks to explain and predict a particular phenomenon, which is for this research
“earnings management”. Most studies deal with choices of the management, which are
often analyzed on an aggregate level and firm specific or country specific characteristics. For
this study the discretionary accruals will be measured by the Modified Jones model, which is
the best measurement for discretionary accruals according to Dechow, Sloan and Sweeney
(1995). The used independent and control variables in the regression are also firm specific
characteristics. Therefore, the research approach is not based on the Market Based
Accounting Research (MBAR) and not on the behavioral research (BAR), since it respectively
is not a study of aggregated behavior of investors or individual as reaction on financial
information. Furthermore, this study does not investigate the empirical association between
accounting numbers and stock market values, which indicates that the approach will be
based on PAT.
1.5 Structure
The remainder of this paper starts with chapter 2, which explains the concept, SEC filing and
the latest developments of XBRL around the globe. Chapter 3 provides the reviews of the
prior literature conducted in the area of XBRL and earnings management. Chapter 4
elaborates models for detecting earnings management to find the most appropriate model
for this research. In chapter 5 the development of the hypotheses will be discussed. Chapter
6 will elaborate the various aspects of the research design. The results and analyses of this
research will be described in chapter 7. Finally, in chapter 8 the conclusion and suggestion
for further research will be given.
9
2 EXTENSIBLE BUSINESS REPORTING LANGUAGE
2.1 Introduction
In this chapter the first sub question will be answered: “What is XBRL and what are the
developments regarding XBRL?” This is necessary in order to create an overview to gain
knowledge about XBRL, which makes it easier to detect critical issues concerning XBRL. It
starts with a description of the XBRL concept followed by the benefits and limitations of
XBRL. Then the SEC mandatory XBRL filing rule and the reporting process in practice is going
to be discussed. Lastly, the developments of XBRL around the globe will be given.
2.2 Concept of XBRL
XBRL stands for eXtensible Business Reporting Language and is an open-standard XML
(eXtensible Markup Language) based format, which is developed by an American Accountant
Charles Hoffman. Extensible Language means that it is designed with the intention to make it
possible to add new features on a later date. To keep the development of XBRL consistent a
set of rules or specifications need to be managed. These specifications explain how the data
needs to be tagged (Richards, Smith and Saeedi, 2007). The purpose of XBRL is to
standardize the business reporting language to improve the analyses and exchange of data
between entities. It all started in 1998 when Charles Hoffman was experimenting with XBRL
to simplify the financial information exchange to financial institutions, decision makers,
analysts, supervisors and other financial information users.
Within XBRL there can be a distinction made into two variants: (1) XBRL FR (Financial
Reporting) and XBRL GL (Global Ledger). The first one mentioned is primary used for external
financial reporting and the other variant is a format to standardize the capturing of
economic events and exchanging of general ledger data transactions. The XBRL standard is
managed by a foundation called “XBRL International”. It is an initiative of participating
organizations such as (public) companies, governmental entities, and research- and
educational organizations. Their goal is to make other companies aware of XBRL and to give
presentations to share knowledge and experience (XBRL International, 2012).
As mentioned earlier, XBRL is based on the open-standard XML. Back at 1996, the
development of XML started and took over two years later by the World Wide Web
Consortium, which are also responsible for the design of webpage standards like HTML,
XHTML and CSS (World Wide Web Consortium, 2012). A XML file consists of numbers or text
that is tagged to separate and limit the different parts of text and numbers. The meaning of
these tags and their attributes can be modified to the wishes of the programmer.
10
2.2.1 Taxonomy
In order to work with XBRL a taxonomy is needed. A taxonomy is almost similar to a
dictionary and it consists of definitions of every reporting element and their mutual relation.
However, it does not contain any data. Every word or text in a report will be tagged with an
unique definition to create an unambiguous report definition. Then the reports can
automatically be read and processed based on this report definition. Now computers can
recognize, select, save, combine, analyze, exchange and present the information to users.
(XBRL International, 2012). The basic taxonomy does not often reflect the needs of the firms.
Therefore, some companies create an extension, which is an addition to the basic taxonomy.
Such extensions provide more flexibility to accommodate the unique attributes of the firm.
These extensions are required to be allowed by the regulatory body before it can be used for
external reporting (Garbellotto, 2009). A simple example of an element, which is recorded in
the taxonomy (Richards, Smith and Saeedi, 2007):
<element name=”NetProfit”/>
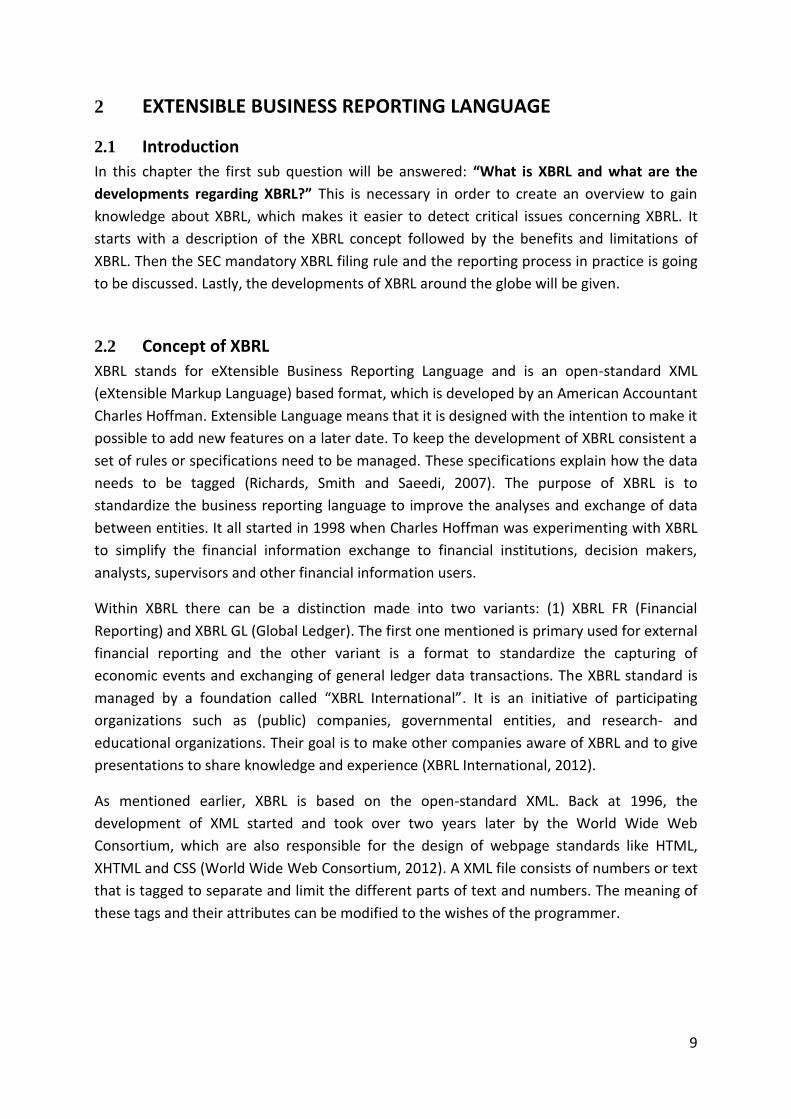
2.2.2 Instance document
The report that is readable for the computer is called an instance document. In this XBRL
format the data will be saved with a reference to a definition in the taxonomy. This way the
definition of the text has been determined, but not the context, so other systems do not
know to which company or period the text is related to. These characteristics also need to
be included in the instance report. With the use of the instance report an unambiguous
report is created, which can be understood by other systems (XBRL International, 2012).
With the use of the “NetProfit” example from the previous example, an instance document,
which is based on that taxonomy, can be made (Richards, Smith and Saeedi, 2007):
<NetProfit>100000</NetProfit>
This line is a part of an instance document, figure 2.1 gives an example how an instance
document could look like.
2.2.3 Stylesheets
The instance document explained above contains information that can be easily recognized
by systems, but it is difficult to read for users. To make the instance documents readable for
users it needs to be converted into a readable format. This format is called stylesheets (see
figure 2.2), which make it possible to present the data to make it readable by persons.

11
Figure 2.1 - Source: Altova (2012)
Figure 2.2 - Source: Altova (2012)

12
2.2.4 Linkbases
Linkbases are an important part to define XBRL taxonomy. The goal of these linkbases is to
combine references and labels together with the data and define the relation between it.
Without linkbases the taxonomy is meaningless, because otherwise there would be no rules
to define the terms (XBRL International, 2012). There are five different types of linkbases
(table 2.3).
The label linkbase Since XBRL is a world-wide standard for business reporting a linkbase
is required that represent data in different languages. The label
linkbase creates elements in the taxonomy with labels in different
languages that are linked to their respective elements.
The reference linkbase This linkbase stores the references of elements to particular concepts,
which are defined by authoritative literature. However, it only stores
the source identification names and paragraphs but not the
regulations.
The calculation linkbase
The purpose of this linkbase is to improve the quality of XBRL reports
by defining the basic calculation rules, such as addition and
subtraction.
The definition linkbase
This linkbase provide the possibility to relate elements with each
other. The relation between the elements can be pre-defined or
defined by the creator itself.
The presentation
linkbase
The presentation linkbase is used to associate concepts with each
other to create a visualization of the elements e.g. balance sheet and
income statement.
Table 2.3 - Source: XBRL International (2012)
2.2.5 Mapping
The term mapping means that the appropriate general ledger is linked to the right
taxonomy. This results in a finished financial statement right after the column balance has
been prepared by the company. Mapping only has to occur once per taxonomy and the
accountants that are making the financial statements would not notice anything of the
mapping (XBRL International, 2012).
2.3 Benefits and limitations
Benefits
XBRL brings several advantages that change the reporting drastically. First, it increases the
quality of reports, since the data input is done automatically. Less human interventions lead
to less human errors, which cause an increase in data quality. Second, it will be possible to
distribute the reports quicker, since systems can recognize and select the relevant data.
Reading and copying financial information is not necessary anymore. Third, the use of XBRL

13
improves the analyses and decision making. By using one standard the data is more
transparent and comparable with each other, which will save the company time and money.
Finally, XBRL will improve the communication and processes, because of mapping the
different systems with one taxonomy. Changes in the taxonomy can be carried out directly
to all the systems (XBRL US, 2012). In addition to the benefits, Dunne, Helliar, Lymar and
Mousa (2009) from the Association of Chartered Certified Accountants (ACCA) conducted a
qualitative research in the UK. They held a questionnaire survey under external auditors, tax
practitioners, accountants and financial directors from the business and the users of the
financial statements, such as analysts and shareholders. While most respondents are not
aware of XBRL, from the relatively few respondents, which are familiar with XBRL, the
authors can conclude the following points as the benefits of XBRL (Dunne et al., 2009):
- No need to re-key data;
- Reduction of processing errors;
- Assurance over the integrity of data;
- Knowledge that the data is reliable with no errors;
- Inter-operability and can be used in conjunction with any system;
- Easy to integrate with others systems;
- Speeds up the gathering of data;
- Enhances analytical processes;
- Enables better data comparability.
Limitations
XBRL does not only bring advantages, but also brings some issues and limitations for the
business and accounting firms. The most important issue is that all the companies will create
their own extensions on the standard XBRL taxonomies based on their different needs of
reporting. Such extensions would decrease the comparability between XBRL based reports
and firms (Boritz and No, 2009; Debreceny and Farewell, 2010). Due to lack of comparability
between business reports those extensions could undermine the goal of XBRL. Moreover,
there are some small limitations that especially occur during the introduction cycle of XBRL.
In the beginning of the implementation phase most accountants do not have much
knowledge about XBRL. They should be educated with courses and information sessions. The
study of Boritz and No (2009) and Chou (2006) found out that XBRL documents under the
SEC filing contain bugs. To solve these problems, the taxonomy needs to be constantly
updated. Another limitation that arises when there is less human intervention in the
systems, is the possibility of systematic errors. For instance, when there is a mistake made
with the mapping the taxonomy of the appropriate general ledger all the instance document
outputs will contain the errors. Furthermore, the research findings of Dunne et al (2009)
mentioned the major obstacles that their respondent has indicated, namely (Dunne et al.,
2009):
- The time and effort required to learn XBRL;
- The cost of buying the software;

14
- Implementing new procedures and processes;
- Little software available for displaying and analyzing XBRL data;
- Proliferation of taxonomy elements.
2.4 SEC filing
On December 17, 2008 the Security and Exchange Commission (SEC) adopted a new rule,
which mandate companies to use the XBRL as the format to disclose financial information
with the intention to improve the decision-making of investors. In order to facilitate easy
viewing and downloading of financial reports in XBRL format the SEC has upgraded her
online EDGAR database in 2009 to support this new rule. The new rule applies to two types
of companies: (1) public companies that prepare their financial statements following the US
General Accepted Accounting Principles (US GAAP) and (2) foreign private companies that
prepare their financial statements under US GAAP or International Financial Reporting
Standards (IFRS). These companies are obliged to use the XBRL format to provide the above
mentioned statements to the SEC and on their corporate Websites (SEC, 2009). The adoption
is divided in four phases and starts with the domestic and foreign companies that are using
US GAAP in order to prepare their financial statements and have a common equity float
above $5 billion at the end of the fiscal period on June 25, 2009 or after this date. They are
required to submit their XBRL formatted financial statements using a tag list provided by the
International Accounting Standard Board (IASB) for the used regulation. This applies for the
whole financial statement except for the footnotes and detailed schedules. Table 2.4 shows
a schedule when certain companies have to comply with the new rule.
Domestic and Foreign Large
Accelerated Filers Using U.S. GAAP
with Worldwide Public Common
Equity Float above $5 Billion as of the
End of the Second Fiscal Quarter of
Their Most Recently Completed Fiscal
Year. (This will cover approximately
500 organizations.)
Quarterly report on Form 10-Q or annual report on Form
20-F or Form 40-F containing financial statements for a
fiscal period ending on or after June 15, 2009.
All Other Large Accelerated Filers
Using U.S. GAAP
Quarterly report on Form 10-Q or annual report on Form
20-F or Form 40-F containing financial statements for a
fiscal period ending on or after June 15, 2010.
All Remaining Filers Using U.S. GAAP Quarterly report on Form 10-Q or annual report on Form
20-F or Form 40-F containing financial statements for a
fiscal period ending on or after June 15, 2011.

15
Table 2.4 - Source: SEC (2008)
For each phase of implementation, in the first year, the financial statements are required to
be tagged of interactive data reporting. After the first year, the footnotes and schedules of
the financial statement need to be tagged. However, it only needs to be tagged in block text,
which means that the footnote can be tagged as whole instead of tagging every part of the
footnote separately. In the third year the block tagging is over and it is required to be tagged
in detail within the footnotes (Garbellotto, 2009). Table 2.5 presents the phases applied on
the S&P500 firms.
2009 The face of the financial statements would be tagged in each filer’s first year of
interactive data reporting.
2010 The financial statement footnotes and schedules also would be tagged in each
filer’s first year, but in block text only, meaning that a footnote would be
tagged as a whole instead of assigning meaningful tags to specific, relevant
information contained within the footnote itself. This is to ensure that the
tagged content in the footnote can be analyzed, validated and compared.
2011 After the first year of such tagging, a filer also would be required to tag the
detailed disclosures within the footnotes and schedules.
Table 2.5 - Source: Garbellotto (2009) and SEC (2008)
2.5 Reporting process
The mandatory rule by the SEC is the driving factor for companies to adopt XBRL. This is the
reason that most organizations do not understand the real value of XBRL and have
developed an approach just to comply with the new filing rule requirement. This translates
into a situation where the traditional reports are converted into a XBRL format report, which
is called the bolt-on approach. According to Garbellotto (2009) there are three primary XBRL
implementation approaches. These are the bolt-on approach, built-in at the reporting
writing application level and built-in at the embedded general ledger level. The bolt-on
approach is the first step of implementing XBRL into the business and should eventually
Foreign Private Issuers with Financial
Statements Prepared in Accordance
with IFRS as Issued By the IASB
Annual reports on Form 20-F or Form 40-F for fiscal
periods ending on or after June 15, 2011.
(“Beginning with annual reports for fiscal years ending on
or after December 15, 2011, foreign private issuers are
required to file their annual reports on Form 20-F within
four months (formerly six months) after the end of the
fiscal year covered by the annual report. Accordingly, the
filing deadline for 2011 annual reports on Form 20-F of
foreign private issuers that have adopted a December 31
fiscal year end will be April 30, 2012.” ( Seward and
Kissel LLP, 2012))
16
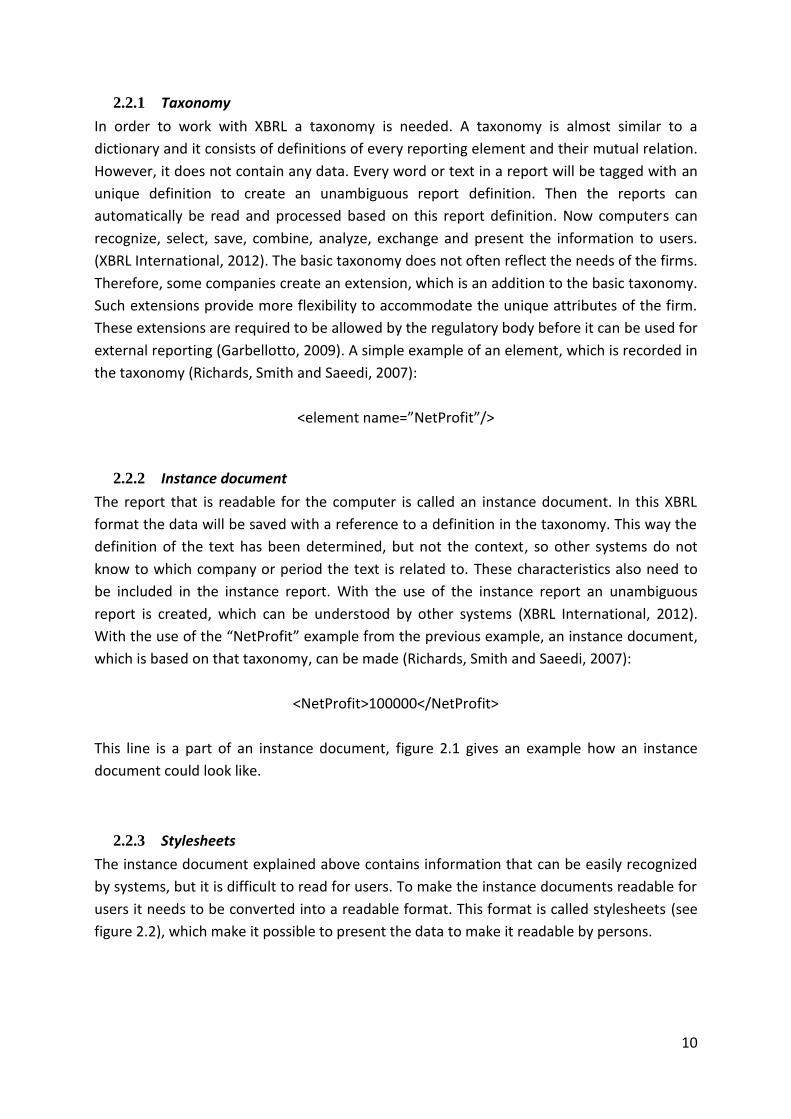
move to the deeply built-in approach. Figure 2.6 gives the relationship between the
approaches and how deeply XBRL is embedded in the financial information system of the
organization.
Figure 2.6 - Source: Garbellotto (2009)
Bolt-on approach
The bolt-on approach only focuses on the external reporting. After the preparation of the
financial statements in e.g. excel or pdf format the financial statements is converted into a
XBRL format. The converting is often outsourced by the company to printing companies or
other third party service providers. From the company’s perspective, there are no further
changes or benefits in their reporting process except that they will comply with the XBRL
filing requirement. As for the cost of implementation, the SEC proposed rule also included an
analysis of the estimated cost of the XBRL filing based on the voluntary filing program (VFP).
The average cost for the first submission is estimated on $30.933 and is estimated for the
second year on $9.060.
Built-in: at reporting writer applications level
XBRL can be used for internal reporting as well as when XBRL is built-in the reporting writer
applications level. With this approach, it becomes easy to create standard- and additional
reports (style sheets) on a real-time base. These reports such like monthly, weekly or even
daily reports are normally created manually by employees who often use different programs
and systems to compose them. XBRL improves the efficiency of this process and reduces the
cost and time. Another advantage of this approach is that it will keep the connection to the
underlying systems and data, in contrast to the manually converted excel spreadsheet.
(Garbellotto, 2009)
Built-in: Deeply embedded in ledgers/systems
The ultimate objective is to built-in the XBRL into the ledger/systems, which is often called
XBRL Global Ledger. This approach is the most advanced method and with the use of XBRL

17
GL taxonomy to standardize the detailed data, it will offer a wide range of possible
applications. Instead of manually generating the reports and map it afterwards to the
appropriate XBRL taxonomy, the whole process is standardized in this deeply built-in
approach. This is the most costly method and the cost for implementation is difficult to
estimate, since it depends on various factors such as size of company or organization
structure, and could vary significantly. “Significant cost savings in key and pervasive
corporate processes can be achieved, and the extent of those savings grows the deeper XBRL
is embedded within the information system--from the trial balance level down to the general
ledger, journals, and, ultimately, documents and transactions” (Garbellotto, 2009, p.56).
2.6 Global developments
The United States is not the only country, which has implemented XBRL for regulatory filings.
According to XBRL international and SEC many other countries are implementing XBRL as the
standard format for business reporting. For instance, in 2007 the Canadian Securities
Administrators (CSA) and also Korea started a voluntary XBRL program (SEC, 2007). Japan
introduced XBRL in 2006 and in 2008 they adopted a rule that mandates all public companies
to use XBRL by the end of July 2008 (XBRL International). The UK announced to use XBRL as
the standard for business reporting in 2010 (XBRL International). A country that already fully
implemented the XBRL filings is China. Since 2003 all public listed companies are obliged to
use XBRL format for their interim- and annual reports (XBRL China, 2012). Figure 2.7 shows
the XBRL filings development on April 2011 all over the world.
Figure 2.7 - Source: Deloitte (2012)
18
2.7 Summary
XBRL stands for Extensible Business Reporting Language and is a reporting method with the
purpose to standardize the business reporting language. This method can be used to
improve business analyses and the exchange of data between entities. In order to
understand the concept of XBRL some terms need to be clarified. Taxonomy is an electronic
dictionary, which consists of business reporting elements for reading business data. An
electronic XBRL document is called an instance document. An instance document is not
readable by users. To make it readable for users the document is converted into a
stylesheet. The term mapping means that the appropriate general ledger is linked to the
right taxonomy.
On December 17, 2008 the Security and Exchange Commission (SEC) adopted a new rule,
which mandate companies to use the XBRL as the format to disclose financial information. In
the first year the S&P500 listed companies were obliged to use XBRL as the new reporting
standard. In the current situation the S&P500 companies have developed a bolt-on approach
to comply with the XBRL filing requirement. The US is not the first country, which has
implemented XBRL, several other countries already adopted XBRL.

19
3 LITERATURE REVIEW
3.1 Introduction
In this section the following sub question will be answered: “What research has been
conducted regarding XBRL?” Therefore, the prior literature concerning XBRL is going to be
reviewed to establish a theoretical framework before engaging into the research. The
purpose of the theoretical framework is to provide support by discussing known
relationships between variables and to set boundaries and limits. The review starts with the
studies that provide an introduction to XBRL followed by literature researches about the
technical aspects of XBRL. Then the voluntary adoption and the related implications are
going to be discussed. Subsequently, the papers of the mandatory adoption will be reviewed
to arrive eventually to the summary, where the aspects will be summarized that should be
taken into account for this research.
3.2 Introduction to XBRL
In the last decade there are more and more researches conducted that are focusing on the
different aspects considering XBRL. The majority of these studies have looked on the
benefits/costs of XBRL and how XBRL influences the users such as regulators, tax authorities,
third party software developers, audit firms and investors. For instance, the study Rezaee,
Elam, and Sharbatoghlie (2001) discussed the implications of continues auditing where XBRL
is an essential part of. The authors also assess the internal controls related to IT environment
and the key IT audit aspects. Few years later Higgins and Harrell (2003) conducted a research
to inform businesses about a new upcoming markup language: XBRL. The potential
possibilities, benefits and current development at that time are discussed. They believe that
XBRL will become the new standard for business reporting and companies should start begin
the process to understand XBRL and how this reporting standard could influence their
company. Moreover, the study of Burnett, Friedman and Murthy (2006) also explained the
potential benefits of XBRL. However, they found a gap in the existing literature, which have
never been investigated yet, namely a direct link between the technique of XBRL and the
CFO. Their paper discussed how XBRL could help CFO’s with cost reduction, compliance with
the regulation and data efficiency. Another interesting research is the study of Richards,
Smith and Saeedi (2007), which not only explained the development of XBRL, but also
explained the technique behind it in detail. However, there are more other studies that
dedicated their research to investigate the technical aspects of XBRL in depth.
3.3 Technical aspects
Bovee, Ettredge, Srivastava and Vasarhelyi (2002) were questioning to what extent the
standard taxonomy reflects the preferred taxonomy by companies. If the standard proposed
taxonomy does not meet the requirements of the companies it would result into

20
information loss and resistance from the industry to adopt the standard taxonomy. To
examine the mentioned issue, the authors measure the differences between the year 2000
US GAAP taxonomy and the preferred financial reporting of public companies. They found
out that the standard taxonomy fits the requirement quite well. However, the taxonomy
does not have all the elements included to cover the requirements of certain financial
statements and industries. Another example that addresses the technical issues of XBRL is
the study of Boritz and No (2005). This paper addresses the security of XML based forms
financial reporting services on the Internet. It first defines the terms XBRL and Extensible
Assurance Reporting Language (XARL). XARL is a service provided by assurance providers,
which help users by supervising the integrity and reliance of information from the Internet.
Furthermore, the authors argue about potential security threats and limitations of these
formats. In addition, the authors suggest Web Services Security Architecture as the proper
security mechanism for financial reporting services on the Internet.
3.4 Voluntary adoption
As mentioned earlier, countries around the globe are planning to adopt or already have
adopted XBRL as the standard format for business reporting. Prior studies have shown how
XBRL affected the companies and what kind of implications it has on the business
environment after the early XBRL adoption. For instance, the study of Debreceny, Chandra,
Cheh, Guithues-Amrhein et al. (2005) has evaluated the implications of the voluntary
adoption rule proposed by the SEC by focusing it on three areas, which are: (1) The role of
XBRL, (2) issues of XBRL taxonomy and (3) the impact of XBRL on the industry. Another
study conducted in Australia by Doolin and Troshani (2007) shows several factors that have
influenced the XBRL adoption, such as company’s complexity, stability and readiness. Almost
similar to this study is the research of Pinsker and Li (2008). They held interviews with
business managers and discussed to what extent the adoption of XBRL has affected their
company. The focus was led on the adoption of XBRL itself, the effects of XBRL, capital cost
and transparency. It can be concluded that XBRL has a positive influence on the reduction of
the capital cost and an increase of transparency, which could reduce the level of accounting
accruals (Pen, Shon and Tan, 2011). Furthermore, the authors suggested a minor issue
regarding the uncertainty of the XBRL technology, which prevented a quick adoption. Efendi,
Park and Subramaniam (2009) also investigated how XBRL have affected the voluntary XBRL
filers. They have focused whether the XBRL filings of annual reports (10K) and quarterly
reports (10Q) contain incremental information and found evidence that confirms their
expectations. Especially in 2007 and 2008 the authors found more incremental information
content in the XBRL filings. For instance, Premuroso and Bhattacharya (2008) have examined
whether voluntary XBRL filers are more likely to have superior corporate governance and
operating performance in comparison to the companies that do not adopt XBRL. They found
that corporate governance, firm performance and firm size are positively associated with the
voluntary adoption decision of the company. Based on these findings Ragothaman (2011)

21
investigated the voluntary XBRL adopters firm characteristics and like Premuroso and
Bhattacharya (2008) their results suggest that firm size is positively associated with
voluntary XBRL filers. An entirely different study is the study of Janvrin, Pinsker and Mascha
(2011), which is conducted in the post XBRL adoption period to find out the popularity of
using the XBRL format. They conducted a study to examine which reporting format non-
professional investors (XBRL, Portable Document File (pdf) or Excel) will pick for their
financial analysis tasks. Their results suggest that 66% of the non-professional investors have
chosen the XBRL format as their standard format for analysis and 34% have chosen for Excel.
Investors believe that the use of XBRL will reduce the time in order to complete the tasks.
The argument for the participants who have chosen for Excel is because of their prior
experience with this program to make financial analyses.
Now the impact of voluntary adoption has been reviewed the next subparagraph will
address the issues that prior literature has encountered during the voluntary adoption
period.
3.5 Issues concerning XBRL
Prior literature raised a lot of questions about the quality of XBRL instance documents, due
to inconsistency between instance documents and issues related to the assurance with
respect to XBRL. Therefore, some studies focus more on the audit of instance documents.
For example, Boritz and No (2009) have adopted a case research approach from another
study (Benbasat, Goldstein and Mead, 1987) to replicate a mock audit that auditors perform
at their clients. Their goal was to determine whether XBRL documents were accurate,
complete and how it has affected the mock audit at the company “United Technologies
Corporation” (UTC). The authors found out that only 44,3% of the instance documents were
based on the standard taxonomies. The reason for this is that UTC is using custom made
taxonomies due to the limitations of the standard taxonomies. Furthermore, they found
evidence that the custom taxonomy is using different elements for the same job titles,
names and signatures. In addition, the titles and names were not always present in the
instance document. Also Bartley, Chen and Taylor (2010) conducted a research on the
voluntary filings of 2006 and 2008. They detected numerous errors and inconsistencies, such
as incorrect amounts, duplicate or missing elements and used inappropriate elements for
tagging of the financial statements. The amount of errors was less in 2008 compared to
2006, but most errors persisted while many companies had three years of experience to file
in XBRL to the SEC. Another study of Debreceny, Farewell, Piechocki, Felden and Gräning
(2010) examined the early adopters of XBRL and they found some errors. By investigating
these errors the authors found out what the cause was for this problem. Most of the errors
are caused by companies that entered negative values where it should be positive in the
instance documents. To solve and prevent this problem in the future the authors suggest
implementing input validation and the use of quality management. Plumlee and Plumlee
(2008) investigated the different issues that arise at the assurance of XBRL based data. The

22
area that needs more attention for further research is the development of assurance
guidance on XBRL documents.
While all the reviewed literature described above was investigating the impact of XBRL,
some studies like the study of Zhu and Wu (2010) based their research on such prior
literature findings to come up with their own measurement. These authors have developed
a method to measure the relevance and completeness of data standards to improve the
quality of financial data. To assess their method they used a sample of 500 companies, which
are using the US GAAP taxonomy and SEC filings. The results suggest that the developed
metrics is an appropriate measurement for the quality of data standards. Srivastava and
Kogan (2010) took a step further in their study and developed a conceptual framework of
assertions that act as a guidance for quality assurance on XBRL documents to see whether
the instance document represents the text document.
3.6 Mandatory adoption
Few years after the mandatory XBRL adoption by the XBRL filers a few studies have
conducted a research to assess the data quality of XBRL mandatory filings. For example, the
study of Roohani and Zheng (2011) used a sample from July 2009 to December 2011 to
investigate the determinants of the deficiency of mandatory XBRL filings. Their results
suggest that XBRL deficient filings are likely to have a higher percentage of extensions, are
filed by larger and more complex firms and are from preceding years (Roohani and Zheng,
2011). Furthermore, the results show that firms that have a few years’ experience in XBRL
filings tend to have more minor errors, but less major errors. A research that examines the
overall changing pattern of errors is the study of Du, Vasarhelyi and Zheng (2011). They
found that as more quarters pass, software improves and the amount of errors in instance
documents will significantly decrease. “Suggesting that the SEC, the company filers, and the
technology community all learn from their experiences and therefore the future filings are
improved” (Du, Vasarhelyi and Zheng, 2011, p.2). Also Kim, Lim and No (2012) were looking
to find evidence for the effects of mandatory XBRL reporting on the financial information
environment during the early XBRL adoption period in the US. The sample of this study
consists of 425 firms, which contain 1159 firm quarters. Their results show a decrease in
event return volatility, but an increase efficiency of the information within firms.
Furthermore, the authors found that there is less change in stock returns volatility. Besides
their main findings, they also found that the XBRL format mitigates information market risk.
Their results are interesting, since an increase in information efficiency may provide
companies an incentive to improve their reporting information.
3.7 Summary
Prior studies have described the benefits and limitations of XBRL or have investigated the
impact of XBRL on the financial reporting. The studies found evidence that the instance
23
documents contain errors due to the lack of quality management. Therefore, some other
researchers developed a framework in order to reduce this amount of errors. The literature
review of XBRL shows that there is not a lot of empirical research conducted over the last
years. To contribute to the existent literature, this master thesis will examine the influence
of XBRL on earnings management. Earnings management can be measured in many different
ways by using for example the Healy model of the Jones model. Therefore, the next section
will start with a definition of earnings management followed by a description of the different
earnings management techniques. To measure earnings management, accruals are often
used and therefore the definition of accruals will be given and an assessment will be made of
the different models that use accruals in order to detect earnings management. During the
literature review all models will be considered and the most appropriate model will be
chosen to measure earnings management for this research.

24
4 DETECTING EARNINGS MANAGEMENT
4.1 Introduction
In this section prior studies conducted in the field of earnings management will be reviewed
to answer the following sub question: “What are discretionary accruals and earnings
management and what is the most appropriate model for detecting discretionary
accruals?”. Since discretionary accruals are a part of earnings management this chapter
starts with a definition and explanation of the term earnings management. After the
assessment of the different kind of earnings management models the appropriate model for
this research will be selected. Then a more extended review of an empirical research that
has examined the relationship between XBRL and discretionary accruals. Finally, the last
paragraph elaborates the factors that could influence the model.
4.2 Earnings management
In this section the term earnings management will be explained in detail. Earnings
management can be simply seen as the “managing” of the “earnings”. With earnings is
meant the profit or result of a company. The company and investors attach a lot of value to
these accounts, since the value of the company depends on the earnings. An increase of
earnings leads to an increase of firm value, and vice versa. (Lev, 1989). Therefore, companies
tend to report the earnings as positive as possible. This is called the “managing” of earnings.
There are two definitions of earnings managements that are often used in prior literature.
The first definition is from Schipper (1989) and she defines earnings management as follows:
“A purposeful intervention in the external financial reporting process, with the intent of
obtaining some private gain (as opposed to, say, merely facilitating the neutral operation of
the process).”
According to the definition of Schipper earnings management is to create higher earnings
than it is realized by the company. Their definition is on the same line as the definition of
Healy and Wahlen (1999, p.6). They define the term earnings management as follows:
“Earnings management occurs when managers use judgment in financial reporting and in
structuring transactions to alter financial reports to either mislead some stakeholders about
the underlying economic performance of the company, or to influence contractual outcomes
that depend on reported accounting numbers.”
The definitions of as well Schipper (1989) as Healy and Wahlen (1999) explain that the
companies tend to mislead the financial statement users. However, it is important to bear in
mind that earnings management is not always fraud. Earnings management is only allowed if
25
it is in compliance with the regulations. In this paper earnings management is meant with
the broader second mentioned definition.
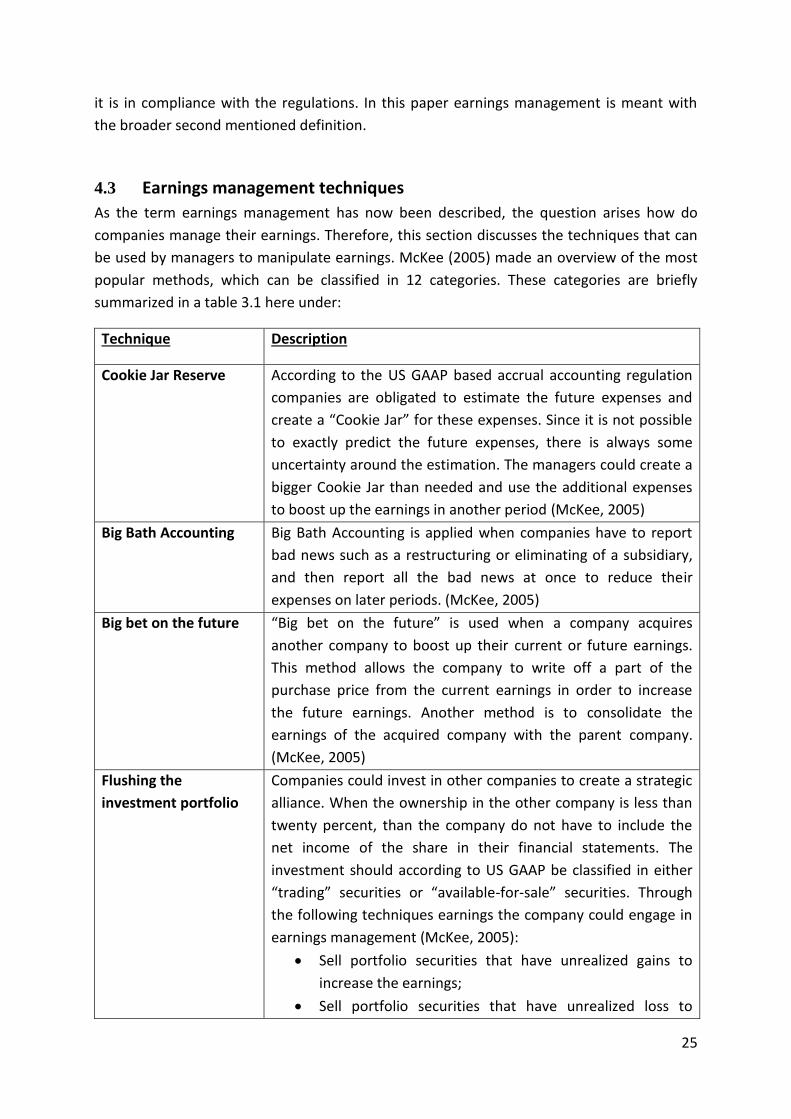
4.3 Earnings management techniques
As the term earnings management has now been described, the question arises how do
companies manage their earnings. Therefore, this section discusses the techniques that can
be used by managers to manipulate earnings. McKee (2005) made an overview of the most
popular methods, which can be classified in 12 categories. These categories are briefly
summarized in a table 3.1 here under:
Technique Description
Cookie Jar Reserve According to the US GAAP based accrual accounting regulation
companies are obligated to estimate the future expenses and
create a “Cookie Jar” for these expenses. Since it is not possible
to exactly predict the future expenses, there is always some
uncertainty around the estimation. The managers could create a
bigger Cookie Jar than needed and use the additional expenses
to boost up the earnings in another period (McKee, 2005)
Big Bath Accounting Big Bath Accounting is applied when companies have to report
bad news such as a restructuring or eliminating of a subsidiary,
and then report all the bad news at once to reduce their
expenses on later periods. (McKee, 2005)
Big bet on the future “Big bet on the future” is used when a company acquires
another company to boost up their current or future earnings.
This method allows the company to write off a part of the
purchase price from the current earnings in order to increase
the future earnings. Another method is to consolidate the
earnings of the acquired company with the parent company.
(McKee, 2005)
Flushing the
investment portfolio
Companies could invest in other companies to create a strategic
alliance. When the ownership in the other company is less than
twenty percent, than the company do not have to include the
net income of the share in their financial statements. The
investment should according to US GAAP be classified in either
“trading” securities or “available-for-sale” securities. Through
the following techniques earnings the company could engage in
earnings management (McKee, 2005):
Sell portfolio securities that have unrealized gains to
increase the earnings;
Sell portfolio securities that have unrealized loss to
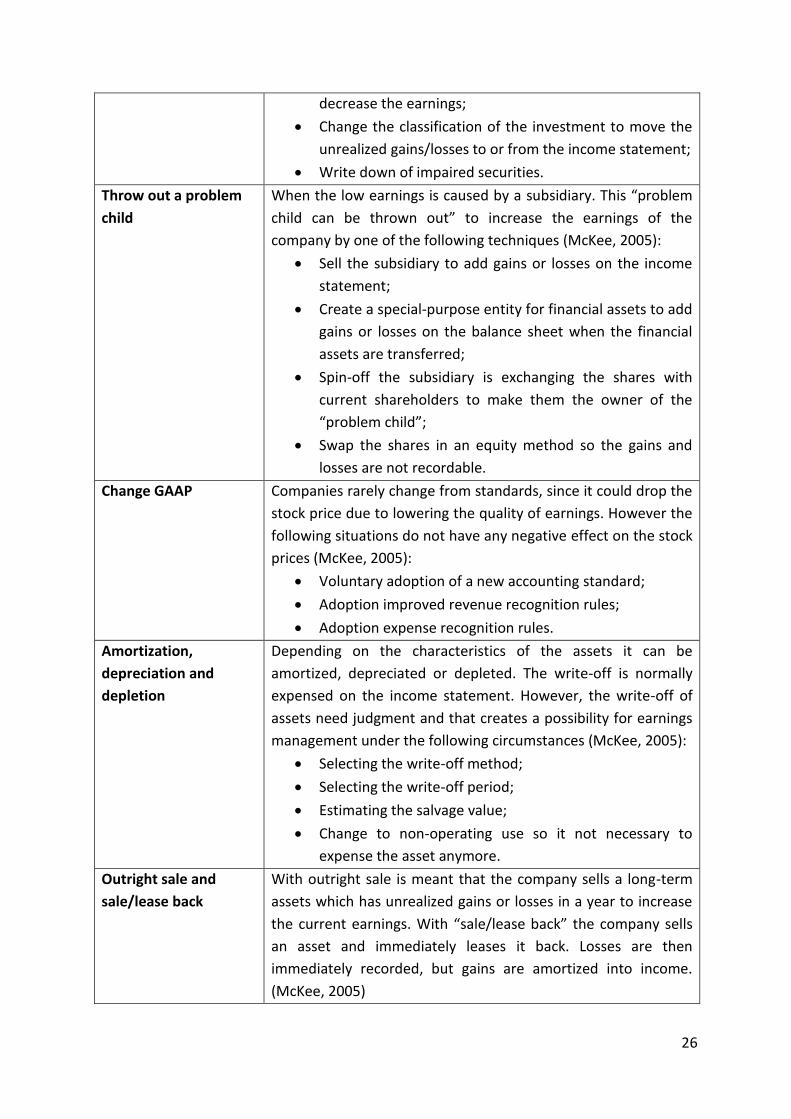
26
decrease the earnings;
Change the classification of the investment to move the
unrealized gains/losses to or from the income statement;
Write down of impaired securities.
Throw out a problem
child
When the low earnings is caused by a subsidiary. This “problem
child can be thrown out” to increase the earnings of the
company by one of the following techniques (McKee, 2005):
Sell the subsidiary to add gains or losses on the income
statement;
Create a special-purpose entity for financial assets to add
gains or losses on the balance sheet when the financial
assets are transferred;
Spin-off the subsidiary is exchanging the shares with
current shareholders to make them the owner of the
“problem child”;
Swap the shares in an equity method so the gains and
losses are not recordable.
Change GAAP Companies rarely change from standards, since it could drop the
stock price due to lowering the quality of earnings. However the
following situations do not have any negative effect on the stock
prices (McKee, 2005):
Voluntary adoption of a new accounting standard;
Adoption improved revenue recognition rules;
Adoption expense recognition rules.
Amortization,
depreciation and
depletion
Depending on the characteristics of the assets it can be
amortized, depreciated or depleted. The write-off is normally
expensed on the income statement. However, the write-off of
assets need judgment and that creates a possibility for earnings
management under the following circumstances (McKee, 2005):
Selecting the write-off method;
Selecting the write-off period;
Estimating the salvage value;
Change to non-operating use so it not necessary to
expense the asset anymore.
Outright sale and
sale/lease back
With outright sale is meant that the company sells a long-term
assets which has unrealized gains or losses in a year to increase
the current earnings. With “sale/lease back” the company sells
an asset and immediately leases it back. Losses are then
immediately recorded, but gains are amortized into income.
(McKee, 2005)

27
Operating versus non-
operating income
Income can be classified as operating or non-operating income.
Operating income is expected to continue in the future, whereas
non-operating income does not influence the future earnings
(McKee, 2005). However, there are some grey areas in
classifying reporting items, which creates a possibility for
earnings management.
Early retirement of
debt
Long-term debt is normally recorded at book value (McKee,
2005). In case of an early retirement of the long-term debt there
could be a difference between book value and cash payment,
which cause a gain or loss.
Use of derivatives Derivatives are reported as assets or liabilities on the balance
sheet against fair value. While the gains and losses are reported
on the income statement. There are some methods to change
the gains/losses for example an interest swap. (McKee, 2005)
Shrink the ship With “Shrink the ship” is meant that the company’s repurchase
their shares back from other stock owners. However, gains and
losses do not have to be reported on the income statement,
since the company and stock owners are considered the same
under GAAP. While this method does not affect the earnings,
but companies that use this technique to increase the earnings
per share. (McKee, 2005)
Table 3.1 – Source: McKee (2005)
4.4 Accruals
In the previous sections the term earnings management is defined and explained what sort
of techniques the management can use to engage in earnings management. For this
empirical research it is necessary to measure earnings management. This can be done by
using the proxy accruals. In theory revenue is recognized if it meets the following conditions:
(1) revenue is earned and (2) revenue is realized or realizable. With realized is meant that
the company has received cash for their delivered goods or services and with realizable is
meant that there is a reasonable expectation that the company will receive his cash in the
future. As for the recognition of the expenses, these will be recognized in the same period
when the related revenue is recognized, which is called the matching principle. However,
there could be a timing difference between recognizing of the revenues and expenses and
the cash payments. According to Accountinginfo (2012), there are four kinds of timing
differences. These are: (1) deferred revenue, (2) deferred expense, (3) accrued revenue, and
the (4) accrued expense. In the situation of deferred revenue the revenue is recognized after
cash is received and as for the deferred expense the expense is recognized after cash is paid.
In case of revenue recognition before the cash is received, it can be spoken of accrued
revenue. For accrued expense, the expense is recognized before cash is paid. Thus, in other

28
words when a company makes any adjustments to the revenues that have been earned or
expensed, which already have been incurred, but these are not yet recorded into the books,
it can be defined as an accrual. On a later date the accrual still needs to be reported in the
financial statement through adjusting entries.
For this research it is important to measure the degree of earnings management to see
whether XBRL has a significant impact on. Prior studies show that accruals are often used by
studies as the measurement for earnings management. For instance, Healy (1985) suggests a
model where total accruals are used to estimate non-discretionary accruals. As like other
studies accruals need to be defined to create a theoretical framework. The definition of
Healy (1985) is commonly used by other researchers. Healy defines accruals as follows:
“I define accruals as the difference between reported earnings and cash flows from
operations.” (Healy, 1985, p.86)
Another study that defines accruals is the paper of Bergstresser and Philippon (2006). They
define accruals as follows:
“Accruals are components of earnings that are not reflected in current cash flows, and a
great deal of managerial discretion goes into their construction.” (Bergstresser and
Philippon, 2006, p.512)
There can be a distinction made between discretionary accruals and non-discretionary
accruals. Discretionary accruals are the accruals that are not caused by normal operational
firm activities, but can be influenced by managers. Those are the accruals where earnings
management is all about. On the other side, non-discretionary accruals are caused by normal
operational firm activities. The managers can not influence these accruals. Therefore, in
consistency with the expectation of this report, as XBRL could discourage managers in
engaging earnings management, the discretionary accruals would be more interesting to
measure than the total accruals and non-discretionary accruals.
The main issue is that discretionary accruals cannot be measured directly. However,
researchers have managed to decompose total accruals into discretionary and non-
discretionary accruals by the use of models. Most of these models require at least of one
parameter to measure the total accruals (Dechow, Sloan and Sweeney, 1995). The following
paragraph will discuss the different models.
4.5 Earnings management models
Accruals can be measured by many models. Dechow, Sloan and Sweeney (1995) consider
five models of estimating accruals that detect earnings management. These models are
generally used in most in the earnings management literature. The five models that will be

29
reviewed in succession are: (1) The Healy Model, (2) The DeAngelo model, (3) The Jones
Model, (4) The Modified Jones Model and (5) The Industry Model.
The Healy Model
Healy (1985) has measured the total accruals by using the total assets scaled by lagged total
assets. He has predicted that in every period systematic earnings management are applied
by managers. The sample used is divided in three groups where the first group manages the
earnings upwards while the other two groups manage the earnings downwards. By a pair
wise comparison between the total mean of accruals of one group with upwards earnings
management with each of the downwards earnings management group inferences can be
made. The mean total accruals represent the discretionary accruals (Dechow, Sloan and
Sweeney, 1995). The Healy Model that estimates the non-discretionary accruals is as
follows:
Where
NDA = estimated non-discretionary accruals;
TA = total accruals scaled by total assets at τ-1;
T = 1, 2,...T is a year subscript for years included in the estimation period; and
τ = a year subscript indicating a year in the event period.
The DeAngelo Model
Like the Healy Model, the DeAngelo model also assumes that non-discretionary accruals are
constant over time and the discretionary accruals are calculated from the total accruals
scaled by lagged total assets. The only difference is that DeAngelo (1986) only uses one prior
period to estimate the total accruals. Therefore, the model of DeAngelo (1986) is as follows:
Where
NDA = estimated non-discretionary accruals;
TA = total accruals scaled by total assets at τ-1;
τ = a year subscript indicating a year in the event period.
Both models assume that discretionary accruals are constant in every period, but when it
changes from period to period the models will estimate erroneous non-discretionary
accruals. In conclusion, the Healy Model is more appropriate when non-discretionary
accruals follows a white noise process around a constant mean and when it follows a
random walk the DeAngelo model is more appropriate (Dechow, Sloan and Sweeney, 1995).
30
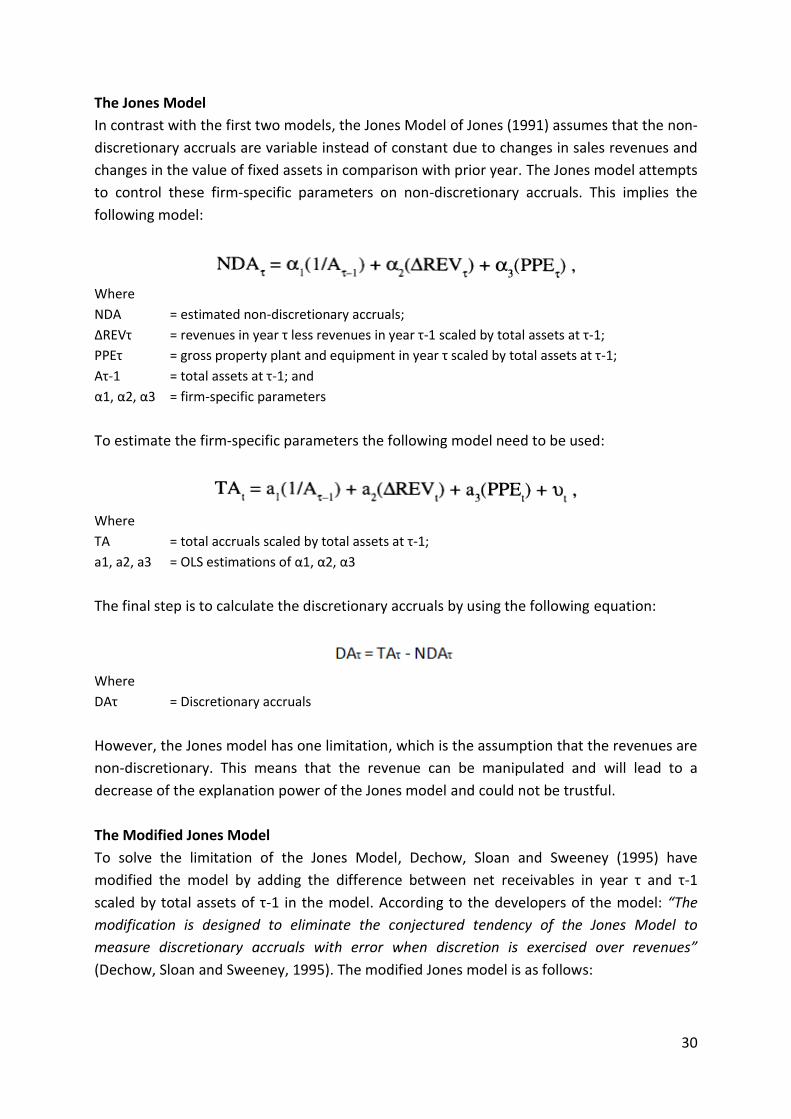
The Jones Model
In contrast with the first two models, the Jones Model of Jones (1991) assumes that the non-
discretionary accruals are variable instead of constant due to changes in sales revenues and
changes in the value of fixed assets in comparison with prior year. The Jones model attempts
to control these firm-specific parameters on non-discretionary accruals. This implies the
following model:
Where
NDA = estimated non-discretionary accruals;
ΔREVτ = revenues in year τ less revenues in year τ-1 scaled by total assets at τ-1;
PPEτ = gross property plant and equipment in year τ scaled by total assets at τ-1;
Aτ-1 = total assets at τ-1; and
α1, α2, α3 = firm-specific parameters
To estimate the firm-specific parameters the following model need to be used:
Where
TA = total accruals scaled by total assets at τ-1;
a1, a2, a3 = OLS estimations of α1, α2, α3
The final step is to calculate the discretionary accruals by using the following equation:
Where
DAτ = Discretionary accruals
However, the Jones model has one limitation, which is the assumption that the revenues are
non-discretionary. This means that the revenue can be manipulated and will lead to a
decrease of the explanation power of the Jones model and could not be trustful.
The Modified Jones Model
To solve the limitation of the Jones Model, Dechow, Sloan and Sweeney (1995) have
modified the model by adding the difference between net receivables in year τ and τ-1
scaled by total assets of τ-1 in the model. According to the developers of the model: “The
modification is designed to eliminate the conjectured tendency of the Jones Model to
measure discretionary accruals with error when discretion is exercised over revenues”
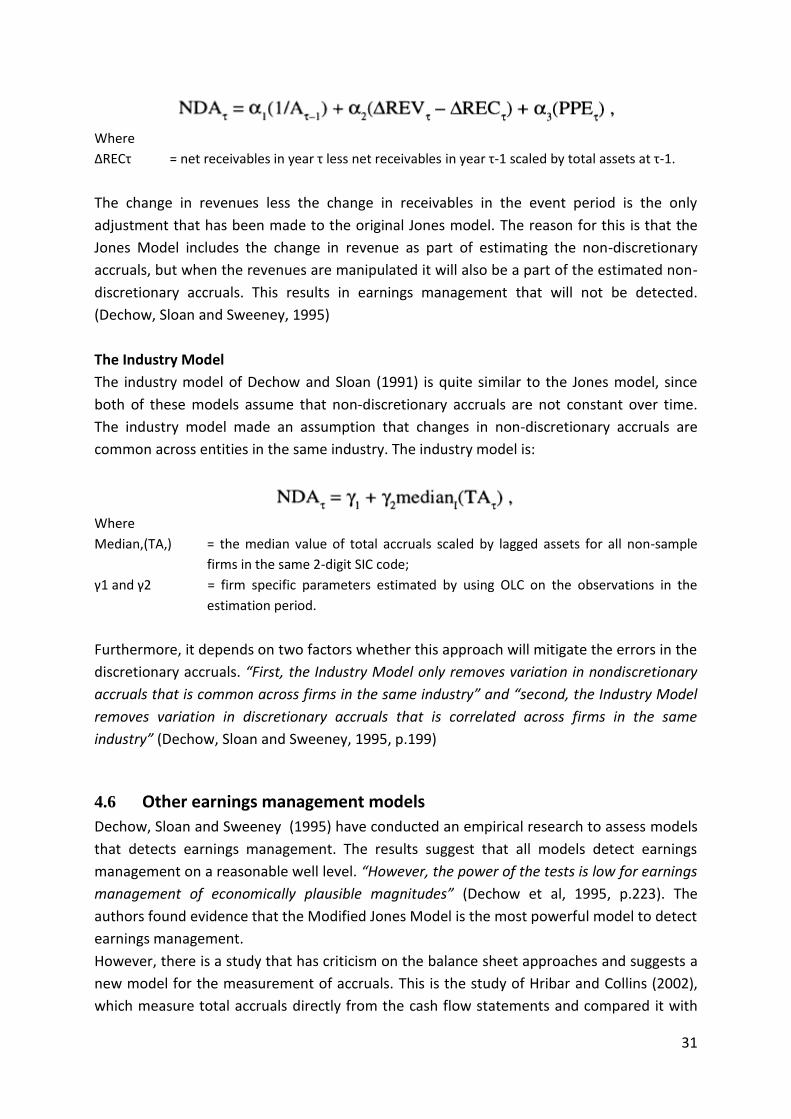
(Dechow, Sloan and Sweeney, 1995). The modified Jones model is as follows:
31
Where
ΔRECτ = net receivables in year τ less net receivables in year τ-1 scaled by total assets at τ-1.
The change in revenues less the change in receivables in the event period is the only
adjustment that has been made to the original Jones model. The reason for this is that the
Jones Model includes the change in revenue as part of estimating the non-discretionary
accruals, but when the revenues are manipulated it will also be a part of the estimated non-
discretionary accruals. This results in earnings management that will not be detected.
(Dechow, Sloan and Sweeney, 1995)
The Industry Model
The industry model of Dechow and Sloan (1991) is quite similar to the Jones model, since
both of these models assume that non-discretionary accruals are not constant over time.
The industry model made an assumption that changes in non-discretionary accruals are
common across entities in the same industry. The industry model is:
Where
Median,(TA,) = the median value of total accruals scaled by lagged assets for all non-sample
firms in the same 2-digit SIC code;
γ1 and γ2 = firm specific parameters estimated by using OLC on the observations in the
estimation period.
Furthermore, it depends on two factors whether this approach will mitigate the errors in the
discretionary accruals. “First, the Industry Model only removes variation in nondiscretionary
accruals that is common across firms in the same industry” and “second, the Industry Model
removes variation in discretionary accruals that is correlated across firms in the same
industry” (Dechow, Sloan and Sweeney, 1995, p.199)
4.6 Other earnings management models
Dechow, Sloan and Sweeney (1995) have conducted an empirical research to assess models
that detects earnings management. The results suggest that all models detect earnings
management on a reasonable well level. “However, the power of the tests is low for earnings
management of economically plausible magnitudes” (Dechow et al, 1995, p.223). The
authors found evidence that the Modified Jones Model is the most powerful model to detect
earnings management.
However, there is a study that has criticism on the balance sheet approaches and suggests a
new model for the measurement of accruals. This is the study of Hribar and Collins (2002),
which measure total accruals directly from the cash flow statements and compared it with

32
the balance sheet approach. They argue that the balance sheet approach to estimate
accruals contains significant errors. Especially, when the accruals is correlated with the
presence of acquisitions, mergers or discontinued operations the researchers tend to
conclude that there is earnings management while there is none (Hribar and Collins, 2002).
However, most researchers of the studies after the findings of Hribar and Collins (2002)
prefer the balance sheet approach and in particular the Modified Jones Model. For instance,
Dechow, Richardson and Tuna (2003) modified the Modified Jones Model for their study by
adding variables to increase the explanatory power of this model. Another study of Chen, Lin
and Zhou (2005), also used the Modified Jones Model to measure the magnitude of earnings
management to find a relationship with audit quality which they measure with audit firm
size and industry specialization. According to the authors, the reason why they have chosen
for the Modified Jones Model is that they believe that this model is the most powerful
model for detecting earnings management. A more recent study of Cohen, Dey and Lys
(2008), used the Modified Jones model to investigate the influence of SOX (Sarbanes-Oxley
Act 2002) on real- and accrual based earnings management and found out that the accruals
based earnings management increases from 1987 till the introduction of the Sarbanes-Oxley
Act (SOX) in 2002. After SOX the earnings management based on accruals decline, which
suggest that firms switch from an accrual based earnings management to the real earnings
management method (Cohen et al., 2008). Lastly, Rusmin (2010) investigated like Chen, Lin
and Zhou (2005) the association between audit quality and earnings management. For the
measurement of earnings management the author used the Modified Jones model, which is
in their literature review the best measurement for detecting earnings management.
4.7 XBRL and accruals
Since there are not much empirical researches in the field of XBRL and earnings
management, the study by Peng, Shon and Tan (2011) will be more extensively reviewed
than other papers. Peng et al. (2011) have examined the influence of XBRL adoption on the
firms that are listed on the Shenzhen Stock Exchange (SZSE) and Shanghai Stock Exchange
(SSE). The focus is laid on whether the amount of total accruals will significantly differ
between the pre-XBRL period and post-XBRL period. Their incentive to conduct such a study
is that prior studies showed that XBRL filers have better corporate governance implemented
in their company (Premuroso and Bhattacharya, 2008) and that XBRL increases the
transparency of business information (Pinsker and Li, 2008). The authors believe that “XBRL
enables investors to perform analyses in a more efficient, timely manner, thereby allowing
them to focus more on analyses of the data rather than data compilation or gathering” and
“therefore, with greater accessibility to XBRL formatted information, financial statement
users should be better able to detect earnings management” (Peng et al., 2011). With this
kept in mind the authors have formulated the following hypothesis: “Total accruals are
lower (higher) in the post-XBRL (pre-XBRL) period” (Peng et al., 2011).
33
The sample has been retrieved from the China Stock Market and Accounting Research
(CSMAR) and the daily databases from the year 2001 to 2006. It consists of 7655 firm years
observations from companies that are listed on the SSE and SZSE. Around 498 firm years
observations are removed from the sample due to missing values, which are needed to
estimate the accruals. This results in a final sample of 7157 firm year observations from 1371
companies, which 829 firms came from the SSE and 542 firms from the SZSE.
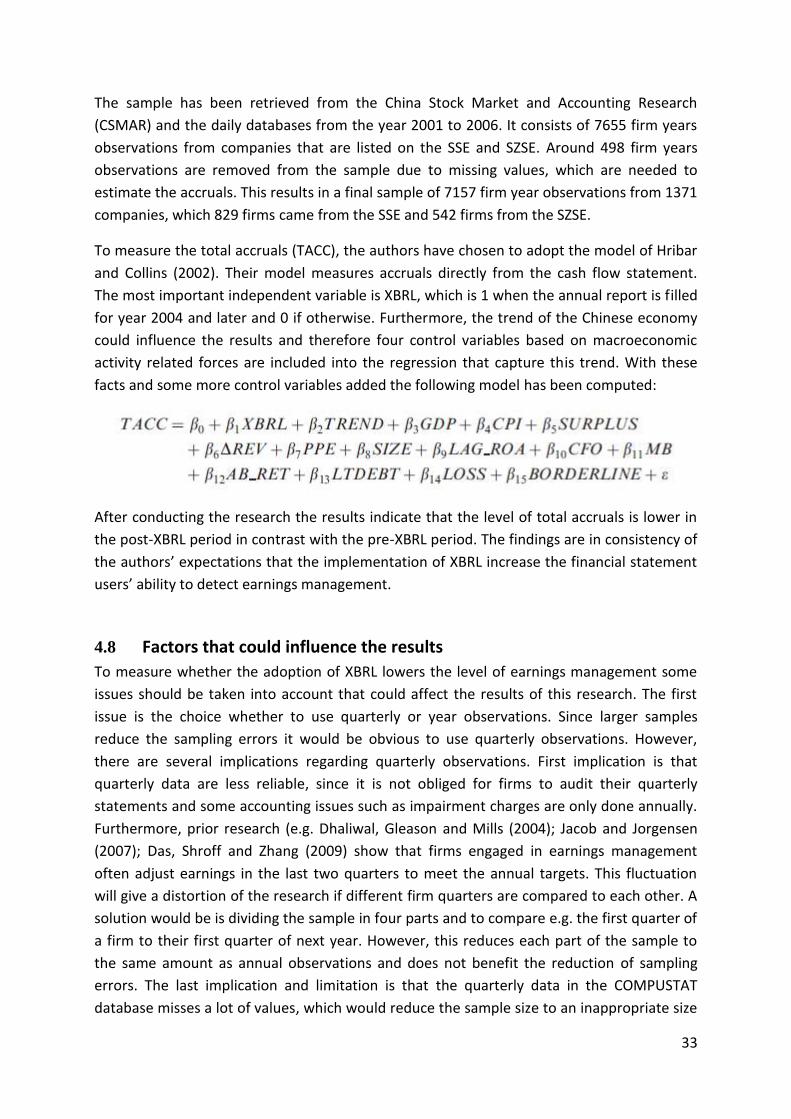
To measure the total accruals (TACC), the authors have chosen to adopt the model of Hribar
and Collins (2002). Their model measures accruals directly from the cash flow statement.
The most important independent variable is XBRL, which is 1 when the annual report is filled
for year 2004 and later and 0 if otherwise. Furthermore, the trend of the Chinese economy
could influence the results and therefore four control variables based on macroeconomic
activity related forces are included into the regression that capture this trend. With these
facts and some more control variables added the following model has been computed:
After conducting the research the results indicate that the level of total accruals is lower in
the post-XBRL period in contrast with the pre-XBRL period. The findings are in consistency of
the authors’ expectations that the implementation of XBRL increase the financial statement
users’ ability to detect earnings management.
4.8 Factors that could influence the results
To measure whether the adoption of XBRL lowers the level of earnings management some
issues should be taken into account that could affect the results of this research. The first
issue is the choice whether to use quarterly or year observations. Since larger samples
reduce the sampling errors it would be obvious to use quarterly observations. However,
there are several implications regarding quarterly observations. First implication is that
quarterly data are less reliable, since it is not obliged for firms to audit their quarterly
statements and some accounting issues such as impairment charges are only done annually.
Furthermore, prior research (e.g. Dhaliwal, Gleason and Mills (2004); Jacob and Jorgensen
(2007); Das, Shroff and Zhang (2009) show that firms engaged in earnings management
often adjust earnings in the last two quarters to meet the annual targets. This fluctuation
will give a distortion of the research if different firm quarters are compared to each other. A
solution would be is dividing the sample in four parts and to compare e.g. the first quarter of
a firm to their first quarter of next year. However, this reduces each part of the sample to
the same amount as annual observations and does not benefit the reduction of sampling
errors. The last implication and limitation is that the quarterly data in the COMPUSTAT
database misses a lot of values, which would reduce the sample size to an inappropriate size

34
because when a firm misses too much values the whole firm has to be removed from the
sample.
Another expected factor that could influence the results is the financial crisis. Filip and
Raffournier (2011) have examined the financial crisis 2008-2009 impact on earnings
management. They found that earnings management has decreased significantly due to the
financial crisis. Therefore, this factor should be considered to be added in the research
model to control for financial crisis. There are two ways to capture and control for financial
crisis. The first method is to use a control group that did not adopt XBRL during the period
2006-2011 to measure the impact of the financial crisis on earnings management. These
results should then be compared to another sample that contains the S&P500 firms that
have adopted XBRL in 2009. By reconciling the results from both samples, the influence of
XBRL on earnings management can be derived without any influences from the financial
crisis. However, this approach has many implications and the results would not be reliable.
The firms within the control group should be randomly picked to avoid systematic
differences. Regarding the measuring of XBRL the only possibility are the foreign private
filers that are obliged to file in XBRL in 2012. However, these firms are not randomly picked
and do not come from the same population as the initial sample. This will lead to a biased
and incomparable control group. Another issue that leads to a bias result are the firm
characteristic differences between the two samples. Bergstresser and Philippon, 2006;
Zhang, 2007; Peng, Shon and Tang, 2011 found significant evidence that size, leverage,
market-to-book ratio have an association with earnings management. The other method is
adding control variables to the regression to control for financial crisis and other
independent variables that could have a significant influence on the dependent variable. This
is a common approach for empirical studies. Prior literature shows that Gross Domestic
Product (GDP) has a positive association with the financial crisis (Filip and Raffournier, 2011).
Cohen, Dey and Lys (2008) found out that GDP has a negative impact on positive
discretionary accruals and a positive impact on negative discretionary accruals. Moreover,
Peng, Shon and Tan (2011) used GDP and Consumer Price Index (CPI) as the control variables
to capture the general economy. They found out that GDP has a significant influence, while
CPI does not have any significant influence on earnings management. Based on prior
research GDP and CPI will be considered as the control variables for the financial crisis.
4.9 Summary
Peng, Shon and Tang (2011) used an approach that measures the total accruals directly from
the cash flow statement. In this research, the discretionary accruals need to be measured,
since discretionary accruals are accruals that are not caused by normal operations and can
be manipulated by the managers. Using total accruals, which also includes the non-
discretionary accruals is in contradiction with their motivation that XBRL incentivize
managers engaging in earnings management. Non-discretionary accruals cannot be affected
by the managers and should be separated or excluded from the research. So therefore the

35
Modified Jones Model has been adopted to measure the amount of discretionary accruals
for this research. The first reason to use the Modified Jones Model in this research is that
Dechow, Sloan and Sweeney (1995) found evidence that the Modified Jones Model is the
most powerful model to estimate discretionary accruals. Secondly, recent studies are still
using this model for the detection of earnings management. Although this model provides
the highest explanation power there are several implications to bear in mind. To provide a
reasonable chance of detecting earnings management it requires a sample size of several
hundred firms. Furthermore, the users of the Modified Jones Model should consider the
type of sample to prevent them using the wrong model that extracts discretionary accruals
unintentionally (Dechow, Sloan and Sweeney, 1995). While the research model of Peng,
Shon and Tang (2011) will not be adopted, but some of their control variables such as GDP
and SIZE are of value for this research. At last, a factor that is likely to influence the results
should be taken into account, which is the financial crisis. The whole selection of control
variables will be elaborated in chapter 6 “research design”.
36
5 HYPOTHESES
5.1 Introduction
In this section the following sub question will be answered: “What are the expectations and
hypotheses of XBRL on accruals?”. The chapter is divided in two paragraphs. The first
paragraph elaborates the expectations whether the mandatory adoption of XBRL has an
influence on accruals. Subsequently, the second paragraph formulates the hypotheses that
will be tested through statistical analysis.
Until now the concept of XBRL and the prior literature regarding XBRL and earnings
management are discussed. The literature review shows that there is not much empirical
research conducted in the area of XBRL. Therefore, this research will add to the existing
literature by finding empirical evidence to answer the research question:
“Does the mandatory adoption of XBRL decrease the level of discretionary accruals of the
S&P500 US listed firms?”
5.2 Expectations
Regarding the prior literature, particularly the study of Peng, Shon and Tan (2011), some
expectations can be made. Their results show that the level of total accruals is lower after
the implementation of XBRL. However, they conducted their study in China, which is a
country that has a relatively more structured reporting environment than the US. Moreover,
the culture, political differences and many other factors are different compared to the US.
Therefore, their findings cannot be generalized and there is chance that XBRL does not have
a significant influence on earnings management in the US.
However, regarding the literature review, some studies such as the study by Pinsker and Li
(2008) or the study of Kim, Lim and No (2012), found empirical evidence that confirms some
of the XBRL benefits. They both found out that XBRL increases the transparency of the
reported financial information. Another research mentioned in the literature review is the
study by Dunne, Helliar, Lymar and Mousa (2009) from the Association of Chartered
Certified Accountants (ACCA). Their results also confirm the benefits of XBRL. In addition,
XBRL reduces the cost of information acquisition and the time for preparing the information
for analysis. This will lead to a more efficient analysis by the financial statement users (Peng
et al., 2011). Based on the literature review and the assumption that the XBRL adoption
could incentivize companies to improve their financial reported information, the expectation
is that the mandatory adoption of XBRL significantly decreases the level of total and
discretionary accruals of the S&P500 US listed firms. The amount of non-discretionary
accruals however, is expected to not be affected by the mandatory XBRL adoption, since
managers cannot influence this amount of accruals. In order to find empirical evidence to
confirm the described expectations, the next paragraph gives the hypotheses of this study.
37
5.3 Hypotheses
The first two steps to calculate the discretional accruals is to estimate the non-discretionary-
and total accruals. The last step is deducting the non-discretionary accruals from the total
accruals to compute the number of discretionary accruals. Without these steps it is not
possible to calculate the discretionary accruals using the Modified Jones Model. Therefore,
all the accruals will be taken into account within the development of the hypotheses. Thus,
based on the prior literature and expectations the following hypotheses can be formulated:
H1: The number of total accruals is significant lower in the post-XBRL period than in the pre-
XBRL period.
H2: The number of non-discretionary accruals is the same in the post-XBRL period as in the
pre-XBRL period.
H3: The number of discretionary accruals is significant lower in the post-XBRL period than in
the pre-XBRL period.
5.4 Summary
It is expected that the mandatory adoption of XBRL significantly decreases the level of total
and discretionary accruals. On the other hand it is expected that the adoption would not
affect the non-discretionary accruals. Based on these expectations three hypotheses are
formulated, which will be tested in this study to find significant evidence.

38
6 RESEARCH DESIGN
6.1 Introduction
In this chapter the following sub question will be answered: “How can the mandatory
adoption of XBRL on accruals be measured?”. The first paragraph concerns the research
method. The next paragraph elaborates the sample section followed by an explanation of
the used research model. Subsequently, an explanation of the statistical analyses will be
given. Lastly, several limitations concerning this research design will be mentioned that
should be taken into account during the research.
6.2 Research method
As mentioned in the introduction, the research approach will be based on the Positive
Accounting Theory (PAT), since the purpose of this study seeks to explain and predict a
particular phenomenon. Therefore, for this study the empirical research will be adopted for
the measuring of earnings management during the research period. Empirical research uses
quantitative data and is the most common method for prior accounting literature. It is based
on observations and can be analyzed qualitatively or quantitatively. It begins with
formulating a research question, which will be answered through quantitative evidence that
is collected from the database. Usually, the researcher has some expectations that he
wanted to investigate, which he formulates into one or more hypotheses. Depending on the
outcome of the study, the hypotheses can be supported or not. Regarding the research
question and hypotheses described in the previous chapter the empirical research is the
most appropriate method for this study.
6.3 Sample selection
In 2008 SEC adopted a rule that mandates domestic and foreign large accelerated companies
using US GAAP with a public float above $5 Billion as of the end of the second fiscal quarter
of their most recently completed fiscal year (SEC, 2008). These companies are obliged to file
their quarterly report or annual report containing financial statements in XBRL for a fiscal
period ending on or after June 15, 2009 (SEC, 2008). The S&P500 public listed firms satisfy to
this requirement and are obliged to file in XBRL. Therefore, the sample will be based on the
S&P500 public listed firms from the year 2006 to 2011 with 2009 as the first year of XBRL
implementation. The data is obtained from the COMPUTAT NORTH AMERICA database,
which has been accessed through the Wharton Research Data Service (WRDS). The initial
sample contains of 670 firms and not 500 firms, since each year firms have entered or left
the S&P500 index. To follow only the mandatory XBRL adopters and observe each related
firm it is required that these firms stay the whole sample period in the index and therefore
317 firms have been deleted from the sample. An additional 27 firms that includes
early/voluntary XBRL adopters have also been deleted and due to missing values another 38

39
firms have been removed. This results in a final sample of 288 firms with 1728 firm-year
observations, which includes mandatory filers who are in the S&P500 during the period
2006-2011. Table 5.1 shows the composition of the sample.
Table 5.1 Sample composition S&P500
2006-2011
Total unique firms
2006 2007 2008 2009 2010 2011
Year observations
Starting sample 670
532 538 535 529 516 520
3170
Deleted due: - In/out index during
sample period 317
179 185 182 176 163 167
1052 - Voluntary/early adopters 27
27 27 27 27 27 27
162
- Missing values 38
38 38 38 38 38 38
228
Final sample 288
288 288 288 288 288 288
1728
In addition, a list of the firms in the final sample and a list of the voluntary adopters are
included in appendix A and B.
6.4 Research model
The accruals will be measured by the Modified Jones model proposed by Dechow, Sloan and
Sweeney (1995). The model consists of three steps, which must be followed in order to
calculate the discretionary accruals. First step is to calculate the total accruals (TA) and
estimate the coefficients with the following regression model:
TAt-j = a1 (1/At-1) + a2. ΔREVt-j + a3. PPEt-j + et-j
Where:
TA = total accruals scaled by total assets at τ-1
∆REV = revenues in year τ less revenues in year τ-1 scaled by total assets at τ-1
At-1 = total assets lagged t-1
PPE = gross property plant and equipment scaled by total assets at τ-1
The purpose of the change in revenue (ΔREV) is to capture the working capital, like Δ
Inventory, Δ Debtors and Δ Creditors. The other driver PPE is the level of gross property
plant and equipment, which captures the long term accruals such as depreciation. The
estimated coefficients are then used in the next model to calculate the non-discretionary
accruals (NDA):

40
NDAt = α1 (1/At-1) + α2. (ΔREVt - ΔRECt) + α3. PPEt
Where:
NDA = non-discretionary accruals
∆REV = revenues in year τ less revenues in year τ-1 scaled by total assets at τ-1
At-1 = total assets lagged t-1
∆REC = net receivables in year τ less net receivables in year τ-1 scaled by total assets at τ-1
PPE = gross property plant and equipment scaled by total assets at τ-1
The change in net receivable is included to correct the change in revenues to improve the
detection of earnings management. Now that the TA and NDA are known, the DA can be
simply calculated by subtracting the NDA from the TA:
DAt = TAt – NDAt
Where:
DA = discretionary accruals
TA = total accruals scaled by total assets at τ-1
NDA = non-discretionary accruals
TA, NDA and DA are the dependent variables of the research model, while XBRL is the main
independent variable to measure whether the firm have implemented XBRL or not. To
examine the relationship between XBRL and earnings management the following research
model which is based on the literature review has been prepared:
TA, NDA or DA = β0 + β1XBRL + β2TREND + β3GDP + β4CPI + β5SIZE + β6LEV + β7MB +
β8LOSS + e
Where:
TA = total accruals scaled by total assets at τ-1
NDA = non-discretionary accruals
DA = discretionary accruals
XBRL = 1 if the annual report is filed in XBRL for years 2009 or later, 0 when otherwise;
TREND = year minus 2005;
GDP = natural log of annual gross domestic product;
CPI = annual consumer price index;
SIZE = natural log of the total assets;
LEV = total long-term debt divided by total assets
MB = total market value divided by total book value
LOSS = 1 if the net income of prior year is negative, 0 when otherwise
Since it is expected that the mandatory XBRL adoption has a negatively impact on the level
of accruals and discretionary accruals, the coefficient for XBRL is also expected to be

41
negative. To control for time and macroeconomics trends, such as the financial crisis that
could influence the level of accruals, three control variables are added to the regression
model. Following Cohen, Dey and Lys (2008) a time TREND variable is added, which denotes
the difference between the year and 2005. The purpose of this variable is to mitigate the
possibility that the XBRL variable is proxying for time instead of the XBRL implementation
(Peng, Shon and Tan, 2011). The other two variables capture the economy of the US: (1) GDP
is the natural log of annual gross domestic product and (2) CPI is the annual consumer price
index (Peng, et al., 2011). SIZE is included as a control variable, since prior literature (Peng,
Shon and Tan, 2011) show that firm size and leverage (LEV) have a negative relationship with
accruals. Furthermore, market-to-book (MB) is included in the model, to capture the growth
opportunities, as higher investment could lead to more accruals (Zhang, 2007). Lastly, the
variable “losses” (LOSS) is included in the model since it also has a positive association with
accruals (Zhang, 2007).
6.4.1 Testing the variables
Before conducting the statistical analysis the variables need to be tested for distortions and
collinearity. First of all the variable LOSS has been removed from the research model since
the sample did not contain firms that had a loss during the sample period. This means that
LOSS is a constant variable and no effects can be derived from this variable. Secondly, there
may not be any collinearity between the variables since it will increase the standard errors.
In case of collinearity the confidence interval tend to be wider and t-values smaller. The
coefficients need to be larger in order to be significant and therefore harder to reject the
null hypothesis.
Table 5.2 Collinearity statistics
Variables Beta Sig. Tolerance VIF (Constant) ,266
XBRL -,185 ,008 ,128 7,836
Trend ,239 ,152 ,022 44,861
GDP -,025 ,441 ,579 1,727
CPI -,092 ,485 ,036 27,730
Size -,152 ,000 ,971 1,030
LEV -,216 ,000 ,973 1,027
MB ,068 ,008 ,965 1,037
a. Dependent Variable: DA
Table 5.2 shows the collinearity statistics of the independent variables on the dependent
variable discretionary accruals (DA). The variance inflation factor (VIF) measures the level of
collinearity of the independent variables in a regression model. To calculate the VIF, one is
divided with the tolerance and will always be equal or greater than 1. Since there are no
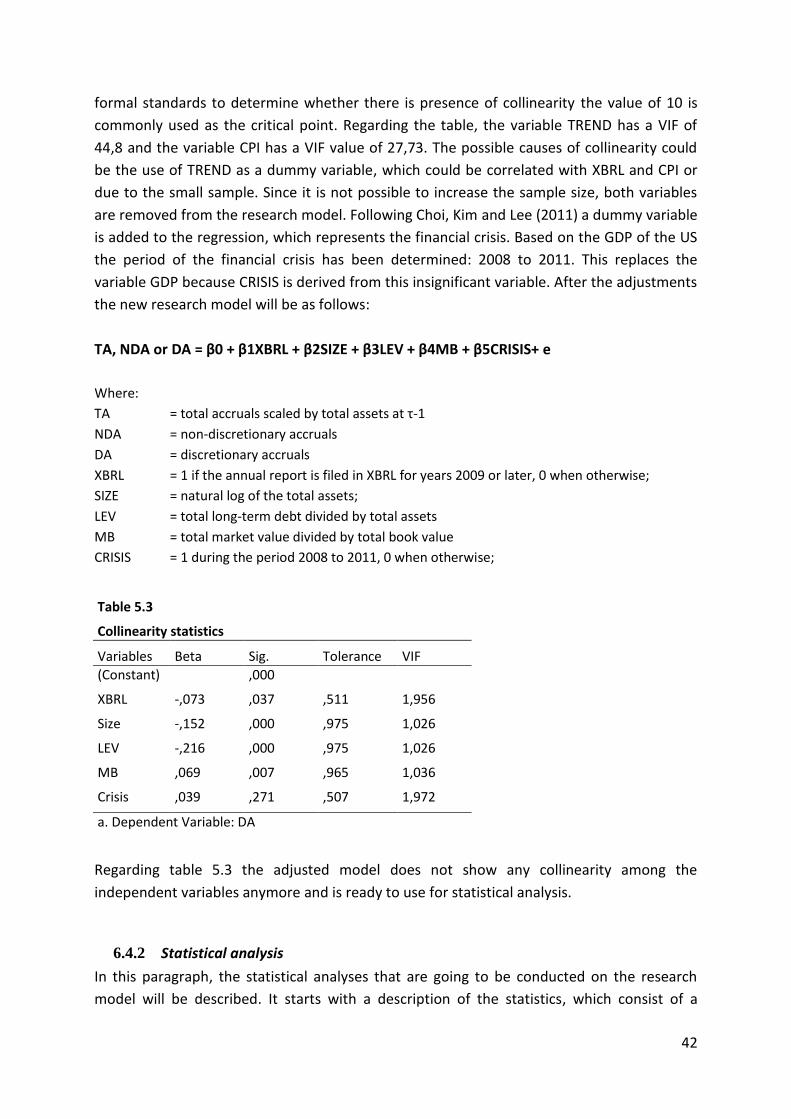
42
formal standards to determine whether there is presence of collinearity the value of 10 is
commonly used as the critical point. Regarding the table, the variable TREND has a VIF of
44,8 and the variable CPI has a VIF value of 27,73. The possible causes of collinearity could
be the use of TREND as a dummy variable, which could be correlated with XBRL and CPI or
due to the small sample. Since it is not possible to increase the sample size, both variables
are removed from the research model. Following Choi, Kim and Lee (2011) a dummy variable
is added to the regression, which represents the financial crisis. Based on the GDP of the US
the period of the financial crisis has been determined: 2008 to 2011. This replaces the
variable GDP because CRISIS is derived from this insignificant variable. After the adjustments
the new research model will be as follows:
TA, NDA or DA = β0 + β1XBRL + β2SIZE + β3LEV + β4MB + β5CRISIS+ e
Where:
TA = total accruals scaled by total assets at τ-1
NDA = non-discretionary accruals
DA = discretionary accruals
XBRL = 1 if the annual report is filed in XBRL for years 2009 or later, 0 when otherwise;
SIZE = natural log of the total assets;
LEV = total long-term debt divided by total assets
MB = total market value divided by total book value
CRISIS = 1 during the period 2008 to 2011, 0 when otherwise;
Table 5.3 Collinearity statistics
Variables Beta Sig. Tolerance VIF (Constant) ,000
XBRL -,073 ,037 ,511 1,956
Size -,152 ,000 ,975 1,026
LEV -,216 ,000 ,975 1,026
MB ,069 ,007 ,965 1,036
Crisis ,039 ,271 ,507 1,972
a. Dependent Variable: DA
Regarding table 5.3 the adjusted model does not show any collinearity among the
independent variables anymore and is ready to use for statistical analysis.
6.4.2 Statistical analysis
In this paragraph, the statistical analyses that are going to be conducted on the research
model will be described. It starts with a description of the statistics, which consist of a

43
sample composition, which describes the allocation of firm year observations and a table
that shows the mean, standard deviation of each variable. Next is the test of assumptions,
which is a test to find out whether the sample satisfies the requirements to use the
regression analyses. Therefore the Shapiro-Wilk test is used for normality distributed
population and the Pearson correlation to test whether two variables are correlated with
each other. When the sample passed through the tests of assumptions, an univariate data
analysis will be conducted to test whether each variable has a significant difference between
the pre-/post—XBRL period. Finally, the multivariate data analysis will be conducted, which
will test on basis of the multiple independent variables and a single dependent variable the
mutual relationship. These results show the explanatory power and the degree of influence
of the independent variables on the dependent variable, which is going to be used to answer
the hypotheses.
6.5 Limitations
Like in any other studies, there are some limitations that should be considered when
interpreting the results. First of all, the small sample size, which consists only of 1728 firm
years observations, could reduce the significance level of the findings and increases the
probability of the type I error where the H0 is rejected while it is true and the type II error
where the H0 is accepted while it is false. The second limitation is that the sample only
contains firms from the S&P500 index, which were the first group that had to file in XBRL.
The sample does not represent the whole population of the US and therefore it may be
limited in generalizing the findings to other firms outside the S&P500 index. Lastly, in this
study firm specific and macro economy variables are included in the regression to control for
their impact on earnings management. However, there could be other important factors
that were not taken into account, which could have a significant influence on the results.
6.6 Summary
The research approach will be based on the Positive Accounting Theory. The final sample
consists of 288 firms with 1728 firm-year observations, which include mandatory filers from
the S&P500 index during the period 2006-2011. With help of the Modified Jones Model the
amount of discretionary accruals, which serve as a proxy for earnings management, are
measured. The statistical analyses start with a description of the statistics followed by the
tests of assumptions. Subsequently, the univariate and multivariate analyses will be
conducted to test the significance of the dependent variables. Like many studies, this
research also have her limitations, which are the small sample size, the sample only contains
companies from the S&P500 index and there could be other important dependent factors
that were not taken into account.

44
7 RESEARCH RESULTS
7.1 Introduction
In this section the last sub question will be answered in order to answer the main research
question of this research. The last sub question is as follows: “What is the impact of XBRL on
earnings management?”. In the first paragraph presents the descriptive statistics of the
sample followed by the tests of assumptions. Subsequently, the Pearson correlation is
conducted to find the mutual relation between the independent variables and the
dependent variable. Then the results from the univariate- and multivariate analyses will be
given. Finally, the results from the conducted research will be analyzed to find an
explanation for the outcome.
7.2 Data testing
This paragraph provides the descriptive statistics followed by the outcome from the tests of
assumptions. Depending on the findings of these tests the variables could be adjusted to
comply with the assumptions. Meeting the requirements of the assumptions is necessary to
mitigate errors in the regression and avoid potential misleading results.
7.2.1 Descriptive statistics
Table 6.1 presents the descriptive statistics of the dependent and independent variables that
are going to be used during the research. The mean of total accruals (TA), non-discretionary
accruals (NDA) and discretionary accruals (DA) are respectively 0.919, 0.010 and 0.909. It is
clear that the TA can be distinguished in NDA and DA. The DA has been calculated by
reducing the TA with NDA. Despite the financial crisis, the sales revenues (∆REV) have
increased on average with 6.4 percent and the net receivables (∆REC) with 0.7 percent. The
average firms the gross property, plant and equipment is 54.8 percent, the long-term debt
(LEV) is 21.3 percent and the market-to-book ratio (MB) has a mean of 3.2. Furthermore, the
table shows that the mean of XBRL is 0.493, which means that there are more firm
observations in the pre-XBRL period. The reason for this is that XBRL adoption is based on
fiscal years and not on book years.

45
Table 6.1 Descriptive statistics (2006-2011)
Variable N Mean Std. Error Std. Dev Minimum Maximum TA 1702 0,919 0,020 0,823 -0,015 6,062 NDA 1664 0,010 0,003 0,108 -0,341 2,087 DA 1664 0,909 0,019 0,778 -0,170 5,802 PPE 1701 0,548 0,010 0,426 0,003 5,574 ∆REV 1702 0,064 0,005 0,222 -2,041 3,401 ∆REC 1665 0,007 0,001 0,035 -0,308 0,404 Size 1728 8,172 0,012 0,517 6,909 10,049 LEV 1647 0,213 0,003 0,129 0,001 1,395 MB 1627 3,201 0,105 4,250 -59,131 54,931 XBRL 1728 0,493 0,012 0,500 0,000 1,000 Crisis 1728 0,667 0,011 0,472 0,000 1,000
Where: TA = total accruals scaled by total assets at τ-1
NDA = non-discretionary accruals scaled by total assets at τ-1 DA = discretionary accruals scaled by total assets at τ-1 PPE = gross property plant and equipment scaled by total assets at τ-1
∆REV = revenues in year τ less revenues in year τ-1 scaled by total assets at τ-1 ∆REC = net receivables in year τ less net receivables in year τ-1 scaled by total assets at τ-1 Size = natural log of the total assets LEV = total long-term debt divided by total assets MB = total market value divided by total book value XBRL = 1 if the annual report is filed in XBRL for years 2009 or later, 0 when otherwise Crisis = 1 if during the crisis (2008-2011), 0 when otherwise (2006-2007)
7.2.2 Test of assumptions
In order to perform the regression analyses the residuals need to be tested whether it
complies with the three assumptions (De Vocht, 2002), which are: (1) normal distribution,
(2) homoscedasticity and (3) linearity. In consistency with De Vocht (2002) these tests are
applied on the sample:

46
Figure 6.2
Figure 6.2 shows a histogram, which is skewed to the left and has a long right tail. Also the
PP-plot shows a curved line and not a straight line. This suggests that the residuals are not
normal distributed. As for the scatterplot does not show a “horn” shape and is therefore
homoscedastic. However, a pattern can be detected since the residuals are not scattered,
but concentrated. This indicates a violation of the assumption for linearity.
Table 6.3 - Test results
Assumption Meet the assumption Yes/No
- Normal distribution No
- Homoscedasticity Yes
- Linearity No
Since the residuals do not meet the assumptions (table 6.3) it is not possible to perform a
regression analysis. However, there is a solution, which is called transformation. By using the

47
natural logarithm (LOG) of the variable discretionary accruals a regression still can be
conducted. After the transformation the graphs in figure 6.4 are computed.
Figure 6.4
Now the histogram shows an almost perfect symmetric figure and in the PP-plot a diagonal
line can be recognized. The assumption for homoscedasticity still holds and the residuals are
well-balanced scattered, which indicates linearity.
Table 6.5 - Test results
Assumption Meet the assumption Yes/No
- Normal distribution Yes
- Homoscedasticity Yes
- Linearity Yes
After the transformation the residuals complies with the assumptions (table 6.5), which
makes it possible to perform the regression analyses. The results from the analyses will be
described in the next paragraph.

48
7.3 Results
This section presents the final results of this research. It first starts with the Pearson
correlation test to find out whether variables are positive or negative related to each other.
Based on this test some expectations concerning the regression can be carefully made. After
this test a univariate analysis will be conducted to see the change of each variable between
the pre-XBRL period and post-XBRL period and to see whether the difference is significant or
not. Lastly, the multivariate analyses will be presented, which show the results from the
linear regressions of the dependent variables total, non-discretionary and discretionary
accruals. The main results will be discussed and compared to the expectations and the
prepared hypotheses will be answered.
7.3.1 Pearson correlations
Table 6.6 presents the findings from the Pearson correlation test to show the relationship
between each variable with another variable. The Pearson value can fall between -1 (perfect
negative correlation) and 1 (perfect positive correlation). It could also be 0, which means
that there is no correlation between the variables. Regarding the table it seems that total
accruals (TA) is positive correlated with non-discretionary accruals (NDA) (0.457; p=0.000)
and discretionary accruals (DA) (0.986; p=0.000), which suggest that TA, NDA and DA would
have the same results from the regression analyses. Another significant result from this test
is that XBRL is negatively correlated with TA (-0.084), NDA (-0.225) and DA (-0.068), which
indicates that accruals have been decreased in the post-XBRL period. Only TA and NDA are
significant and negative correlated with the variable Crisis. This suggests that TA and NDA
have been decreased in the crisis period except for DA. In consistent with the research of
Peng, Shon and Tan (2011), which suggest that total accruals are positive correlated with
change in sales revenue (∆REV) and negatively correlated with size. The only difference is
that the total accruals are positively related with gross property, plant and equipment (PPE).
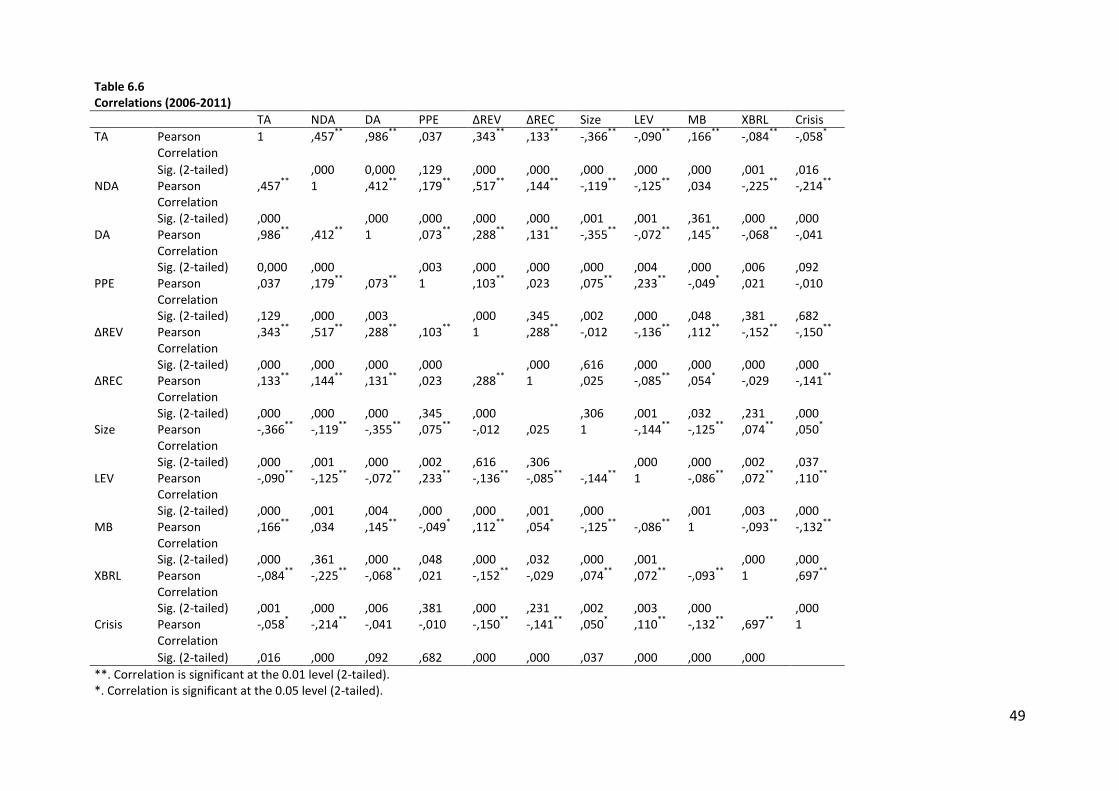
49
Table 6.6 Correlations (2006-2011)
TA NDA DA PPE ∆REV ∆REC Size LEV MB XBRL Crisis
TA Pearson Correlation
1 ,457**
,986**
,037 ,343**
,133**
-,366**
-,090**
,166**
-,084**
-,058*
Sig. (2-tailed) ,000 0,000 ,129 ,000 ,000 ,000 ,000 ,000 ,001 ,016 NDA Pearson
Correlation ,457
** 1 ,412
** ,179
** ,517
** ,144
** -,119
** -,125
** ,034 -,225
** -,214
**
Sig. (2-tailed) ,000 ,000 ,000 ,000 ,000 ,001 ,001 ,361 ,000 ,000 DA Pearson
Correlation ,986
** ,412
** 1 ,073
** ,288
** ,131
** -,355
** -,072
** ,145
** -,068
** -,041
Sig. (2-tailed) 0,000 ,000 ,003 ,000 ,000 ,000 ,004 ,000 ,006 ,092 PPE Pearson
Correlation ,037 ,179
** ,073
** 1 ,103
** ,023 ,075
** ,233
** -,049
* ,021 -,010
Sig. (2-tailed) ,129 ,000 ,003 ,000 ,345 ,002 ,000 ,048 ,381 ,682 ∆REV Pearson
Correlation ,343
** ,517
** ,288
** ,103
** 1 ,288
** -,012 -,136
** ,112
** -,152
** -,150
**
Sig. (2-tailed) ,000 ,000 ,000 ,000 ,000 ,616 ,000 ,000 ,000 ,000 ∆REC Pearson
Correlation ,133
** ,144
** ,131
** ,023 ,288
** 1 ,025 -,085
** ,054
* -,029 -,141
**
Sig. (2-tailed) ,000 ,000 ,000 ,345 ,000 ,306 ,001 ,032 ,231 ,000 Size Pearson
Correlation -,366
** -,119
** -,355
** ,075
** -,012 ,025 1 -,144
** -,125
** ,074
** ,050
*
Sig. (2-tailed) ,000 ,001 ,000 ,002 ,616 ,306 ,000 ,000 ,002 ,037 LEV Pearson
Correlation -,090
** -,125
** -,072
** ,233
** -,136
** -,085
** -,144
** 1 -,086
** ,072
** ,110
**
Sig. (2-tailed) ,000 ,001 ,004 ,000 ,000 ,001 ,000 ,001 ,003 ,000 MB Pearson
Correlation ,166
** ,034 ,145
** -,049
* ,112
** ,054
* -,125
** -,086
** 1 -,093
** -,132
**
Sig. (2-tailed) ,000 ,361 ,000 ,048 ,000 ,032 ,000 ,001 ,000 ,000 XBRL Pearson
Correlation -,084
** -,225
** -,068
** ,021 -,152
** -,029 ,074
** ,072
** -,093
** 1 ,697
**
Sig. (2-tailed) ,001 ,000 ,006 ,381 ,000 ,231 ,002 ,003 ,000 ,000 Crisis Pearson
Correlation -,058
* -,214
** -,041 -,010 -,150
** -,141
** ,050
* ,110
** -,132
** ,697
** 1
Sig. (2-tailed) ,016 ,000 ,092 ,682 ,000 ,000 ,037 ,000 ,000 ,000
**. Correlation is significant at the 0.01 level (2-tailed). *. Correlation is significant at the 0.05 level (2-tailed).

50
Where:
TA = natural log of total accruals scaled by total assets at τ-1 NDA = natural log of non-discretionary accruals scaled by total assets at τ-1
DA = natural log of discretionary accruals scaled by total assets at τ-1
PPE = gross property plant and equipment scaled by total assets at τ-1
∆REV = revenues in year τ less revenues in year τ-1 scaled by total assets at τ-1
∆REC = net receivables in year τ less net receivables in year τ-1 scaled by total assets at τ-1 Size = natural log of the total assets
LEV = total long-term debt divided by total assets
MB = total market value divided by total book value
XBRL = 1 if the annual report is filed in XBRL for years 2009 or later, 0 when otherwise Crisis = 1 if during the crisis (2008-2011), 0 when otherwise (2006-2007)

51
7.3.2 Univariate data analysis
Table 6.7 provides the difference of the variables before the XBRL adoption (2006-2008) and
after the XBRL-adoption (2009-2011). The mean of total accruals (TA) in the pre-period is
-0.363 and in the post-period -0.485, which has a difference of -0.123 and is statically
significant. The mean of non-discretionary accruals (NDA) in the pre- and post XBRL period is
respectively -3.190 and -4.001, which is like TA significant. The reason for the high mean is
that the NDA scaled by lagged total assets is small and by taking the natural log of it the
mean will be greater. As for the discretionary accruals (DA) the mean in the pre-period is
-0.354 and -0.445 in the post-period. With a difference of -0.091 the difference is only
statistical significant at a 0.05 level. In consistency with the research of Peng, Shon and Tan
(2011), the change in revenue (∆REV) and leverage (LEV) are significant higher in the post-
period and the market-to-book ratio (MB) is significantly lower in the post-period.
Table 6.7 Paired t-test
Means compared between pre- (2006-2008)/post (2009-2011)-XBRL period
Pair Variable N Pre Post Difference Sig. (2-tailed)
1 TA - TA2 826 -0,363 -0,485 -0,123 0,003 ** 2 NDA -NDA2 792 -3,190 -4,001 -0,811 0,000 ** 3 DA - DA2 792 -0,354 -0,445 -0,091 0,021 * 4 PPE - PPE2 825 0,546 0,558 0,012 0,576
5 ∆REV - ∆REV2 826 0,101 0,029 -0,071 0,000 ** 6 ∆REC - ∆REC2 793 0,009 0,006 -0,003 0,061
7 Size - Size2 852 8,135 8,211 0,075 0,003 ** 8 LEV -LEV2 775 0,204 0,223 0,019 0,004 ** 9 MB - MB2 753 3,598 2,832 -0,766 0,001 **
**. Statistical significance at the 0.01 level (2-tailed). *. Statistical significance at the 0.05 level (2-tailed).
Note:
First variable indicates the pre-XBRL period 2006-2008
Variable with number 2 behind indicates the post-XBRL period 2009-2011
Where:
TA = natural log of total accruals scaled by total assets at τ-1
NDA = natural log of non-discretionary accruals scaled by total assets at τ-1 DA = natural log of discretionary accruals scaled by total assets at τ-1 PPE = gross property plant and equipment scaled by total assets at τ-1 ∆REV = revenues in year τ less revenues in year τ-1 scaled by total assets at τ-1 ∆REC = net receivables in year τ less net receivables in year τ-1 scaled by total assets at τ-1 Size = natural log of the total assets
LEV = total long-term debt divided by total assets
MB = total market value divided by total book value

52
7.3.3 Multivariate data analysis
In this section the results from the linear regression will be described and discussed with the
help of expectations and formulated hypotheses in chapter 5. The results will be presented
in tables and every table consists again of three models. The first model only includes the
variable XBRL. Model 2 still keep the variable XBRL but also add the variable SIZE, Leverage
(LEV) and Market-to-book ratio (MB) to the regression. Model 3 is the same as model 2, but
includes the variable Crisis to the model to control whether the financial crisis has impact on
earnings management.
Total accruals
The assumption is that the mandatory XBRL adoption could incentive firms to improve their
financial report information and therefore it is expected that this adoption would
significantly decreases the level of total accruals. Based on this expectation a hypothesis is
formulated, which is earlier mentioned in this report. The hypothesis was as follows:
“H1: The number of total accruals is significant lower in the post-XBRL period than in the
pre-XBRL period.”
Table 6.8 Linear regressions of total accruals
Variable (1)
(2)
(3) XBRL -0,119 -0,076 -0,100
0,000 ** 0,002 ** 0,002 **
Size
-0,294
-0,294
0,000 ** 0,000 ** LEV
-0,206
-0,208
0,000 ** 0,000 ** MB
0,109
0,111
0,000 ** 0,000 ** Crisis
0,036
0,278 Intercept 0,000
0,000
0,000
0,000 ** 0,000 ** 0,000 ** Adjusted R2 0,013 0,153 0,153
**. Statistical significance at the 0.01 level. *. Statistical significance at the 0.05 level.
Table 6.8 presents the outcome from the linear regression. The outcome of model 1 shows
that XBRL has a negative and significant effect (-0.119; p=0.000) on total accruals, which is in
line with the hypothesis and therefore the hypothesis holds. However, the adjusted R2 is
only 0.013, which means that XBRL only explains 1,3% of the model. The explanatory power
increases when the controlled variables are added to the regression. In model 2 and 3 the
variable XBRL is still negative and statistical significant and the R2 increases from 1.3% to
15.5%, which suggests that the controlled variables have a higher impact on the total
accruals than XBRL. Thus, after the mandatory XBRL adoption the total accruals have

53
decreased with 10% of total assets, which is in consistent with the hypothesis. Beside the
variable XBRL, the control variables also show statistical significant relations with the
dependent variable. Size is found significantly negative associated (-0.294; p=0.000), which
indicates that bigger firms have more total accruals. The coefficient of leverage is also
significantly negative (-0.208; p=0.000) to total accruals, while MB is significantly positive
(0.111; p=0.000). On the other hand the variable CRISIS does not show any significant
association with total accruals.
Non-discretionary accruals
The amount of non-discretionary accruals are expected not to be affected by the mandatory
XBRL adoption, since non-discretionary are caused by normal operational firm activities and
cannot be influenced by managers. Therefore, the hypothesis was formulated as follows:
“H2: The number of non-discretionary accruals is the same in the post-XBRL period as in
the pre-XBRL period.”
Table 6.9 Linear regressions of non-discretionary accruals
Variable (1) (2) (3) XBRL -0,199 -0,197 -0,122
0,000 ** 0,000 ** 0,012 * Size
-0,078
-0,076
0,035 * 0,040 * LEV
-0,176
-0,171
0,000 ** 0,000 ** MB
-0,013
-0,017
0,720
0,651
Crisis
-0,117
0,016 * Intercept 0,000
0,000
0,000
0,000 ** 0,365
0,392
Adjusted R2 0,038 0,069 0,075
**. Statistical significance at the 0.01 level.
*. Statistical significance at the 0.05 level.
Table 6.9 provides the results from the linear regression on non-discretionary accruals. In
consistency with the results from the first regression the variable XBRL from model 1 is
significant and negative (-0.199; p=0.000). The adjusted R2 is higher and explains 3.8% of the
total accruals. By adding control variables in model 2 and model 3, the R2 increases a bit to
respectively 6.9% and 7.5%. This suggests that the explanatory power of this regression is
not strong compared to the explanatory power from the regression of Peng, Shon and Tan
(2011), which has a value around the 60%. Furthermore, XBRL is statically significant at the
0.05 level with the p-value of 0.012. While it is expected that XBRL does not significantly
affect the amount of non-discretionary, the findings proved the opposite, which is not in line

54
with the hypothesis and therefore the hypothesis is rejected. The coefficients of the control
variables SIZE and LEV are both significantly and negative (-0.076; p=0.040 and -0.171;
p=0.000). Unlike the regression on total accruals the MB is insignificant, which suggests that
it does not matter whether the market-to-book ratio of the firm is high or low, it does not
affect the non-discretionary accruals. Interesting enough is the significance of the variable
Crisis. It seems that Crisis has a significantly, negative (-0.117; p=0.016) impact on the
dependent variable.
Discretionary accruals
After the first two hypotheses it is expected that the mandatory XBRL adoption would
decrease the level of discretionary accruals, since total accruals is the sum of non-
discretionary- and discretionary accruals. Concerning the assumption that the XBRL adoption
could incentivize firms to improve financially their financial reported information by using
increasing discretionary accruals the following hypothesis was formulated:
“H3: The number of discretionary accruals is significant lower in the post-XBRL period than
in the pre-XBRL period.”
Table 6.10 Linear regressions of discretionary accruals
Variable (1) (2) (3) XBRL -,099 -,059 -,083
,000 ** ,015 * ,014 * Size
-,289
-,289
,000 ** ,000 **
LEV
-,187
-,189
,000 ** ,000 **
MB
,094
,096
,000 ** ,000 **
Crisis
,035
,307 Intercept 0,000
0,000
0,000
,000 ** ,000 ** ,000 **
Adjusted R2 ,009 ,134 ,134 **. Statistical significance at the 0.01 level.
*. Statistical significance at the 0.05 level.
Table 6.10 presents the regressions with discretionary accruals as the dependent variable.
Model 1 indicates that XBRL is significant and negative (-0.099; p=0.000), but the coefficient
has decreased with 0.1 compared to the other tables. This is in line with the hypothesis and
therefore the hypothesis holds. With the control variables added in the regression the p-
value model 2 (p=0.015) and 3 (p=0.014) increases but the coefficients (respectively -0.059
and -0.083) are still negative significant at the 0.05 level. The pattern of the R2 looks similar
to the R2 of the regression of the total accruals. In model 1 the adjusted R2 is valued at

55
0.009, but increases to 0.134 in model 2 and 3. However, an explanatory power of 13,4% is
still low and there should be other variables that explain the dependent variables much
better. Despite the low R2 and relative low negative coefficients the outcome shows
evidence that the number of discretionary accruals is significant lower in the post-XBRL
period than in the pre-XBRL period.
The control variables SIZE and LEV are significant and negative (-0.289; p=0.000 and -0.189;
p=0.000) like the regression on total accruals, which suggests that smaller firms and firms
with lower leverage have less discretionary accruals. The coefficient of the market-to-book
ratio is significant and positive (0.096; p=0.000), while the coefficient of Crisis is insignificant
(p=0.307). This suggests that the financial crisis does not affect the number of discretionary
accruals.
7.4 Analysis
Now the results are known, the outcome is not entirely as expected. This section provides
possible explanations for this outcome through an analysis. First of all a short overview
(table 6.11) of the outcome of the hypotheses is given to see whether they held or were
rejected:
Table 6.11
Hypothesis: Holds/Rejected
“H1: The number of total accruals is significant lower in the
post-XBRL period than in the pre-XBRL period.”
Holds
“H2: The number of non-discretionary accruals is the same in
the post-XBRL period as in the pre-XBRL period.”
Rejected
“H3: The number of discretionary accruals is significant lower
in the post-XBRL period than in the pre-XBRL period.”
Holds
The tests that are conducted showed significant evidence that supports the first and third
hypothesis. The findings suggest that the mandatory adoption of XBRL has a significant and
negative impact on the number of total and discretionary accruals. This outcome is in line
with the expectations and reviewed literature in chapter 5. However, the second hypothesis
is rejected. According to the results the number of non-discretionary accruals is also
significantly decreased in the post-XBRL period. The explanation for this outcome could be
the financial crisis. Kaplan (1985) explains that there is a possibility that the level of non-
discretionary accruals could change due to an abnormal economic environment. Consistent
with this explanation the results indicate that the variable CRISIS has a significant negative
impact on non-discretionary accruals. But strangely enough in contradiction to the
expectations, the financial crisis does not affect the number of total and discretionary
accruals. The possible explanation for this appearance can be explained by the findings of
Chia, Lapsley and Lee (2007). They found out that in the period of crisis investors are

56
expecting lower earnings, which incentivize managers not in decreasing the number of
discretionary accruals, but engage in income decreasing earnings management to boost
their earnings after the crisis. Another interesting outcome from the results is the
explanatory power (R2). For all the three models the R2 is low, which means that the
variables only have a small share in the decrease of accruals. A possible explanation for this
is that companies are using the bolt-on approach to comply with the SEC mandatory XBRL
adoption rule. Furthermore, a financial statement in XBRL format is less reliable and could
contain errors, which are caused during the conversion process. So investors cannot benefit
from the entire potential of XBRL. Finally, the results from the control variables for size
(SIZE), leverage (LEV) and market-to-book ratio (MB) are consistent to prior literature as
described in the literature review. SIZE and LEV are significantly negative related while MB
significantly positive is related with accruals.
7.5 Summary
This chapter started with a descriptive statistics of the sample followed by the tests of
assumptions. The outcome of these tests suggests that the residuals are not normal
distributed and not linear, which leads to a violation of the assumptions. However, after
adding a natural logarithm to the sample, the data passed the tests of assumptions and a
regression analysis can be performed.
Regarding the Pearson correlation test the total accruals (TA) is positive correlated with non-
discretionary accruals (NDA) (0.457; p=0.000) and discretionary accruals (DA) (0.986;
p=0.000), which suggest that TA, NDA and DA would have the same results from the
regression analyses. Another significant result from this test is that XBRL is negatively
correlated with TA (-0.084), NDA (-0.225) and DA (-0.068), which indicates that accruals have
been decreased in the post-XBRL period. Only TA and NDA are significant and negative
correlated with the variable Crisis. This suggests that TA and NDA have been decreased in
the crisis period except for DA. The univariate analyses show that the mean of total accruals
(TA) in the pre-period is -0.363 and in the post-period -0.485, which has a difference of -
0.123 and is statically significant. The mean of non-discretionary accruals (NDA) in the pre-
and post XBRL period is respectively -3.190 and -4.001, which is like the TA significant. As for
the discretionary accruals (DA) the mean in the pre-period is -0.354 and -0.445 in the post-
period. With a difference of -0.091 the difference is only statistical significant at a 0.05 level.
Finally, multivariate analyses show that XBRL has a negative and significant effect (-0.100;
p=0.002) on total accruals, a negative and significant effect (-0.122; p=0.012) on non-
discretionary accruals and a negative and significant effect (-0.083; p=0.014) on discretionary
accruals. This means that the first and third hypotheses holds and the mandatory adoption
of XBRL have a negative influence on earnings management. However, the R2 for all three
models are low, which implies that XBRL only have small share in the decrease of accruals.
Furthermore, the variable CRISIS has a significant negative impact on non-discretionary
accruals, but does not affect the number of total and discretionary accruals.
57
8 CONCLUSIONS
8.1 Summary and conclusions
In this study the influence of the mandatory XBRL adoption on earnings management have
been investigated, since there is not a lot of empirical studies that have focused on the
mandatory XBRL filing by the SEC. Therefore, a research has been prepared in order to
answer the following question:
“Does the mandatory adoption of XBRL decrease the level of discretionary accruals of the
S&P500 US listed firms?”
In order to answer the main research question the study started with an explanation of the
XBRL concept and followed by a description of the reporting process and the latest XBRL
developments.
XBRL stands for eXtensible Business Reporting Language and is developed with the purpose
to standardize the business reporting language to improve the analyses and to improve the
exchange of business data between entities. XBRL adoption gives firms advantages, such as
better report quality, quicker distribution of business data, improved analyses and decision
making and improvement of the communication and processes. However, there are also
limitations for the firm to implement XBRL. For example, the time and effort to learn XBRL,
the implementation costs or mapping the taxonomy with the appropriate general ledger. It
seems that the benefits outweigh the limitations, because on December 17, 2008 the
Security and Exchange Commission (SEC) adopted a new rule, which mandate companies to
use the XBRL as the format to disclose financial information with the intention to improve
the decision-making of investors. The adoption is divided in four phases and starts with the
domestic and foreign companies that are using US GAAP in order to prepare their financial
statements and have a common equity float above $5 billion (which are the firms in the
S&P500 index) at the end of the fiscal period on June 25, 2009 or after this date. In their first
year only the face of the financial statement is obliged to be tagged. In the second year the
financial statement footnotes and schedules need to be tagged in block text and in the third
year it is required to tag the disclosures in detail.
In practice the mandatory rule by the SEC is the driving factor for companies to adopt XBRL.
This is the reason that most organizations still not understand the real value of XBRL and
have developed an approach just to comply with the new filing rule requirement. This
translates into a situation where the traditional reports of the statement are converted into
a XBRL format report, which is called the bolt-on approach.
Many researchers have investigated the XBRL adoption by firms to confirm the benefits of
XBRL. For instance, Premuroso and Bhattachararya (2008) found that firms that have
adopted XBRL are more likely to have better corporate governance or for example, the study
of Pinsker and Li (2008) show evidence that XBRL increases the transparency of reported
information. For instance, the findings of Kim, Lim and No (2012) suggest an increase in

58
information efficiency, decrease in event return volatility and a reduction of change in stock
returns volatility. However, there are also findings that concern the quality of XBRL
documents. For instance, Boritz and No (2009) found out that only 44,3% of the instance
documents were based on the standard taxonomies and that custom taxonomy is using
different elements for the same job titles, names and signatures. Also Bartley, Chen and
Taylor (2010) conducted a research on the voluntary filings of 2006 and 2008. They detected
numerous errors and inconsistencies, such as incorrect amounts, duplicate or missing
elements and used inappropriate elements for tagging of the financial statements. Keeping
the XBRL conversion errors into account as limitations we proceed to the other part of this
study: earnings management.
Earnings management has been defined as (Schipper, 1989): “A purposeful intervention in
the external financial reporting process, with the intent of obtaining some private gain (as
opposed to, say, merely facilitating the neutral operation of the process).” Based on this
definition some techniques are identified that manage earnings, such as Cookie Jar reserve,
Big bath accounting and changing accounting standards. To measure the impact of XBRL
adoption on earnings management it is necessary to make earnings management
measurable. One way to achieve this is by measuring the amount of accruals. The definition
of accruals is “I define accruals as the difference between reported earnings and cash flows
from operations” (Healy, 1985, p.86). Total accruals can be separated into discretionary
accruals and non-discretionary accruals, where discretionary accruals can be influenced by
managers and non-discretionary accruals are caused by normal operational firm activities.
There are a lot of models that can measure accruals, but according to the research of
Dechow, Sloan and Sweeney (1995), the Modified Jones Model is the best model to detect
earnings management.
The sample will be based on the S&P500 public listed firms from the year 2006 to 2011 with
2009 as the first year of XBRL implementation. After deducting some firms from the sample
due to missing values and other incompleteness’s, it results into a final sample of 288 firms
with 1728 firm-year observations.
The hypotheses that are prepared in order to answer the research question of this study are as follows:
H1: The number of total accruals is significant lower in the post-XBRL period than in the pre-XBRL period.
H2: The number of non-discretionary accruals is the same in the post-XBRL period as in the pre-XBRL period.
H3: The number of discretionary accruals is significant lower in the post-XBRL period than in the pre-XBRL period.
Regarding the results from the tests it suggests that the XBRL adoption has a significant
negative association with total accruals, which supports the first hypothesis. This is in line
with the expectation, which was based on the evidence from the study of Peng, Shon and
Tan (2011). The second hypothesis implies that the mandatory XBRL did not affect the
number of non-discretionary accruals. However, the results show that there is statistical
59
negative association and therefore the second hypothesis has been rejected. The possible
explanation for this could be due to the financial crisis, since an abnormal economic
environment can change the level of non-discretionary accruals (Kaplan, 1985). That is why
the variable CRISIS shows a significantly negative impact on non-discretionary accruals. Last
and most important hypothesis is the third hypothesis that assumes that the number of
discretionary accruals is significantly lower in the post-XBRL period than in the pre-XBRL
period. There have been significant evidence found that XBRL negatively is related to
discretionary accruals, which support the third hypothesis. In other words it can be
concluded that the mandatory adoption of XBRL in 2009 has decreased the level of
discretionary accruals of the S&P500 US listed firms.
8.2 Limitations
Like in many other researches this study also has her limitations that should be considered
when interpreting the results. As mentioned earlier, the small sample size, which consists
only of 1728 firm years’ observations, could reduce the significance level of the findings and
increases the probability of the type I and II errors. The second limitation, which is also partly
caused by the small sample size, is that the results from the study cannot be generalized to
other companies in the US and other countries. The reason for this is that the sample only
consists of firms from the S&P500 index and these firms were the first group that was
obliged to file in XBRL. The third limitation is that the COMPUSTAT database, where the
sample has been obtained from, could contain errors that have a significant impact on the
results. Ulbricht and Weiner (2005) compared the Worldscope and Compustat databases
with each other and found mean and median differences. The last limitation comes from the
results of this study. The explanatory power (R2) of the regressions is on the low side, which
means that the variables only have a small share in the decrease of accruals. While there is
evidence that the XBRL adoption decreases the discretionary accruals, the effects are very
small. There could be other important factors that were not taken into account, which
should have a significant influence on the results.
8.3 Contribution and further research
Since there is not a lot of empirical studies on the mandatory XBRL adoption, the findings
from this study greatly contribute to the existing literature by providing insight into the issue
of the mandatory XBRL implementation and relating benefits. The results will be valuable to
preparers of financial statements, since the bolt-on approach will slowly vanish and repress
by the embedded approach. Also the regulators and standard setters can benefit from this
study by informing them the benefits, costs and consequences of the mandatory XBRL
adoption. Lastly, the findings from this research could be a good foundation for those who
want to investigate the effects of the adoption. Further research could focus on the other
filers or all mandatory XBRL adopters in the US.

60
GLOSSARY
Source: SEC (2012)

61
REFERENCES
Accountinginfo, 2012. Accounting study guide. [Online] Viewed on 15th of May 2012. <http://accountinginfo.com/study/accrual-101.htm>
Altova, 2012. XBRL rendering. [Online] Viewed on 26th of April 2012. <http://www.altova.com/stylevision/xbrl-rendering.html>
Bartley, J., Chen, A.Y.S., Taylor, E.Z.: A Comparison of XBRL Filings to Corporate 10-Ks- Evidence from the Voluntary Filing Program. Accounting Horizons. 25, 227–245.
Benbasat I., Goldstein D. K., Mead M. (1987) The Case Research Strategy in Studies of Information Systems. In: MIS Quarterly, 11 (1987), pp. 369-386.
Bergstresser, D., and T. Philippon. 2006. CEO incentives and earnings management. Journal of Financial Economics 80 (3): 511 – 29. Boritz, J. E., and W. G. No. 2005. Security in XML-based financial reporting services on the
Internet. Journal of Accounting and Public Policy 24 (1): 11 – 35. Boritz, J. E., and W. G. No. 2009. Assurance on XBRL-related documents: The case of United
Technologies Corporation. Journal of Information Systems 23 (1): 49 – 78. Bovee, M., M. Ettredge, R. P. Srivastava, M. Vasarhelyi. 2002. Does the Year 2000 XBRL
Taxonomy Accommodate Current Business Financial Reporting Practice?"Journal of Information Systems, Vol. 16, No. 2, Fall: 165-182.
Burnett, R. D., Friedman, M. and Murthy, U. (2006), Financial reports: Why you need XBRL. J. Corp. Acct. Fin., 17: 33–40. doi: 10.1002/jcaf.20229
Callaghan, J. and R. Nehmer. 2009. Financial and governance characteristics of voluntary XBRL adopters in the United States. International Journal of Disclosure and Governance, 6: 231-335.
Chen, K. Y., Lin, K. L., Zhou, J., (2005), Audit quality and earnings management for Taiwan IPO firms, Managerial Accounting Journal, (20,1) pp. 86-104.
Chia, Y.M., I. Lapsley and H.W. Lee. 2007. Choice of auditors and earnings management during the Asian financial crisis. Managerial auditing journal 22: 177-196.
Choi, J.H., Kim, J.B., Lee, J.J., 2011. Value relevance of discretionary accruals in the Asian financial crisis of 1997-1998. J. Account. Public Policy 30 (2011): 166-187.
Chou, K. H. (2006). How Valid Are they? An examination of XBRL Voluntary Filing Documents with the SEC EDGAR System. Proceeding of the 14th International XBRL Conference .
Cohen, D., A. Dey, and T. Lys. 2008. Real and accrual-based earnings management in the pre- and post-Sarbanes Oxley periods. The Accounting Review 83 (3): 757 – 87. Das, S., Shroff, P. K. and Zhang, H. (2009), Quarterly Earnings Patterns and Earnings
Management. Contemporary Accounting Research, 26: 797–831. doi: 10.1506 / car.26.3.7
DeAngelo, L.E. 1986. Accounting numbers as market valuation substitutes: a study of management buyouts of public stockholders. The accounting review 61: 400-420.
Debreceny, R. S., A. Chandra, J. J. Cheh, D. Guithues-Amrhein, N. J. Hannon, P. D. Hutchison, D. Janvrin, R. A. Jones, B. Lamberton, A. Lymer, M. Mascha, R. Nehmer, S. Roohani, R. P. Srivastava, S. Trabelsi, T. Tribunella, G. Trites, and M. A. Vasarhelyi. 2005. Financial reporting in XBRL on the SEC’s EDGAR system: A critique and evaluation. Journal of Information Systems 19 (2): 191-210.
Debreceny, R.. S. Farewell, M. Piechocki, C. Felden, and A. Gräning. 2010. Does it add up? Early evidence on the data quality of XBRL filings to the SEC. Journal of Accounting and Public Policy 29 (3): 296-306.
62
Dechow, P.M. and R. Sloan (1991), 'Executive Incentives and the Horizon Problem: An Empirical Investigation', Journal of Accounting & Economics, Vol. 14, No.1 (March), pp. 51-89
Dechow, P., R. Sloan, and A. Sweeney. 1995. Detecting earnings management. The Accounting Review 70 (2): 193 – 225.
De Vocht, A. 2002. SPSS 11 voor windows. Bijleveld Press. Dechow, P.; S. Richardson; and I. Tuna. “Why are Earnings Kinky? An Examination of the Earnings Management Explanation.” Review of Accounting Studies 8 (2003):
355-384. Deloitte, 2012. Chartered Accountants. [Online] Viewed on 4th of April 2012.
<http://www.charteredaccountants.ie/Members/Your-Institute/XBRL/> Dhaliwal, D. S., Gleason, C. A. and Mills, L. F. (2004), Last-Chance Earnings Management:
Using the Tax Expense to Meet Analysts' Forecasts. Contemporary Accounting Research, 21: 431–459.
Doolin, B., and I. Troshani. 2007. Organizational adoption of XBRL. Electronic Markets 17 (3): 199-209.
Du, H., M.A. Vasarhelyi and X. Zheng. 2011. XBRL Mandate: Thousands of Filing Errors and So What? Working paper. University of Houston, Rutgers Business School, Bryant University.
Dunne, T., C. Helliar, A. Lymer and R.Mousa. 2009. XBRL: the Views of Stakeholders. The Association of Chartered Certified Accountants Research Monograph , London
Efendi, J., J.D. Park, and C. Subramaniam. 2010. Do XBRL Reports have incremental information content? An empirical analysis. Working paper, The University of Texas at
Arlington and Towson University. Filip, A. and B. Raffournier. ‘The value relevance of accounting figures in Europe after IFRS
implementation: the relative influence of legal incentives, market forces and firm characteristics.’ 2011. Working paper ESSEC KPMG Financial Reporting Chair.
Garbellotto, G. 2009. How to make your data interactive. Strategic Finance 90 (9): 56-57. Healy, P. 1985. The effect of bonus schemes on accounting decisions. Journal of Accounting
and Economics 7 (3): 85 – 107. Healy, P.M., and J.M. Wahlen. 1999. A review of the earnings management literature and its
implications for standard setting. Accounting Horizons 13: 365-383. Higgins, L. N., and H. W. Harrell. 2003. XBRL: Don’t lag behind the digital information
revolution. Journal of Corporate Accounting & Finance 14 (5):13-21. Hribar, P. and Collins, D. W. (2002), Errors in Estimating Accruals: Implications for Empirical
Research. Journal of Accounting Research, 40: 105–134. doi: 10.1111/1475-679 X.00041
Jacob. J., and B. Jorgensen. “Earnings Management and Accounting Income Aggregation.” Journal of Accounting and Economics 43 (2007): 369-390.
Janvrin, D., Pinsker, R., Mascha, 2011 M.: XBRL, Excel or PDF? The Effects of Technology Choice on the Analysis of Financial Information. CAAA Annual Conference 2011
Jones, J.J. 1991. Earnings management during import relief investigations. Journal of accounting research 29: 193-228.
Kaplan, R. S. 1985. Evidence on the effect of bonus schemes on accounting procedure and accrual decisions. Journal of Accounting and Economics 7 (1-3): 109-113.
Kim, J. W., Lim, J.H. and No, W.G., 2012. The effect of Mandatory XBRL Reporting across the Financial Information Environment: Evidence in the First Wave of Mandated U.S.

63
Filers. Journal of Information Systems: Spring 2012, Vol.26(1), 127-153. Lev, B., 1989, On the usefulness of earnings and earnings research: Lessons and directions
from two decades of empirical research, Journal of Accounting Research Supplement: 153-92.
McKee, T.E. 2005. Earnings Management: An Executive Perspective, South-Western Educational Pub
Pinsker, R., and S. Li. 2008. Costs and benefits of XBRL adoption: Early evidence. Communications of the ACM 51 (3): 47 – 50.
Peng, E. Y., Shon, J. and Tan, C. (2011), XBRL and Accruals: Empirical Evidence from China. Accounting Perspectives, 10: 109–138
Plumlee, R. D., and M. A. Plumlee. 2008. Assurance on XBRL for financial reporting. Accounting Horizons 22 (3): 353-368.
Premuroso, R. F., and S. Bhattacharya. 2008. Do early and voluntary filers of financial information in XBRL format signal superior corporate governance and operating performance? International Journal of Accounting Information Systems 9 (1): 1 – 20.
Ragothaman, S. 2011. Voluntary XBRL Adopters and Firm Characteristics. Working paper. The University of South Dakota.
Rezaee, Z., R. Elam, and A. Sharbatoghlie. 2001. Continuous auditing: The audit of the future. Managerial Auditing Journal 16 (3): 150-158
Richards, J., B. Smith, and A. Saedi. 2007. An introduction to XBRL. Working paper, Dublin City University
Roohani, S.J., and X. Zheng. 2011. Determinants of the deficiency of XBRL mandatory filings. Working paper. Bryant University.
Rusmin, R., (2010), Auditor quality and earnings management: Singaporean evidence. Managerial Auditing Journal, (25,7) pp. 618-638.
Schipper, K. 1989. Commentary on earnings management. Accounting horizons (December): 91-102.
SEC, 2008. Securities and Exchange Commission. Interactive data to improve financial Reporting. [pdf] available at: <www.sec.gov/rules/final/2009/33-9002.pdf>
SEC, 2012.Filings and Forms. [Online] < http://www.sec.gov/spotlight/xbrl/glossary.shtml> Seward and Kissel LLP, 2012. Publications. [Online] Viewed on 10th of May 2012.
<http://www.sewkis.com/pubs/xprPubDetail.aspx?xpST=PubDetail&pub=403> Srivastava, R. P., and A. Kogan. 2010. Assurance on XBRL instance document: A conceptual
framework of assertions. International Journal of Accounting Information Systems 11 (3): 261-273.
World Wide Web Consortium, 2012. XML in 10 punten. [Online] Viewed on 27th of March 2012. <http://www.w3.org/XML/1999/XML-in-10-points-19990327>
XBRL China, 2012. Fact Sheets [Online] Viewed on 26th of April 2012. <http://www.xbrl-cn.org/>
XBRL International, 2012. Knowledge Center. [Online] Viewed on 3th of March 2012. <http://www.xbrl.org/knowledge-centre>
XBRL US, 2012. Fact Sheets. [Online] Viewed on 27th of March 2012. <http://xbrl.us/Learn/Pages/FactSheet.aspx>
Zhang, X. F. 2007. Accruals, investment, and the accrual anomaly. The Accounting Review 82 (5): 1333 – 63.
Zhu, H., Wu, H.: Quality of data standards: framework and illustration using XBRL taxonomy and instances. Electronic Markets. 21, 129–139 (2011).

64
APPENDIX
A: Sample list
B: Voluntary XBRL adopters
C: Overview literature
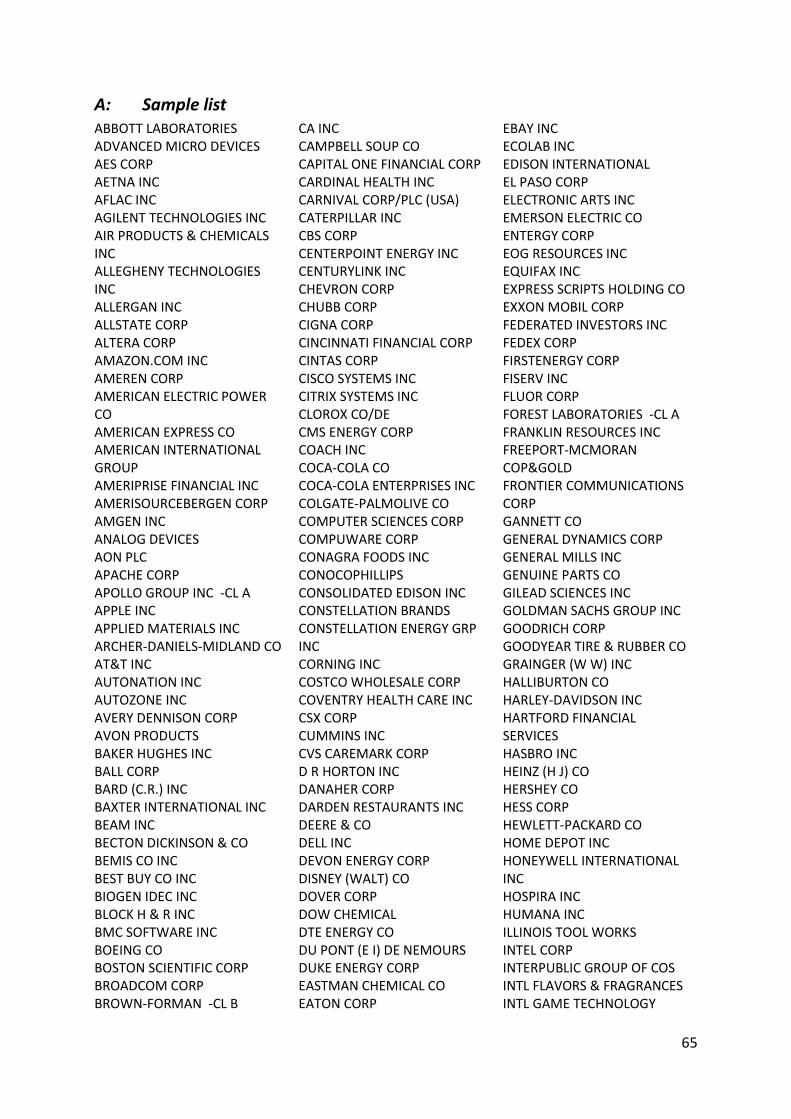
65
A: Sample list ABBOTT LABORATORIES ADVANCED MICRO DEVICES AES CORP AETNA INC AFLAC INC AGILENT TECHNOLOGIES INC AIR PRODUCTS & CHEMICALS INC ALLEGHENY TECHNOLOGIES INC ALLERGAN INC ALLSTATE CORP ALTERA CORP AMAZON.COM INC AMEREN CORP AMERICAN ELECTRIC POWER CO AMERICAN EXPRESS CO AMERICAN INTERNATIONAL GROUP AMERIPRISE FINANCIAL INC AMERISOURCEBERGEN CORP AMGEN INC ANALOG DEVICES AON PLC APACHE CORP APOLLO GROUP INC -CL A APPLE INC APPLIED MATERIALS INC ARCHER-DANIELS-MIDLAND CO AT&T INC AUTONATION INC AUTOZONE INC AVERY DENNISON CORP AVON PRODUCTS BAKER HUGHES INC BALL CORP BARD (C.R.) INC BAXTER INTERNATIONAL INC BEAM INC BECTON DICKINSON & CO BEMIS CO INC BEST BUY CO INC BIOGEN IDEC INC BLOCK H & R INC BMC SOFTWARE INC BOEING CO BOSTON SCIENTIFIC CORP BROADCOM CORP BROWN-FORMAN -CL B
CA INC CAMPBELL SOUP CO CAPITAL ONE FINANCIAL CORP CARDINAL HEALTH INC CARNIVAL CORP/PLC (USA) CATERPILLAR INC CBS CORP CENTERPOINT ENERGY INC CENTURYLINK INC CHEVRON CORP CHUBB CORP CIGNA CORP CINCINNATI FINANCIAL CORP CINTAS CORP CISCO SYSTEMS INC CITRIX SYSTEMS INC CLOROX CO/DE CMS ENERGY CORP COACH INC COCA-COLA CO COCA-COLA ENTERPRISES INC COLGATE-PALMOLIVE CO COMPUTER SCIENCES CORP COMPUWARE CORP CONAGRA FOODS INC CONOCOPHILLIPS CONSOLIDATED EDISON INC CONSTELLATION BRANDS CONSTELLATION ENERGY GRP INC CORNING INC COSTCO WHOLESALE CORP COVENTRY HEALTH CARE INC CSX CORP CUMMINS INC CVS CAREMARK CORP D R HORTON INC DANAHER CORP DARDEN RESTAURANTS INC DEERE & CO DELL INC DEVON ENERGY CORP DISNEY (WALT) CO DOVER CORP DOW CHEMICAL DTE ENERGY CO DU PONT (E I) DE NEMOURS DUKE ENERGY CORP EASTMAN CHEMICAL CO EATON CORP
EBAY INC ECOLAB INC EDISON INTERNATIONAL EL PASO CORP ELECTRONIC ARTS INC EMERSON ELECTRIC CO ENTERGY CORP EOG RESOURCES INC EQUIFAX INC EXPRESS SCRIPTS HOLDING CO EXXON MOBIL CORP FEDERATED INVESTORS INC FEDEX CORP FIRSTENERGY CORP FISERV INC FLUOR CORP FOREST LABORATORIES -CL A FRANKLIN RESOURCES INC FREEPORT-MCMORAN COP&GOLD FRONTIER COMMUNICATIONS CORP GANNETT CO GENERAL DYNAMICS CORP GENERAL MILLS INC GENUINE PARTS CO GILEAD SCIENCES INC GOLDMAN SACHS GROUP INC GOODRICH CORP GOODYEAR TIRE & RUBBER CO GRAINGER (W W) INC HALLIBURTON CO HARLEY-DAVIDSON INC HARTFORD FINANCIAL SERVICES HASBRO INC HEINZ (H J) CO HERSHEY CO HESS CORP HEWLETT-PACKARD CO HOME DEPOT INC HONEYWELL INTERNATIONAL INC HOSPIRA INC HUMANA INC ILLINOIS TOOL WORKS INTEL CORP INTERPUBLIC GROUP OF COS INTL FLAVORS & FRAGRANCES INTL GAME TECHNOLOGY

66
INTL PAPER CO INTUIT INC JABIL CIRCUIT INC JDS UNIPHASE CORP JOHNSON & JOHNSON JOHNSON CONTROLS INC KELLOGG CO KIMBERLY-CLARK CORP KLA-TENCOR CORP KOHL'S CORP KROGER CO L-3 COMMUNICATIONS HLDGS INC LABORATORY CP OF AMER HLDGS LAUDER (ESTEE) COS INC -CL A LEGGETT & PLATT INC LENNAR CORP LEXMARK INTL INC -CL A LILLY (ELI) & CO LIMITED BRANDS INC LINEAR TECHNOLOGY CORP LOEWS CORP LSI CORP MACY'S INC MARATHON OIL CORP MARRIOTT INTL INC MARSH & MCLENNAN COS MASCO CORP MATTEL INC MCCORMICK & CO INC MCDONALD'S CORP MCGRAW-HILL COMPANIES MCKESSON CORP MEADWESTVACO CORP MEDCO HEALTH SOLUTIONS INC MEDTRONIC INC MERCK & CO METLIFE INC MICRON TECHNOLOGY INC MOLEX INC MOLSON COORS BREWING CO MONSANTO CO MOODY'S CORP MORGAN STANLEY MOTOROLA SOLUTIONS INC MURPHY OIL CORP NABORS INDUSTRIES LTD NATIONAL OILWELL VARCO INC NETAPP INC NEWELL RUBBERMAID INC
NEWMONT MINING CORP NEWS CORP NEXTERA ENERGY INC NIKE INC NISOURCE INC NORDSTROM INC NORFOLK SOUTHERN CORP NORTHROP GRUMMAN CORP NOVELLUS SYSTEMS INC NUCOR CORP OCCIDENTAL PETROLEUM CORP OMNICOM GROUP ORACLE CORP PACCAR INC PALL CORP PARKER-HANNIFIN CORP PATTERSON COMPANIES INC PAYCHEX INC PENNEY (J C) CO PERKINELMER INC PG&E CORP PINNACLE WEST CAPITAL CORP PITNEY BOWES INC PPG INDUSTRIES INC PPL CORP PRAXAIR INC PROCTER & GAMBLE CO PROGRESS ENERGY INC PROGRESSIVE CORP-OHIO PUBLIC SERVICE ENTRP GRP INC PULTEGROUP INC QUEST DIAGNOSTICS INC RAYTHEON CO REYNOLDS AMERICAN INC ROBERT HALF INTL INC ROCKWELL AUTOMATION ROCKWELL COLLINS INC ROWAN COS INC RYDER SYSTEM INC SAFEWAY INC SARA LEE CORP SCHLUMBERGER LTD SCHWAB (CHARLES) CORP SEALED AIR CORP SEARS HOLDINGS CORP SEMPRA ENERGY SHERWIN-WILLIAMS CO SIGMA-ALDRICH CORP SNAP-ON INC SOUTHERN CO SOUTHWEST AIRLINES
SPRINT NEXTEL CORP ST JUDE MEDICAL INC STANLEY BLACK & DECKER INC STAPLES INC STARBUCKS CORP STARWOOD HOTELS&RESORTS WRLD STRYKER CORP SUNOCO INC SUPERVALU INC SYMANTEC CORP SYSCO CORP TARGET CORP TECO ENERGY INC TENET HEALTHCARE CORP TERADYNE INC TEXAS INSTRUMENTS INC TEXTRON INC THERMO FISHER SCIENTIFIC INC TIFFANY & CO TIME WARNER INC TJX COMPANIES INC TORCHMARK CORP TYSON FOODS INC -CL A UNION PACIFIC CORP UNITED PARCEL SERVICE INC UNITEDHEALTH GROUP INC UNUM GROUP VALERO ENERGY CORP VERIZON COMMUNICATIONS INC VF CORP VIACOM INC VULCAN MATERIALS CO WAL-MART STORES INC WALGREEN CO WASTE MANAGEMENT INC WATERS CORP WATSON PHARMACEUTICALS INC WELLPOINT INC WEYERHAEUSER CO WHIRLPOOL CORP WHOLE FOODS MARKET INC WILLIAMS COS INC XCEL ENERGY INC XILINX INC YAHOO INC YUM BRANDS INC ZIMMER HOLDINGS INC

67
B: Voluntary XBRL adopters
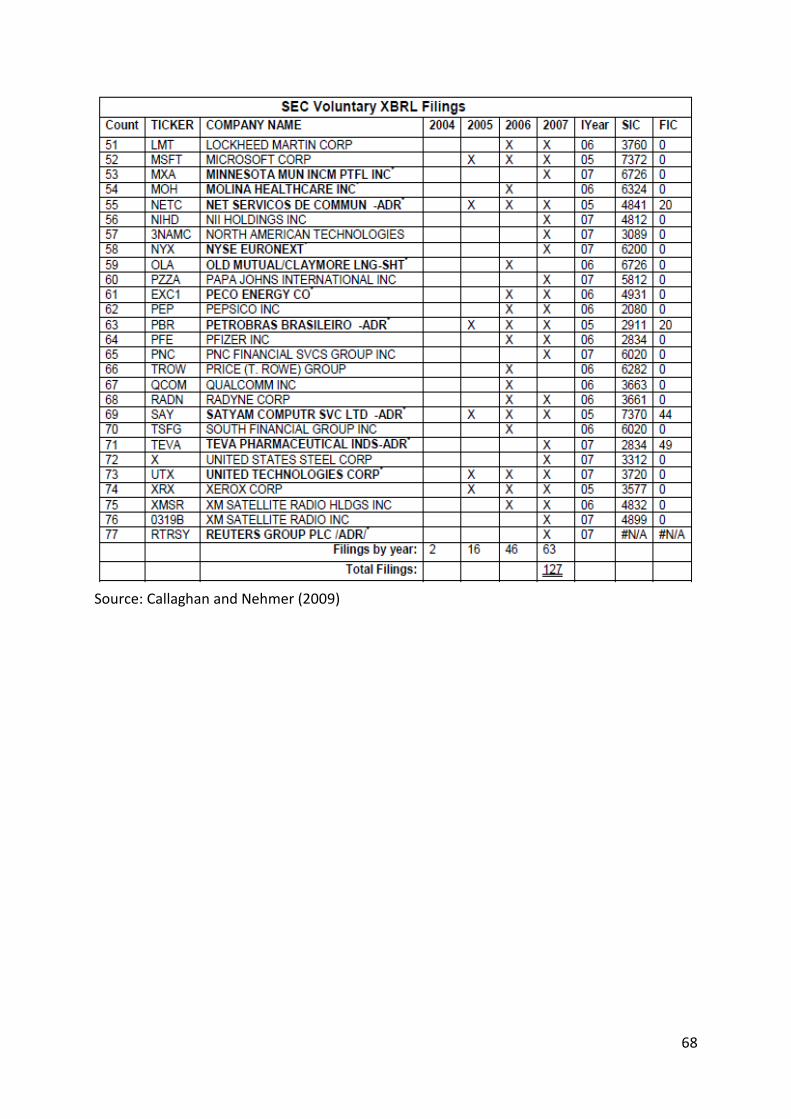
68
Source: Callaghan and Nehmer (2009)

69
C: Overview literature
Year Author(s) Object of study Sample Methodology Outcome
1985 DeAngelo The effect on bonus schemes on accounting decisions
49 companies listed on the 1980 Fortune Directory of the 250 largest U.S. industrial corporations.
DeAngelo model There is a strong association between accruals and managers' income-reporting incentives under their bonus contracts. High incidence of voluntary changes in accounting procedures during years following the adoption or modification of a bonus plan.
1995 Dechow, Sloan and Sweeney
Evaluate the accrual based models that detects earnings management
The authors uses four distinct samples: “ (i) a randomly selected sample of 1000 firm-years; (ii) samples of 1000 firm-years that are randomly selected from pools of firm-years experiencing extreme financial performance; (iii) samples of 1000 randomly selected firm-years in which a fixed and known amount of accrual manipulation has been artificially introduced; and (iv) a sample of 32 firms that are subject to SEC enforcement actions for allegedly overstating annual earnings in 56 firm-years.”
Healy model, DeAngelo model, Jones model, Modified Jones model and Industry model
Modified Jones model developed by Jones (1991) provides the most powerful tests of earnings management.
2003 Dechow, Richardson and Tuna
We investigate whether boosting of discretionary accruals to report a small profit is a reasonable explanation for that too few firms report small losses and that too many firms report small profits.
47,847 firm-years observations retrieved from Compustat database
Modified Jones model Small profit and small loss firms have similar levels of discretionary accruals and both groups have similar proportions of positive discretionary accrual firms.
2004 Dhaliwal, Gleason and Mills
Investigate whether income tax expense are regularly used to achieve earnings targets.
14,942 annual and quarterly observations from Compustat in the period 1986 to 1999.
Regression analyses Firms decrease their income tax expense from the third to fourth quarter to achieve the earnings targets.
2005 Chen, Lin and Zhou
Audit quality and earnings management for Taiwan IPO firms.
The sample consists of 367 new issues between 1999 and 2002 from the Taiwan Economic Journal database.
Modified Jones model The big five auditors are related to less earnings management in the IPO year in Taiwan.
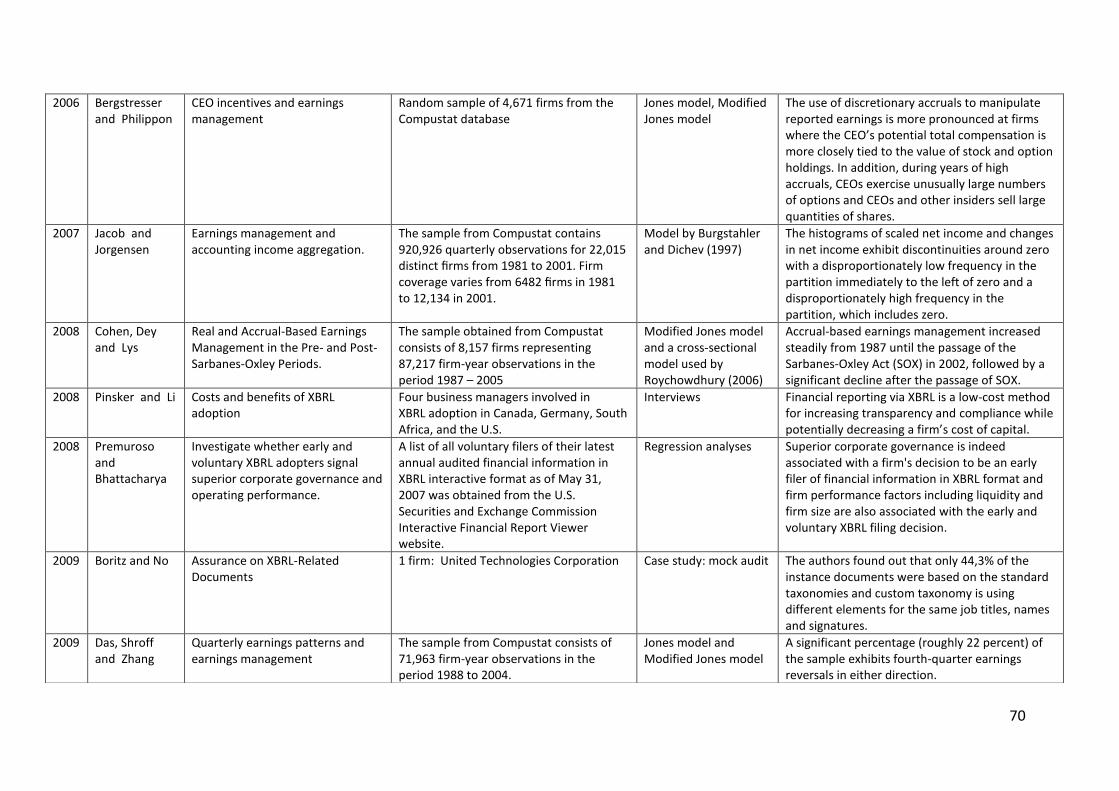
70
2006 Bergstresser and Philippon
CEO incentives and earnings management
Random sample of 4,671 firms from the Compustat database
Jones model, Modified Jones model
The use of discretionary accruals to manipulate reported earnings is more pronounced at firms where the CEO’s potential total compensation is more closely tied to the value of stock and option holdings. In addition, during years of high accruals, CEOs exercise unusually large numbers of options and CEOs and other insiders sell large quantities of shares.
2007 Jacob and Jorgensen
Earnings management and accounting income aggregation.
The sample from Compustat contains 920,926 quarterly observations for 22,015 distinct firms from 1981 to 2001. Firm coverage varies from 6482 firms in 1981 to 12,134 in 2001.
Model by Burgstahler and Dichev (1997)
The histograms of scaled net income and changes in net income exhibit discontinuities around zero with a disproportionately low frequency in the partition immediately to the left of zero and a disproportionately high frequency in the partition, which includes zero.
2008 Cohen, Dey and Lys
Real and Accrual-Based Earnings Management in the Pre- and Post-Sarbanes-Oxley Periods.
The sample obtained from Compustat consists of 8,157 firms representing 87,217 firm-year observations in the period 1987 – 2005
Modified Jones model and a cross-sectional model used by Roychowdhury (2006)
Accrual-based earnings management increased steadily from 1987 until the passage of the Sarbanes-Oxley Act (SOX) in 2002, followed by a significant decline after the passage of SOX.
2008 Pinsker and Li Costs and benefits of XBRL adoption
Four business managers involved in XBRL adoption in Canada, Germany, South Africa, and the U.S.
Interviews Financial reporting via XBRL is a low-cost method for increasing transparency and compliance while potentially decreasing a firm’s cost of capital.
2008 Premuroso and Bhattacharya
Investigate whether early and voluntary XBRL adopters signal superior corporate governance and operating performance.
A list of all voluntary filers of their latest annual audited financial information in XBRL interactive format as of May 31, 2007 was obtained from the U.S. Securities and Exchange Commission Interactive Financial Report Viewer website.
Regression analyses Superior corporate governance is indeed associated with a firm's decision to be an early filer of financial information in XBRL format and firm performance factors including liquidity and firm size are also associated with the early and voluntary XBRL filing decision.
2009 Boritz and No Assurance on XBRL-Related Documents
1 firm: United Technologies Corporation Case study: mock audit The authors found out that only 44,3% of the instance documents were based on the standard taxonomies and custom taxonomy is using different elements for the same job titles, names and signatures.
2009 Das, Shroff and Zhang
Quarterly earnings patterns and earnings management
The sample from Compustat consists of 71,963 firm-year observations in the period 1988 to 2004.
Jones model and Modified Jones model
A significant percentage (roughly 22 percent) of the sample exhibits fourth-quarter earnings reversals in either direction.

71
2009 Efendi, Park and Subramaniam
This study investigates whether XBRL filings of 10Ks and 10Qs possess incremental information content beyond current EDGAR filings in HTML format.
The sample consistsb342 voluntary XBRL filings from the period of 2005 to Jun 30, 2008 retrieved from the SEC XBRL Voluntary Filing
Market model A significant market reaction on the day when XBRL reports are filed. The market response is stronger for larger firms, more recent filings and more timely filings.
2010 Debreceny, Farewell, Piechocki, Felden and Gräning
The research investigates the extent of, and reasons for, calculation errors in the first round of filings of quarterly reports (10-Q) made in XBRL format under the SEC interactive data mandate.
The sample consists of 435 individual filings from 406 individual corporations obtained from the SEC website.
Quantitative research One quarter of the filings by the initial 400 large corporations in the first round of submissions had errors, with differences reported monetary facts and the sum of other monetary facts that were bound together in a computation relationship.
2010 Rusmin The purpose of this paper is to examine the association between the magnitude of earnings management and auditor quality
402 firms listed on the Mainboard and Sesdaq as at December 31, 2003
Modified Jones model Negative association between auditor quality and the earnings management indicator. The magnitude of earnings management amongst firms engaging the services of a specialist is significantly lower than firms purchasing audit services from a non-specialist auditor. In addition, the magnitude of earnings management is significantly lower amongst companies engaging a Big 4 specialist audit firm relative to companies using the audit services of a Non-Big 4 specialist.
2011 Du, Vasarhelyi and Zheng
Investigate the overall changing pattern of the errors to understand whether the vast number of errors may hamper the transition to the interactive data reporting.
Sample of 4532 filings that contain 4260 errors for the period from June 2009 to December 2010 from the EDGAR Dashboard website.
Regression analyses The number of errors per filing is significantly decreasing as more quarters pass, when a company files more times, and when a higher version of software is used, suggesting that the SEC, the company filers, and the technology community all learn from their experiences and therefore the future filings are improved.
2011 Filip and Raffournier
Investigate the impact of the 2008-2009 financial crises on the earnings management behavior of European listed firms.
8,266 firm-year observations from 16 European Union countries and cover the period 2006-2009.
Jones model and Modified Jones model
Earnings management has significantly decreased in the crisis years.
2011 Janvrin, Pinsker and Mascha
Investigate which reporting technology non-professional investors will choose to complete a financial analysis task.
53 graduate business students enrolled in a financial statement analysis course at two medium-sized state universities
Pilot study 66 percent of nonprofessional investor proxies chose to use XBRL-enabled technology, while 34 percent chose spreadsheets. Participants who chose XBRL-enabled technology perceived it
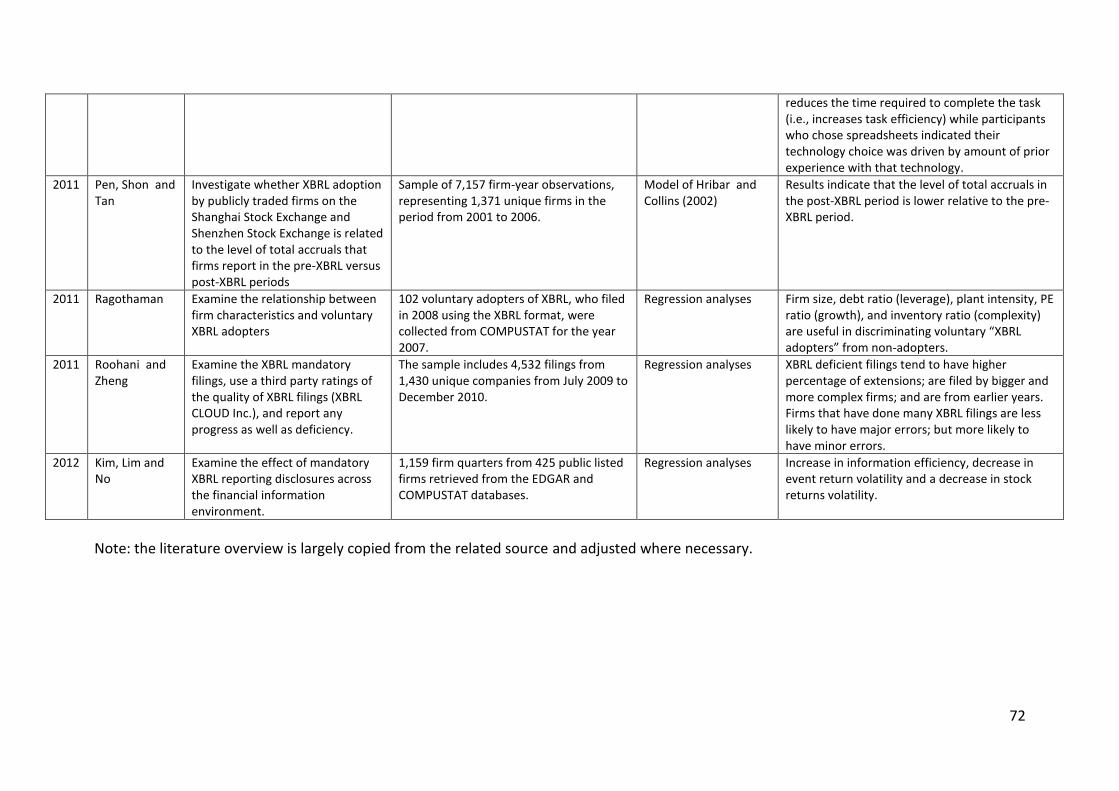
72
Note: the literature overview is largely copied from the related source and adjusted where necessary.
reduces the time required to complete the task (i.e., increases task efficiency) while participants who chose spreadsheets indicated their technology choice was driven by amount of prior experience with that technology.
2011 Pen, Shon and Tan
Investigate whether XBRL adoption by publicly traded firms on the Shanghai Stock Exchange and Shenzhen Stock Exchange is related to the level of total accruals that firms report in the pre-XBRL versus post-XBRL periods
Sample of 7,157 firm-year observations, representing 1,371 unique firms in the period from 2001 to 2006.
Model of Hribar and Collins (2002)
Results indicate that the level of total accruals in the post-XBRL period is lower relative to the pre-XBRL period.
2011 Ragothaman Examine the relationship between firm characteristics and voluntary XBRL adopters
102 voluntary adopters of XBRL, who filed in 2008 using the XBRL format, were collected from COMPUSTAT for the year 2007.
Regression analyses Firm size, debt ratio (leverage), plant intensity, PE ratio (growth), and inventory ratio (complexity) are useful in discriminating voluntary “XBRL adopters” from non-adopters.
2011 Roohani and Zheng
Examine the XBRL mandatory filings, use a third party ratings of the quality of XBRL filings (XBRL CLOUD Inc.), and report any progress as well as deficiency.
The sample includes 4,532 filings from 1,430 unique companies from July 2009 to December 2010.
Regression analyses XBRL deficient filings tend to have higher percentage of extensions; are filed by bigger and more complex firms; and are from earlier years. Firms that have done many XBRL filings are less likely to have major errors; but more likely to have minor errors.
2012 Kim, Lim and No
Examine the effect of mandatory XBRL reporting disclosures across the financial information environment.
1,159 firm quarters from 425 public listed firms retrieved from the EDGAR and COMPUSTAT databases.
Regression analyses Increase in information efficiency, decrease in event return volatility and a decrease in stock returns volatility.