the impact of university-firm knowledge links on firm-level productivity in britain richard harris...
TRANSCRIPT

The Impact of University-Firm Knowledge Links on Firm-level
Productivity in Britain Richard Harris and Cher Li
University of Glasgow University of Strathclyde
This work contains statistical data from ONS which is Crown copyright and reproduced with the permission of the controller of HMSO and Queen's Printer for Scotland. The use of the ONS statistical data in this work does not imply the endorsement of the ONS in relation to the interpretation or analysis of the statistical data. This work uses research datasets which may not exactly reproduce National Statistics aggregates

Overview
• This study uses data from the UK Community Innovation Survey for 2007 to consider – (i) which firms engage with HEI’s in terms of both
sourcing information and/or cooperating for innovation activities; and
– (ii) whether involvement with HEI’s impacts on productivity (directly and indirectly through innovation activities).
• Also consider role of graduate employment in terms of (i) and (ii)

Percentage of enterprises sourcing knowledge from HEI’s in Great Britain 2006, by industry
62.761.2
50.848.748.1
41.237.4
36.135.1
34.132.932.0
30.528.628.027.827.026.9
25.724.724.423.923.322.3
21.019.118.818.418.117.717.116.816.716.615.915.615.314.6
13.611.7
3.3
0.0 10.0 20.0 30.0 40.0 50.0 60.0 70.0
Air transport (62)Clothing (18)
Sale of motors (50)Support to transport (63)
Hotels & restaurants (55)Water transport (61)
Cultural services (92)Land transport (60)
Wood products (20)Retail trade (52)Real estate (70)
Other mining & quarrying (14)Fabricated metals (28)
Renting equipment (71)Construction (45)
Paper products (21)Furniture (36)
Wholesale trade (51)Printing & publishing (22)
Leather & footwear (19)Recycling (37)
Food & beverages (15)Rubber & plastics (25)Post & telecoms (64)
Non-metalic minerals (26)Other business services (74)
Other transport equipment (35)Textiles (17)
Machinery & equipment (29)Distribution of water (41)
Basic Metals (27)Computer software (72)
Office machinery & computers (30)Electrical machinery (31)
Motor vehicles (34)Radio, TV equipment (32)
Chemicals (24)Precision instruments (33)
Electricity, gas, hot water (40)R&D (73)
Extraction (11)Coke & petroluem products (23)
UK average = 22.8%
70.4

62.761.2
50.848.748.1
41.237.4
36.135.1
34.132.932.0
30.528.628.027.827.026.9
25.724.724.423.923.322.3
21.019.118.818.418.117.717.116.816.716.615.915.615.314.6
13.611.7
3.3
0.0 10.0 20.0 30.0 40.0 50.0 60.0 70.0
Air transport (62)Clothing (18)
Sale of motors (50)Support to transport (63)
Hotels & restaurants (55)Water transport (61)
Cultural services (92)Land transport (60)
Wood products (20)Retail trade (52)Real estate (70)
Other mining & quarrying (14)Fabricated metals (28)
Renting equipment (71)Construction (45)
Paper products (21)Furniture (36)
Wholesale trade (51)Printing & publishing (22)
Leather & footwear (19)Recycling (37)
Food & beverages (15)Rubber & plastics (25)Post & telecoms (64)
Non-metalic minerals (26)Other business services (74)
Other transport equipment (35)Textiles (17)
Machinery & equipment (29)Distribution of water (41)
Basic Metals (27)Computer software (72)
Office machinery & computers (30)Electrical machinery (31)
Motor vehicles (34)Radio, TV equipment (32)
Chemicals (24)Precision instruments (33)
Electricity, gas, hot water (40)R&D (73)
Extraction (11)Coke & petroluem products (23)

Percentage of enterprises sourcing knowledge from HEI’s in Great Britain 2006, by region and sector
20.6
22.5
19.5
22.2
22.5
21.4
21.9
24.9
22.5
23.2
21.7
21.9
22.7
22.8
23.8
25.6
26.6
26.7
27.1
27.1
27.4
27.8
16.0 18.0 20.0 22.0 24.0 26.0 28.0
EAST
EM
SW
WM
YH
LON
WAL
SCO
SE
NE
NW
services sector production sector
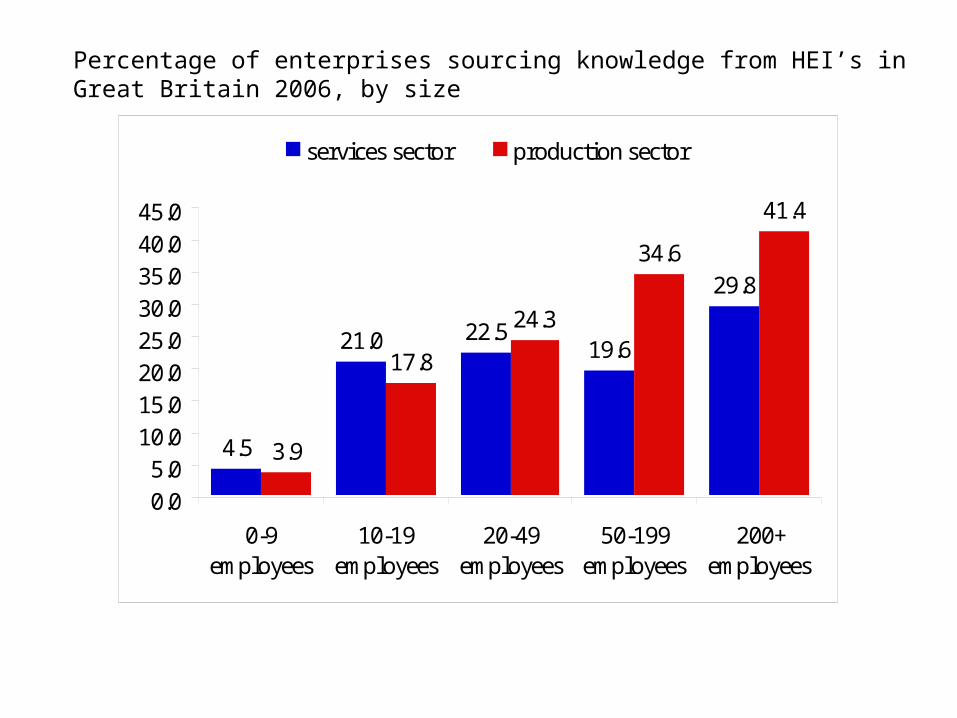
Percentage of enterprises sourcing knowledge from HEI’s in Great Britain 2006, by size
4.5
21.0 22.519.6
29.8
3.9
17.8
24.3
34.6
41.4
0.05.0
10.015.020.025.030.035.040.045.0
0-9employees
10-19employees
20-49employees
50-199employees
200+employees
services sector production sector

26.5
22.5
28.3
24.4
14.7
16.7
14.5
15.9
10.0
12.0
14.0
16.0
18.0
20.0
22.0
24.0
26.0
28.0
30.0
Product innovation (2004-06) Process innovation (2004-06) Exported (2006) Foreign-owned (2006)
% w
ho
are
gra
du
ates
yesno
Overall 17.9% of workforce estimated to be graduates in 2006
Percentage of Workforce with degrees by certain activities in GB
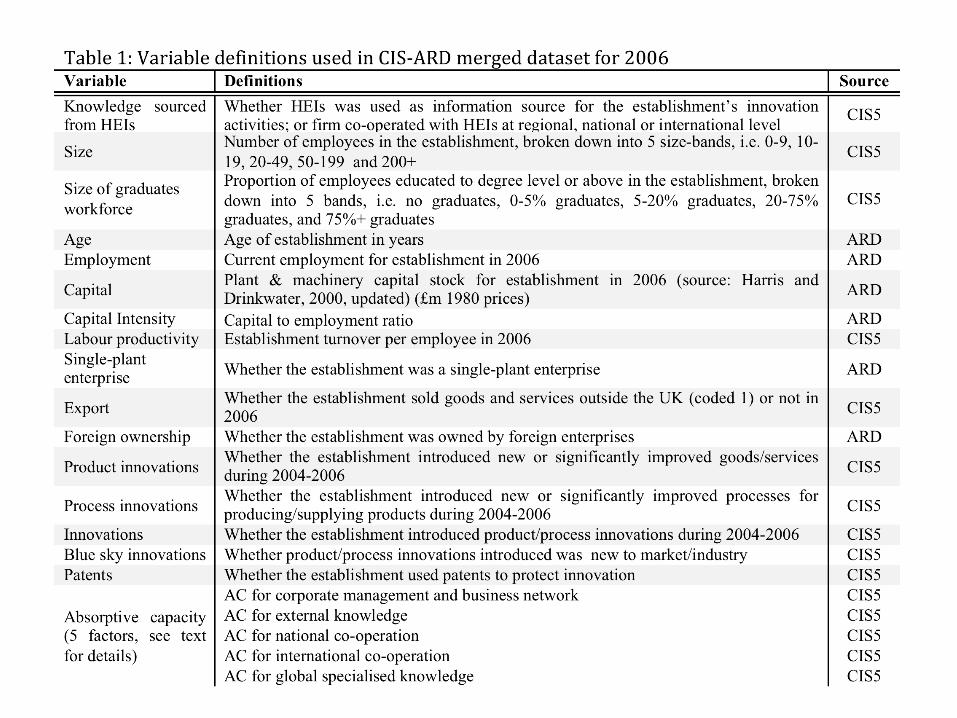

Variable definitions used in CIS-ARD merged dataset for 2006 (cont.)


Conclusions• Linkages with HEI’s for knowledge/cooperation is
significant – on average nearly 23% of firms did so in 2006– More so in production sector, larger enterprises, and NW, NE,
SE and Scotland• Some 17.9% of workforce were graduates in 2006
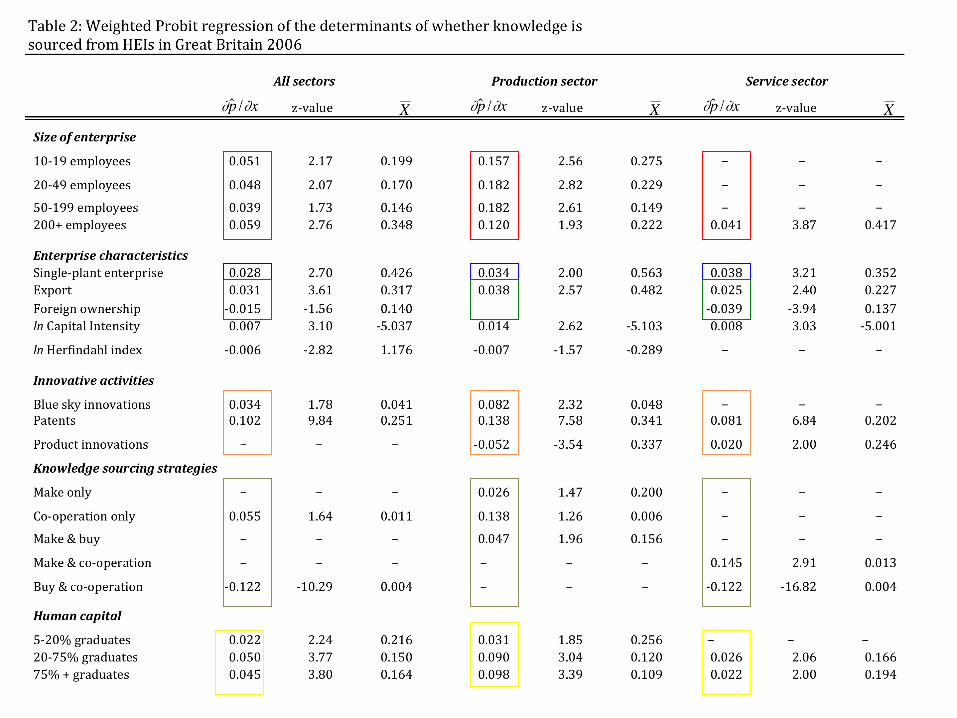
– More prevalent in innovative, internationalised firms• In terms of use of HEI’s:
– Exporters (+); foreign-owned (-)– Novel innovators (+); patenting (+); product innovators in
manufacturing (-)– Those undertaking extramural R&D & cooperation (-)
• Less need for universities?– Higher absorptive capacity (+) , especially external knowledge– When risks associated with innovation high (+); lack of
qualified personnel (+)

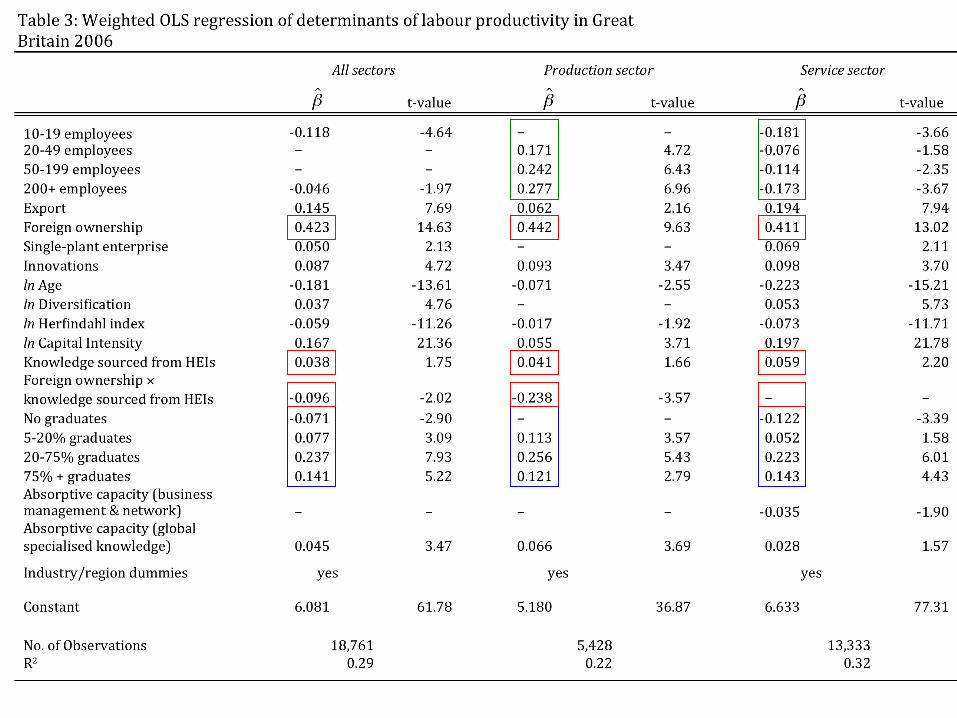
• In terms of impact on productivity:– UK-owned firms sourcing knowledge from HEI’s
benefited– Foreign-owned firms in manufacturing sourcing
knowledge from HEI’s had lower productivity• Technology-sourcing FDI?
– Firms with no graduates had lower productvity• For those with graduates, inverted U-shaped
relationship with productvity
– Larger manufacturing firms more productive• Some evidence that larger service sector firms have
lower labour productivity