the impact of the financial crisis and the recession on...
TRANSCRIPT

The impact of the financial crisis and the recession on insurance/reinsurance
Thomas Hess
Chief Economist, Swiss Re
Head of Economic Research & Consulting
SORS - Sarajewo18 June 2009

Agenda
Capital market and economic situation
Alternative scenarios
Prospects for global insurance markets
SORS - Sarajewo18 June 2009
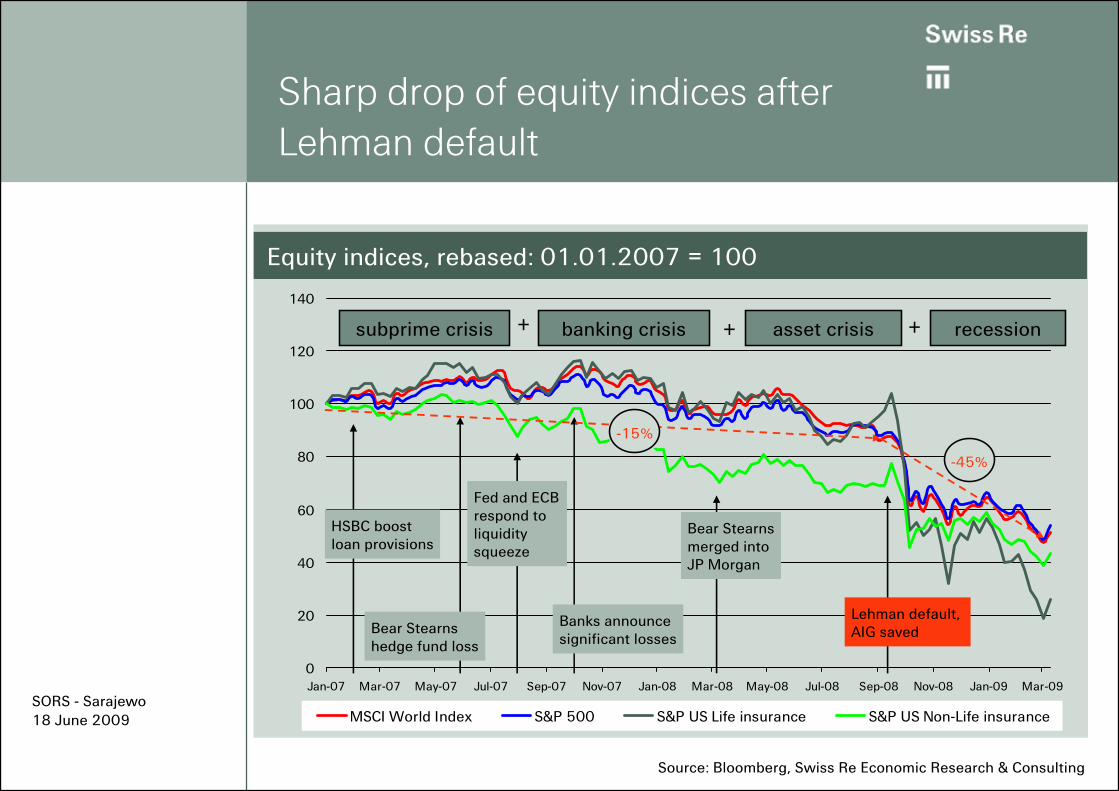
Sharp drop of equity indices after Lehman default
0
20
40
60
80
100
120
140
Jan-07 Mar-07 May-07 Jul-07 Sep-07 Nov-07 Jan-08 Mar-08 May-08 Jul-08 Sep-08 Nov-08 Jan-09 Mar-09
MSCI World Index S&P 500 S&P US Life insurance S&P US Non-Life insurance
Source: Bloomberg, Swiss Re Economic Research & Consulting
Equity indices, rebased: 01.01.2007 = 100
-45%
HSBC boost loan provisions
Bear Stearns hedge fund loss
Banks announce significant losses
Fed and ECB respond to liquidity squeeze
Bear Stearns merged into JP Morgan
Lehman default, AIG saved
subprime crisis banking crisis recessionasset crisis+ + +
-15%
SORS - Sarajewo18 June 2009

Global speculative-grade default rates
Sharp decline in corporate bond and equity values
European equities, (June 2007=100)
0
20
40
60
80
100
120
Jan
07
Apr
07
Jul 0
7
Okt
07
Jan
08
Apr
08
Jul 0
8
Okt
08
Jan
09
Apr
09
Banking sector Life insurance Non-life insurance DJ Euro Stoxx 50
+9% -2%
-53%
+-0%
0%
2%
4%
6%
8%
10%
12%
14%
16%
18%
20%
80 82 84 86 88 90 92 94 96 98 00 02 04 06 08Global speculative grade default rate
Pessimistic scenario
Moody's forecast:Baseline scenario
Optimistic scenario
Source: Moody’sSource: BloombergSORS - Sarajewo18 June 2009

Where are the deeper problems?
Too expansionary monetary policy in the US
Financial innovation
Irresponsible underwriting of US mortages
High leverage of banks (also off balance sheet)
Insufficient risk management of banks
Expectations that banks will be bailed out lead to excessive risk taking
Renumerations schemes
Problematic role of rating agencies
Problematic role of supervisorsSORS - Sarajewo18 June 2009

For many countries, the main transmission channel of the crisis is now the contraction of trade
80
85
90
95
100
105
110
115
120
125
2006 2007 2008 2009
World trade volumes in goods EurolandJapan USAUK Germany
Rapid global expansion Financial crisis Economic crisis
World trade volumes and Industrial Production in selected countries (Jan 2006=100)
Sources: CPB, DatastreamSORS - Sarajewo18 June 2009

Positive prospects for profits and growth of P%C insurers
-15
-10
-5
0
5
10
15
91 92 93 94 95 96 97 98 99 00 01 02 03 04 05 06 07 08 09 10 11 12
Primary insurance Reinsurance
Source: Swiss Re, Economic Research & Consulting, March 2009 forecasts
additional volume 2009 and 10 due to large transactions
Back to moderate growth (yoy %, infl adj.) Insurance results improve 2010/ 12
* *
*) % of premiums
% %
-15
-10
-5
0
5
10
15
20
99 00 01 02 03 04 05 06 07 08 09 10 11 12
Underwriting result Investment resultOperating result ROE after tax
%
*)*)
*)
SORS - Sarajewo18 June 2009

The need to bolster demand makes large public policy actions indispensable…
0
1
2
3
4
5
6
Saud
i Ara
bia
Spai
n
Sout
h A
fric
a
US
Aus
tral
ia
Kor
ea
Chi
na
Ave
rage
G2
0
Japa
n
Rus
sia
UK
Mex
ico
Ger
man
y
Can
ada
Indo
nesi
a
Arg
entin
a
Fran
ce
Indi
a
Bra
zil
Ital
y
Turk
ey
Discretionary fiscal stimulus Automatic stabilisers
G20: Estimated cost of discretionary measures and automatic stabilisers (% of GDP, 2008-2009)
Sources: IMF, “The State of Public Finances: Outlook and Medium-Term Policies After the 2008 Crisis”, Swiss Re ER&C
0
200
400
600
800
1'000
1'200
1'400
1'600
1'800
2000 2001 2002 2003 2004 2005 2006 2007 2008
US Euroland
Monetary base (bn local currency)
Source: Datastream
SORS - Sarajewo18 June 2009
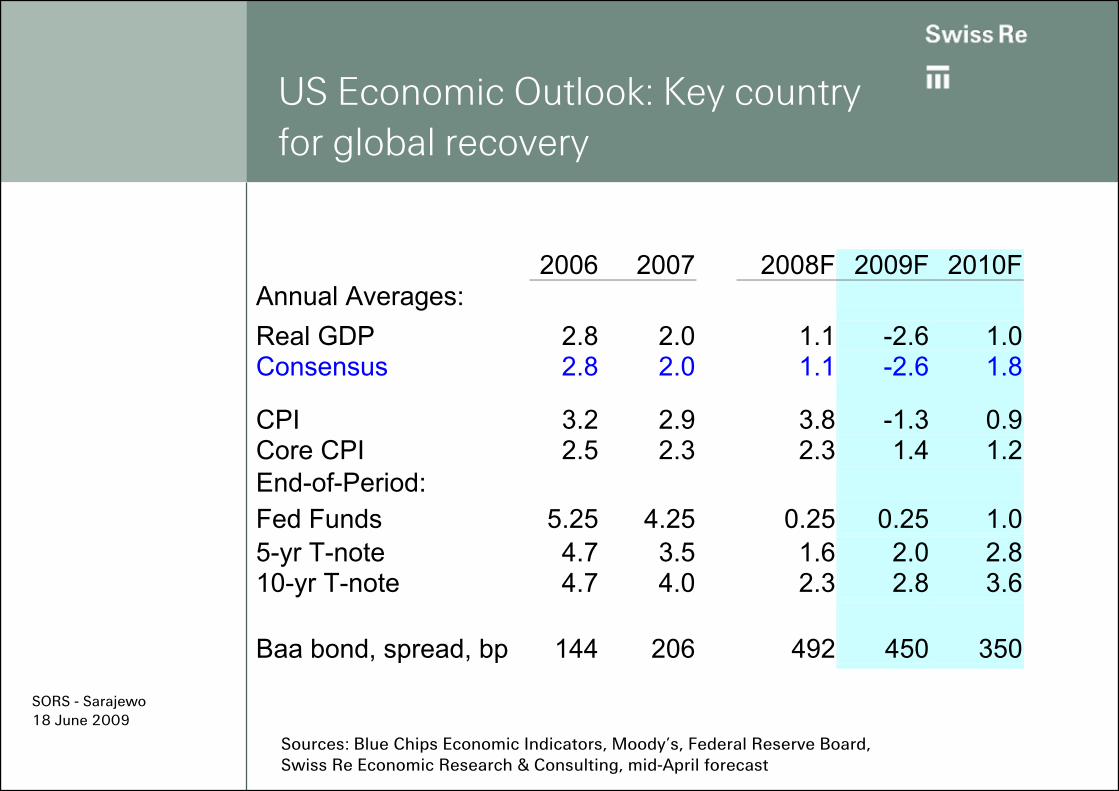
2006 2007 2008F 2009F 2010F
Annual Averages:
Real GDP 2.8 2.0 1.1 -2.6 1.0 Consensus 2.8 2.0 1.1 -2.6 1.8
CPI 3.2 2.9 3.8 -1.3 0.9 Core CPI 2.5 2.3 2.3 1.4 1.2 End-of-Period: Fed Funds 5.25 4.25 0.25 0.25 1.0 5-yr T-note 4.7 3.5 1.6 2.0 2.8 10-yr T-note 4.7 4.0 2.3 2.8 3.6 Baa bond, spread, bp 144 206 492 450 350
Sources: Blue Chips Economic Indicators, Moody’s, Federal Reserve Board, Swiss Re Economic Research & Consulting, mid-April forecast
US Economic Outlook: Key country for global recovery
SORS - Sarajewo18 June 2009

2007 2008 2009F 2010F
Real GDP growth Euroland 2.6 0.9 -3.4 0.3
UK 3.1 0.8 -4.1 -0.1Japan 2.0 -0.4 -6.3 0.4
Inflation Euroland 2.1 3.3 0.9 1.1
UK 2.3 3.6 1.2 1.0Japan 0.1 1.4 -0.9 0.5
Policy rates (eop) Euroland 4.00 2.50 1.0 1.25
UK 5.50 2.00 0.50 0.75Japan 0.46 0.10 0.05 0.75
Yields 10-yr govt bond Euroland 4.3 2.9 3.0 4.2
UK 4.5 3.1 3.1 3.6Japan 1.5 1.2 1.3 1.9
Sources: Swiss Re Economic Research & Consulting, mid-April forecast
Global overview: Down in 2009, weak recovery in 2010
SORS - Sarajewo18 June 2009

Global economic outlook
What gets us out of the recession?
– Substantial Central Bank easing, low interest rates
– Fiscal stimulus
– Lower oil/commodity prices, reduced inflation
– US consumers and housing will likely lead the way
SORS - Sarajewo18 June 2009

What happens in the recovery?
Temporary investment opportunities: Credit and equities
– Late in recession, early recovery
Government bond yields likely to remain low
– But likely to rise in 2010, 2011
Risk of inflation rises, but low inflation most likely
– Risk is low through end-2010, may not be a problem until 2012 or later
– Fiscal/monetary restraint will keep growth moderate
– Central banks are familiar with how to tighten monetary policy
– Risk is essentially political
SORS - Sarajewo18 June 2009

The crisis will cause medium term trend growth to drop slightly
GDP
GER
FR
IT
Spain
CH
AT
Real
2009
-5.6
-3.0
-4.4
-3.0
-3.7
-3.0
2010
-0.4
0.4
-0.4
- 0.7
-0.3
0.2
2014
2.3
2.4
1.9
2.0
1.5
2.3
Real GDP (yoy %-growth)
Source: IMF forecasts, April 2009
Key differentiating issues
Size and situation of the banking system
Indebtness of consumers
Extent of overvaluation of real estate prices
Importance of the export sector
Solidness of public finances
SORS - Sarajewo18 June 2009

Agenda
Capital market and economic situation
Alternative scenarios
Prospects for global insurance market
SORS - Sarajewo18 June 2009

What can happen differently?
Downside scenario 25% - deeper recession - lower interest rates 2010, credit spreads tighten later and worse stock-market
Upside scenario 15% - recession less deep; - higher interest rates 2011; credit spreads tighten earlier and better stock-markets
Bumpy: Overstimulation leads to inflation 2012-14 - recovery stronger and inflation rises to 5% or more for several years - monetary tightening will cause another recession - tightening of credit spreads followed by another widening; higher interest rates 2011-2014; stock-markets better then worse
Baseline 60%
May be combined with different
scenarios above!
The downside scenario is most severe for companies with elevated asset risks, risks for life companies are substantially increased The overstimulation scenario provides a window of opportunity to sell risky assets; it is also more positive for life companies, but causes a period of claims inflation
SORS - Sarajewo18 June 2009

Agenda
Capital market and economic situation
Alternative scenarios
Prospects for global insurance markets
SORS - Sarajewo18 June 2009

New April 2009 IMF credit loss estimates
Credit losses have been revised upwards to 4000bn
Banks losses are estimated to be 2400 bn, which is 60% of the total
Insurers have losses of 301bn (US: 218/ EU: 75bn, Japan 8 bn), which is 7% of the total of credit related losses (revised downwards!)
In addition insurers face losses from equity investments, alternative assets, real estate and participations
ER&C forecasts of 500 bn (25%) losses on shareholder capital is consistent with IMF figures (total losses on assets are higher as they are shared with life policyholders)
SORS - Sarajewo18 June 2009

In 2009-2010, a key issue will be the recapitalisation…
60
70
80
90
100
110
Dec 06 Jun 07 Dec 07 Jun 08 Dec 08E
Shareholder’s EquityIndex Q2 2007=100, USD*
Sources: Annual Reports, Bloomberg, Swiss Re Economic Research & Consulting
+10%
-26%
*26 large Insurers
In 2008, the non-life insurance industry lost about 20% and the life insurance industry between 30-40% of the capital base
SORS - Sarajewo18 June 2009
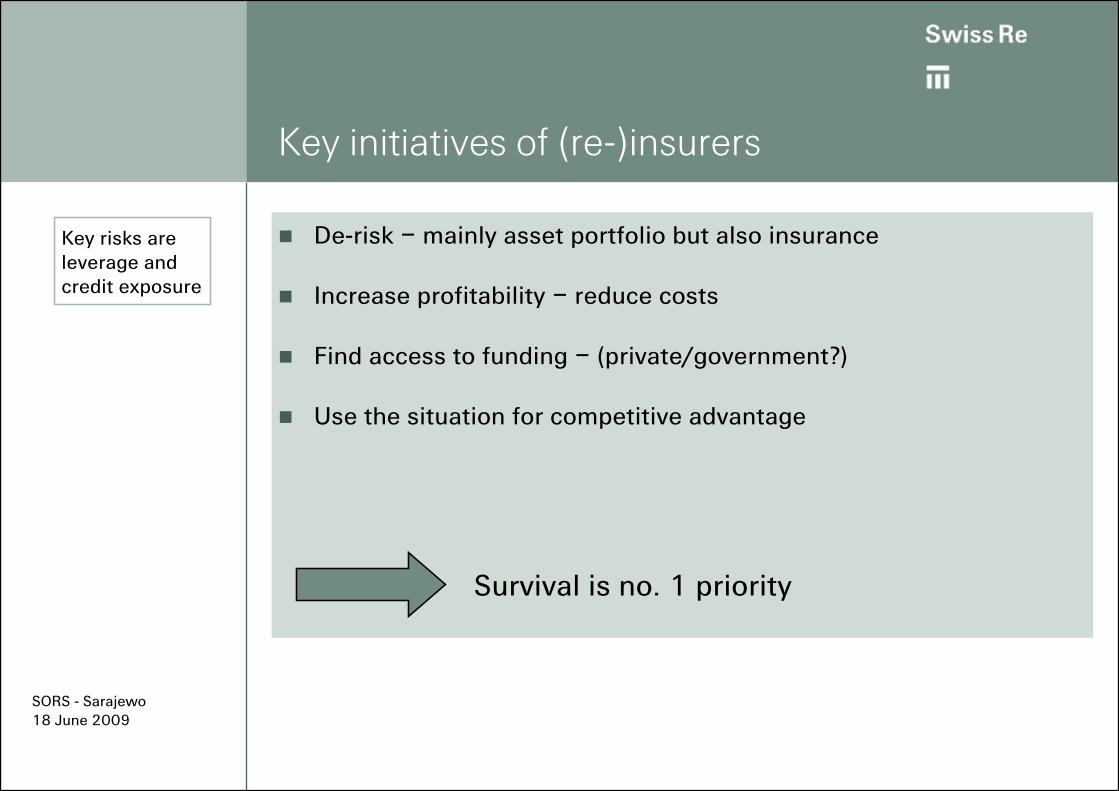
Key initiatives of (re-)insurers
De-risk – mainly asset portfolio but also insurance
Increase profitability – reduce costs
Find access to funding – (private/government?)
Use the situation for competitive advantage
Survival is no. 1 priority
Key risks are leverage and credit exposure
SORS - Sarajewo18 June 2009
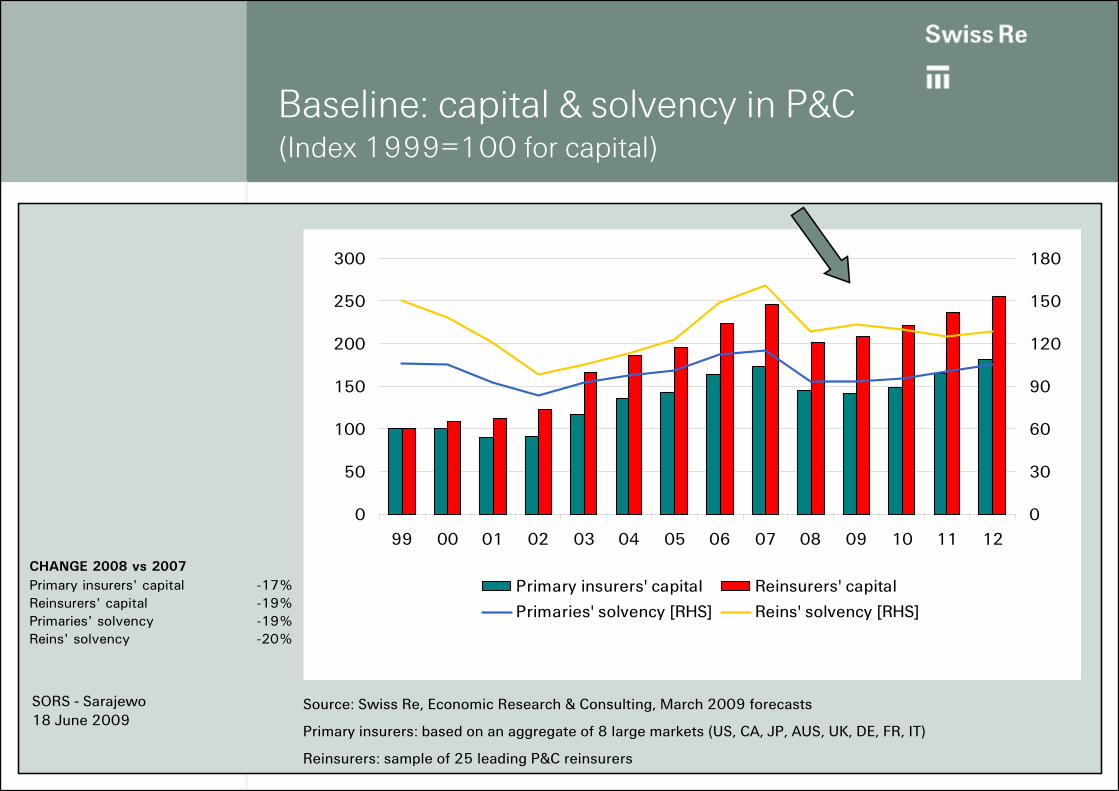
Baseline: capital & solvency in P&C (Index 1999=100 for capital)
0
50
100
150
200
250
300
99 00 01 02 03 04 05 06 07 08 09 10 11 120
30
60
90
120
150
180
Primary insurers' capital Reinsurers' capital
Primaries' solvency [RHS] Reins' solvency [RHS]
CHANGE 2008 vs 2007Primary insurers' capital -17%Reinsurers' capital -19%Primaries' solvency -19%Reins' solvency -20%
Source: Swiss Re, Economic Research & Consulting, March 2009 forecasts
Primary insurers: based on an aggregate of 8 large markets (US, CA, JP, AUS, UK, DE, FR, IT)
Reinsurers: sample of 25 leading P&C reinsurers
SORS - Sarajewo18 June 2009

Positive prospects for growth and profitability non-life
-15
-10
-5
0
5
10
15
91 92 93 94 95 96 97 98 99 00 01 02 03 04 05 06 07 08 09 10 11 12
Primary insurance Reinsurance
Source: Swiss Re, Economic Research & Consulting, March 2009 forecasts
Back to moderate growth (yoy %, infl adj.)
-30
-20
-10
0
10
20
30
99 00 01 02 03 04 05 06 07 08 09 10 11 12
U/w result Investment resultOperating result RoE after tax
%Reinsurance results improve 2010/ 12
* *
*) % of premiums
% %
SORS - Sarajewo18 June 2009
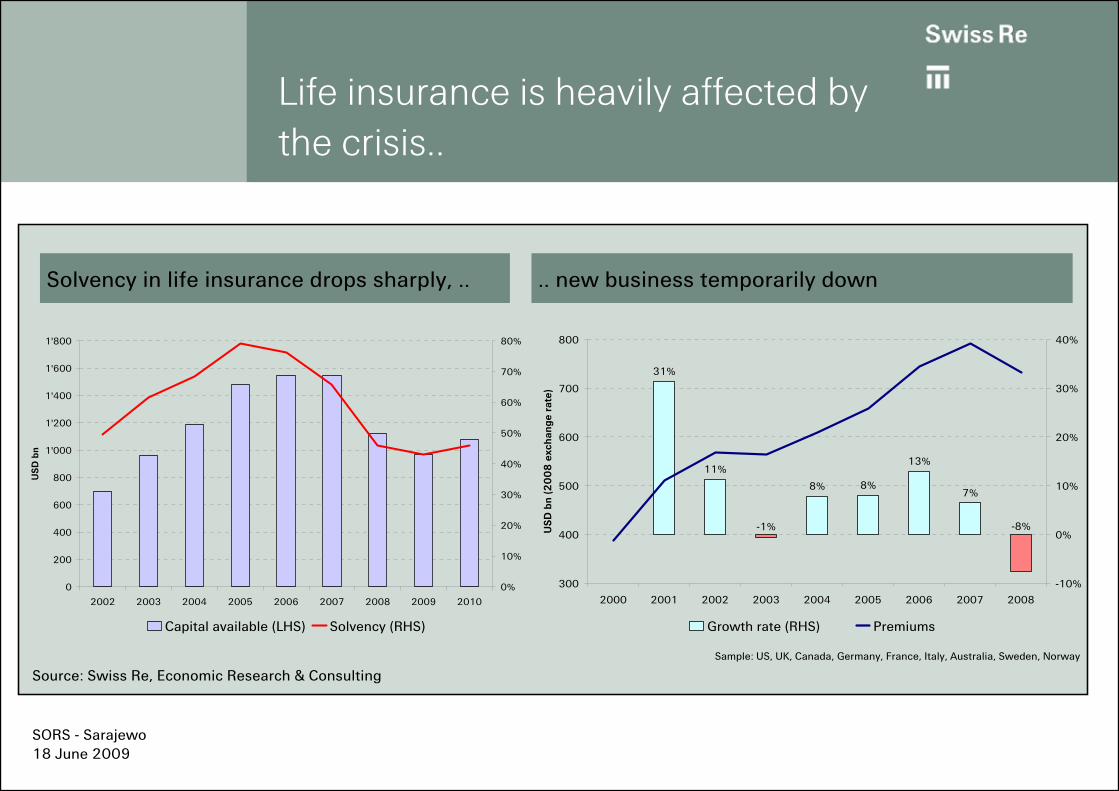
Life insurance is heavily affected by the crisis..
Solvency in life insurance drops sharply, .. .. new business temporarily down
Source: Swiss Re, Economic Research & Consulting
0
200
400
600
800
1'000
1'200
1'400
1'600
1'800
2002 2003 2004 2005 2006 2007 2008 2009 2010
USD
bn
0%
10%
20%
30%
40%
50%
60%
70%
80%
Capital available (LHS) Solvency (RHS)
Sample: US, UK, Canada, Germany, France, Italy, Australia, Sweden, Norway
31%
11%
8% 8%
13%
7%
-8%-1%
300
400
500
600
700
800
2000 2001 2002 2003 2004 2005 2006 2007 2008
USD
bn
(20
08
exc
hang
e ra
te)
-10%
0%
10%
20%
30%
40%
Growth rate (RHS) Premiums
SORS - Sarajewo18 June 2009

.. and lots of companies face severe solvency issues
BVPS PriceGenworth Financial -33% -89%Hartford -50% -81%ING -24% -73%China Life -12% -68%Lincoln National -30% -68%Prudential (US) -39% -67%Principal Financial -67% -67%Protective Life -69% -65%Allianz -30% -49%Sun Life 2% -49%Manulife 6% -49%Friends Provident -20% -47%Metlife -37% -43%AXA -20% -42%Aviva -15% -42%Prudential (UK) -19% -42%Legal & General -29% -41%Generali -27% -37%Zurich -24% -32%Standard Life 5% -20%Source: Bloomberg
Change in
Book value and stock prices end 08/07Life insurers are hit much harder than non-life insurers due to their higher asset leverage
SORS - Sarajewo18 June 2009
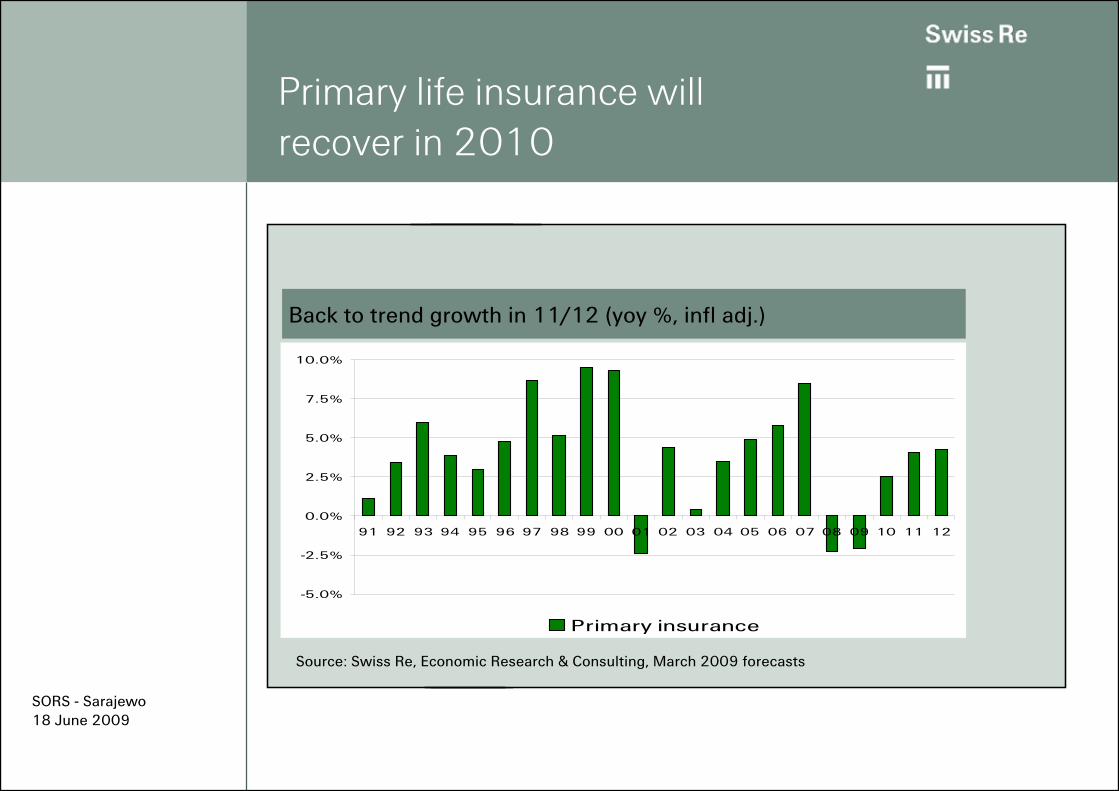
Primary life insurance will recover in 2010
Source: Swiss Re, Economic Research & Consulting, March 2009 forecasts
Back to trend growth in 11/12 (yoy %, infl adj.)
-5.0%
-2.5%
0.0%
2.5%
5.0%
7.5%
10.0%
91 92 93 94 95 96 97 98 99 00 01 02 03 04 05 06 07 08 09 10 11 12
Primary insurance
SORS - Sarajewo18 June 2009
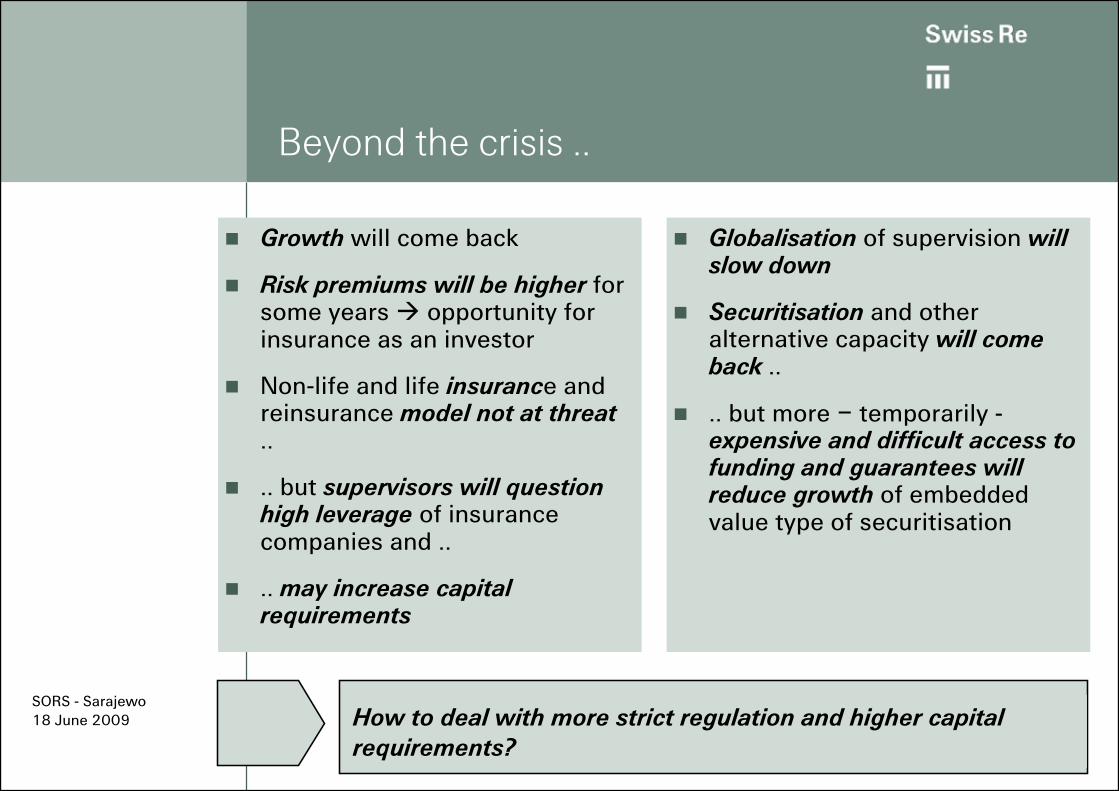
How to deal with more strict regulation and higher capital requirements?
Beyond the crisis ..
Growth will come back
Risk premiums will be higher for some years opportunity for insurance as an investor
Non-life and life insurance and reinsurance model not at threat ..
.. but supervisors will question high leverage of insurance companies and ..
.. may increase capital requirements
Globalisation of supervision will slow down
Securitisation and other alternative capacity will come back ..
.. but more – temporarily -expensive and difficult access to funding and guarantees will reduce growth of embedded value type of securitisation
SORS - Sarajewo18 June 2009

Huge demand ..
Reinsurance is a superior risk mgmt tool (flexible, quickly available and discreet)
Solvency problems of companies increases need for reinsurance
.. but they may not afford it
Lack of alternative risk and capital mgmt instruments
.. in particular for companies hard hit resp. smaller companies
Reinsurance will play an important role in coping with the crisis
… may not be fully met
Lack of capacity, including alternative sources of reinsurance capacity
Risk transfer may involve transfer of problematic assets
Reinsurers will play an important role in managing the crisis and in the recapitalisation process

Parts of the alternative risk transfer suffer from the crisis
What works?- CAT bonds non-life and life- ILW (insuance linked warrants)- Weather derivatives
What doesn‘t wirk so well?- Embedded value securitisation life- Side car capacity
Prospect remain favorable - questions marks regarding embedded value securitisation life
SORS - Sarajewo18 June 2009

Limited effects of the crisis on (re-) insurance risk transfer …
Insurance and reinsurance markets continue to work
Capacity declined but there is no shortage
Policyholders kept trust in the industry
Alternative risk tranfer was affected but will recover - ILS- ILW- Sidecars- Insurance derivative markets- Embedded value securitisation life (?)
SORS - Sarajewo18 June 2009

… but credit related activities will be more closly monitiored in future
Monoliners will hardly provide financial guarantees for capital market products in future
ALM will get even more important
Embedded options in Life insurance will get more attention, the same for market risks of investments
Supervisors will pay more attention to tail risk, liquidity risk and leverage of insurers (also related to derivatives)
SORS - Sarajewo18 June 2009

Conclusion
The economic environment remains challenging and demands for strict risk management
Low interest rates and the need for recapitalisation ask for solid underwriting results
As soon as financial markets stabilise profitability will improve; the recovery will be bumpy
Non-life will do better than life insurance until we see capital markets forcefully bouncing back
Insurance and reinsurance business model is not at stakeSORS - Sarajewo
18 June 2009