the impact of terrorism and conflicts on growth in asia, 1970-2004
TRANSCRIPT

The Impact of Terrorism and Conflicts on Growth in Asia, 1970–2004
Khusrav Gaibulloev and Todd Sandler
August 2008
ADB Institute Discussion Paper No. 113

ADBI’s discussion papers reflect initial ideas on a topic, and are posted online for discussion. ADBI encourages readers to post their comments on the main page for each discussion paper (given in the citation below). Some discussion papers may develop into research papers or other forms of publication.
Suggested citation:
Gaibulloev, Khusrav and Todd Sandler. 2008. The Impact of Terrorism and Conflicts on Growth in Asia, 1970–2004. ADBI Discussion Paper 113. Tokyo: Asian Development Bank Institute. Available: http://www.adbi.org/discussion-paper/2008/07/25/2665.terrorism.impact.growth.conflicts.asia.1970.2004/
Asian Development Bank Institute Kasumigaseki Building 8F 3-2-5 Kasumigaseki, Chiyoda-ku Tokyo 100-6008, Japan Tel: +81-3-3593-5500 Fax: +81-3-3593-5571 URL: www.adbi.org E-mail: [email protected] © 2008 Asian Development Bank Institute
Khusrav Gaibulloev is a PhD candidate and Todd Sandler is the Vibhooti Shukla Professor of Economics and Political Economy at the University of Texas at Dallas in Dallas, Texas.
The views expressed in this paper are the views of the authors and do not necessarily reflect the views or policies of ADBI, the Asian Development Bank (ADB), its Board of Directors, or the governments they represent. ADBI does not guarantee the accuracy of the data included in this paper and accepts no responsibility for any consequences of their use. Terminology used may not necessarily be consistent with ADB official terms.

ADBI Discussion Paper 113 Gaibulloev and Sandler
Abstract
This paper quantifies the impact of terrorism and conflicts on income per capita growth in Asia for 1970–2004. Our panel estimations show that transnational terrorist attacks had a significant growth-limiting effect. An additional terrorist incident per million persons reduces gross domestic product (GDP) per capita growth by about 1.5%. In populous countries, many additional attacks are needed to achieve such a large impact. Transnational terrorism reduces growth by crowding in government expenditures. Unlike developing countries, developed countries are able to absorb terrorism without displaying adverse economic consequences; an internal conflict has the greatest growth concern, about twice that of transnational terrorism. Conflict variables are associated with smaller investment shares and increased government spending, with the crowding in of government spending being the dominant influence. For developing Asian countries, intrastate and interstate wars have a much greater impact than terrorism does on the crowding-in of government spending. When regime types—democratic and autocratic—are taken into account, in our research, we found that the precision of the estimates increases with the increasing significance of transnational terrorist attacks.
Policy recommendations indicate the need for rich Asian countries to assist their poorer neighbors in coping with the negative growth consequences of political violence. Failure to assist may result in region-wide repercussions. This is particularly relevant as production becomes fragmented in Asia in order to profit from comparative advantage and as regional infrastructure networks link Asia to exploit scale economies. In the latter case, conflict and terrorism in one country can create bottlenecks with region-wide economic consequences. Moreover, prime-target Western countries—e.g., the United States and the United Kingdom—have a responsibility to bolster Asian defenses against terrorism as attacks against Western interests have been shifted, in part, to Asian venues since the 9/11 attacks in the United States. The Association of South East Asian Nations (ASEAN) and European Union link can assist with coordinating efforts to quell conflicts and eliminate terrorism, but this requires putting recent declarations into practice. The Asian Development Bank and the World Bank could play pivotal roles, especially after a conflict ends, to channel aid for reconstruction so that once-embattled countries can recover rapidly. Nongovernmental organizations and the United Nations could also assist in this post-conflict recovery. The Asian Development Band and ASEAN could coordinate and fund counterterrorism spending to curb overspending on defensive measures and bolster under-spending on proactive measures. The United Nations could assist in peacekeeping operations for internal conflicts.
JEL Classification: H56, D74, O40

ADBI Discussion Paper 113 Gaibulloev and Sandler
Contents
I. Introduction 1
II. Definitions, Economic Growth, and Past Literature 3
III. Methodology 7
A. Empirical specification 7 B. Data 8
IV. Estimation and Results 13
V. Introducing Regime Types 19
VI. Concluding Remarks and Policy Recommendations 21
References 23
Appendix: Tables 26

ADBI Discussion Paper 113 Gaibulloev and Sandler
1
I. INTRODUCTION
Modern-day terrorists are bent on causing sufficient harm to a society so as to force its government to concede to the terrorists’ demands. The harm may be in terms of human and/or economic losses—e.g., the al-Qaida training manual invokes followers to attack “vital economic centers” (WorldNetDaily 2003). Both kinds of losses expose a government’s inability to protect its people and property, thereby causing a loss in citizen confidence and government legitimacy. When terrorist attacks are sufficiently deadly, costly, and persistent, an atmosphere of fear and terror may pervade the society, making virtually everyone feel at risk, which is the terrorist group’s aim. If a besieged government views the anticipated costs of future terrorist actions as greater than the costs of conceding (including lost reputation) to terrorist demands, then the government will grant some accommodation. A determined terrorist organization may obtain its demands quicker by augmenting the economic consequences of its terrorist campaign. Thus, Euskadi Ta Askatasuna (ETA), the Basque group, targeted hotels and resorts in the 1980s to hurt tourism in Spain (Mickolus, Sandler, and Murdock 1989). Jemaah Islamiyah’s car-bombing attack on a Bali nightclub on 12 October 2002 was intended not only to kill Westerners but also to cripple Bali’s lucrative tourist industry. A subsequent JI attack on a Marriott hotel in Kuningan, Jakarta, in 2003 had economic ramifications on tourism. Although Abu Sayyaf is based on the southern Philippine islands of Sulu and Basilan, a few high-profile attacks by Abu Sayyaf in Manila caused the Philippine government to reallocate some expenditure to security, thereby crowding out growth-promoting public projects. Much of these security expenditures address the bulk of Abu Sayyaf’s activities in the south. On 11 September 2001 (henceforth, 9/11), the al-Qaida attack against New York City’s World Trade Center, an icon of the capitalist world, created US$80 to US$90 billion in direct and indirect economic losses and temporarily impacted stock markets worldwide (Chen and Siems 2004; Kunreuther, Michel-Kerjan, and Porter 2003).
Terrorism can potentially affect economic growth in the short run through a number of channels. Such attacks can increase uncertainty which limits investments and diverts foreign direct investment (Abadie and Gardeazabal 2003, 2008; Enders and Sandler 1996; Enders, Sachsida, and Sandler 2006). For developing countries, foreign direct investment is an important source of saving to fund investment. Terrorism campaigns lead to government expenditures on defensive actions to strengthen targets and proactive measures to capture terrorists and their assets. This increased government spending on security can crowd out more growth-enhancing public and private investments (Blomberg, Hess, and Orphanides 2004; Gaibulloev and Sandler 2008). Public investment in the form of social overhead capital (e.g., canals, highways, and bridges) is especially important to bolster growth in developing countries. Terrorism also hinders growth by raising the cost of doing business in terms of higher wages, larger insurance premiums, and greater security expenditures. These higher costs result in reduced profits and, thus, smaller returns on investment. Terrorist attacks can also destroy infrastructure, thereby leading to business disruptions. The Irish Republican Army attacks on London’s financial district at the Baltic Exchange (10 April 1992) and Bishopsgate (24 April 1993) resulted in £800 million and £350 million in direct damages, respectively. The 7 July 2005 attacks on the London transport system resulted in over £1 billion in damages. Finally, terrorism can impact some key industries—the airline, tourism, and export sectors—which can reduce gross domestic product (GDP) and growth (Drakos 2004; Drakos and Kutan 2003; Enders, Sandler, and Parise 1992; Ito and Lee 2005; Nitsch and Schumaker 2004).
Similarly, internal (i.e., intrastate or civil wars) and external conflicts can also reduce growth by destroying human, private, and public capital. Civil wars result in a flight of capital; the amount of private wealth held abroad more than doubles during intrastate conflicts (Collier et al. 2003). Conflicts, like terrorism, increase uncertainty thereby decreasing investment. In addition, internal conflicts almost double the share of GDP devoted to defense—from about 2.8% to 5%—which limits spending on social overhead capital and health (Collier et al., 2003). Such diversion of public spending not only crowds out more productive forms of

ADBI Discussion Paper 113 Gaibulloev and Sandler
2
investment but also makes a conflict-ridden country prone to diseases (Ghobarah, Huth, and Russett 2003). Conflict-torn developing countries may experience decreased growth from reduced aid as donor countries worry that aid may be channeled to finance military activities rather than to alleviate poverty. As in the case of terrorism, internal and external conflicts raise the costs of doing business. Nearby conflicts can reduce economic growth by disrupting supply lines, creating refugee inflows, causing border skirmishes, and increasing security spending. Murdoch and Sandler (2002, 2004) showed that each war in a country’s borders as nearby countries divert resources to defense to ward off the spread of conflict (Murdoch and Sandler 2004). This heightened risk augments uncertainty region-wide and reduces investment and growth.
This study has six purposes. First, and foremost, we present panel estimates for a sample of 42 Asian countries to quantify the impact of terrorism and conflicts on income per capita growth for 1970–2004. Panel estimation methods control for country-specific and time-specific unobserved heterogeneity. Second, we distinguish the influence of terrorism on economic growth from that of internal and external conflicts. Third, these influences are investigated for cohorts of developed and developing countries to ascertain whether development can better allow a country to absorb the impact of political violence. Fourth, econometric estimations relate violence-induced growth reductions to two pathways—reduced investment and increased government expenditures. Fifth, a host of diagnostic and sensitivity tests to support our empirical specifications. Last, we draw some policy conclusions.
Earlier studies on the economic consequences of terrorism growth have focused either on the world (Blomberg, Hess, and Orphanides 2004; Tavares 2004) or on Europe (Gaibulloev and Sandler 2008). For a much smaller Asian sample and a different time period, Blomberg, Hess, and Orphanides (2004) did not uncover any significant effect of terrorism on economic growth. Our larger sample also allows us to distinguish the growth consequences of terrorism between developing and developed countries.
For the entire Asian sample, transnational terrorism and internal conflict have significantly adverse consequences for growth, with the largest impact coming from internal conflicts. Developing Asian countries are much more affected by political violence than their more developed counterparts, suggesting that development greatly cushions the impact of terrorism and conflicts. Not surprisingly, political violence adversely affects investment, while it increases government spending. Transnational terrorism and conflicts have a particularly strong influence in augmenting government spending, with internal and external conflicts exerting the stronger impact.
The remainder of the paper contains five main sections. Section 2 presents a background for the discussion, including definitions, the primary influences on income per capita growth, and a brief review of the related literature. Section 3 includes the empirical specification and data. Estimations and results then follow in Section 4. In Section 5, we present estimates where regime type is taken into account and the general terrorism variable is dropped. Concluding remarks and policy implications are presented in Section 6.

ADBI Discussion Paper 113 Gaibulloev and Sandler
3
II. DEFINITIONS, ECONOMIC GROWTH, AND PAST LITERATURE
Terrorism is the premeditated use or threat to use violence by individuals or sub-national groups in order to obtain a political or social objective through the intimidation of a large audience beyond that of the immediate victims. Terrorists try to circumvent the democratic process by extorting concessions through the pressures that a targeted citizenry may bring on its government to end the violence. The above definition excludes state terror, where the state applies violence to intimidate its citizens (e.g., Stalin in the Soviet Union), but includes state-sponsored terrorism where a state assists (e.g., through safe havens, intelligence, or funding) a terrorist group. Terrorists employ myriad modes of attack—e.g., bombings, assassinations, kidnappings and skyjackings—the mix of which is chosen in order to optimally trade off risks and returns (Sandler, Tschirhart, and Cauley 1983). Terrorists try to make their attacks appear random so as to maximize an audience’s anxiety as risks seem ubiquitous and unpredictable. In truth, attacks are not random but are planned to best exploit perceived target weaknesses and value. A terrorist group consists of members of an organization, who employ terrorist attacks to further a political objective.
Terrorist events are usually subdivided into two varieties: domestic and transnational terrorism. Domestic terrorism is homegrown with consequences for only the host country, its institutions, citizens, property, and policies. As such, domestic terrorism involves perpetrators, victims, and targets solely from the host country. Any terrorist demands associated with a domestic terrorist incident are directed at the people or institutions from the venue country. Many suicide bombings by the Liberation Tigers of Tamil Eelan (a.k.a. the Tamil Tigers) are acts of domestic terrorism, such as the bombings that do not injure or murder foreigners carried out by Abu Sayyaf in the Philippines. Through its victims, targets, supporters, perpetrators, or implications, transnational terrorism concerns more than a single country. If terrorists cross a border to perpetrate their acts, then the attacks are transnational. Terrorist incidents that begin in one country and conclude in another country (e.g., an international skyjacking or the mailing of a letter bomb to another country) are transnational terrorist events. If a terrorist incident involves the citizens from two or more countries as victims or perpetrators, then it is a transnational terrorist act.
The kidnapping (and subsequent murder) in 2002 of Wall Street Journal reporter Daniel Pearl in Karachi, Pakistan was a transnational terrorist incident. In addition, the hijacking of Indian Airlines flight 814, en route from Katmandu to New Dehli, on 24 December 1999 is an example of transnational terrorism. After stops in Amritsar (India) and Dubai, the plane landed in Kandahar, Afghanistan, where the incident finally concluded on 31 December 1999, with the four Pakistani terrorists receiving some of their demands and safe passage (Mickolus and Simmons 2002). The toppling of the World Trade Center towers on 9/11 was a transnational terrorist event, because the victims hailed from many countries, the mission had been planned and financed abroad, the terrorists were foreigners, and the implications were global. The bombing of foreign-owned investments for political reasons is a transnational terrorist incident, in which foreign direct investment may be persuaded over time to seek a safer country. For the period of this study (1970–2004), both domestic and transnational terrorism plagued Asian countries. For example, the Tamil Tigers and Abu Sayyaf engaged in both types of attacks.
Internal conflicts include intrastate wars, where all violence is confined within a country’s borders. Such conflicts typically concern opposition groups fighting for territory or political rights. At times, internal conflict may also be between ethnic groups with opposing interests. We used the Uppsala Conflict Data Program/International Peace Research Institute Oslo (UCDP/PRIO) Armed Conflict Dataset, Version 4–2007 (Gleditsch et al. 2002) and hence applied their definitions. This is the most complete and up-to-date dataset on conflicts currently available. Conflict is “internal” when it involves the home government and domestic opposition groups; conflict is “internationalized internal” when it involves the home government, domestic opposition groups, and other countries. The latter may provide support to one of the adversaries or else dispatch some troops to the conflict. As is common
ADBI Discussion Paper 113 Gaibulloev and Sandler
4
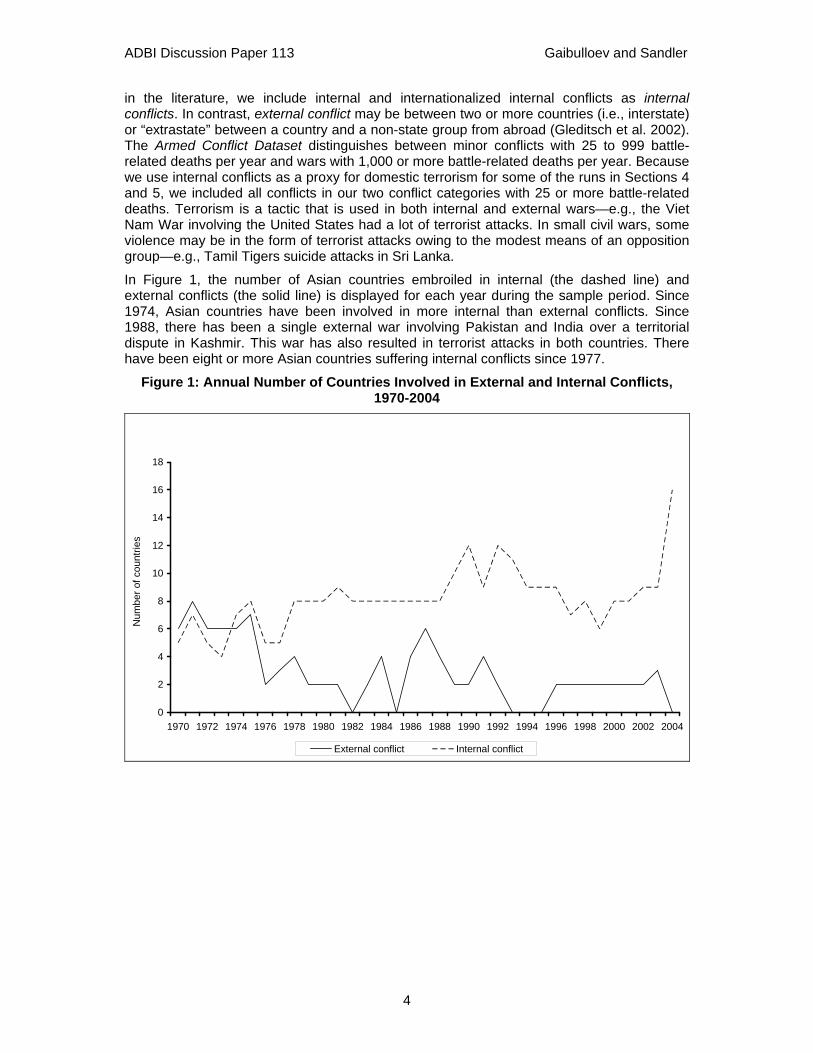
in the literature, we include internal and internationalized internal conflicts as internal conflicts. In contrast, external conflict may be between two or more countries (i.e., interstate) or “extrastate” between a country and a non-state group from abroad (Gleditsch et al. 2002). The Armed Conflict Dataset distinguishes between minor conflicts with 25 to 999 battle-related deaths per year and wars with 1,000 or more battle-related deaths per year. Because we use internal conflicts as a proxy for domestic terrorism for some of the runs in Sections 4 and 5, we included all conflicts in our two conflict categories with 25 or more battle-related deaths. Terrorism is a tactic that is used in both internal and external wars—e.g., the Viet Nam War involving the United States had a lot of terrorist attacks. In small civil wars, some violence may be in the form of terrorist attacks owing to the modest means of an opposition group—e.g., Tamil Tigers suicide attacks in Sri Lanka.
In Figure 1, the number of Asian countries embroiled in internal (the dashed line) and external conflicts (the solid line) is displayed for each year during the sample period. Since 1974, Asian countries have been involved in more internal than external conflicts. Since 1988, there has been a single external war involving Pakistan and India over a territorial dispute in Kashmir. This war has also resulted in terrorist attacks in both countries. There have been eight or more Asian countries suffering internal conflicts since 1977.
Figure 1: Annual Number of Countries Involved in External and Internal Conflicts, 1970-2004
0
2
4
6
8
10
12
14
16
18
1970 1972 1974 1976 1978 1980 1982 1984 1986 1988 1990 1992 1994 1996 1998 2000 2002 2004
External conflict Internal conflict
Num
ber o
f cou
ntrie
s

ADBI Discussion Paper 113 Gaibulloev and Sandler
5
To provide a perspective on Asian conflicts as compared with other regions, Figure 2 indicates the number of conflicts in each of five different regions for each sample year. If a conflict in Asia lasted for, say, eight years, then we recorded Asia as having eight “conflict years” for this single conflict. During 1970–2004, there were 1,339 conflict years worldwide, with Asia having the largest share (39%) of the total, followed by Africa with 32%. Throughout the sample period, 94% of conflict years globally were due to internal conflicts. The number of Asian conflicts peaked during the late 1980s and early 1990s and has fallen thereafter. Since 2000, the number of conflicts in Asia has fluctuated between 12 and 17 per year.
Figure 2: Armed Conflicts by Region, 1970-2004
0
10
20
30
40
50
60
1970
1972
1974
1976
1978
1980
1982
1984
1986
1988
1990
1992
1994
1996
1998
2000
2002
2004
Africa Americas Asia Europe Middle East
Num
ber o
f Con
flict
s
We now turn to three important determinants of income per capita growth (growth). The initial level of income per capita (y) is a positive influence on economic growth owing to the notion of convergence, whereby the income per capita of a poorer country outpaces that of a richer country (Barro 1991; Barro and Sala-i-Martin 1992). Convergence hinges on diminishing returns, in which countries are better able to add to output when there is less initial output and input. Very large growth rates are characteristic of post-war economies, after output and capital have been destroyed and the country is starting from a more modest base (Olson 1982). Convergence assumes that comparison countries possess identical production functions and transition equations, but differ in their income per capita. The latter assumption may hold for many Asian countries at similar stages of development that confront analogous production conditions. The investment share ( )I GDP is a second essential determinant of income per capita growth. Higher shares give rise to greater capital accumulation, which fosters growth through capital and embodied technological change. A third influence on growth is trade openness (open), measured by the ratio of the sum of exports and imports to GDP. Openness may bolster growth as augmented exports increase aggregate demand while larger imports provide raw materials and, for developing countries, technology transfers. Rodrik (1999), however, felt that the benefits of openness on growth in developing countries are overstated unless a complementary set of policies is put in place that promotes the accumulation of physical and human capital.

ADBI Discussion Paper 113 Gaibulloev and Sandler
6
Income per capita growth may also be adversely affected by political violence in terms of alternative forms of terrorism and/or conflicts (Barro 1991; Blomberg, Hess, and Orphanides 2004). Terrorism and conflicts augment uncertainty and result in a loss of investor confidence. Political violence also limits economic growth by raising government spending on security. In recent years, an extensive body of literature has developed on the economic consequences of terrorism (Sandler and Enders 2008). Blomberg, Hess, and Orphanides (2004) and Tavares (2004) showed that each year of transnational terrorism reduces income per capita growth by 0.048% and 0.029%, respectively. Tavares (2004) went on to show that countries with more political rights are better able to withstand transnational terrorist attacks. In a recent study of Western Europe, Gaibulloev and Sandler (2008) distinguished between domestic and transnational terrorist attacks and found that each additional transnational terrorist incident per million persons reduced economic growth by about 0.4 percentage points in a given year. Domestic terrorism has a much smaller effect on growth. Two careful country studies applied novel methods to investigate the negative impact of terrorism on income per capita. For the Basque region of Spain, Abadie and Gardeazabal (2003) estimated a 10% fall in per capita income over a twenty-year period when ETA engaged in an active terrorist campaign. Eckstein and Tsiddon (2004) applied a vector autoregressive (VAR) analysis to show that Israel lost 10% of its per capita income during the three-year intifada beginning in the fourth quarter of 2000. In effect, terrorism reduced Israeli economic growth to zero during this violent era.
In a recent survey, Sandler and Enders (2008) identified some unifying principles of the economic impact of terrorism. First, large developed economies are able to withstand terrorism and display little macroeconomic consequences. This is traced, in part, to these economies’ ability to regain people’s confidence through enhanced security. Advanced economies can also apply monetary and fiscal policy to curb the economic effects of large terrorist events, such as the United States’ (US) actions following 9/11 (Enders and Sandler 2006a). Second, small, terrorism-plagued developing economies suffer significant macroeconomic impacts from terrorism. Third, terrorism-prone sectors suffer substantial losses when attacked. Fourth, the immediate costs of most terrorist attacks are localized, thereby causing a substitution of economic activities from relatively vulnerable sectors to relatively safe sectors. This substitutability allows large diversified economies to cushion losses in economic activities.
A large and growing body of literature has identified the influence of intrastate conflicts on growth.1 This literature has not only quantified the growth consequences of intrastate wars, but has also shown that civil wars’ onset depends on slow growth, poverty, and past wars. Collier and Hoeffler (2004) demonstrated that natural resource dependency can also result in intrastate wars, fueled by greed and funded by diamonds, oil, and other precious resources.
1 For general principles on the influences of intrastate conflicts on economic growth, see Sambanis (2002).

ADBI Discussion Paper 113 Gaibulloev and Sandler
7
III. METHODOLOGY
A. Empirical specification
Following the example set by Blomberg, Hess, and Orphanides (2004), we specified three estimation equations:
( ) ( )0 1 1 2 3 4 51 1ln ln /it it it itit it
growth y open I GDP terror externalβ β β β β β− − −= + + + + + (1)
6 it i t itinternal vβ α λ+ + + + ,
( ) ( )0 1 1 2 3 4 51/ ln lnit it it itit it
I GDP y open terror external internalγ γ γ γ γ γ− −= + + + + + (2)
itti εημ +++ ,
( ) ( )0 1 1 2 3 4 51/ ln lnit it it itit it
G GDP y open terror external internalφ φ φ φ φ φ− −= + + + + + (3)
itti ζψδ +++ .
Equations (1)–(3) examine the determinants of the income per capita growth rate, the investment share, and the government spending share (G/GDP), respectively, where i = 1, …, N represents the country and t = 1, …, T indexes the time period. The independent variable terror is a measure of terrorist attacks, which is either transnational terrorist incidents or all incidents (both transnational and domestic), internal denotes internal conflicts, and external measures external conflicts. βs, γs, and ϕs are regression coefficients, while the remaining Greek letters indicate the disturbances. In Equations (1)–(3), each disturbance consists of three components: unobservable (time-invariant) country effect, subscripted with i; unobservable time effect, subscripted with t; and the classical random error. For example, iα is the unobservable country-specific effect, tλ is the unobservable time-specific effect, and itν is the stochastic error term. In Equation (1), political violence variables are added to the main determinants of economic growth. Equations (2)–(3) identify the potential channels through which the political violence variables slow down economic growth by either reducing investments or augmenting government spending through security expenditures.2
Our empirical approach was based on the behavior of the unobservable effects (see, e.g., Baltagi 2005). We performed tests to examine the presence of unobservable effects. If the effects were not present, we preferred ordinary least squares (OLS), which is consistent and efficient. If, however, unobservable effects were present, we applied the one-way fixed-effects estimator when there were only country effects (time effects), and the two-way fixed effects estimator when evidence suggested both time and country effects. In choosing the fixed effects method, we assumed that the unobservable effects were fixed parameters for estimation. Alternatively, we could regard the effects as random and apply generalized least squares (GLS), which implied that the unobservable effects were part of the disturbance and therefore independent of the observable explanatory variables. We implemented the Hausman test to investigate the correlation between the effects and the regressors. If the Hausman test supported independence between the observable regressors and the
2 Government spending is not an ideal measure of national security spending on internal and external threats.
Unfortunately, we are not aware of better data that accurately disaggregate conflict-related and other expenditures. An alternative might be to use military spending data. In fact, we employed military spending at an earlier stage of this study and the results were not significant. Military spending is not an adequate measure for several reasons. Most notably, the data do not include all security spending, especially that on homeland security. In addition, our use of military spending substantially reduced the sample information: military expenditure data start from 1988 and are either incomplete or missing for almost half of our sample.
ADBI Discussion Paper 113 Gaibulloev and Sandler
8
unobservable effects, we performed the random-effects estimator, in addition to the fixed-effects model, for sensitivity analysis.
B. Data
Our data were initially drawn from four sources: Penn World Table Version 6.2 (Heston, Summers, and Aten 2006), International Terrorism: Attributes of Terrorist Events (ITERATE) (Mickolus et al. 2006), Global Terrorism Database (GTD), and the UCDP/PRIO Armed Conflict Dataset, Version 4–2007 (Gleditsch et al. 2002). We constructed an unbalanced dataset for 42 Asian countries for 1970–2004. 3 The sample countries included Asian countries for which we can get both macroeconomic and political violence data and, as such, include the main developing and developed countries within the region. We concluded the sample period at the end of 2004 since this is the last year of terrorism data for GTD, while we began at 1970 to increase the number of countries with macroeconomic data. Moreover, terrorism data for 1968–1969 is rather spotty because terrorism datasets were only started in 1968. By 1970, these datasets were better able to track incidents.
Macroeconomic variables—real GDP per capita in constant dollars, economic openness, investment share of real GDP, population, and government expenditure share of real GDP—were obtained from the Penn World Table Version 6.2. Based on data on real GDP per capita, we computed the growth of real GDP per capita as the difference in the log (ln) of GDP per capita of subsequent years. We also calculated the log of the index of country i’s openness at time t, which we denote by ( )ln .
itopen
ITERATE and GTD are used to construct two alternative measures of terrorism. The number of transnational terrorist incidents per million persons (terr iter) indicates the level of transnational terrorist incidents normalized by the venue country’s population. Five incidents in a year in a country with a population of 300 million should, ceteris paribus, have less of an economic influence than the same number of incidents in a country with a tenth of the population. We generally favored a terrorism measure where the number of events was used rather than a dummy that merely signals one or more events in a given year, since the latter does not indicate the prevalence of terrorism. Similarly, we assigned a measure (terr gtd) for all terrorist events—domestic and transnational—per million persons based on GTD data. The latter does not distinguish between domestic and transnational events. Moreover, we could not properly isolate domestic terrorist events by differencing ITERATE and GTD observations in a given country and time period, because these datasets rely on different sources and judgment calls. An event in ITERATE may or may not be in GTD. Finally, we had two indicator variables for conflicts. Based on UCDP/PRIO Armed Conflict Dataset, external was 1 if the country experienced an international conflict (interstate or extrastate) in a given year and 0 otherwise; similarly internal was 1 if the country experienced an internal conflict (internal or internationalized internal) in a given year and 0 otherwise. Table 1 summarizes information on data and sources.
3 Sample countries include Afghanistan; Armenia; Australia*; Azerbaijan; Bangladesh; Bhutan; Brunei;
Cambodia; People’s Republic of China; Fiji Islands; Georgia; Hong Kong, China*; India; Indonesia; Japan*; Kazakhstan; Kiribati; Republic of Korea*; Kyrgyz Republic; Lao People’s Democratic Republic; Malaysia; Maldives; Micronesia (Federated States); Mongolia; Nepal; New Zealand*; Pakistan; Palau; Papua New Guinea; the Philippines; Samoa; Singapore*; Solomon Islands; Sri Lanka; Taipei,China*; Tajikistan; Thailand; Tonga; Turkmenistan; Uzbekistan; Vanuatu; and Socialist Republic of Viet Nam. Note * indicates developed country.

ADBI Discussion Paper 113 Gaibulloev and Sandler
9
Table 1: Raw Data Description and sources Data Description Source
Income Real GDP per capita in constant dollars Penn World Table 6.2 (RGDPCH)
Growth Growth of real GDP per capita (difference in log of GDP per capita of subsequent years)
Economic openness
Share of the sum of exports and imports in real GDP (in percentage)
Penn World Table 6.2 (OPENK)
Investment Investment share of real GDP (in percentage) Penn World Table 6.2 (KI)
Population Population Penn World Table 6.2
Government expenditures
Government expenditure share of real GDP (in percentage)
Penn World Table 6.2 (KG)
Transnational terrorist events
Transnational terrorist events ITERATE
All terrorist events
Domestic and transnational terrorist events GTD1, GTD2
External Conflict Indicator variable = 1 if country experienced an international conflict
Gleditsch et al. (2002); UCDP/PRIO Armed Conflict Dataset, Version 4-2007
Internal Conflict Indicator variable = 1 if country experienced an internal conflict
Gleditsch et al. (2002); UCDP/PRIO Armed Conflict Dataset, Version 4-2007
Summary statistics are displayed for our variables in Table 2. For 1970–2004, income per capita for a sample country grew on average by 2.3%. Investment share was about 15.5% of GDP, while government spending share was about 22.5% of GDP. On average, a sample country experienced 0.055 transnational terrorist incidents per million persons, while it experienced 0.369 terrorist incidents (of all kinds) per million persons. In any given year, external conflict was present in about 8% of the sample countries, while internal conflict was present in about 22% of the sample countries. This relative incidence of conflicts agrees with the impression gained from Figure 1.

ADBI Discussion Paper 113 Gaibulloev and Sandler
10
Table 2: Summary Statistics Variable Mean Standard Deviation Growthit 0.023 0.073
ln yit 8.132 1.078
( )lnit
open 4.200 0.759
( )itI GDP 15.476 10.063
( )itG GDP 22.568 9.360
terr iterit 0.055 0.282
terr gtdit 0.369 2.236
externalit 0.077 0.267
internalit 0.219 0.414 Notes: The number of countries is 42 and the sample period is from 1970 to 2004.
ITERATE records essential information about transnational terrorist events such as its date, country location (start and end location), incident type, and so on (Enders and Sandler, 2006a). GTD does the same for all terrorist events. Both datasets rely on media accounts. ITERATE had a large reliance until 1996 on the Foreign Broadcast Information Service (FBIS) Daily Reports, which survey a couple hundred of the world’s newspapers. ITERATE has continued to draw information from major newspapers, wire services, and other media outlets since 1996. ITERATE excludes not only attacks directed at combatants or occupying armies, but also attacks associated with declared wars or guerilla warfare.
We performed some cleanup of ITERATE data because it lists both a start and an end country for an incident. Typically, the start and end country locations were the same, but they differed for a small percentage of incidents. Our concern was when the start or end country lies outside of Asia—our region of interest. For 90 events, the incident started in an Asian country but ended outside of Asia. After reading the description of these 90 events, we determined that 16 of these incidents really took place in the Asian country of origin (e.g., a plane hijacked at an Asian airport). The other 74 events really took place outside of Asia and were dropped. There were 16 terrorist events that ended within Asia but started outside of Asia (e.g., letter bombs mailed from Europe to an Asian country). Eight of these observations were kept after further investigation. Finally, 47 incidents started in one Asian location (e.g., India) and concluded in another Asian location (e.g., Pakistan). After consulting the incidents’ descriptions, 43 of them were assigned to the start country and the remaining four were assigned to the end location. Also, we did not include “terrorist events” coded as arms smuggling (incident type 22), since the use of these arms in a specific terrorist incident was not indicated. Moreover, the arms may be intended for purposes other than terrorism—e.g., war or crime.
GTD consists of event data on domestic and transnational terrorist incidents for 1970–2004. Owing to its inclusion of domestic events, GTD includes many more incidents than ITERATE. Like ITERATE, GTD requires that incident perpetrators seek a political, economic, religious, or social goal to qualify as a terrorist event. GTD also excludes actions associated with internal or external wars. To construct GTD, the National Consortium for the Study of Terrorism and Responses to Terrorism (START) Center at the University of Maryland first obtained the data from the Pinkerton Global Intelligence Services, which recorded observations on terrorist events based on wire services, government reports, and major international newspapers. These data were cleaned and updated by START. Apparently, the data for 1993 were lost (fell off a truck) and, so, are not currently in GTD. The GTD data are

ADBI Discussion Paper 113 Gaibulloev and Sandler
11
divided into two datasets: GTD1 covers 1970–1997, while GTD2 covers 1998–2004.4 GTD2 has not yet been “cleaned”; hence, we cleaned GTD2 of duplicate events and non-terrorist events for our study. In so doing, we combined GTD1 and GTD2 to provide a continuous dataset for 1970–2004, excluding 1993.
Figure 3 displays the annual number of terrorist incidents for 1970–2004, where the solid line represents all terrorist events from GTD and the broken line represents only transnational events from ITERATE. The left-hand scale is for GTD, while the right-hand scale is for ITERATE. The break in the GTD plot at 1993 corresponds to the missing year of data. There are some noteworthy observations. First, GTD typically recorded over 10 times as many events each year as ITERATE so that domestic events swamp transnational events in number. Second, the shapes of the two time series were surprisingly similar, which means that ITERATE may capture the rises and falls in terrorism even though transnational terrorism is only a small fraction of all terrorist events. Third, both time series suggested cycles in terrorist events (see Enders and Sandler 2006a), which is somewhat clearer for the ITERATE time series. Fourth, there are more transnational terrorist incidents and a greater variability for 1986–1994, which corresponds to the rise of Islamic fundamentalist terrorism as the dominant influence of transnational attacks. Fifth, in the two years following 9/11, there was a big increase in transnational terrorist attacks in Asia, which corresponds to geographical transference, identified by Enders and Sandler (2006b). Figure 4 depicts transnational and all terrorist events in terms of the annual number of events per million persons. With this normalization, the two series appear even more in sync.
Figure 3: Annual Terrorist Events, 1970-2004
0
500
1000
1500
2000
2500
1970
1972
1974
1976
1978
1980
1982
1984
1986
1988
1990
1992
1994
1996
1998
2000
2002
2004
0
20
40
60
80
100
120
GTD ITERATE
ITER
ATE
inci
dent
s pe
r yea
r
GTD
inci
dent
s pe
r yea
r
4 GTD1 (1970–1997) is available from Inter-University Consortium for Political and Social Research; GTD2
(1998–2004) is available at http://www.start.umd.edu/data/gtd.

ADBI Discussion Paper 113 Gaibulloev and Sandler
12
Figure 4: Annual Terrorist Events per Million Persons, 1970-2004
0
10
20
30
40
50
60
70
80
90
100
1970 1972 1974 1976 1978 1980 1982 1984 1986 1988 1990 1992 1994 1996 1998 2000 2002 20040
1
2
3
4
5
6
7
8
9
GTD ITERATE
ITE
RA
TE a
nnua
l inc
iden
ts p
er m
illion
per
sons
GTD
ann
ual i
ncid
ents
per
milli
on p
erso
ns
Although not shown in the figures, the geographic distribution of terrorism is of interest. In terms of transnational terrorist incidents for 1970–2004, ITERATE ranks the top fifteen venues in descending order as follows: the Philippines; Pakistan; India; Cambodia; Afghanistan; Republic of Korea; Indonesia; Thailand; Japan; Australia; Tajikistan; Malaysia; Sri Lanka; Taipei,China; and People’s Republic of China (see Appendix). In terms of transnational terrorism events per million persons, the top fifteen hotspots are: the Solomon Islands; Tajikistan; Fiji Islands; the Philippines; Singapore; Afghanistan; Cambodia; Georgia; Lao People’s Democratic Republic; Australia; Malaysia; Hong Kong, China; Sri Lanka; Pakistan; and Republic of Korea. Some sparsely populated countries on the second list do not appear on the first list, while some populous countries (e.g., India, Indonesia, and People’s Republic of China) on the first list do not appear on the second list. Nine countries show up on both lists. For GTD data, eleven of the top fifteen countries experiencing both forms of terrorism were also among the top fifteen venues for transnational terrorism (see Appendix). This suggests that domestic and transnational terrorism are correlated for many countries.

ADBI Discussion Paper 113 Gaibulloev and Sandler
13
IV. ESTIMATION AND RESULTS
We first estimated the growth equation in Equation (1) for our entire Asian sample. The Hausman test between two-way fixed-effects and two-way random-effects specifications rejected the null hypothesis of no correlation between the explanatory variables and the unobserved effects; hence, the standard random-effects estimation was not appropriate. We also performed F-tests for the presence of country-specific and time-specific effects and found the presence of both effects, thereby supporting our two-way fixed-effects estimations.5
In Table 3, Models 1–4 sequentially introduce the four conflict variables—transnational terrorist events, all terrorist events (as recorded by GTD), external conflicts, and internal conflicts—one at a time to three standard growth explanatory variables that appear in all six models. Models 5 and 6 include conflict variables together with transnational terrorism and all terrorism, respectively. Consistent with the growth literature, the log of lagged GDP per capita had a negative influence on income per capita growth, which reflects convergence. The lagged investment share has the anticipated positive effect on income per capita growth. Across all six models, the impacts of these two variables were robust. The log of lagged openness was not a positive determinant of growth, which agrees with Rodrik’s (1999) view that the influence of openness on growth is overstated, especially for developing countries, which comprise most of our sample. In fact, the openness variable was negative, but not significant.
Table 3: Two-Way Fixed-Effects Estimation of Growth Model
Notes: Hausman test is between two-way fixed effects and two-way random effects. df denotes the degree of freedom and p-value is the probability value. Constant, time, and country dummies are suppressed. Standard errors are in parentheses. Significance levels: *** is .01, ** is .05, and * is .10.
5 More specifically, we tested the null hypothesis of no country-specific effects, no time-specific effects, no joint
country-specific and time-specific effects, no country-specific effects conditional on the presence of time-specific effects, and no time-specific effects conditional on the presence of country-specific effects.
Model 1 Model 2 Model 3 Model 4 Model 5 Model 6 ln yit–1 –0.040*** –0.037*** –0.039*** –0.039*** –0.040*** –0.037*** (0.007) (0.007) (0.007) (0.007) (0.007) (0.007)
ln (open)it–1 –0.011 –0.004 –0.011 –0.012 –0.012 –0.005 (0.008) (0.008) (0.008) (0.008) (0.008) (0.008)
(I/GDP)it–1 0.002** 0.001** 0.002** 0.002** 0.002** 0.001** (0.001) (0.001) (0.001) (0.001) (0.001) (0.001)
terr iterit –0.015** –0.014* (0.007) (0.007)
terr gtdit –0.0003 0.00002 (0.001) (0.001)
externalit –0.007 –0.006 –0.006 (0.009) (0.009) (0.009)
internalit –0.023*** –0.022*** –0.021*** (0.008) (0.008) (0.008)
Sample size 1201 1165 1201 1201 1201 1165
Hausman (df) 22.18(4) 18.04(4) 24.08(4) 19.95(4) 25.80(6) 20.39(6)
p-value 0.000 0.001 0.000 0.001 0.000 0.002

ADBI Discussion Paper 113 Gaibulloev and Sandler
14
For the political violence variables, transnational terrorism and internal conflicts have the expected negative impact on growth; however, all terrorist events and external conflicts are statistically insignificant. These results hold for all six models. In particular, the coefficient of transnational terrorism is about –0.015, indicating that, on average, an additional terrorist event per million persons lowers GDP per capita growth by about 1.5% in a given year. Thus, a populous country with 100 million people would have to experience 100 more transnational terrorist events to have this kind of impact. Ten additional events would reduce growth by 0.15% for this hypothetical country. The estimated influence of internal conflicts is around –0.02, which implies that an intrastate conflict cuts a country’s income per capita growth by approximately 2% in a year. For populous countries, internal conflicts understandably pose a greater growth worry than a small level of transnational terrorism.
There are a number of potential reasons for why terrorism and other types of conflict influence a country’s economy. One scenario is that terrorism and conflict crowd out growth-promoting investment for less productive government spending in terms of national security. We investigated this possibility by estimating investment and government spending models, given by Equations (2) and (3). A positive impact of terrorism and conflict on government spending and a negative influence of terrorism and conflict on investment would be consistent with this crowding-in/crowding-out hypothesis. We perform specification tests for these two equations. F-tests indicate that both time-specific and country-specific effects are significant for the investment models, whereas only country-specific effects are significant for government spending models.6 The Hausman test for the investment regression and the Wald statistic (an equivalent to the Hausman test) for the government spending regression indicated a correlation between the unobserved effects and the regressors for all models; thus, we employed two-way, fixed-effects estimators for the investment models and one-way, fixed effects estimators for the government spending models.
Table 4 reports the results for the investment regressions where the dependent variable is investment share (in percentage). Economic openness strongly stimulated investment. Lagged GDP per capita and transnational terrorism were not statistically significant. For all terrorism attacks, an additional incident per million persons led to a reduced investment share of about 0.1 percentage points. External and internal conflicts are associated with a fall of the investment share by 0.73 and 0.66 percentage points, respectively. These results were weakly significant at the .10 level and were sensitive to the inclusion of other conflict variables. External conflict was not significant when included with other types of conflict (Models 5 and 6), while internal conflict was not significant when included with all forms of terrorism (Model 6).
Table 4: Two-Way Fixed-Effects Estimation of Investment Model
6 In general, inclusion of time dummies in government spending regressions does not affect our conclusion on
terrorism and conflict.
Model 1 Model 2 Model 3 Model 4 Model 5 Model 6ln yit–1 0.482 0.460 0.471 0.462 0.454 0.440 (0.344) (0.346) (0.343) (0.343) (0.344) (0.346)
ln (open)it–1 4.147*** 4.261*** 4.092*** 4.118*** 4.066*** 4.191*** (0.357) (0.364) (0.358) (0.357) (0.358) (0.366)
terr iterit –0.001 0.032 (0.342) (0.342)
terr gtdit –0.087* –0.083* (0.045) (0.045)
externalit –0.726* –0.700 –0.668 (0.438) (0.438) (0.440)
internalit –0.655* –0.637* –0.305 (0.356) (0.357) (0.366)
ADBI Discussion Paper 113 Gaibulloev and Sandler
15
Notes: Hausman test is between two-way fixed effects and two-way random effects. df denotes the degree of freedom and p-value is the probability value. Constant, time, and country dummies are suppressed. Standard errors are in parentheses. Significance levels: *** is .01, ** is .05, and * is .10.
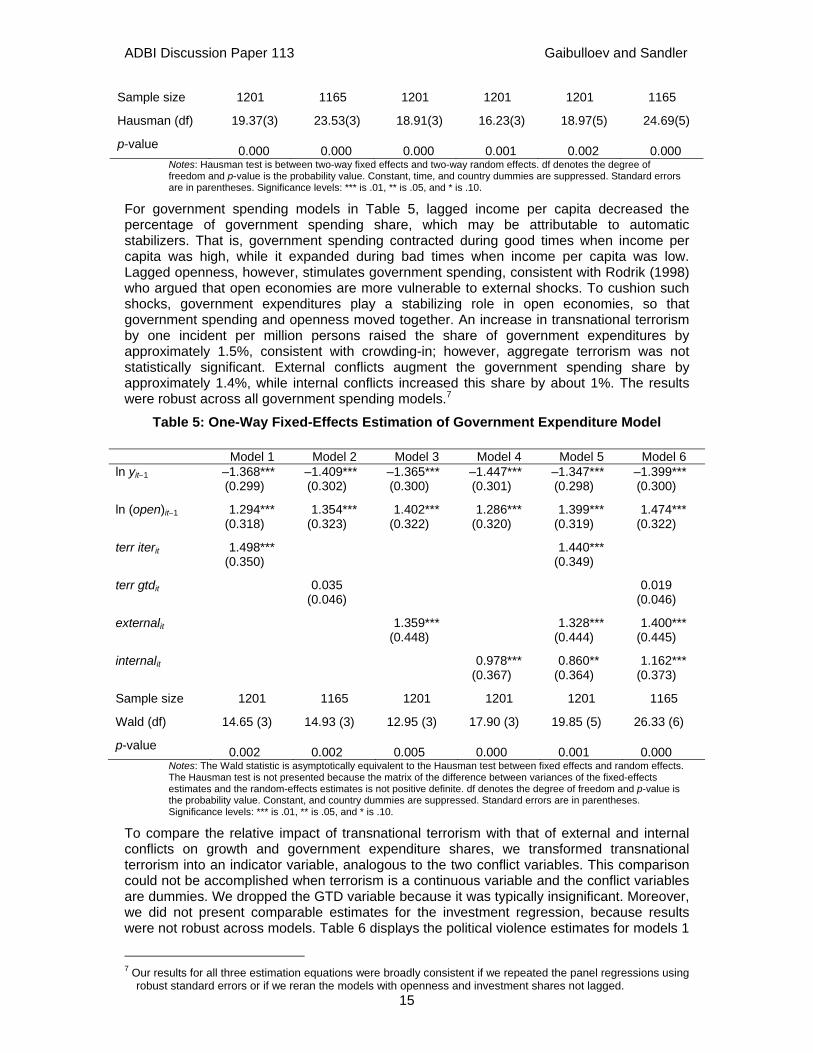
For government spending models in Table 5, lagged income per capita decreased the percentage of government spending share, which may be attributable to automatic stabilizers. That is, government spending contracted during good times when income per capita was high, while it expanded during bad times when income per capita was low. Lagged openness, however, stimulates government spending, consistent with Rodrik (1998) who argued that open economies are more vulnerable to external shocks. To cushion such shocks, government expenditures play a stabilizing role in open economies, so that government spending and openness moved together. An increase in transnational terrorism by one incident per million persons raised the share of government expenditures by approximately 1.5%, consistent with crowding-in; however, aggregate terrorism was not statistically significant. External conflicts augment the government spending share by approximately 1.4%, while internal conflicts increased this share by about 1%. The results were robust across all government spending models.7
Table 5: One-Way Fixed-Effects Estimation of Government Expenditure Model
Notes: The Wald statistic is asymptotically equivalent to the Hausman test between fixed effects and random effects. The Hausman test is not presented because the matrix of the difference between variances of the fixed-effects estimates and the random-effects estimates is not positive definite. df denotes the degree of freedom and p-value is the probability value. Constant, and country dummies are suppressed. Standard errors are in parentheses. Significance levels: *** is .01, ** is .05, and * is .10.
To compare the relative impact of transnational terrorism with that of external and internal conflicts on growth and government expenditure shares, we transformed transnational terrorism into an indicator variable, analogous to the two conflict variables. This comparison could not be accomplished when terrorism is a continuous variable and the conflict variables are dummies. We dropped the GTD variable because it was typically insignificant. Moreover, we did not present comparable estimates for the investment regression, because results were not robust across models. Table 6 displays the political violence estimates for models 1
7 Our results for all three estimation equations were broadly consistent if we repeated the panel regressions using
robust standard errors or if we reran the models with openness and investment shares not lagged.
Sample size 1201 1165 1201 1201 1201 1165
Hausman (df) 19.37(3) 23.53(3) 18.91(3) 16.23(3) 18.97(5) 24.69(5)
p-value 0.000 0.000 0.000 0.001 0.002 0.000
Model 1 Model 2 Model 3 Model 4 Model 5 Model 6 ln yit–1 –1.368*** –1.409*** –1.365*** –1.447*** –1.347*** –1.399*** (0.299) (0.302) (0.300) (0.301) (0.298) (0.300)
ln (open)it–1 1.294*** 1.354*** 1.402*** 1.286*** 1.399*** 1.474*** (0.318) (0.323) (0.322) (0.320) (0.319) (0.322)
terr iterit 1.498*** 1.440*** (0.350) (0.349)
terr gtdit 0.035 0.019 (0.046) (0.046)
externalit 1.359*** 1.328*** 1.400*** (0.448) (0.444) (0.445)
internalit 0.978*** 0.860** 1.162*** (0.367) (0.364) (0.373)
Sample size 1201 1165 1201 1201 1201 1165
Wald (df) 14.65 (3) 14.93 (3) 12.95 (3) 17.90 (3) 19.85 (5) 26.33 (6)
p-value 0.002 0.002 0.005 0.000 0.001 0.000

ADBI Discussion Paper 113 Gaibulloev and Sandler
16
and 5 for the growth and government share regressions when transnational terrorism is a dummy variable. The adverse impact of internal conflict on growth is over twice that of transnational terrorism. Thus, internal conflict is a greater growth concern than transnational terrorism. Similarly, the impact of transnational terrorism on the share of government spending is much less than half of that of external conflicts and just over 60% of that of internal conflict. External conflict contributes more than internal conflict to crowding-in of government spending.
Table 6: Comparing Conflicts and Terrorism Estimates of Growth and Government Spending Models
Variable growth government spending share
Model 1 Model 5 Model 1 Model 5 terr iterit –0.010* –0.008 0.605** 0.500** (0.005) (0.005) (0.257) (0.247)
externalit –0.006 1.313*** (0.006) (0.332)
internalit –0.022** 0.885** (0.009) (0.430)
Sample size 1201 1201 1201 1201 Notes: See Models 1, 5 of Table 3 and Models 1, 5 of Table 5 for specification. terr iter is a dummy variable for transnational terrorism. Robust standard errors are in parentheses. Significance levels: *** is .01, ** is .05, and * is .10.
Until now, we assumed that the influence of terrorism is the same across sample countries and periods; however, terrorism may have a stronger effect on countries with less-developed economies. Advanced economies are more resilient and recover faster from shocks associated with terrorist incidents (Sandler and Enders 2008). To explore this possibility, we divided our sample into seven developed and 35 developing countries (see footnote 3 and repeat the analysis). For brevity, we focused on the coefficients of the political violence variables. For developed countries, we excluded internal conflicts because there were almost no such conflicts.
As anticipated, the terrorism variables were never significant for developed countries in Table 7.8 External interstate conflicts that reduced investment shares was just under 4% and increased government spending shares by about 1.2%. These results were highly significant and robust across models. Development is no firewall against the adverse effects of interstate wars on investment and government spending.
Table 7: Developed countries: Fixed-effects estimation of the growth, investment and government spending models
Model 1 Model 2 Model 3 Model 4 Model 5 Growth (two-way fixed effects)
terr iterit 0.009 0.009 (0.015) (0.015)
terr gtdit 0.017 0.018 (0.014) (0.014)
externalit –0.007 –0.007 –0.008 (0.010) (0.010) (0.010)
Investment share in GDP (country fixed effects) terr iterit 1.521 1.874 (2.053) (2.016)
8 Investment models were estimated using the one-way (country) fixed effects, because time effects were not
statistically significant. The qualitative results do not change if we included year-specific dummies. We also estimated growth and investment models using the random-effects estimator, insofar as the Hausman test did not reveal an endogeneity problem. The results from Table 7 generally hold, except for external conflict which becomes marginally significant at the .10 level in the growth equation.
ADBI Discussion Paper 113 Gaibulloev and Sandler
17
terr gtdit 1.417 1.422 (1.762) (1.729)
externalit –3.813*** –3.873*** –3.757*** (1.197) (1.199) (1.211)
Government expenditure share in GDP (two-way fixed effects) terr iterit –0.274 –0.245 (0.666) (0.654)
terr gtdit 0.469 0.338 (0.646) (0.636)
externalit 1.240*** 1.238*** 1.221*** (0.429) (0.430) (0.437)
N 245 238 245 245 238 Notes: See Tables 3–5 for specification. Standard errors are in parentheses. Significance levels: *** is .01, ** is .05, and * is .10.
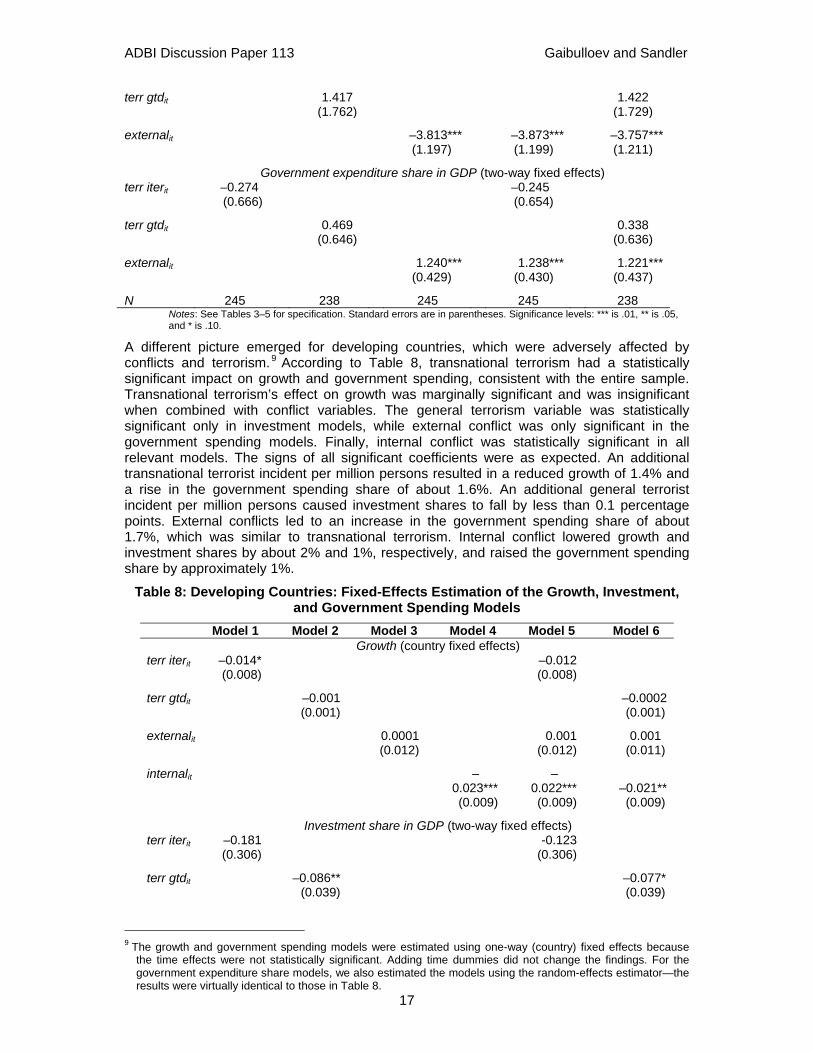
A different picture emerged for developing countries, which were adversely affected by conflicts and terrorism.9 According to Table 8, transnational terrorism had a statistically significant impact on growth and government spending, consistent with the entire sample. Transnational terrorism’s effect on growth was marginally significant and was insignificant when combined with conflict variables. The general terrorism variable was statistically significant only in investment models, while external conflict was only significant in the government spending models. Finally, internal conflict was statistically significant in all relevant models. The signs of all significant coefficients were as expected. An additional transnational terrorist incident per million persons resulted in a reduced growth of 1.4% and a rise in the government spending share of about 1.6%. An additional general terrorist incident per million persons caused investment shares to fall by less than 0.1 percentage points. External conflicts led to an increase in the government spending share of about 1.7%, which was similar to transnational terrorism. Internal conflict lowered growth and investment shares by about 2% and 1%, respectively, and raised the government spending share by approximately 1%.
Table 8: Developing Countries: Fixed-Effects Estimation of the Growth, Investment, and Government Spending Models
Model 1 Model 2 Model 3 Model 4 Model 5 Model 6 Growth (country fixed effects)
terr iterit –0.014* –0.012 (0.008) (0.008)
terr gtdit –0.001 –0.0002 (0.001) (0.001)
externalit 0.0001 0.001 0.001 (0.012) (0.012) (0.011)
internalit
–0.023***
–0.022*** –0.021**
(0.009) (0.009) (0.009)
Investment share in GDP (two-way fixed effects) terr iterit –0.181 -0.123 (0.306) (0.306)
terr gtdit –0.086** –0.077* (0.039) (0.039)
9 The growth and government spending models were estimated using one-way (country) fixed effects because
the time effects were not statistically significant. Adding time dummies did not change the findings. For the government expenditure share models, we also estimated the models using the random-effects estimator—the results were virtually identical to those in Table 8.

ADBI Discussion Paper 113 Gaibulloev and Sandler
18
externalit –0.170 –0.132 –0.099 (0.441) (0.439) (0.440)
internalit
–1.001***
–0.990*** –0.655*
(0.326) (0.327) (0.335)
Government expenditure share in GDP (country fixed effects) terr iterit 1.617*** 1.558*** (0.391) (0.390)
terr gtdit 0.029 0.012 (0.050) (0.050)
externalit 1.687*** 1.666*** 1.721*** (0.567) (0.561) (0.563)
internalit 1.089*** 0.937** 1.304*** (0.420) (0.416) (0.427)
N 956 927 956 956 956 927 Notes: See Tables 3–5 for specification. Standard errors are in parentheses. Significance levels: *** is .01, ** is .05, and * is .10.

ADBI Discussion Paper 113 Gaibulloev and Sandler
19
V. INTRODUCING REGIME TYPES
As a final exercise, we introduced a country’s regime type into the analysis since the extent of democracy may influence economic growth. More democratic countries may attract investment and may also limit government spending shares through accountability, transparency, and good governance. Past results on democracy’s influence on growth has been mixed. In an interesting study, Tavares and Wacziarg (2001) examined the pathways through which democracy may affect growth. They found that democracy promotes growth by increasing human capital accumulation and income equality while democracy limits growth by lowering physical capital investment and bolstering government spending, with a net negative effect.10
For regime types, we used the Polity IV Dataset (Marshall and Jaggers 2004) for each sample country and year. The polity variable reflected three interdependent elements: amount of political participation, restraints (if any) on executive power, and the extent of government-backed civil liberties (e.g., freedom of association, freedom of speech, protection against unwarranted search and seizure, and due process under the law). These three elements were aggregated into a single score that varies from –10 (strongly autocratic) to +10 (strongly democratic). The average score of polity for our Asian sample was +0.758, with a standard deviation of 7; hence, the extent of democracy varied greatly across our sample countries. We had to, however, reduce the sample countries by nine (i.e., Brunei; Hong Kong, China; Kiribati; Maldives; Micronesia; Palau; Samoa; Tonga; and Vanuatu) owing to regime data limitations. This exclusion meant that over 300 observations were left out, which could affect some coefficients when the new results in Table 9 were compared with those in Tables 3–5.
Table 9: Fixed-Effects Estimation of Growth, Investment, and Government Spending Models Including Democracy Variable
Growth Investment Government spending
ln yit–1 –0.035*** 1.258** –1.881*** (0.009) (0.513) (0.361)
ln (open)it–1 –0.021** 4.682*** 1.563*** (0.009) (0.450) (0.342)
(I/GDP)it–1 0.002** (0.001)
terr iterit –0.023*** 0.111 1.528*** (0.009) (0.487) (0.417)
externalit –0.006 –0.521 1.083** (0.009) (0.497) (0.424)
internalit –0.022*** –0.539 0.986*** (0.007) (0.402) (0.348)
polityit 0.0002 0.056* –0.086*** (0.001) (0.034) (0.029)
Sample size 886 886 886 Notes: Country and time dummies are included in the growth and investment regressions and country dummies are included in the government spending regression. Standard errors are in parentheses. Significance levels: *** is .01, ** is .05, and * is .10.
10 One reason for including regime type was to avoid a possible omitted variable bias problem: democracy may
influence growth and may also correlate with political violence variables.

ADBI Discussion Paper 113 Gaibulloev and Sandler
20
We dropped the general terrorist attacks (from the GTD data), given their general insignificance in earlier runs without the polity variable. The new estimating equations were identical to those in Equations (1)–(3), except for the addition of a polityit term in each equation. We again performed the same tests. Once again, a two-way, fixed-effects estimator applied to the growth and investment equations, while a one-way (country) fixed-effects estimator applied to the government equation. The results are displayed in Table 9.
Generally, the polity variable added precision to the estimates. For the growth equation, the convergence term and the investment share possessed similar coefficients to those for Model 5 in Table 3. Openness was now statistically significant, which was attributable to the altered sample. When we re-estimated Model 5 from Table 3 without the polity variable, excluding the above nine sample countries, the results were almost identical for openness. Transnational terrorism’s impact on growth was slightly higher in Table 9, but this was again due to the exclusion of some sample countries. The democracy (polity) variable was not significant in the growth equation, but democracy improved investment and limited government spending shares as anticipated. All three conflict variables crowded in government spending. The significance of many coefficients improved with the inclusion of the polity variable when compared with Model 5 of Tables 3–5—thus, our remark about precision.

ADBI Discussion Paper 113 Gaibulloev and Sandler
21
VI. CONCLUDING REMARKS AND POLICY RECOMMENDATIONS
We added terrorism and conflict variables to a standard growth model to ascertain the influence that these political violence factors have on Asian growth for 1970–2004. Our one-year-panel analysis indicates that transnational terrorism has a significant short-run, growth-retarding effect for developing countries in Asia. Asian developed countries, however, manage to sustain terrorist attacks without displaying growth consequences. For Asian developing countries, transnational terrorism curbs income per capita growth primarily by stimulating government security spending, which diverts resources from more productive private and public investments. General terrorism, as measured by GTD, does not influence economic growth directly but indirectly by reducing investment shares.
Both internal and external conflicts are associated with smaller investment shares and larger government spending shares, with crowding-in of government expenditures dominating the crowding-out of investment. Internal conflicts have a much greater negative growth influence than transnational terrorist events or external conflicts. Populous countries must sustain a large increase in transnational terrorist attacks before displaying much lost in growth, given that our terrorism measure is in terms of incidents per million persons. Both internal and external conflicts crowd in government spending of a similar magnitude that is about twice as large as that from transnational terrorism.
A number of policy insights can be drawn from this analysis. Since transnational terrorism negatively impacts growth through increased government spending, targeted countries must ensure that they do not overspend on defensive and under-spend on offensive counterterrorism measures. Recent research indicates that there is a proclivity for at-risk countries to spend too much on protective countermeasures in the hopes of displacing potential attacks abroad (Enders and Sandler 2006a; Siqueira and Sandler 2006). Such actions have a negative impact on growth, which makes it even more imperative that neighboring nations cooperate in their efforts to curb terrorism. Coordination failures could result in countries transferring attacks to their own people and property elsewhere in Asia, so that little security would be truly gained. This also means that Asian countries must make a coordinated effort to eliminate terrorists and their weapons so that the need for defensive actions diminishes. Association of Southeast Asian Nations’ (ASEAN) on-going joint actions to address transnational crime and terrorism need to continue and be improved. Coordinated actions can limit government crowding-out of investment by curbing overspending on defensive counterterrorism measures.
There is yet another reason for joint Asian efforts in fighting regional terrorism and conflict. In recent years, production in Asia has been increasingly fragmented as Asia exploits the economic benefits of comparative advantage. This fragmentation, however, heightens the region-wide economic impacts of localized conflict and terrorism. A conflict in an Asian country, whose outputs are vital throughout the region, can have devastating regional economic consequences, thus bolstering the need for coordinated actions.11 This need also applies as Asia comes to depend on inter-linked infrastructure—roads, energy grids, and waterways. A conflict in one country can create bottlenecks that limit commerce throughout Asia.
Asian cooperation in terms of conflict is consistent with the Asian Development Bank’s long-term strategic framework 2020 that emphasizes inclusive growth that ignores no segment of the population (Asian Development Bank 2008). On-going conflicts cause economic hardship to the host country and its neighbors and create pockets of poverty, inconsistent with inclusive growth.
Because developing countries are less able than their more developed neighbors to withstand terrorist attacks without economic consequences, rich Asian countries must assist their poorer neighbors to protect themselves and to recover from transnational terrorist
11 We thank the reviewer for suggesting this additional need for cooperation.

ADBI Discussion Paper 113 Gaibulloev and Sandler
22
attacks. Moreover, the rich Asian nations must take a leadership role in proactive countermeasures against a common terrorist threat. Terrorist groups, such as Jemaah Islamiyah which seeks a pan-Islamic state, underscore the need for coordinated government actions, because any Asian foothold that these terrorists achieve will allow them to pose greater risks throughout the region. Insofar as Jemaah Islamiyah also attacks Western interests (e.g., the Bali nightclub suicide car bombings on 12 October 2002 and the Jakarta Marriott Hotel suicide car bombing on 5 August 2003), Western countries also have a real interest in eliminating this terrorist group. Rich Western countries are in the position to greatly assist Asian countries’ efforts to address such common terrorist threats. This assistance may take many forms—e.g., intelligence, counterterrorist agents, and resources. Many Asian groups are linked—e.g., al-Qaida, Jemaah Islamiyah, Abu Sayyaf, Harakat ul-Mujahidin, Islamic Movement of Uzbekistan, Jaish-e-Mohammed, Lashkar-e-Tayyiba, Lashkar I Jhangvi, and Harakat ul-Jihad-I-Islami/Bangladesh (US Department of State, 2003)—which bolsters the case for joint Asian efforts, supported by Western help. The ASEAN-EU declaration to fight terrorism jointly is a step in the right direction—see, e.g., the joint Co-Chairman’s statements following the 14th and 15th ASEAN-EU Ministerial meetings in 2004 and 2005, respectively. Our study demonstrates the need for explicit joint proactive and defensive counterterrorism measures that operationalized these past declarations.
There is another justification for Western nations to assist Asia to address its transnational terrorism. As Western countries augmented their homeland security following 9/11, there was a documented transference of attacks to the Middle East and Asia (Enders and Sandler, 2006b). This transference means that Western countries have a responsibility for assisting. They also have a motive insofar as this transference involves an increase in attacks against Western persons and assets.
Policy concerns also involve internal conflicts because they curtail growth. As shown in Figure 1, internal conflicts present a much more prevalent security risk for Asia than external conflicts, which have primarily concerned two countries over the last two decades. Given the significant losses to growth posed by internal conflicts, Asia must devise a permanent plan for curbing the incidence of these conflicts. Because the economic impact of internal conflicts can disperse beyond the conflict-ridden country, this economic concern must be collectively addressed by Asia. This may, at times, require Asian-directed peacekeeping when United Nations resources are stretched too thin or United Nations action is too slow. Also, the Asian Development Bank and the World Bank have roles to play in terms of aid, especially once a conflict ends, to assist in reconstruction (Collier et al. 2003).
Security resources are scarce and must be allocated among different kinds of terrorist risks—i.e., domestic and transnational terrorism—and conflicts. Our analysis shows that transnational terrorism results in larger economic consequences than domestic terrorism. However, internal conflict gives rise to even greater economic harm than transnational terrorism. These findings begin to inform policymakers where security resources are best concentrated to reduce economic losses from violence. Actions against internal conflicts are paramount, followed by efforts to curb transnational terrorist attacks and to lessen their economic consequences. Even though the venue of the violence is country specific, this violence has region-wide security and economic spillovers that require a coordinate plan.
ADBI Discussion Paper 113 Gaibulloev and Sandler
23
REFERENCES
Abadie, Alberto and Javier Gardeazabal. 2003. The Economic Cost of Conflict: A Case Study of the Basque Country. American Economic Review 93(1): 113–132.
Abadie, Alberto and Javier Gardeazabal. 2008. Terrorism and the World Economy. European Economic Review 52(1): 1–27.
Asian Development Bank. 2008. Strategy 2020: The Long-Term Strategic Framework of the Asian Development Bank 2008–2020. <http://www.adb.org/Documents/Policies/Strategy2020/Strategy2020.pdf>, accessed on 5 July 2008.
Baltagi, Badi H. 2005. Econometric Analysis of Panel Data (3rd edition). Chichester, UK: John Wiley & Sons.
Barro, Robert J. 1991. Economic Growth in a Cross Section of Countries. Quarterly Journal of Economics 100(2): 223–251.
Barro, Robert J. and Xavier Sala-i-Martin. 1992. Convergence. Journal of Political Economy, Vol. 100(2): 223–251.
Blomberg, S. Brock, Gregory D. Hess, and Athanasios Orphanides. 2004. The Macroeconomic Consequences of Terrorism. Journal of Monetary Economics 51(5): 1007–1032.
Chen, Andrew H. and Thomas F. Siems. 2004. The Effects of Terrorism on Global Capital Markets. European Journal of Political Economy 20(2): 249–266.
Collier, Paul, V.L. Elliott, Håvard Hegre, Anke Hoeffler, Marta Reynal-Querol, and Nicholas Sambanis. 2003. Breaking the Conflict Trap: Civil War and Development Policy. Washington, DC: World Bank and Oxford University Press.
Collier, Paul and Anke Hoeffler. 2004. Greed and Grievance in Civil Wars. Quarterly Journal of Economics 56(4): 563–595.
Drakos, Konstantinos. 2004. Terrorism-Induced Structural Shifts in Financial Risk: Airline Stocks in the Aftermath of the September 11th Terror Attacks. European Journal of Political Economy 20(2): 436–446.
Drakos, Konstantinos and Ali M. Kutan. 2003. Regional Effects of Terrorism on Tourism in Three Mediterranean Countries. Journal of Conflict Resolution 47(5): 621–641.
Eckstein, Zvi and Daniel Tsiddon. 2004. Macroeconomic Consequences of Terror: Theory and the Case of Israel. Journal of Monetary Economics 51(5): 971–1002.
Enders, Walter and Todd Sandler. 1996. Terrorism and Foreign Direct Investment in Spain and Greece. Kyklos 49(3): 331–352.
Enders, Walter and Todd Sandler. 2006a. The Political Economy of Terrorism. Cambridge: Cambridge University Press.
Enders, Walter and Todd Sandler. 2006b. Distribution of Transnational Terrorism Among Countries by Income Class and Geography After 9/11. International Studies Quarterly 50(2): 367–393.
Enders, Walter, Adolfo Sachsida, and Todd Sandler. 2006. The Impact of Transnational Terrorism on US Foreign Direct Investment. Political Research Quarterly 59(4): 517–531.
Enders, Walter, Todd Sandler, and Gerald F. Parise. 1992. An Econometric Analysis of the Impact of Terrorism on Tourism. Kyklos 45(4): 531–554.
Gaibulloev, Khusrav and Todd Sandler. 2008. Growth Consequences of Terrorism in Western Europe. Kyklos 61(3): 411–424.

ADBI Discussion Paper 113 Gaibulloev and Sandler
24
Ghobarah, Hazem A., Paul Huth, and Bruce Russett. 2003. Civil Wars Kill and Maim People—Long After the War Stops. American Political Science Review 97(2): 189–202.
Gleditsch, Nils P., Peter Wallensteen, Mikael Eriksson, Margareta Sollenberg, and Håvard Hegre. 2002. Armed Conflict 1946–2001: A New Dataset. Journal of Peace Research 39(5): 615–637. UCDP/PRIO Armed Conflicts Version 4–2007. <http://new.prio.no/CSCW-Datasets/Data-on-Armed-Conflict/UppsalaPRIO-Armed-Conflicts-Dataset/>, accessed on 19 April 2008.
Global Terrorism Database 1. 1970–1997. Inter-University Consortium for Political and Social Research. <http://www.icpsr.umich.edu/cocoon/NACJD/STUD/04586.xml>, accessed on 19 April 2008.
Global Terrorism Database 2. 1998–2004. START/CETIS. <http://www.start.umd.edu/data/gtd>, accessed on 19 April 2008.
Heston, Alan, Robert Summers, and Bettina Aten. 2006. Penn World Table Version 6.2. Philadelphia, PA: Center for International Comparisons of Production, Income and Prices, University of Pennsylvania.
Ito, Harumi and Darin Lee. 2005. Assessing the Impact of the September 11th Terrorist Attacks on U.S. Airline Demand. Journal of Economics and Business 57(1):75–95.
Kunreuther, Howard, Erwann Michel-Kerjan, and Beverly Portor. 2003. Assessing, Managing and Financing Extreme Events: Dealing with Terrorism. Working Paper 10179. National Bureau of Economic Research. Cambridge, MA.
Marshall, Monty G. and Keith Jaggers. 2004. Polity IV Dataset and Dataset Users’ Manual, Computer file, Version p4v2004. Center for International Development and Conflict Management. University of Maryland, College Park, MD.
Mickolus, Edward F., Todd Sandler, and Jean Murdock. 1989. International Terrorism in the 1980s: A Chronology of Events. 2 volumes. Ames, IA: Iowa State University.
Mickolus, Edward F., Todd Sandler, Jean M. Murdock, and Peter Flemming. 2006. International Terrorism: Attributes of Terrorism Events (ITERATE), 1968–2005. Dunn Loring, VA: Vinyard Software.
Mickolus, Edward F. and Susan L. Simmons. 2002. Terrorism, 1996–2001: A Chronology. 2 volumes. Westport, CT: Greenwood Press.
Murdoch, James C. and Todd Sandler. 2002. Economic Growth, Civil Wars, and Spatial Spillovers. Journal of Conflict Resolution 46(1): 91–110.
Murdoch, James C. and Todd Sandler. 2004. Civil Wars and Economic Growth: Spatial Spillovers. American Journal of Political Science 48(1): 138–151.
Nitsch, Volker and Dieter Schumacher. 2004. Terrorism and International Trade: An Empirical Investigation. European Journal of Political Economy 20(2): 423–433.
Olson, Mancur. 1982. The Rise and Decline of Nations: Economic Growth, Stagflation, and Social Rigidities. New Haven, CT: Yale University Press.
Rodrik, Dani. 1998. Why Do Open Economies Have Bigger Governments? Journal of Political Economy 106(5): 997–1032.
Rodrik, Dani. 1999. The New Global Economy and Developing Countries: Making Openness Work. Policy Essay No. 24. Washington, DC: Overseas Development Council.
Sambanis, Nicholas. 2002. Review of Recent Advances and Future Directions in the Quantitative Literature on Civil War. Defence and Peace Economics 13(3): 215–243.
Sandler, Todd and Walter Enders. 2008. Economic Consequences of Terrorism in Developed and Developing Countries: An Overview in Philip Keefer and Normal

ADBI Discussion Paper 113 Gaibulloev and Sandler
25
Loayza (eds.), Terrorism, Economic Development and Political Openness. Cambridge: Cambridge University Press: 17–47.
Sandler, Todd, John Tschirhart, and Jon Cauley. 1983. A Theoretical Analysis of Transnational Terrorism. American Political Science Review 77(1): 36–54.
Siqueira, Kevin and Todd Sandler. 2006. Global Terrorism: Deterrence versus Pre-emption. Canadian Journal of Economics 39(4): 1370–1387.
Tavares, Jose. 2004. The Open Society Assesses Its Enemies: Shocks, Disasters and Terrorist Attacks. Journal of Monetary Economics 51(5): 1039–1070.
Tavares, Jose and Romain Wacziarg. 2001. How Democracy Affects Growth. European Economic Review 45(8): 1341–1378.
United States Department of State. 2003. Patterns of Global Terrorism 2002. Washington, DC: US Department of State.
WorldNetDaily. 2003. Al-Qaida Training Manual Shows Seaports Top Target. <http://www.worldnetdaily.com/news/article.asp?ARTICLE_ID=35327>, accessed on 19 April 2008.

ADBI Discussion Paper 113 Gaibulloev and Sandler
26
APPENDIX: TABLES
Table A1 shows the breakdown by countries for transnational terrorism events (ITERATE), all terrorist events (GTD), external conflicts, and internal conflicts. The terrorism events are displayed in two forms: the number of events for 1970–2004 and the number of incidents per million persons for the entire period. The conflict columns display the number of conflicts of each type during the period. Table A2 indicates each country’s rank (1 is highest to 42 lowest) in terms of each conflict measure.

ADBI Discussion Paper 113 Gaibulloev and Sandler
27
Table A1: Number of Terrorist Incidents and Conflicts by Country, 1970–2004
Country Iterate Iterate per million pop GTD
GTD per million pop
External conflicts
Internal conflicts
Afghanistan 86 4.07 272 12.67 0 28 Armenia 1 0.29 17 4.98 0 4 Australia 44 2.95 63 3.84 8 5 Azerbaijan 7 0.93 32 4.25 0 7 Bangladesh 15 0.16 1189 10.07 1 19 Bhutan 0 0.00 0 0.00 0 0 Brunei 0 0.00 2 7.31 0 0Cambodia 108 3.84 232 7.96 5 27 China, People’s Rep. 20 0.02 141 0.12 9 0 Fiji Islands 5 6.92 13 17.11 0 0 Georgia 19 3.67 113 21.34 0 8Hong Kong, China 15 2.93 24 4.10 0 0 India 158 0.22 3535 4.07 15 118 Indonesia 78 0.39 283 1.32 0 29 Japan 56 0.47 374 3.08 0 2 Kazakhstan 0 0.00 8 0.47 0 1 Kiribati 0 0.00 0 0.00 0 0 Korea, Rep. of 79 1.89 0 0.00 6 1 Kyrgyz Rep. 6 1.27 9 1.96 0 2 Lao People’s Dem. Rep. 12 3.01 14 2.91 3 6 Malaysia 41 2.94 40 2.49 0 3 Maldives 0 0.00 0 0.00 0 0 Micronesia, Fed States 0 0.00 0 0.00 0 0 Mongolia 0 0.00 0 0.00 0 1 Nepal 12 0.62 129 5.36 0 9 New Zealand 4 1.34 10 2.89 6 2 Pakistan 211 1.97 2390 19.27 16 12 Palau 0 0.00 1 58.70 0 0Papua New Guinea 6 1.55 83 20.78 0 7 Philippines 316 5.39 2252 35.59 6 67 Samoa 0 0.00 1 5.54 0 0 Singapore 13 4.64 10 3.34 0 0Solomon Islands 4 9.10 1 2.15 0 0 Sri Lanka 36 2.11 2415 139.78 0 23 Taipei,China 25 1.31 39 1.90 0 0 Tajikistan 42 7.07 156 26.34 0 6Thailand 62 1.20 265 4.83 11 11 Tonga 0 0.00 1 10.86 0 1 Turkmenistan 0 0.00 0 0.00 0 0 Uzbekistan 2 0.08 13 0.54 0 4 Vanuatu 0 0.00 3 19.93 0 0 Viet Nam, Soc. Rep. of 2 0.03 6 0.08 18 22
Note: Iterate (GTD), Iterate per million pop (GTD per million pop) are number of transnational (both transnational and domestic) terrorist attacks and number of attacks per million populations, respectively. External (Internal) conflicts represent the number of external (internal) conflicts a country experienced over the sample period.

ADBI Discussion Paper 113 Gaibulloev and Sandler
28
Table A2: Ranking of Terrorist Incidents and Conflicts by Country. 1970–2004
Rank Iterate Iterate per million pop GTD
GTD per million pop
External conflicts
Internal conflicts
1 Philippines Solomon Is. India Sri Lanka Viet Nam, SR* India 2 Pakistan Tajikistan Sri Lanka Palau Pakistan Philippines 3 India Fiji, Is. Pakistan Philippines India Indonesia 4 Cambodia Philippines Philippines Tajikistan Thailand Afghanistan 5 Afghanistan Singapore Bangladesh Georgia PRC* Cambodia 6 Korea, Rep.* Afghanistan Japan Papua N. G.* Australia Sri Lanka 7 Indonesia Cambodia Indonesia Vanuatu Korea, Rep.* Viet Nam, SR* 8 Thailand Georgia Afghanistan Pakistan New Zealand Bangladesh 9 Japan Lao PDR* Thailand Fiji, Is. Philippines Pakistan 10 Australia Australia Cambodia Afghanistan Cambodia Thailand 11 Tajikistan Malaysia Tajikistan Tonga Lao PDR* Nepal 12 Malaysia Hong Kong* PRC* Bangladesh Bangladesh Georgia 13 Sri Lanka Sri Lanka Nepal Cambodia Afghanistan Azerbaijan 14 Taipei,China Pakistan Georgia Brunei Armenia Papua N. G.* 15 PRC* Korea, Rep.* Papua N. G.* Samoa Azerbaijan Lao PDR* 16 Georgia Papua N. G.* Australia Nepal Bhutan Tajikistan 17 Bangladesh New Zealand Malaysia* Armenia Brunei Australia 18 Hong Kong* Taipei,China Taipei,China Thailand Fiji Is. Armenia 19 Singapore Kyrgyz Rep. Azerbaijan Azerbaijan Georgia Uzbekistan 20 Lao PDR* Thailand Hong Kong* Hong Kong* Hong Kong* Malaysia 21 Nepal Azerbaijan Armenia India Indonesia Japan 22 Azerbaijan Nepal Lao PDR* Australia Japan Kyrgyz Rep. 23 Kyrgyz Rep. Japan Fiji, Is. Singapore Kazakhstan New Zealand 24 Papua N. G.* Indonesia Uzbekistan Japan Kiribati Kazakhstan 25 Fiji Is. Armenia New Zealand Lao PDR* Kyrgyz Rep. Korea, Rep.* 26 New Zealand India Singapore New Zealand Malaysia Mongolia 27 Solomon Is. Bangladesh Kyrgyz Rep. Malaysia Maldives Tonga 28 Uzbekistan Uzbekistan Kazakhstan Solomon Is. Micronesia* Bhutan 29 Viet Nam, SR* Viet Nam, SR* Viet Nam, SR* Kyrgyz Rep. Mongolia Brunei 30 Armenia PRC* Vanuatu Taipei,China Nepal PRC* 31 Bhutan Bhutan Brunei Indonesia Palau Fiji Is. 32 Brunei Brunei Palau Uzbekistan Papua N. G.* Hong Kong* 33 Kazakhstan Kazakhstan Samoa Kazakhstan Samoa Kiribati 34 Kiribati Kiribati Solomon Is. PRC* Singapore Maldives 35 Maldives Maldives Tonga Viet Nam, SR* Solomon Is. Micronesia* 36 Micronesia* Micronesia* Bhutan Bhutan Sri Lanka Palau 37 Mongolia Mongolia Kiribati Kiribati Taipei,China Samoa 38 Palau Palau Korea, Rep.* Korea, Rep.* Tajikistan Singapore 39 Samoa Samoa Maldives Maldives Tonga Solomon Is. 40 Tonga Tonga Micronesia* Micronesia* Turkmenistan Taipei,China 41 Turkmenistan Turkmenistan Mongolia Mongolia Uzbekistan Turkmenistan 42 Vanuatu Vanuatu Turkmenistan Turkmenistan Vanuatu Vanuatu
*PRC indicates People’s Republic of China; Hong Kong is Hong Kong, China; Lao PDR denotes Lao People’s Democratic Republic; Korea, Rep represents Republic of Korea; Papua N. G. stands for Papua New Guinea; Micronesia indicates Micronesia, Federated States of; and Viet Nam, SR denotes Viet Nam, Socialist Republic of.