the impact of short rotation coppice cultivation on ... · in total, 15 data sets were identified...
TRANSCRIPT

G. Busch / Landbauforschung - vTI Agriculture and Forestry Research 3 2009 (59)207-222 207
The impact of Short Rotation Coppice cultivation on groundwater recharge – a spatial (planning) perspective
Gerald Busch*
* BALSA - Buro for Applied Landscape Ecology and Scenario Analysis, 37085Göttingen,Germany,[email protected]
Abstract
Thepotential impactofwillow/poplarSRConground-water recharge (GWR)ofarable land isan important is-sueforspatialenvironmentalassessments.Theapproachpresentedinthisstudyaimsatanimpactassessmentforregionalplanningpurposes.Basedona linearregressionofannualprecipitationtoactualevapotranspiration(VET),anupperLh(r²=0.89)andlowerLl(r²=0.74)boundaryofannualSRCwaterusewasdetermined.Theimpactas-sessmentmadeuseofpublicavailabledataonlandcover(ATKIS)soilproperties(BÜK50)andregionalclimate(pre-cipitation grids). The methodology refers to well estab-lishedrule-setsappliedto thesoil informationsystemofLowerSaxony,Germany(NIBIS).ResultsarepresentedfortwomunicipalitiesinthedistrictofUelzen,NorthernGer-many.Thestudyareaischaracterizedbysandysoils,alowgroundwatertableandprecipitationrangingfrom607to777 mm a-1.
VET calculated for the study area ranges from 560 to714mma-1for(Lh)andfrom488to544mma
-1for(Ll),respectively.Aconsiderablewaterdeficitcalculatedfor(Lh)conditions bears a high risk of yield decline. Comparedtocurrentagriculturallanduse,GWRof(Lh) substantiallydecreasesbyabout70%.Incaseof(Ll),GWRisreducedbyabout5to10%comparedtocurrentagriculturallanduse.Thus,fromtheperspectiveofgroundwaterprotec-tionthefocusshouldbeonSRCsystemsrepresenting(Ll)conditions. Theunderlying data indicate thatwillow (poplar) SRC
with2to4yearrotationperiodistypicalfor(Ll)conditions.Thereis,however,considerableuncertaintyandanurgentneed to improve the data base. Representing (Ll) condi-tions,SRCcouldbeaninterestinglanduseoptionduetoitspotentialpositive impactonsoilerosiongroundwaterqualityandlandscapestructure.
Keywords: SRC, spatial planning, qualitative assessment, water use, ground water recharge, evapotranspiration, interception
Zusammenfassung
Potentielle Auswirkungen von Kurzumtriebsplanta-gen (KUP) auf die Grundwasserneubildung (GWN) – Eine Landschafts(planungs)perspektive
DiepotentielleAuswirkung auf die Grundwasserneubil-dungdurchdenAnbauvonPappelundWeideaufAcker-standorten ist ein wichtiges Kriterium in der Umweltbe-wertungvonKUP.EswirdeinplanungsrelevanterAnsatzpräsentiert, der es erlaubt, diesen Einfluss quantitativundqualitativzubewerten.ZweilineareRegressionen(r²= 0,88; r² = 0,74) von Jahresniederschlag und aktuellerEvapotranspiration (ETa) determinieren den oberen (Lh)und unteren Grenzbereich (Ll) des annuellenWasserver-brauchsvonKUP.DieBerechnungenzumEinflussaufdieGrundwasserneubildung(GWN)nutzenallgemeinverfüg-bareDatenzuLandnutzung(ATKIS),Boden(BÜK50)undKlima(RegionalisierteNiederschläge).FürdieBerechnungkommen etablierte Methoden des NIBIS zum Einsatz.Am Beispiel von zwei Samtgemeinden (Suderburg undRosche)desLandkreisesUelzenwerdendieErgebnissederBewertung dargestellt. Das Untersuchungsgebiet weist vornehmlichsandigeBödenundeinenniedrigenGrund-wasserspiegel auf. Bei Jahresniederschlägen von607bis777 mm a-1 ergibt sich eine ETavon560bis714mma
-1 für (Lh),bzw.von488bis544mma
-1 für (Ll).DashoheWasserdefizit während der Vegetationsperiode führt zubeträchtlichenErtragsrisikenfür(Lh).ImVergleichzurak-tuellenlandwirtschaftlichenNutzungreduziertsichfür(Lh)dieGWNimMittelum70%.Für(Ll)beträgtdieVerringe-runglediglich5bis10%.KUP,diedenFall(Ll)widerspiegeln,stelleninweitenBe-
reichenkeinenbedenklichenEinflussaufdieGWNdarundsolltendaherbevorzugtwerden.Siekönntenzudemge-nutzt werden, um gezielt Erosionsschutz zu betreiben, die LandschaftsstrukturzuverbessernunddieGrundwasser-qualitätzusichern.DievorhandeneDatenbasisdeutetan,dassWeidemitRotationsperiodenvon2bis4Jahrendie(Ll)-Varianterepräsentieren–hierbestehtabererheblicherUntersuchungsbedarf.
Schlüsselwörter: Kurzumtriebsplantagen, Grundwasser-neubildung, aktuelle Evapotranspiration, räumliche Be-wertung, Wasserbedarf

208
Introduction
Due to national (e.g. EEG, Biomasseverordnung) andinternational incentives(EU–newRenewableEnergydi-rective)andincreasingenergypricesbiomasscropcultiva-tionspreadtosome2MiohainGermanyuntil2007.Thisareamatcheswith17%ofarablelandinGermany(FNR,2007).Variousenergyscenariosindicateoptionsofupto2
to5miohacroppedadditionallywithbiomassplantsuntil2030(Simonetal.,2005;FritscheundWiegmann,2005;FritscheandDehoust,2004).Untilnowpoliticalincentiveshavefocusedonrapeseed(biodiesel)andmaize(biogas).Recently,supportedbyenergysuppliersandindustriesoftheenergysector(e.g.RWE=10.000ha,www.rwe.com;SchellingerKG=5000ha),theestablishmentofSRCfieldshasbeenpromotedintensively.Estimatingaproportionof
Figure1:
MajorLandcovertypesinthemunicipalitiesofSuderburgandRosche
LK Uelzen
137 m
P: 708 mm T: 8.2 °C
219 km2
Rosche
Suderburg
248 km2
area (%) area (%)
cropland
pasture
forest
urban area
bog/heathland
river/stream
28
56
28
28
57
Source: ATKIS data - (AdV, 2003); BGR/NLFB, 2004
P: 648 mm T: 8.3 °C

G. Busch / Landbauforschung - vTI Agriculture and Forestry Research 3 2009 (59)207-222 209
10%offuturepotentialbiomassareainGermanywouldresult in200.000to500.000haofSRCfields.Sincetheestablishedclonesofwillowandpoplarareexpected toshow high annualwater demand compared to conven-tionalagriculturalcrops(e.g.Dimitriouetal.,2009;Knuretal.,2007;Hall,2003;Stephensetal.,2001)thepoten-tial impactongroundwater recharge isofcrucial impor-tance. Theextensivedynamicof landusechange from2002
to2007revealedthattherareneedstobeadaptedtothisprocesswithin the frameworkofexistingecological andspatialplanning.Todoso,toolsareneededthatallowfora rapid qualitative assessment even if the datamaterialis sparse and the knowledge about potential impacts islimited.BothholdstrueforthepotentialimpactsofSRCon groundwater recharge. Based on the statistical inter-pretationofcurrentlyavailabledataonwateruseofSRC,this study presents a straight-forward concept to assessSRCimpactongroundwaterrechargecomparedtocon-ventional cropping. Using public-available data on soilproperties, precipitationpatterns and land cover classifi-cation,thisapproachbuildsonexistingmethodsofeco-logicallandscapeanalysis,andspatialplanning(Marksetal.,1992;BastianundSchreiber,1999,Müller,2004;vonHaaren,2004).Theapproachwasappliedtotwomunici-palitiesinthedistrictofUelzen,NorthernGermany.AsaresultoftheGISanalysisthepotentialimpactofSRCcouldbespatiallyaddressedandqualitativelyassessed.
Material and methods
Study area
Theclimateofthestudyareaishumidtemperateoceanicwithameanannualtemperatureof8.1to8.2°andmeanannualprecipitationrangingfrom607to777mm(BGR/NLFB, 2004). The existing hydrological system,morpho-logicalhabitandsoilassociationoriginate inpleistoceneglacialprocesses(Saaleglacial).Thusthelandscapeischar-acterizedbyanundulatingterrainwithsomesteeperslopeinterminalmoraineareas.AnoverallWest-East-gradientofdecreasingprecipitationismodifiedbyleewardeffectsoftheterminalmorainemargin.Soilsaredominatedbyasandytexturewithincreasingproportionofsiltandclayingroundmoraine regions.Apart frommeadowareas thegroundwatertableislow.TheverypoorsandysoilswereafforestedwithpineafterWorldWarII.Heath,associatedbogsandfensstillcoverasmallpercentageof landandare of great nature conservation value. The agriculturalareafocusesonmoreproductivesoilssituatedingroundmoraineregions.Maximumheightofthestudyareais137m(South-WestSuderburg).Thecroplandarea,asamar-ginalpartofthe“Uelzen-basin”,variesbetween42mand
75mofheight. InSuderburg,however,croplandcoversonly28%ofthemunicipality(seeFigure1).Currentagri-culturallanduseisdominatedbycroplandwithacropmixofbarley,potato,wheat,andsugarbeet.InthedistrictofUelzencroplandirrigationiscommonpractice.About81%ofarablelandiscurrentlybeingirrigatedwithameanannualgroundwateruseof76mm(Fricke,2006;2008).
Derivation of SRC actual evapotranspiration (VET)
Basedonanextensiveliteraturereview,availableinfor-mationonactualevapotranspiration(VET)ofSRCwascom-piled.Thedatabasis,however,isquitelimited(seeDimi-triou et al., 2009). Theunderlyingdata sources refer tovarioussitesinGermany,GreatBritainandSweden,repre-sentingdifferentclimaticconditionsandsitequalities.Theutmostdatagiveninliteraturearemodelingresultsstem-mingfromdifferentmodels,varyingassumptionsconcern-ingtheinputparametersandadistinctmodelparametri-zation.ForadetaileddescriptionregardingthereviewofSRCevapotranspirationseeDimitriouetal.,2009.Intotal,15datasetswereidentifiedrepresentingboth
non-irrigatedandnon-fertilizedpoplarandwillowstandsofdifferentage(seeTable1andTable2).Forsomedatasets, annual VETwasderivedfromactualevapotranspira-tion during the vegetation period using a coefficient of1.222 (Hörmann et al., 2007;Mayer, 2005; Nützmann,2004)dependingonthelengthofthevegetationperiodreferredto.Thedatawereseparatedintotwogroups:Group1 (Table1) representsSRCwith longer rotation
periods,fullydevelopedrootingextensionorprecipitationnumbersthatcorrespondtolong-termaverageprecipita-tion numbers. Group2(Table2)depictsthegivendatawithnewlyes-
tablishedSRCfieldsorprecipitationdatathatclearlydevi-atefromthelong-termaverage.IncaseoftheWelzowsiteextraordinarayhighprecipitationnumbersareassociatedwithfairlyhighdeeppercolationrates(BungartandHüttl,2004).Forbothdatagroups,alinearregressionwasusedtoanal-ysethechangeofannualevapotranspiration(VET)againstannualprecipitation(P).Theresultinglinearfunctionswereinterpretedasboundary lines that cover a“corridor”ofpossibleVETpathways(seeFigure2).Theupperboundaryline–whichisrepresenting“Group1-data–isaddressedas“Lh variant” intheresultssection.The lowerboundarylineisreferredtoas“Llvariant”.

210
Table1:
SitecharacteristicsofpoplarandwillowSRC–Group1
stand/ shoot age
Site Soil Species P (mm) VE + VT (veg)
VE + VT (year)
VI VET Source Country
9/9 Neuruppin loamysand Po 580(c) 359 170 529 2 GER
9/9 Lindenberg loamysand Po 634(c) 393 171 564 2 GER
div div claysoil Wi 700(lta) 500 140 640 3 GB
6/3 Alyckan sandyloam Wi 641(lta) 440 550(e) 40 590 4 SE
x/2 Silsoe sandy-loamyclay Wi 574(lta) 441 125 566 5 GB
x/2 Selby sandyclayloam Wi 643(lta) 462 130 592 5 GB
x/2 Cirencester sandyclayloam Wi 776(lta) 594 140 734 5 GB
2Knuretal.,2007,3Hall,2003,4Persson,1995,5Stephensetal.,2001
x–subsequentrotationperiod
c-corrected
e–extrapolated
Po–poplar
Wi–willow
lta–longe-termaverage
veg–vegetationperiod
VEevaporation
VTtranspiration
VI interception
VETevapotranspiration
Table2:
SitecharacteristicsofpoplarandwillowSRC–Group2
stand/ shoot age
Site Soil Species P (mm) VE + VT (veg)
VE + VT (year)
VI VET Country Source
3/3 Neuruppin loamysand Po 580(c) 356 117 472 GER 2
3/3 Börringe sandyloam Wi 586 360 439(e.) 30 469 SE 4
7/2 Brinkendahl sandyloam Wi 641(lta) 374 456(e.) 59 515 SE 4
8/8 Welzow clayysand Po 749(lta570)
404 138 542 SE 6
8/8 Welzow clayysand Po 749(lta570)
388 132 520 GER 6
3/3 Schönberg sandyloam Po 782 572 GER 7
3/3 Schönberg sandyloam Wi 782 500 GER 7
2 Knur et al., 2007, 4 Persson, 1995, , 6BungartandHüttl,2004,7 Kahle et al., 2005
x–subsequentrotationperiod
c-corrected
e–extrapolated
Po–poplar
Wi–willow
lta–longe-termaverage
veg–vegetationperiod
VEevaporation
VTtranspiration
VIinterception
VETevapotranspiration

G. Busch / Landbauforschung - vTI Agriculture and Forestry Research 3 2009 (59)207-222 211
800
750
700
650
600
550
500
450
400
350
300
300
350
400
450
500
550
600
650
700
750
800
850
900
950
1000
V [mm]ET
P [mm]
Group 1
Group 2
y = 0.854x + 47.453R = 0.899
2
y = 0.344x + 276.72R = 0.7423
2
Figure2:
Correlationofannualprecipitationandactualevapotranspiration(VET)fordif-ferent SRC sites
Calculation of groundwater change due to SRC
Precipitation patterns
The precipitation data for the study area were takenfromNIBIS(BGR/NLfB,2004;Müller,2004).Thedatare-flectaregionalizedgridofmonthlyprecipitationpatternswith a grid size of 50m² and are based on long-termmeasurements (1961 to 1990) provided by “DeutscherWetterdienst”. The data were summed up to annualprecipitation numbers and to values referring to thevegetationperiod (1.4. to31.10.)ThevegetationperiodforSRCplants is clone-specificanddependsonclimaticboundary conditions. However, this vegetation periodwaschosentocovertherangeofvaluestakenfromtheinternational literature (e.g. Persson, 1995; Stephenset al., 2001; Persson and Lindroth, 1994). In a secondstep, precipitation patterns were intersected with cur-rent cropland area to cover potential sites of SRC. Cur-rentcroplandareawasderivedfromATKIS(Amtlich-Topo-graphisches-Kartographisches Informationssystem) pro- vided by LGN (Landesvermessung+GeobasisinformationNiedersachsen).
Plant available water (PAW) and total plant available water (TPAW)
Plantavailablewaterwascalculatedbymultiplyingtheavailable soil water capacity (AWC) by the plant’s root-ingdepth.AWCwasdeterminedbyusing thedatabaseof soilmaps (scaleof1:50.000)providedby theFederalInstituteofGeosciencesandNaturalResources(BGR).Themulti-stepcalculationofPAWfollowedawellestablished
rule-setsuppliedbytheStateAuthorityforMining,EnergyandGeology(Müller,2004).TPAWcomprisesboth,avail-ablesoilwatercapacityandcapillaryrisefromthewatertable.Again,thecalculationfollowedtherule-setofMül-ler (2004). Effective rooting depthwas calculated for 2variants:(1)Arootingdepthrangingbetween90to150cm–thisreflectspoplarstandswithlongerrotationperiodsanddifferentsoiltextureaccordingtoRaissietal.(2001).
(2)Arootingdepthrangingbetween55cmand100cm–referringtodataobtainedfromwillowsitesbyPersson(1994),andRytterandHansson(1996).
Soil water demand
Bybalancingactualevapotranspiration(VETveg)andpre-cipitation (Pveg) for the vegetation period, the soilwaterdemand(SWdem)wascalculatedforboth,the(Lh)andthe(Ll)variant(Step1–Figure3).AccordingtoHörmannetal.(2007),Mayer(2005)andNützmann(2004),aratioofVETveg/VETof0.85wasapplied.Theresultingbalancewassetoffagainsttotalplantavailablewater(for2rootexten-sions)tocalculatesoilwaterdemandofSRC(SWdem–seeStep2-Figure3).
Soil water deficit and potential risk of yield decline
In general, plants could only use 50 to 70% of theTPAWwithoutreducingtranspirationandgrowth(Wohl-rabetal.,1992;Frede,2006).Further,deeppercolationofprecipitationwaterduringthevegetationperiodreducesthe available precipitation water for SRC. To cover thisaspectforanevaluationofpotentialsoilwaterdeficit,a10%percolationrateofprecipitationduringthevegeta-tionperiodwasassumedtotakeeffect.This is inaccor-dancewithdataprovidedbyKnuretal.,(2007);Persson,(1995); andBungartandHüttl (2004). Thus, apotentialsoilwaterdeficitoccurs,ifsoilwaterdemandpluspercola-tionrateexceeds70%ofTPAW.
STEPGroup I (rooting depth 55 to 90 cm)Group II (rooting depth 70 to150 cm)
I P Veg –VETveg = SWdem
II SWdem + TPAW = SWuse
III P nVeg –SW use –VETnveg = GWRpot
IV GWR /GWR pot crops ·100=GWR change %
Figure3:
AnalysisstepsforthecalculationofchangeinGWR

212
Ground water recharge (GWR) of current land use
Again,thecalculationfollowedarule-setdevelopedbyMüller(2004)thatisofficiallyusedforplanningpurposes.Majorinputparametersforthiscalculationare:totalplantavailablewater,precipitation,potentialevapotranspiration(VEtp). The calculationofVEtp refers to a typical crop-mixbasedonmunicipalagriculturalstatistics.Asaninputforthe qualitative assessment of the environmental impactanalysis, theresultsweresubdivided into5classesrang-ingfromverylowtoveryhighaccordingtoMarksetal.(1992).
Ground water recharge (GWR) of potential SRC sites
To calculate the amount of groundwater recharge from SRCfields(GWRpot),usedTPAW(SWuse)duringthevege-tationperiodwasbalancedagainstboth,precipitationandactual evapotranspiration of the non-vegetation period(VETnveg).Inalaststep(seeFigure3),theoverlayofground-water recharge from SRC and current agricultural land use (GWRcrops)producedrelativechangeofgroundwaterre-charge due to SRC on arable land.
Ecological impact analysis
The ecological impact analysis is an established toolforqualitativeassessments inregionalplanningexercises(vonHaaren,2006;JesselandTobias,2002).Inthisstudy,theapproachwasusedtoevaluate thepotential impactofSRCongroundwater recharge.Theecological impactanalysisisbasedonamatrixapproach(seeFigure4)thatbuildsonsensitivityofalandscapefunction(GWRonthey-axis)versusimpactintensity(relativedeclineinGWRduetoSRCon thex-axis).Asa result it ispossible toevalu-atequalitativelytheimpairmentofanecologicalfunction(groundwater recharge). Thus, the qualitative deductionalways reflects a mental model and/or ecological goalswhichcouldberegion-specific.Therationalebehindthequalitativeassessmentinthisstudywastodistinguishbe-tween5classesrangingfromverylowtoveryhighpoten-tialdamage (Figure4).Very lowto low impactonGWRwasassessedtobetolerable(seeFigure4).
Decline in GWRImpact
very low
low
medium
high
very high
tolerable
Figure4:
Assessmentmatrixoftheecologicalimpactanalysis
Results and discussion
VET
Annual VETofthe(Lh)variantrangesbetween610and714mm in Suderburg and between 560 and 638mmin Rosche, respectively.Mean VET in Suderburg is about 57 mm a-1highercomparedtoRosche.Figure5adepictsthe SW-NEgradientofVET in Suderburg. In Rosche, the centralandsouthernpart show lowestvaluesofannualVET. Due to the lower gradient of the statistical regression in the (Ll) variant, VET values do not spread asmuch asshownforthe(Lh)variant.MeanannualVET in Suderburg is onlyabout20mmhigherthaninRosche.AnnualVET rang-esbetween503and544mminSuderburgandbetween485 and514mma-1 in Rosche, respectively (see Figure5b).ThedifferenceinmeanannualVETforthetwovariants(Lh)and(Ll)is130mminSuderburgand93mminRosche.
Soil water demand
PrecipitationwasbalancedwithVET for thevegetationperiodtocalculateforthesoilwaterdemand.Figure6de-pictsthatthereisaconsiderabledifferenceinwaterdeficitforthetwoSRCvariants.MeanVETveg(Lh)wascalculatedto be 550 mm in Suderburg and 502 mm for Rosche. The resulting demand for plant available water rangesfrom107to153mm–withmanvaluesof131mmand112mm, respectively (seeFigure6a).AnaverageTPAWof169mminSuderburgand185mminRosche,respec-tively covers the soilwater demand during the vetationperiodon98%ofthecroplandarea.Forthe(Ll)variant,mean VETvegonlyslightlyvariesbetween423mminSud-erburgand420mminRosche.Soilwaterdemandiscon-
v. high
high
GW
R
medium
low
v. low
< 25 % 25 - 50 % 50 - 75 % > 75 %

G. Busch / Landbauforschung - vTI Agriculture and Forestry Research 3 2009 (59)207-222 213
SuderburgRosche
Rosche
< 500
500 550
550 600
600 650
650 700
700 750
–
–
–
–
–
mm
Suderburg
a)
b)
Figure5:
AnnualactualevapotranspirationofpotentialSRCsitesoncroplandinthemunicipalitiesofSuderburgandRosche.a)Lhvariantb)Llvariant

214
siderablylower–withmeanvaluesof8mmand30mm,respectively. In Suderburg about30%of cropland areaeven shows a small surplus in the balance between VET andprecipitationduringthevegetationperiod(seeFigure6b).ThisdemandisbalancedbyameanTPAWof108to114mminbothmunicipalities.Note,thatonly2%inSu-derburg,respectively6%ofthecroplandareainRosche gainsaprofitfromthegroundwatertable.
Soil water deficit and potential risk of yield decline
Atfirstsight,SRCdemandforsoilwaterisfullybalancedforbothvariants.However,toanswerthequestionifthetheamountofTPAWissufficienttosustainstableyields,both, lossesofpercolationwaterandplantphysiologicalrestrictionshave tobe considered.Onaverage, a10%lossofprecipitation(Pveg)duetodeeppercolationaccountsfor38mm inSuderburgand34mm inRosche, respec-tively.InSuderburg,131mmofsoilwaterdemandplus38mmofpercolationwaterneedtobebalancedbyatleast241mm of TPAW (Lh variant). Thus, 169mm of TPAW(area-weighted average) results in a potential soilwaterdeficitofabout70mminSuderburg.InRosche,thesumofsoilwaterdemand(112mm)andpercolationwater(34mm)accounts for146mm.WithameanTPAWof185mmthesesitesarenotcapableofcompensatingforthedemand of about 208 mm. Hence,95 to98%of thecroplandarea inbothmu-
nicipalitiesshowsinsufficientplantavailablewatertosus-tainstableyieldsandisthereforenotsuitedforSRCunder(Lh) conditions (see Figure 7a). The remaining 2 to 5%ofcroplandareareflectssoilswithcapillaryrisefromthewatertable.((Lh)variant–seeFigure7a).Forthe(Ll)variant,averagesoilwaterdemandinSud-
erburgonlyaccountsforabout8mmwhileitisbalancedbyanaverageTPAWof108mm.Hence,thesumofsoilwater demand and percolation loss by about 46mm isfully balanced on all potential SRC sites (see Figure 7b)withoutusingwaterduetocapillaryrisefromtheground-water table. InRosche,duetolowerprecipitation,SRCsoilwaterde-
mandduringthevegetationperiodishigherandaccountsfor30mmonaverage.Asaresult,about64mmhavetobebalancedby70%ofTPAWtomaintainstableyields.DespiteanaverageTPAWof114mm,about32%ofthecroplandsitesdonotmeet thiscriterion (seeFigure7b).However,about68%of thecroplandarea is suitedforSRCunder(Ll)conditions.To sustain stable yields, the following rule of thumb
couldbeformulated:
VETveg<=Σ(0.55Pyear+0.7*PAW).
Ifthisequationistrue,nogroundwaterisneededtosup-plySRCwaterdemand.Withannualprecipitationof610to 770 mm and VETveg(Lh)rangingfrom475to600mmatleast 200 to 260 mm of PAW is needed to balance the wa-ter demand without using groundwater and to maintain stableyields.For(Ll)conditions(VETveg=400to450mm)PAWonlyhastoaccountfor80to100mm.
Ground water recharge (GWR)
Forcroplandareas,theaverageproportionofGWRtoannualprecipitation is38% inSuderburgand35% inRosche.Inabsolutenumbers,GWRfromcroplandrangesbetween 52 and 360 mm a-1.Accordingtotheclassifica-tionbyMarksetal.(1992),highGWRispredominantoncroplandareasinSuderburg.InRosche,onlynortheasternparts showhighGWRwhilemediumGWR is typical forthemajorcroplandarea(seeFigure8).For (Lh), SRC groundwater recharge ranges from42 to
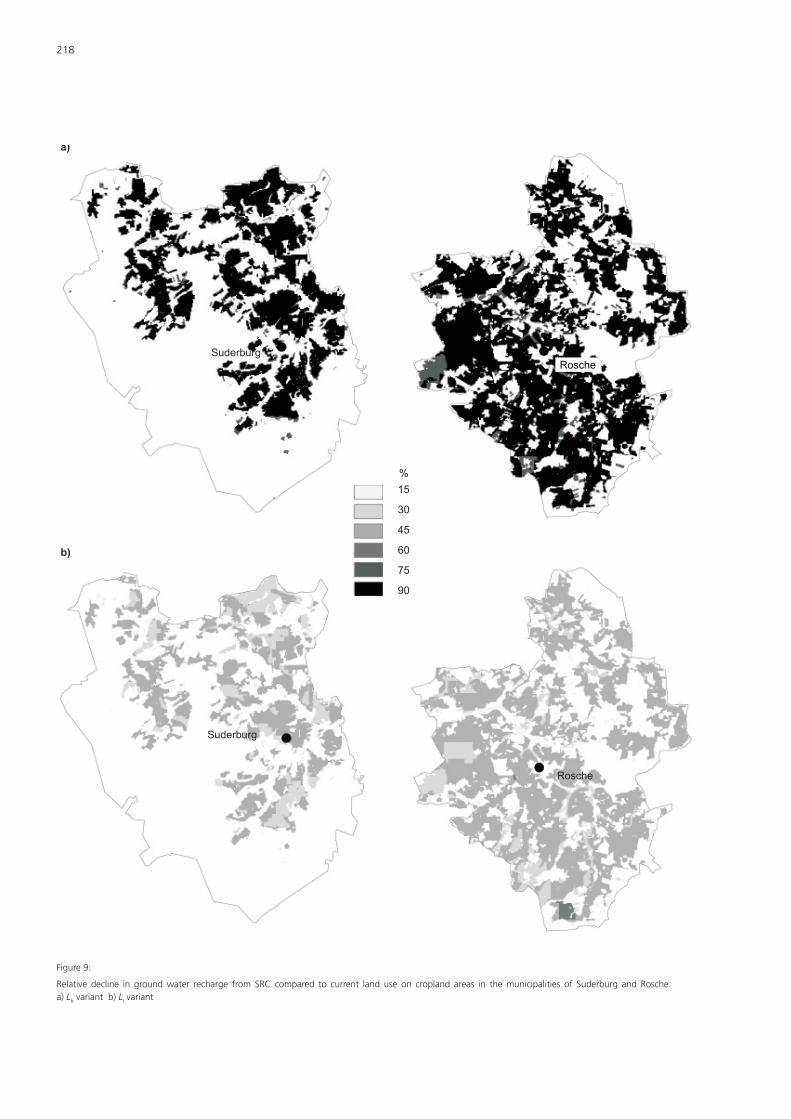
95 mm a-1which isequivalent to7.5 to13%ofannualprecipitation.Thus,theaveragedeclineofGWRduetoSRCuseisabout74%.Inbothmunicipalitiesmorethan90%ofcroplandareashowsadeclineinGWRwhichishigherthan70%comparedtocurrentcroplanduse(seeFigure9).ThenumbersgivenforGWRofcurrentcroplandusedo
nottakeintoaccountthatabout85%ofarablelandinthedistrictofUelzen is irrigated(Fricke,2006).Onaver-age, 76 mm of groundwater is used as irrigation water (Fricke,2008).Consideringalossof70%duetoevapo-transpiration of irrigation water (according to Frede,2006),acomparisonbetweencurrentlanduseandSRCofthe(Lh)variantstillrevealsanaveragedecreasebyabout70%.Thus,accordingtotheclassificationofMarksetal.(1992),GWRofSRChastobeclassifiedas“verylow”.For(Ll),SRCgroundwaterrechargerangesfrom122to
233 mm a-1 (low tomedium according toMarks et al.,1992).Thisisequivalentto20to30%ofannualprecipi-tation,and indicatesanaveragedeclinebyabout30%comparedtocurrentcroplanduse.Takingintoaccounttheirrigationlossofcurrentcroplanduse,therelativedeclinereducestoonly5to10%onaverage.
Qualitative ecological impact assessment
Theecological impactanalysisofSRCongroundwaterrechargebuildsonthesensitivityofGWRversusitsimpactintensitycausedbychangesofGWR.Theimpairmentofthe groundwater recharge as an ecological function was assessed to be tolerable if the decline in GWR does not exceed25%andGWRofcurrentlanduseishigherthan180 mm a-1.ForveryhighGWRnumbers(>320mma-1)atolerabledeclinecouldevenriseto50%(seeFigure4).DuetotheveryhighdeclineinGWRunder(Lh)conditions,

G. Busch / Landbauforschung - vTI Agriculture and Forestry Research 3 2009 (59)207-222 215
Suderburg Rosche
Rosche
< 25
25 50
50 75
75 100
100 125
125 150
–
–
–
–
–
Suderburg
a)
b)
mm
surplus
Figure6:
Soilwaterdemand(duringthevegetationperiod)ofpotentialSRCsitesoncroplandinthemunicipalitiesofSuderburgandRosche.a)Lhvariantb)Llvariant

216
100
125
150
175
200
> 200
risk ofyield decline
mm
SuderburgRosche
RoscheSuderburg
a)
b)
Figure7:
Totalplantavailablewater(duringthevegetationperiod)fromcroplandinthemunicipalitiesofSuderburgandRosche.a)Lhvariantb)Llvariant.TheLh variantwascalculatedwithaneffectiverootingdepthof90to150cm.TheLlvariantreferstoaneffectiverootingdepthbetween55and100cm.

G. Busch / Landbauforschung - vTI Agriculture and Forestry Research 3 2009 (59)207-222 217
Suderburg Rosche
very low
low
medium
high
very high
(< 100 mm)
(100 180 mm)
(180 240 mm)
(240 320 mm)
(> 320 mm)
–
–
–
Figure8:
Groundwaterrecharge(currentlanduse)fromcroplandareasinthemunicipalitiesofSuderburgandRosche
thisenvironmentalgoalcouldnotbemet inthemunici-palitiesofSuderburgandRosche(Figure10).Onthecon-trary,about90%ofthepotentialSRCsiteswereassessedto have a very high impact on groundwater recharge.Withrespecttogroundwaterprotection,SRCsystemsrep-resenting(Lh)conditionsshouldnotbeestablishedinthestudyarea.For(Ll)conditions,largeareas(about86%inSuderburgand92%inRosche,respectively)showamediumimpact,i.e., thedecline inGWRranges from25 to40%whileGWRisclassifiedasmediumtohigh.Theseareasdonotmeetthegoalsofthequalitativeassessment.Notehow-ever, that the average reduction by about 80mma-1 is comparabletothecurrentlossofirrigationwaterforan-nualcropping.Approximately9to14%ofthecropareainbothmunicipalitiesdoesmeettheassessmentgoalandshouldbegivenprioritywhenimplementingSRC.
Conclusions
There isanurgentneedtoassesspotential impactsofSRC on landscape functions (e.g. for spatial planning).Despite sparsedataand, thus,highuncertaintyof inter-pretation,theapproachpresentedinthisstudycouldbeastartingpointsinceitsstatisticalrelationofannualpre-cipitationagainstactualevapotranspirationallows toas-sess SRCwater use basedonpublic available data. Thetwovariants,(Lh)and(Ll)representfrontierareasofafairlybroadcorridorofpotentialSRCwateruse. Itremainsanopen question if a transition from (Ll) to (Lh) conditionsduringaSRClifecycleisaplausiblepathway.Resultsforthetwoboundaryconditionsshowthatim-
pactsonGWRcouldbe completelydifferentdependingonsite-specificconditionsandtheSRCvariantchosen.Inthestudyarea,thecombinationofsandysoilswithhighratesofGWRbutquitelowamountsofPAWleadsbyitselftoapotentiallyhighimpactofSRConGWR.TheresultsofanecologicalimpactassessmentonGWRwouldbequite
218
Suderburg
Rosche
Suderburg
a)
b)
Rosche
15
30
45
60
75
90
%
Figure9:
Relative decline in groundwater recharge from SRC compared to current land use on cropland areas in themunicipalities of Suderburg and Rosche. aaaaaaaa a)Lhvariantb) Llvariant

G. Busch / Landbauforschung - vTI Agriculture and Forestry Research 3 2009 (59)207-222 219
very low
low
medium
high
very high
Suderburg
RoscheSuderburg
a)
b)
Rosche
Figure10:
SRCanditsecologicalimpactongroundwaterrechargeinthemunicipalitiesofSuderburgandRosche.a)Lhvariantb)Ll variant

220
differentwhencarriedouton loamysoilswithconsider-ablylowerratesofGWRbuthigherAWC.Asaconsequence,anecologicalevaluationoflandscape
functionshastoconsidertheimpactofsite-specificcondi-tionsonenvironmentalgoals. The followingconclusionscanbedrawnfromtheresultsofthispaper:• Ingeneral,existingdataimplythatSRCwaterusein-creaseswithlongerrotationperiods.Thus,thesetypesofSRC(e.g.poplarSRC)shouldberestrictedtositeswithhighwatersupply.Inregionswithapotentialde-ficitinoneofthewaterpools(precipitation,availablesoilwater,andcapillaryrisefromthewatertable)itisarisk-minimizingstrategytofocusonSRCwithrotationperiodsof2to4years.
• SRCrepresenting(Lh)conditionsshouldpreferablybeestablished on siteswith highAWC (loamy and siltytexture) to minimize a potential negative impact ongroundwaterrechargeandtosustainstableyields
• For (Ll) conditions, sandy soils could be appropriatesitesforSRCwitharotationperiodof2to4years.Representing(Ll)conditions,SRCcouldbeaninteresting
landuseoptionduetoitspotentialpositiveimpactonsoilerosiongroundwaterqualityandlandscapestructure(e.g.Baumetal,2009;Lamersorfetal.,2008).Inregionswithlow summer precipitation, it could bemore appropriatetoestablishSRCwithspeciessuchasblacklocust.Thus,itwouldbeimportanttocollectdataforadditionalspeciesandforprecipitationnumbers thatareat the lowerendofthisinvestigation.Animproveddatabaseisneededtonarrowdownthepotentialcorridorofwateruseandtoderive rule-sets for a semi-quantitative to qualitative as-sessmentoflandscapefunctions.Thefollowingitemsarejudgedtobemostimportant:
• torecordsiteswithdifferent(physical)soilproperties• toconsiderdifferentclimatictypeswithafocusonpre-cipitationpatterns
• totakeintoaccountdistinctrotationperiods• to distinguish between willow, poplar and certain
clones• tobroadentheapproachbyotherspecies,e.g.black
locust• tocarryoutlong-termmeasurements• tocapturetranspiration,soilevaporationandintercep-
tion • toidentifyeffectiverootingdepth
Acknowledgement
ThisstudywasfundedbytheDeutscheBundesstiftungUmwelt(DBU)withintheprojectNOVALISandbytheGer-manFederalMinistryofFood,AgricultureandConsumerProtection(BMELV)undercoordinationoftheFachagenturNachwachsende Rohstoffe (FNR) aswell as the Swedish
EnergyAgencywithintheFP7ERA-NetBioenergyProjectRATING-SRC.The authorwould like to thank U. Steinhardt and N.
Lamersdorfforimprovingthemanuscript.
References
AdV–ArbeitsgemeinschaftderVermessungsverwaltungenderLänderderBun-desrepublik Deutschland (2003) ATKIS Objektartenkatalog : Gesamtaus-gabeNiedersachsen.Version3.2 [online].Zufinden in<http://www. lgn.niedersachsen.de/master/C8950158_N8913975_L20_D0_I7746208.html> [zitiertam21.08.2009]
BastianO,SchreiberKF(1999)AnalyseundökologischeBewertungderLand-schaft. Jena;Stuttgart:Fischer,564p
BaumS,WeihM,BuschG,KroiherF,BolteA(2009)Theimpactofshortrota-tioncoppiceplantationsonphytodiversity.Landbauforsch59(3):163-170
BGR/NLfB(2004)DieKlimadaten imNiedersächsischenBodeninformationssy-stem(NIBIS)undimFachinformationssystemBodenkundederBGR(FISBoBGR).ArbeitshefteBodenHeft2004/4
Bungart R, Hüttl RF (2004) Growth dynamics and biomass accumulation of8-year-oldhybridpoplarclonesinashort-rotationplantationonaclayey-sandyminingsubstratewithrespecttoplantnutritionandwaterbudget.EuropJForestRes123(2):105-115
DimitiouJ,BuschG,JakobsS,Schmidt-WalterP,LamersdorfN(2009)Areviewoftheimpactsofshortrotationcoppicecultivationonwaterissues.Land-bauforsch59(3):197-206
FNR - Fachagentur Nachwachsende Rohstoffe (2007) Nachwachsende Roh-stoffe:Anbauaufüber2MillionenHektar-ProduktionpflanzlicherEner-gie-undIndustrierohstoffeinDeutschlandweiterausgedehnt–Pressemit-teilungvom07.09.2007-08:45Uhr
FredeH-G(2006)LandwirtschaftlicheBewässerung:EinflussaufdenWasser-undStoffhaushalt[online].Zufindenin<http://www.dlg.org/uploads/me-dia/Frede.pdf> [zitiertam21.08.2009]
FrickeE(2006)LandwirtschaftlicheBewässerung:einBeitragzurErtragssiche-rung[online].Zufindenin<http://www.dlg.org/uploads/media/Fricke_01.pdf>[zitiertam21.08.2009]
Fricke E (2008) WRRL : regionale Umsetzung in Niedersachsen [online]. Zufinden in <http://www. dlg.org/uploads/media/Fricke.pdf> [zitiert am21.08.2009]
Fritsche UR, Dehoust G (2004) Stoffstromanalyse zur nachhaltigen energe-tischenNutzungvonBiomasse.Darmstadt:Öko-Inst
FritscheUR,WiegmanK(2005)PotenzialundSzenarienfürzukünftigeBiomas-senutzung. NatLandschaft80(9/10):396-399
HallRL(2003)Shortrotationcoppiceforenergyproductionhydrologicalguide-lines [online]. Zu finden in <http://www. berr.gov.uk/files/file14960.pdf> [zitiertam21.08.2009]
HörmannG,FohrerN,ConradY(2007)EinführungindieHydrologieundWas-serwirtschaft:VorlesungsskriptderFachabteilungHydrologieundWasser-wirtschaftderChristian-Albrechts-UniversitätKiel
JesselB,TobiasK(2002)ÖkologischorientiertePlanung:eineEinführung inTheorien,DatenundMethoden.Stuttgart:Ulmer,470p
KahleP,KoopB,LennartzB(2005)SchnellwachsendeBaumartenfürqualifi-zierteAbdeckungenzurOberflächensicherungvonKlein-Deponien.Altla-sten-Spektrum5:286-290
KnurL,MurachD,MurnY,BilkeG,MuchinA,GrundmannP,EbertsJ,Schnei-derU,GrünewaldH,SchultzeB,QuinkensteinA,JochheimH(2007)Poten-tials,economyandecologyofasustainablesupplywithwoodenbiomass[online].Zufindenin<http://www.dendrom.de/daten/downloads/ManuscriptOB7.3biomassconferenceKNUR1.pdf>[zitiertam21.08.2009]
Lamersdorf N, Bielefeldt J, Bolte A, Busch G, Dohrenbusch A, Knust C, Kroiher F,SchulzU,StollB(2008)NaturverträglichkeitvonAgrarholzpflanzungen:ersteErgebnisseausdemProjektNOVALIS.In:HolzerzeugunginderLand-wirtschaft.CottbuserSchrÖkosystemgeneseLandschaftsentwickl6:19-32

G. Busch / Landbauforschung - vTI Agriculture and Forestry Research 3 2009 (59)207-222 221
Marks R (ed) (1992) Anleitung zur Bewertung des Leistungsvermögens desLandschaftshaushaltes(BALVL),Trier:ZentralausschußfürDt.Landeskun-de,222p,ForschungenzurdeutschenLandeskunde229
MayerG(2005)ForstlicheHydrometeorologie:Vorlesungsskript.Freiburg:Me-teorologisches Institut
MüllerU(2004)AuswertungsmethodenimBodenschutz:DokumentationzurMethodenbankdesNiedersächsischenBodeninformationssystems (NIBIS).Stuttgart:Schweizerbart,ArbeitshefteBoden2004/2
NützmannG (2004)Einführung indieHydrologie :Vorlesungsskript.Berlin :InstitutfürGewässerökologieundBinnenfischerei
PerssonG(1995)WillowstandevapotranspirationsimulatedforSwedishsoils.AgricWaterManage28:271-293
PerssonG,LindrothA(1994)Simulatingevaporationfromshort-rotationfor-est:variationswithinandbetweenseasons.JHydrol156:21-45
RaissiF,MüllerU,MeesenburgH(2001)ErmittlungdereffektivenDurchwurze-lungstiefevonForststandorten[online].Zufindenin<http://cdl.niedersach-sen.de/blob/images/C38207864_L20.pdf>[zitiertam21.08.2009]
RytterRM,HanssonAC(1996)Seasonalamount,growthanddepthdistribu-tionoffinerootsinanirrigatedandfertilizedSalixviminalisL-plantation.BiomassBioenerg11(2-3):129-137
SimonS,WiegmannK,HeißenhuberK-A(2005)NachhaltigeenergetischeNut-zungvonBiomasse :dynamischeErmittlungvonBiomassepotenzialen inderLandwirtschaftzurGenerierungvonSzenarien.SchrGesWirtschSozial-Schr Ges Wirtsch Sozial-wissLandbaues40:351-360
StephensW,HessT,KnoxJ (2001)Reviewoftheeffectsofenergycropsonhydrology [online]. Zu finden in <https://dspace.lib.cranfield.ac.uk/bit-stream/1826/3368/1/Review%20of%20the%20effects%20of%20ener-gy%20crops%20on%20hydrology-2001.pdf>[zitiertam21.08.2009]
vonHaarenU(2004)Landschaftsplanung.Stuttgart:Ulmer,527pWohlrab B, ErnstbergerH,MeuserA, Sokollek V (1992) Landschaftswasser-
haushalt :WasserkreislaufundGewässer im ländlichenRaum ;Verände-rungen durch Bodennutzung,Wasserbau und Kulturtechnik. Hamburg ;Berlin:Parey,352p

222