the impact of science fair projects on student …
TRANSCRIPT

THE IMPACT OF SCIENCE FAIR PROJECTS ON STUDENT LEARNING AND
MASTERY OF NATURE OF SCIENCE OBJECTIVES IN 9th GRADE PHYSICAL
SCIENCE
by
Zachary C. Thomas
A professional paper submitted in partial fulfillment of the requirements for the degree
of
Master of Science
in
Science Education
MONTANA STATE UNIVERSITY Bozeman, Montana
July 2013

ii
STATEMENT OF PERMISSION TO USE
In presenting this professional paper in partial fulfillment of the requirements for
a master’s degree at Montana State University, I agree that the MSSE program shall
make it available to borrowers under the under the rules of the program.
Zachary C. Thomas
July 2013

iii
TABLES OF CONTENTS
INTRODUCTION AND BACKGROUND ........................................................................1
CONCEPTUAL FRAMEWORK ........................................................................................2
METHODOLOGY ..............................................................................................................6
DATA AND ANALYSIS ....................................................................................................9
INTERPRETATION AND CONCLUSION .....................................................................20
VALUE ..............................................................................................................................22
REFERENCES CITED ......................................................................................................26
APPENDICES ...................................................................................................................28
APPENDIX A: Nature of Science Objectives in the State of Arkansas ...............29 APPENDIX B: Administrator Exemption Form ..................................................33 APPENDIX C: Nature of Science Pretest and Posttest ........................................35 APPENDIX D: Science Fair Student Survey .......................................................40 APPENDIX E: Science Fair Paper and Presentation Rubric ................................43 APPENDIX F: Student Interview Questions ........................................................48

iv
LIST OF TABLES
1. Triangulation Matrix ........................................................................................................9

v
LIST OF FIGURES
1. Science Fair Pre-Test/Post-Test Hypothesis Questions ..........................................10
2. Science Fair Pre-Test/Post-Test Experimentation Questions .................................11
3. Science Fair Pre-Test/Post-Test Data/Data Analysis Questions ............................12
4. Science and Society Questions ...............................................................................13
5. Beliefs About How Science Affects Students Daily ..............................................15
6. Beliefs About The Scientific Practice .....................................................................17
7. Scientific Practice Mean Scores .............................................................................18
8. Written Paper Mean Scores ....................................................................................19

vi
ABSTRACT
The purpose of this study was to determine the impact science fair projects on student learning and mastery of Nature of Science objectives in 9th grade Pre-AP physical science. In this project students were required to complete a science fair project that followed scientific practice as a model. Data was collected using pre-test, surveys, interviews, rubrics, and post-tests. The data shows an increase in student achievement, mastery of objectives, and that their attitudes towards science seemed to become more positive.

1
INTRODUCTION AND BACKGROUND
I teach a Pre-Advanced Placement (Pre-AP) physical science course at Alma High
School in Alma, Arkansas to 114 ninth grade students. All Pre-AP science students at
Alma High School are required to complete a science fair project and present their results
it to a team of judges. Physical science is a required course for graduation, but Pre-AP
physical science is only required for students wanting to take more challenging courses or
those interested in graduating with honors.
I have been teaching at Alma High School for one year, although this is my fifth
year to teach Pre-AP physical science. Alma is a medium-sized rural school district with
1 high school that has 1070 students in grades 9 through 12 with 118 staff and faculty.
Alma High School’s student population contains 0.3% Asian, 1.58% African American,
3.45% Hispanic, 0.84% American Indian, 2.89% multiple races, and 90.84% Caucasian
students (Jerry Valentine, Principal, Personal Communication, November 1, 2012).
Over the past five years, I have been extremely involved in the science fair process
because it has been a required portion of all the courses that I have taught. I was actually
introduced to science fairs as a seventh grader at Alma Middle School and continued to
conduct science fair projects throughout high school. I have also continued to be
involved as a judge for other school districts in the area since graduating from high
school.
When I interviewed for my current teaching assignment, my principal asked how
I felt about science fairs. He was very adamant that science fairs were and will be a part
of the curriculum that I teach; however, over the summer, the science coordinator for the
district said that she did not want our middle school science teachers to have students

2
conduct science fair projects because of the low scores on our Benchmark exams for
science the past few years. She stated that they were spending too much time on science
fairs and not enough time covering their objectives for the exams. I found this very odd,
so I started asking other teachers about the use of science fair projects in the high school
and middle school. I found that most of the middle school teachers did not want to
conduct the projects because they saw it as a waste of time and energy, but the high
school teachers thought that science fairs were essential for success in Pre-AP and AP
courses. I have seen students struggle with science objectives while being taught
traditional ways such as lectures or worksheets. Many times students are not successful
because these traditional ways seem boring and/or useless to them. After talking to
several students about the way that they learn when school began this year, I decided to
thoroughly examine science fair projects as a way of teaching science objectives to my
students. The purpose of this study was to determine the impact of authentic learning
projects (science fair projects) on student learning and mastery of Nature of Science
objectives in 9th grade Pre-AP physical science.
CONCEPTUAL FRAMEWORK
Over the past few years, America has begun to lose ground and is being passed
by many other countries in the areas of science, technology, engineering and math
education. The traditional United States school system assigns students to courses that
have specific objectives to be taught in a specific amount of time and in a specific order.
Each course, even units within a course, functions as an isolated entity which teaches and
assesses objectives whenever a teacher wants to check retention and mastery of the
content (Daggett, 2012). In traditional high school courses, there are very few crossovers

3
or connections to other subjects even though that is not the way the real world works.
Many times in a physical science class, students will ask why they have to use math or
spell correctly. The answer is that the world is not made-up of individual islands that do
not communicate or interact with each other. Authentic learning takes the old ideas of
courses being islands and adds bridges to connect all of the subjects in a project with a
single goal in mind making learning more relevant to each student (Webb & Burgin,
2009).
As the American educational system has slipped, there has been a call for
increased literacy, not only in the English and mathematics classrooms, but also in the
science, career/technology, and engineering classrooms (Daggett, 2012). As part of the
call for improved scientific literacy for all students, there is growing support for more
authentic learning in schools. For authentic learning to be successful, the understanding
of the nature of science and scientific practice will need to be significant pieces of
education (Atkin & Black, 2003; Tytler, 2007). To support such scientific literacy goals
in the existing science curriculum, progressive science educators are encouraging
authentic learning approaches in science teaching that allow students to propose
questions and ideas that allow the investigation of the world around them (Carr et al.,
2005; Crawford 2007; Toplis & Cleaves, 2006). Authentic learning projects highlight
learning opportunities that are interdisciplinary, student-centered, collaborative, and
include real-world subjects and practices (Hume, 2009). Authentic learning occurs
through tasks, activities, and assessments that result in achievement that is important and
meaningful rather than that which is unimportant or useless in a student’s perspective.
Authentic learning opportunities are essential to success in and out of the science

4
classroom and are also needed to further the development of a global society. Authentic
learning experiences allow students to gain an understanding of how to question the
world around them and find the answers to those questions on their own (Newmann &
Wehlage, 1993).
Although the phrase authentic learning is relatively new, the idea of learning in
situations that support real-life application of knowledge dates back several decades.
Authentic learning in a science classroom is simply described as the doing of science in
an approach that emulates the real practice of scientists (Atkin & Black, 2003). Many
education reformers have advocated that making science learning better resemble science
practice should be a major goal of every science teacher (Dewey, 1964). In the science
classroom where authentic learning is taking place, students become active, engaged
learners. In authentic learning situations, students obtain scientific knowledge in a
relevant context. They also develop methods of inquiry and communication skills that
will assist them in becoming successful life-long learners (Daggett, 2012).
The reason authentic learning experiences are important and receiving so much
attention is the acknowledgment that the information and skills that are gained are often
tied to the circumstances in which they are learned. For many subjects taught in schools,
students are often not capable of applying the knowledge they acquire in school to
another situation, especially in a different class or subject (Halloun & Hestenes, 1985). If
students are engaged in authentic scientific inquiry and develop an innate knowledge of
it, then they can use that knowledge to participate in learning experiences as independent,
genuine investigators in all classes and subjects. An authentic learning experience is
engaging for students because the content and context of learning are accepted by the

5
students as related to his or her needs and considered by the teacher as replicating life
outside the classroom. This allows students to methodically search out answers, where
solutions to problems are not obvious (Callison & Lamb, 2004).
For projects that involve authentic learning to be successful, students need be
given open-ended problem solving opportunities where they have to rely on their existing
scientific ideas and knowledge to examine the problem, map a course of action, complete
the plan, obtain information that they can analyze, interpret and evaluate to reach a
conclusion, and communicate their findings in some form to an audience (Callison &
Lamb, 2004; Duggon & Goff, 1995). Science fair projects are authentic learning
experiences because they allow students to express their own thoughts about a topic in
which they want to know more information.
One authentic learning strategy is the science fair project. A science fair project
gives students hands-on experience and knowledge in their own independent field of
study of a particular topic in engineering, math, and science (Bochinski, 2004).
Authentic learning gives students relevant, meaningful learning experiences that allow
them to use knowledge gained in all classes and subjects to solve real-world problems
and issues. Many science educators believe that science fairs allow students to develop
these skills and the knowledge needed to direct them to future success (Czerniak, 1996).
A science fair project is viewed as a good introduction to science that can then guide
students to do well in science later on in their lives. Science fairs can also be influential
in allowing students to making sense of science (Bellipanni & Lilly, 1999). Science fairs
allow students to engage in authentic learning experiences that they can use to question
the world around them.

6
METHODOLOGY
This study was conducted with freshmen students in the Pre-Advance Placement
(Pre-AP) physical science class at Alma High School, which is located in Alma,
Arkansas. Pre-AP physical science is a class designed to help students develop the skills
and dispositions necessary to be successful in Advanced Placement courses and college
level courses. The course utilizes a variety of teaching strategies such as labs, projects,
lecture, student presentations, and formative assessments. The research methodology for
this project received an exemption by Montana State University's Institutional Review
Board and compliance for working with human subjects was maintained.
This project was designed to determine the impact of science fair projects, an
example of an authentic learning project, on student learning and master of Nature of
Science objectives in 9th grade Physical Science (Appendix A). The project was used to
determine the affect on general motivation towards science, which is essential for success
in a Pre-AP course. In this course, students are required to complete a science fair project
that interests them. The Nature of Science objectives in Arkansas can be applied to
several different physical science units. However, these objectives can also be taught
through the development and presentation of a single science fair project. The Nature of
Science objectives cover several different topics within all science curriculums in
Arkansas. Throughout the process of conducting their science fair projects, students were
provided with clear learning goals, useful feedback, and opportunities to improve on
these learning goals.
For this course, students had to complete a science fair project that they presented
to judges and each other at the district science fair in January. Students had to select their

7
own topic based on their interest. Students then designed and completed an experiment
using the scientific practices as guidelines for the project even though science is not
always conducted in a set order of steps. During this project, students were given direct
instruction on the pieces of their projects: topic selection, literature review with
bibliography, problem statement, hypothesis, materials, procedures, experimentation,
data collection, data analysis, and conclusion. Students also had to complete a visual
presentation (tri-fold board or poster) of their project. Since the strategies used in this
project are normal educational practices, my building level principal gave me permission
to conduct my study without informed consent (Appendix B). The research methodology
for this project also received an exemption by Montana State University's Institutional
Review Board and compliance for working with human subjects was maintained.
At the beginning of the project all students were required to take the Science Fair Pretest
that was designed to be comparable to an actual AP exam that they will take in later AP
courses (Appendix C). I designed the pre-test to focus on the objectives that we covered
during the project (Appendix A). I used the data from this pre-test to target the areas that
my students needed to master as they come into Pre-AP physical science and begin their
science fair projects. Since all students are part of the experimental group, this pretest
allowed me to identify which students would benefit the most from the science fair
project and how science fair projects could affect student achievement. The data from
the pre and post assessments was used to gauge student understanding and mastery of the
physical science objectives used in their science fair project.
Students took the Science Fair Student Survey prior to beginning and after they
completed their science fair project to check their attitudes and beliefs about the science
8
fair process and motivation in science (Appendix D). This survey measured students’
perceptions on their projects and attitudes using a Likert scale. The initial survey was
taken during the first week of the project, students rated their experiences and attitudes in
science on a scale of one-five with one being strongly disagree, two being disagree, three
being neutral, four being agree and five being strongly agree. This survey was re-
administered once the science fair project was completed. This post-survey included the
same questions, but allowed only four choices, doing away with the middle, neutral
position in order to obtain more usable data. The data were analyzed by finding the mean
scores prior to the project and after the project. These scores were then compared to see
if there is a change in student responses.
Students were required to complete a written paper and presentation board that
focused on their science fair research and experimentation. These assignments were
graded using the Science Fair Paper and Presentation Rubric (Appendix E). This makes
sure that all students are evaluated using a standard set of requirements and objectives
that apply to the Nature of Science objectives for this course. Students also presented
their projects to their respective classes one week before the district science fair. During
the science fair, students also presented their project to a set of three judges, who have
occupations or careers in science, math, engineering, and technology fields. However,
the responses from the judges were used only as formative assessment data and had no
effect on the students’ grade for the project.
Student interviews were also conducted using the Student Interview Questions
(Appendix F). The interview contains 13 questions. Four interviewees from each of my
five classes were chosen randomly for the interview process to get a representation of my

9
students’ demographic and academic backgrounds. The responses were used to gather
more qualitative data to further understand the students’ prior experiences and motivators
in their academics as well as their personal views of the science fair project. Interviews
were conducted at the beginning and end of the study. The interviews were also used to
gather qualitative data that can be used to support the data gather through the pre- and
post-test as well as the surveys. The data sources for this project are summarized in
Table 1.
Table 1 Triangulation Matrix Primary Question: What is the impact of authentic learning projects (science fair projects) on student achievement and mastery of Nature of Science objectives in 9th grade Physical Science (Appendix A), as well as motivation toward science in general? Pre-Test Student
Survey Science Fair Paper and Visual
Student Interview
Post-Test
Student Achievement
X X X X X
Mastery X X X X X Motivation X X
DATA AND ANALYSIS
The first theme examined for the Science Fair Pre-Test and Post-Test (Appendix C) was
the participants’ understanding of hypotheses. All of the questions in this area showed an
increase in mean scores. The greatest increase in mean score came when asked which
question is least helpful when forming a hypothesis with an increase from 44% to 86%.
The next highest increase came from the question dealing with the relationship between
hypotheses and theories. Of the questions that dealt with the topic of hypotheses the
smallest increase in mean score came from the question that dealt with the basic
knowledge question about the definition of a scientific hypothesis (Figure 1).

10
Figure 1. Science fair pre-test/post-test hypothesis questions, (N = 114).
The question missed most often before the science fair project was the question that dealt
with forming a testable hypothesis about the origin of a meteorite. This was supported by
one student’s response, “This is the first time that I have used the scientific practice to
answer a question. I didn’t know how to use the information that I learned to answer the
question. I guessed on this.” After the science fair project, this question was the least
missed. One student said, “Mr. Thomas, I really didn’t understand the first question of
the post- test when we started the school year, but after conducting my science fair
project I understand what this question was asking.”
The next area on the Science Fair Pre-Test and Post-Test analyzed was testing the
hypothesis or experimentation phase of the scientific practice. These seven questions
about experimentation focus on safety, measurement, and testing of the hypothesis. Fifty
six percent of students answered the questions about safety correctly before their science
fair projects. Thirty two percent of participants answered the questions correctly about
measurement. After the participants conducted their science fair projects the percentages
0%
20%
40%
60%
80%
100%
Which of thefollowing questions is
least helpful whenforming a testable
hypothesis about theorigin of a meteorite?
A hypothesis and atheory are related
because
Which of thefollowing is thedefinition of a
scientific hypothesis?
44%
62% 72%
86% 76% 82%
Pre-Test
Post-Test

11
changed very little. This was not supported by any statement during the interviews. One
student even responded, “Mr. Thomas, you taught us about safety at the beginning of the
year and we cover safety every time we go to lab.” There was more variation in the
questions that focused on experimentation with the largest change coming from the
question dealing with identifying the proper steps which increased from an average of
50% to an average 82%. The next highest change came from the question asking
students to identify their control in the experiment which also had an average of 52% for
the pre-test, but the increase was slightly less with an average of 82% (N = 114) (Figure
2).
Figure 2. Science fair pre-test/post-test experimentation questions, (N = 114).
The next section was data and data analysis questions which ask students to use data and
graphs to draw conclusions. This section had the lowest percentage of correct answers
with only 12% of participants answering all of the questions correctly. The question with
0%10%20%30%40%50%60%70%80%90%
Hypothesis: Whenenvironmental conditionsbecome unfavorable, thebacterium E. coli forms
Protein Q. Which processindicates a proper step intesting this hypothesis?
A biology class conducted anexperiment using five plants.The first plant received onlywater. The remaining plantsreceived varying amounts of
a liquid fertilizer added totheir water. The class wantedto know which plant wouldshow the greatest amount
50% 52%
82% 82%
Pre-Test
Post-Test

12
the lowest average increase in average mean was the question asking students to look at a
graph and determine the effect of water temperature on Daphnia heart rate. This question
had an average of 18% after the pre-test. The average increased to an average of 52%
after the post-test (N = 114) (Figure 3).
Figure 3. Science fair pre-test/post-test data/data analysis questions, (N = 114).
One student responded that they have conducted labs for teachers but that those teachers
never made them analyze data the way they were being asked to for their science fair
projects. This same student also said that this was the hardest part of the pre-test for
them. Another student responded, “The questions about data and data analysis were the
hardest questions to answer.” When I asked some deeper probing questions, another
student replied, “that this was a science class and that I shouldn’t have to do math in a
science class.”
0%10%20%30%40%50%60%70%
Theory A is a well-established scientific
theory.
The graph shows how theheart rate of Daphnia, awater flea, is affected by
water temperature.
Some studentshypothesize that heating
a mixture of anysubstance and water will
always increase theamount of the substancethat will dissolve in the
water.
24% 18%
36%
62% 52%
70%
Pre-Test
Post-Test

13
The first theme to be discussed for the Science Fair Student Survey was the
participants’ beliefs about science and society. The first area examined was the question
about science being a field that most people need to study. This question had a mean
score of 2.99 (agree) with 67% of students saying they were neutral or disagreed with the
statement before the beginning science fair project. This was supported by a student who
stated, “I feel that I was forced into Pre-AP physical science by my counselors and
parents. I don’t like science and feel that there is too much emphasis placed on science.”
After conducting their experiments, students’ beliefs about science being a field that most
people need to study rose by 0.88 to an average of 3.87, with 71% of students responding
that they agree with the statement. The highest average in the data both before and after
the project came from the question about science being important to the country’s
development which had a mean score of 3.79 and 4.28, respectively (N = 114) (Figure 4).
Figure 4. Science and society questions, (N = 114). Note: Likert Scale Score 1 = strongly disagree, 2 = disagree, 3 = neutral, 4 = agree, 5 = strongly agree.
00.5
11.5
22.5
33.5
44.5
1. Science isuseful for
everyday lifeproblems.
4. Science shouldbe a field for mostpeople to study.
7. Science is veryimportant to a
country'sdevelopment.
20. Science ishelpful in
understanding theworld around me.
3.35 2.99
3.79 3.67 3.89 3.87 4.28 4.08
Mea
n Sc
ores
for
Scie
nce
and
Soci
ety
Pre-ScienceFairProject
Post-ScienceFairProject
14
This was supported by the open response “I believe that science is the most important
field for our society because without STEM our country cannot invent or develop new
technologies.” Another participant supported this by stating, “Technology is the basis of
our society and economy. Everyone has a smart phone or computer and that our society
is becoming increasingly dependent on technology. This makes the development of
science and technology more important in our society.” Overall the participants felt that
the science is important to society and the development of the country.
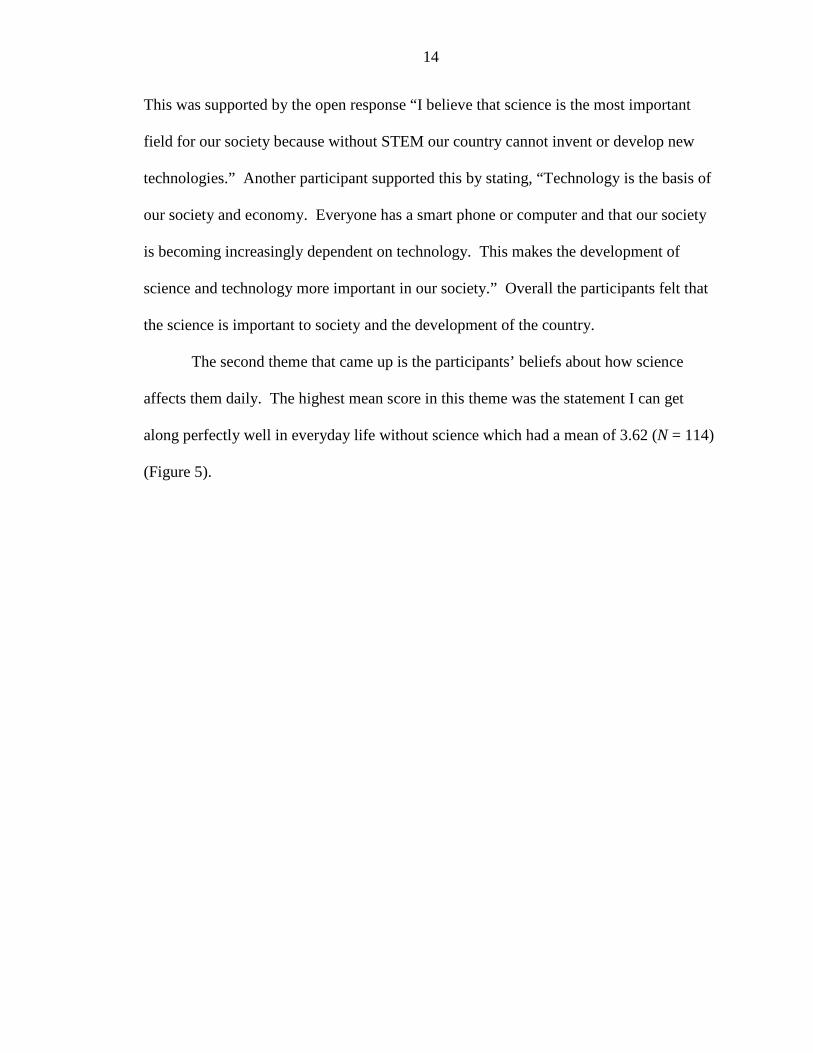
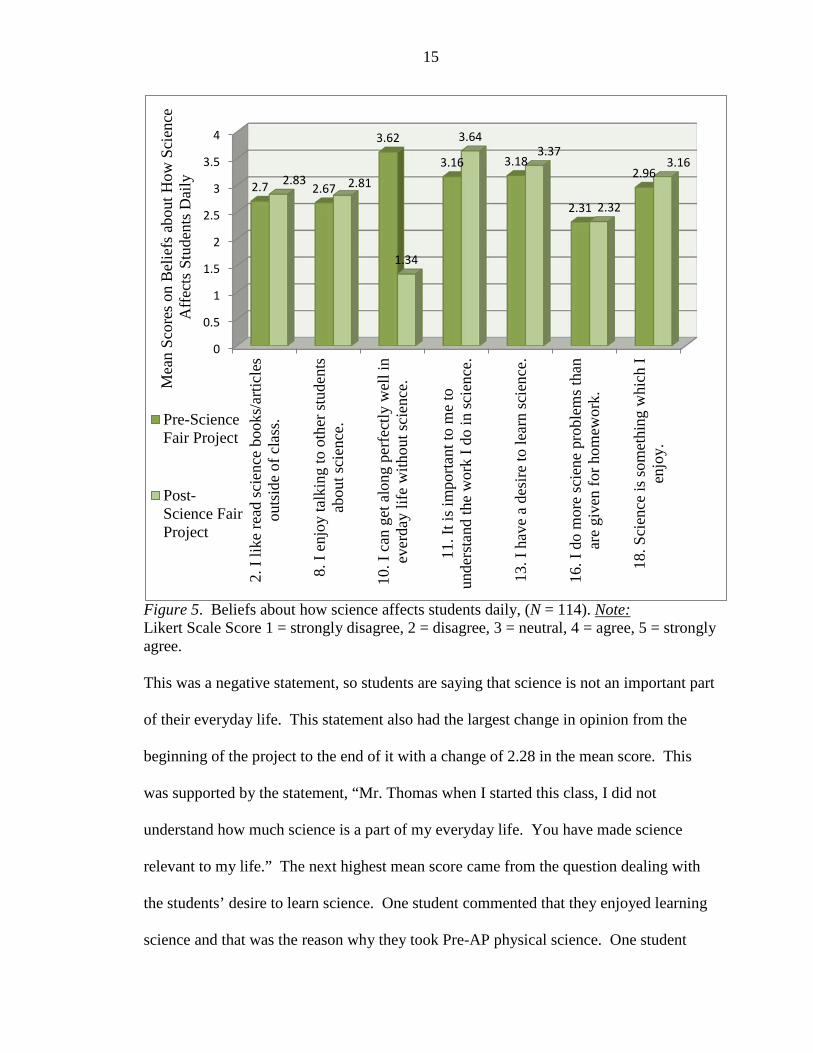
The second theme that came up is the participants’ beliefs about how science
affects them daily. The highest mean score in this theme was the statement I can get
along perfectly well in everyday life without science which had a mean of 3.62 (N = 114)
(Figure 5).
15
Figure 5. Beliefs about how science affects students daily, (N = 114). Note: Likert Scale Score 1 = strongly disagree, 2 = disagree, 3 = neutral, 4 = agree, 5 = strongly agree. This was a negative statement, so students are saying that science is not an important part
of their everyday life. This statement also had the largest change in opinion from the
beginning of the project to the end of it with a change of 2.28 in the mean score. This
was supported by the statement, “Mr. Thomas when I started this class, I did not
understand how much science is a part of my everyday life. You have made science
relevant to my life.” The next highest mean score came from the question dealing with
the students’ desire to learn science. One student commented that they enjoyed learning
science and that was the reason why they took Pre-AP physical science. One student
0
0.5
1
1.5
2
2.5
3
3.5
4
2. I
like
read
scie
nce
book
s/ar
ticle
sou
tsid
e of
cla
ss.
8. I
enjo
y ta
lkin
g to
oth
er st
uden
tsab
out s
cien
ce.
10. I
can
get
alo
ng p
erfe
ctly
wel
l in
ever
day
life
with
out s
cien
ce.
11. I
t is i
mpo
rtant
to m
e to
unde
rsta
nd th
e w
ork
I do
in sc
ienc
e.
13. I
hav
e a
desi
re to
lear
n sc
ienc
e.
16. I
do
mor
e sc
iene
pro
blem
s tha
nar
e gi
ven
for h
omew
ork.
18. S
cien
ce is
som
ethi
ng w
hich
Ien
joy.
2.7 2.67
3.62
3.16 3.18
2.31
2.96 2.83 2.81
1.34
3.64 3.37
2.32
3.16 M
ean
Scor
es o
n B
elie
fs a
bout
How
Sci
ence
A
ffect
s St
uden
ts D
aily
Pre-ScienceFair Project
Post-Science FairProject

16
stated, “Duh! Mr. Thomas why do you think I’m in here. This is my favorite subject.”
The next area was the students’ desire to learn science. This area had a mean score of
3.18 with 75% of students being neutral and 19% agreeing or strongly agreeing with the
statement (N =114). Throughout the survey, several students commented that they
enjoyed learning science and that they were looking forward to the science fair project in
this class.
The third theme that comes from the data deals with the science fair project in
general. This portion of the survey is specifically about the practices that were used to
guide the students through their science fair projects. The question about use of data to
create graphic representations to give others a visual for my project had the lowest mean
with a score of 1.97 (N = 114) (Figure 6).

17
Figure 6. Beliefs about scientific practice, (N = 114). Note: Likert Scale Score 1 = strongly disagree, 2 = disagree, 3 = neutral, 4 = agree, 5 = strongly agree. The majority of students who took part in the survey had not completed a science
fair project previous to the project assigned for this class. Several students mentioned in
their comments that this was their first science fair project. Another student said, “I do
not know how to collect data or how to use that data to make charts and graphs.” The
0
0.5
1
1.5
2
2.5
3
3.5
4
14. I
can
ask
que
stio
ns th
at c
an b
e an
swer
ed b
y ga
ther
ing
data
.
9. I
can
use
scie
ntifi
c kn
owle
dge
to fo
rm a
pro
blem
stat
emen
t/res
earc
h qu
estio
n.
12. I
can
des
ign
scie
ntifi
c pr
oced
ures
to a
nsw
er a
que
stio
n.
17. I
can
reco
rd d
ata
accu
rate
ly.
15. I
can
use
dat
a to
cre
ate
grap
hic
repr
esen
tatio
ns to
giv
eot
hers
a v
isua
l for
my
proj
ect.
3. I
can
use
the
resu
lts o
f my
expe
rimen
t to
answ
er th
epr
oble
m st
atem
ent/q
uest
ion.
21. I
can
ana
lyze
the
resu
lts o
f a sc
ient
ific
inve
stig
atio
n.
6. I
can
use
scie
ntifi
c vo
cabu
lary
to sh
are
the
resu
lts o
f my
expe
rimen
t.
5. I
can
use
mod
els a
nd o
ther
vis
uals
to e
xpla
in m
y re
sults
.
19. I
can
cre
ate
a di
spla
y to
com
mun
icat
e m
y da
ta a
ndob
serv
atio
ns.
2.13
2.8
2.23
2.64
1.97
2.4
2.07
2.61 2.44
2.71
3.71 3.42
3.16
3.49
3.12
3.51
2.72
3.44 3.56 3.51
Mea
n Sc
ores
on
Bel
iefs
abo
ut S
cien
tific
Pra
ctic
e
Pre-ScienceFairProject
Post-ScienceFairProject

18
question with the highest mean score was the question that dealt with the use scientific
knowledge to form a problem statement/research question. The mean score for this
question was 2.79. This was supported by a student who stated that this was their first
science fair project and that they were familiar with their topic, but that they lacked the
knowledge to be able to form their problem statement.
The next data collection instrument to be analyzed was the Science Fair Paper
and Presentation. The Science Fair Paper and Presentation consisted of the student
presenting their project to their respective class with their tri-fold board. Students were
evaluated using the rubric (Appendix E). The first theme to come from the Science Fair
Paper and Presentation was the participants’ use of scientific practice in their science fair
project. Sections A through H of the rubric represent the use of scientific practice in the
participants’ science fair project. The highest average in the data came from the section
for knowledge gained during the project which had a mean score of 6.04 (N = 114)
(Figure 7).
Figure 7. Scientific practice mean scores, (N = 114).
This is supported by the response from several students that they understand the
importance of all the steps that they have to take in labs. One student went on to state
01234567
Kno
wle
dge
Gai
ned
Scie
ntifi
cA
ppro
ach
Expe
rimen
tal
App
roac
hV
aria
bles
Expe
rimen
tal
App
roac
h C
ontro
ls
Dat
a
Con
clus
ion
Erro
r
Org
inia
lity
6.04 5.41 4.30 4.25
4.98 5.42 5.69 5.96
Scie
ntifi
c M
etho
d M
ean
Scor
e O
ut o
f 10

19
that they had a better understanding of scientific practice now that they had conducted
their science fair project. The next area to look at was the experimental approach
specifically variables and controls. Both of these areas were below a mean score of five
with a mean score of 4.30 and 4.25, respectively. This was surprising because during the
course of the project students looked at many different examples and were specifically
asked to identify the dependent and independent variables as well as the controls. These
low scores were supported by the response, “Mr. Thomas, I remember doing worksheets
over variables and controls, but I didn’t identify all of them in my project.” According to
several judges from the science fair, the majority of students did not identify all of the
variables or they did not control all of the variables in their projects.
The second theme to come from the Science Fair Paper and Presentation was the
participants’ ability to write a written paper using scientific language. The highest mean
score in this instrument came from the review of literature portion of the paper with a
score of 7.61 (N = 114) (Figure 8).
Figure 8. Written paper mean scores, (N = 114).
0
2
4
6
8
Abs
tract
Safe
ty
Title
Page
/Tof
C
Purp
ose
and
Hyp
othe
sis
Rev
iew
of L
it
Mat
eria
ls
Proc
edur
es
Dat
a
Con
clus
ion
6.27 7.00
5.72 6.65
7.61 6.46
4.53 4.78
6.65
Mea
n Sc
ore
on W
riite
n Pa
per O
ut o
f 10

20
This is supported by the statement from several students that this is the section that we
spent the most time on in class. One judge from the fair also mentioned that the ninth
grade projects that he evaluated had the best composed literature reviews out of all the
other grades. The next highest mean scores came from the purpose and hypothesis
sections as well as the conclusion section with both having a mean score of 6.65. The
data and procedures sections had the lowest scores with means of 4.78 and 4.53,
respectively. Several of our judges mentioned in an informal post science fair interview
with the science department that the procedures of many of the projects were unclear or
incomplete. One judge reported that one project that they had examined had come
straight from a website with no original thought or changes made. Many of our judges
and teacher mentioned that the data being collected was of the quality that they like to see
in science fair projects. Several stated that the data that was present had nothing to do
with the question being asked or with the hypothesis.
INTERPRETATIONS AND CONCLUSIONS
The purpose of this study was to determine the impact of authentic learning projects
(science fair projects) on student learning and mastery of Nature of Science objectives in
ninth grade Pre-AP physical science. The science fair process allows students the
opportunity for hands-on, real life, collaborative, student centered learning that many
traditional classrooms lack. The data from this study began to uncover several valuable
aspects in the use of science fair projects and their effects on student achievement,
mastery, and motivation. Some of the data were inconclusive, while much of it showed
that the science fair process used was yielding some of the desired results.

21
The pre-tests, initial surveys, and preliminary interviews were intended to determine
students’ prior knowledge and beliefs about scientific practice and ninth grade physical
science objectives. The science fair paper and presentation were used to evaluate student
understanding and mastery of the physical science objectives that they had been taught
throughout the project. The post-tests, final surveys, and concluding interviews were
used to determine if students mastered the objectives, changed their beliefs, and increased
their motivation in physical science.
After the completion of the project, the following tendencies were evident. Based on
Pre- and Post-test data, student surveys, interviews, and informal observations it can be
concluded that most students increased their achievement and mastery of physical science
objectives during the science fair project. After discussing this data with other teachers, I
found that this was the first time that the participants really focused on the scientific
process and specifically hypotheses. The process behind conducting a science fair
project can be difficult for students to understand, especially if they have never conducted
a science fair project in any other class. By breaking down the project into smaller steps,
students were not so overwhelmed and it allowed students to focus on and master the
smaller pieces of a much larger project like identifying a research question, developing a
hypothesis, writing procedures, identifying variables, collecting data, and writing a
conclusion. After the project several students commented that taking the project in
smaller pieces helped them understand the different parts of the project without getting
frustrated by the larger project. I also found it useful to break the project down into its
smaller components to keep me focused on the objectives that I wanted students to

22
master. It was also valuable to see how students were doing on each individual objective
as they progressed instead of waiting until the entire project was completed.
The data also shows a positive change in motivation in science. As the project
continued throughout the school year, student comments and attitude toward their science
fair projects and science class in general became more positive. Could this all be
attributed to the science fair project process or are there other factors in my class that can
account for this change in beliefs? In physical science, we conduct several projects and
lab throughout the year. It is difficult to say that this one project had enough influence on
students to change their attitude on its own.
While many techniques were used to introduce and teach the parts and pieces of the
science fair projects, I found that allowing students to write and then revise the different
components of their science fair projects was the most helpful in their achievement of the
objectives. By allowing students to revise and rewrite their papers, they were allowed to
experience more success. By the end of the study, the students responded well to
feedback and they often began to peer review each other’s work without prompting.
Some students were also developing more confidence in science as they were given
various chances to successfully reach the objectives through multiple revisions of their
papers.
VALUE
Science fair is a yearly process that is required by ninth grade pre-Advanced
Placement physical science students and gives me the opportunity to assist a new set of
students. This study has assisted me as I become a better facilitator with respect to
science fair projects. I intend to use this same methodology for my future classes because

23
it has been effective in helping my students this year with their achievement, mastery of
objectives, and motivation in science. I will also be adding a data analysis section to the
science fair project. Many judges mentioned that the projects my students had entered in
the district, regional and state science fairs were lacking sufficient data analysis sections.
Even though the results of this study were not as dramatic as I had hoped, I believe that
the learning and teaching that has taken place in my classroom has improved greatly.
This project has also improved student performance on written lab reports where students
are required to develop a hypothesis, write procedures, collect and analyze data then draw
conclusions from those data. The science department at my school has decided to take on
this same model with all pre-Advanced Placement classes. I have also been asked by my
department chair and principal to have students begin next year’s science fair project
during the last few weeks of this school year, so that they have enough time to also add in
data analysis sections.
Over the course of the action research process, I have definitely changed, especially
since I was little skeptical of the action research process given my traditional science
background where you have to have controls and variables for an experiment. I have also
realized that communication is key to the process. Students need clear objectives and
examples for each portion of the project to successfully complete the assigned tasks.
They also need many deadlines to be able to complete the many different steps of their
science fair projects. One of the challenges that I faced involved remediation or re-
teaching steps for those who fell behind the bulk of the class. I found it very challenging
to differentiate the instruction to tackle some of the individual needs that arose when a

24
few students needed more directions, when the majority of the class was ready to move
on or when someone missed key portions of the project.
When I start the next set of science fair projects in the Fall, I will add more rubrics
that are specific to each step and offer more clarity on what I am asking students to
accomplish. I found that as the year continued that my students were tremendously
excited to help with my project because it allowed them to see what the process looked
like on a college level. This project as also allowed me to demonstrate key aspects of
scientific practice to my students, but more importantly it allows me to give them first-
hand experience with research and the processes that scientists go through to answer
questions.
Over the past five years, I have taken an average of 15 students to Northwest
Arkansas Regional Science and Engineering Fair with 1-2 of those qualifying for the
Arkansas State Science and Engineering Fair each year. The changes that this project
brought about in my class and students have yielded some striking results with 30
students making it to the regional fair and 10 qualifying for the state fair with 5 of those
placing first, second, or third at the state science fair. This project has also made some
headlines at my school. I was awarded the Northwest Arkansas Science and Engineering
Fair Teacher of the Year for the work that has gone into my students’ projects and my
commitment to science fair at the district and regional levels.
I believe that science fairs will take on a greater role in the science classroom,
especially since the Common Core State Standards and the Next Generation Science
Standards have increased the push for literacy in the science classroom and a more
rigorous curriculum that deals specifically with technical writing and reading. Science

25
fairs have a lot to offer teachers in that they allow students to choose a topic that is
significant to them and to develop an experiment that answers a question dealing with
something that interests them.

26
REFERENCES CITED
Atkin, J.M., and Black, P. (2003). Inside science education reform: A history of curricular and policy change. New York: Teachers College Press.
Bellipanni, Lawrence, J., & Lilly, James E. (1999). What Have Researchers Been Saying About Science Fairs? Science and Children, 36(8), 46-50. Bochinski, J. (2005) The Complete Workbook for Science Fair Projects. Hoboken, NJ:
Wiley. Callison, D, & Lamb, A. (2004). "Key Words in Instruction. Authentic Learning." School
Library Media Activities Monthly 21(4), 34-39. Carr, M., McGee, C., Jones, A., McKinley, E., Bell, B., Barr, H. and Simpson, T. (2005).
The effects of curricula and assessment on pedagogical approaches and on educational outcomes. Report to Ministry of Education. New Zealand: Ministry of Education.
Crawford, B.A. (2007). Learning to teach science as inquiry in the rough and tumble of
practice. Journal of Research in Science Teaching, 44(4), 613-642. Czerniak, C.M., & Lumpe, A.T. (1996) Predictors of Science Fair Participation Using the
Theory of Planned Behavior. School Science and Mathematics, 96, 355-361. Daggett, B. Alma School District Profession Development Meeting. Alma, AR. August
2012. Duggon, S., & Goff, R. (1995). The place of investigations in practical work in the UK
National Curriculum for Science. International Journal of Science Education, 17(2), 137-147.
Dewey, John, and Archambault, R.D. (1964). John Dewey on Education; Selected
Writings. New York: Modern Library, 121-27. Halloun I.A. and Hestenes D. (1985). The initial knowledge state of college physics
student. American Journal of Physics, 53 (11), 1043–1055. Hume, A. (2009). Authentic Scientific Inquiry and School Science. Teaching Science, 55
(2), 35-41. Newmann, F. M. & Wehlage, G. G. (1993). Five standards of authentic instruction.
Educational Leadership, 50(7), 8-12. Toplis, R., and Cleaves, A. (2006). Science investigations: The views of 14 to 16-year-
old pupils. Research in Science and Technological Education, 24(1), 69-84.

27
Tytler, R. (2007). Re-Imagining Science Education: Engaging Students in Science for Australia's Future. Australian Education Review. Retrieved October 19, 20012, from http://research.acer.edu.au/aer/3
Webb, T. and Burgin, S. (2009). Engaged Service Learning – Implications for Higher
Education. Journal of Learning Design, 3(1), 41-56.

28
APPENDICES

29
APPENDIX A
NATURE OF SCIENCE OBJECTIVES IN THE STATE OF ARKANSAS

30
Course Title: Physical Science Course/Unit Credit: 1 Teacher Licensure: Physical/Earth Science Grades: 9-12
Physical Science
Physical science should begin the study of higher-level physics and chemistry and continue educating the student in the nature of science. A student who masters these Student Learning Expectations should transition smoothly into other science courses. Students should be expected to use suitable mathematics and collect and analyze data. Instruction and assessment should include both appropriate technology and the safe use of laboratory equipment. Students should be engaged in hands-on laboratory experiences at least 20% of the instructional time.
Strands Standard
Chemistry 1. Students shall demonstrate an understanding of matter’s composition and structure. 2. Students shall demonstrate an understanding of the role of energy in chemistry. 3. Students shall compare and contrast chemical reactions. 4. Students shall classify organic compounds. Physics 5. Students shall demonstrate an understanding of the role of energy in physics. 6. Students shall demonstrate an understanding of the role of forces in physics. 7. Students shall demonstrate an understanding of wave and particle motion.
8. Students shall demonstrate an understanding of the role of electricity and magnetism in the physical world.
Nature of Science 9. Students shall demonstrate an understanding that science is a way of knowing.
10. Students shall design and safely conduct a scientific inquiry to solve valid problems.
11 Students shall demonstrate an understanding of historical trends in physical science. Students shall use mathematics, science equipment, and technology as tools to communicate and
solve physical science problems. 13. Students shall describe the connections between pure and applied science. 14. Students shall describe various physical science careers and the training required for the

31
selected career. Strand: Nature of Science
Standard 9: Students shall demonstrate an understanding that science is a way of knowing. NS.9.PS.1 Explain why science is limited to natural explanations of how the world works
NS.9.PS.2 Compare and contrast hypotheses, theories, and laws. NS.9.PS.3 Distinguish between a scientific theory and the term “theory” used in general conversation NS.9.PS.4 Summarize the guidelines of science:
explanations are based on observations, evidence, and testing hypotheses must be testable understandings and/or conclusions may change with additional empirical data scientific knowledge must have peer review and verification before acceptance
Strand: Nature of Science Standard 10: Students shall design and safely conduct a scientific inquiry to solve valid problems.
NS.10.PS.1 Develop and explain the appropriate procedure, controls, and variables (dependent and independent) in scientific experimentation
NS.10.PS.2 Research and apply appropriate safety precautions (refer to ADE Guidelines) when designing and/or conducting scientific investigations
NS.10.PS.3 Identify sources of bias that could affect experimental outcome NS.10.PS.4 Gather and analyze data using appropriate summary statistics NS.10.PS.5 Formulate valid conclusions without bias NS.10.PS.6 Communicate experimental results using appropriate reports, figures, and tables
Strand: Nature of Science Standard 11: Students shall demonstrate an understanding of historical trends in physical science.
NS.11.PS.1 Recognize the factors that constitute a scientific theory NS.11.PS.2 Explain why scientific theories may be modified or expanded using additional empirical data, verification, and
peer review Strand: Nature of Science
Standard 12: Students shall use mathematics, science equipment, and technology as tools to communicate and solve physical science problems.
NS.12.PS.1 Use appropriate equipment and technology as tools for solving problems (e.g., balances, scales, calculators, probes, glassware, burners, computer software and hardware)

32
NS.12.PS.2 Collect and analyze scientific data using appropriate mathematical calculations, figures, and tables NS.12.PS.3 Utilize technology to communicate research findings
Strand: Nature of Science Standard 13: Students shall describe the connections between pure and applied science.
NS.13.PS.1 Compare and contrast physical science concepts in pure science and applied science NS.13.PS.2 Discuss why scientists should work within ethical parameters NS.13.PS.5 Describe in detail the methods used by scientists in their research

33
APPENDIX B
ADMINISTRATOR EXEMPTION FORM

34
Exemption Regarding Informed Consent
I, ______________________________, Principal of Alma High School, verify that
the classroom research conducted by Zachary Thomas is in accordance with
established or commonly accepted educational settings involving normal educational
practices. To maintain the established culture of our school and not cause disruption
to our school climate, I have granted an exemption to Zachary Thomas regarding
informed consent.
________________________________________________________
(Signed Name)
________________________________________________________
(Printed Name)
__________________________
(Date)

35
APPENDIX C
NATURE OF SCIENCE PRETEST AND POST-TEST

36
1. Which of the following questions is least helpful when forming a testable hypothesis about the origin of a meteorite?
A Can some geologic processes account for the meteorite’s microscopic patterns? B Do people believe meteorites are partly responsible for spreading microscopic life? C Is the chemical composition of the meteorite similar to that of rocks on Earth? D Does the angle of entry into Earth’s atmosphere provide information about the
meteorite’s source? 2. Some students are designing an investigation to observe how the speed of a falling
object is related to the distance it falls. Which set of equipment should the students use to make appropriate measurements during this investigation?
A Stopwatch, metric ruler, calculatorB Compass, graduated cylinder, metric ruler C Rubber ball, calculator, balance D Metric ruler, pH meter, thermometer 3. Which of the following is the usual order of applying the scientific process to a
problem?
A. hypothesis B. hypothesis C. observation D. observation question E. hypothesis
4. Theory A is a well-established scientific theory. One hypothesis that could refute this
theory is successfully tested over many experiments. What action must be taken for this hypothesis to pose a legitimate challenge to Theory A?
A. collecting empirical data B. publishing data for peer review C. forming a question for an investigation D. turning the hypothesis into scientific law 5. A student wearing goggles, gloves, and an apron begins a simple activity to determine
the pH of corrosive solutions. Before the activity begins, what other safety measure should the student follow?
A Identify the locations of eye wash, shower, and fire equipment B Check and set clocks and record the beginning time C Review the proper method of fire-polishing glass tubing D Arrange the equipment in the work area alphabetically 6. Hypothesis: When environmental conditions become unfavorable, the bacterium E.
coli forms Protein Q. Which process indicates a proper step in testing this hypothesis?

37
A Establish that Protein Q is present in higher-level organisms B Produce a test for the presence of Protein Q C Determine that Protein Q can be artificially produced D Test for the types of chemical bonds found in Protein Q
8. Scientists try to reduce errors in their observations and measurements by A. reducing bias B. using standard procedures C. testing measuring devices against known samples D. repeating measurements several times and taking the average value E. all of these
9.
The graph shows how the heart rate of Daphnia, a water flea, is affected by water
temperature. Which statement is best supported by these data? A Daphnia do well in freezing water. B Daphnia have healthy hearts. C The pulse of Daphnia can double. D The rate of mutation in Daphnia varies with temperature. 7. Which of these is the best reason to not eat or drink while in the laboratory? A Particles of food can contaminate chemical reagents. B Spilled drinks can make cleanup of chemicals difficult. C Some foods produce toxic gases when mixed with acids. D Chemicals spilled on hands can be transferred to food. 8. Which of the following would be best to use to measure the mass of a mineral sample? A Meterstick
0
50
100
150
200
250
300
4 5 10 15 20
Effect of Water Temperature on the Heart Rate of Daphnia
Heart Rate(beats/min)
Water Temperature (OC)
Heart Rate (beats/

38
B Graduated cylinder C Balance D Hand lens 9.
Temperature (OC)
Grams of Substance That Dissolve in 100 Milliliters of Water Substance W Substance X Substance Y Substance Z
10 5.0 22.0 70.0 37.0 20 8.0 32.0 52.0 37.5 30 10.0 45.0 42.0 38.0 40 15.0 60.0 35.0 38.5 50 20.0 80.0 28.0 39.0 60 26.0 100.0 22.0 39.5 70 30.0 130.0 18.0 40.0
Some students hypothesize that heating a mixture of any substance and water will always
increase the amount of the substance that will dissolve in the water. The table shows results of an investigation testing this hypothesis. The results for which of the substances tested weaken this hypothesis?
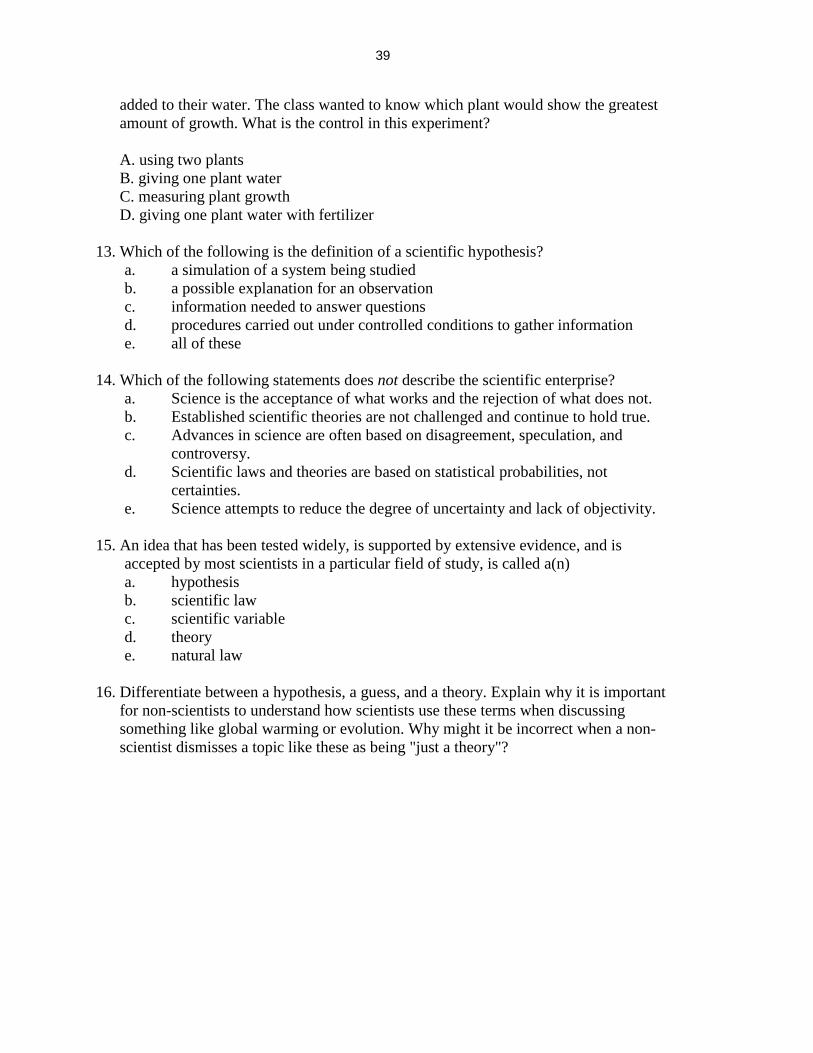
A Substance W B Substance X C Substance Y D Substance Z 10. A student came to class wanting to know if material from outer space was responsible
for putting organisms on Earth. The teacher explained that this was not a scientific question because
A. it was not true.B. it could not be tested. C. it was the best explanation.D. it had already been proven to be wrong. 11. A hypothesis and a theory are related because A. a theory is always used to develop a hypothesis. B. they are both developed in the absence of observations. C. the data collected when a hypothesis is tested can support a theory. D. an experiment is done before the formation of both a hypothesis and a theory. 12. A biology class conducted an experiment using five plants. The first plant received
only water. The remaining plants received varying amounts of a liquid fertilizer
39
added to their water. The class wanted to know which plant would show the greatest amount of growth. What is the control in this experiment?
A. using two plants B. giving one plant water C. measuring plant growth D. giving one plant water with fertilizer
13. Which of the following is the definition of a scientific hypothesis?
a. a simulation of a system being studied b. a possible explanation for an observation c. information needed to answer questions d. procedures carried out under controlled conditions to gather information e. all of these
14. Which of the following statements does not describe the scientific enterprise? a. Science is the acceptance of what works and the rejection of what does not. b. Established scientific theories are not challenged and continue to hold true. c. Advances in science are often based on disagreement, speculation, and
controversy. d. Scientific laws and theories are based on statistical probabilities, not
certainties. e. Science attempts to reduce the degree of uncertainty and lack of objectivity.
15. An idea that has been tested widely, is supported by extensive evidence, and is accepted by most scientists in a particular field of study, is called a(n) a. hypothesis b. scientific law c. scientific variable d. theory e. natural law
16. Differentiate between a hypothesis, a guess, and a theory. Explain why it is important for non-scientists to understand how scientists use these terms when discussing something like global warming or evolution. Why might it be incorrect when a non-scientist dismisses a topic like these as being "just a theory"?
40
APPENDIX D
SCIENCE FAIR STUDENT SURVEY

41
Student Science Fair Survey This Survey is voluntary and will in no way effect your grade, if you choose to not
participate. Directions: Using the Likert scale below, check the box under the answer that best represents your on-the-spot belief about each statement.
Question Strongly
Disagree Disagree Neutral Agree Strongly Agree
1. Science is useful for everyday life problems. 2. I like read science books/articles outside of class. 3. I can use the results of my experiment to answer the problem statement/question. 4. Science should be a field for most people to study. 5. I can use models and other visuals to explain my results. 6. I can use scientific vocabulary to share the results of my experiment. 7. Science is very importance to a country's development. 8. I enjoy talking to other students about science. 9. I can use scientific knowledge to form a problem statement (question). 10. I can get along perfectly well in everyday life without science. 11. It is important to me to understand the work I do in science. 12. I can design scientific procedures to answer a question. 13. I have a desire to learn science. 14. I can ask a question that can be answered by gathering data.

42
15. I can use data to create graphic representations to give others a visual for my project. 16. I do more science problems than are given for homework.
Question Strongly
Disagree Disagree Neutral Agree Strongly Agree
17. I can record data accurately. 18. Science is something which I enjoy.
19. I can create a display to communicate my data and observations. 20. Science is helpful in understanding the world around me. 21. I can analyze the results of a scientific investigation.
If you have any other comments you would like to share, please leave them at the bottom of this page to express yourself.

43
APPENDIX E
SCIENCE FAIR PAPER AND PRESENTATION RUBRIC

44
SCIENCE FAIR PROJECT JUDGING SCORE SHEET
Student(s) Name:___________________________ PROJECT NUMBER:________ (A-H) SCIENTIFIC PRACTICE: Overall Impression of Project (53 point maximum)
A Knowledge
Gained
------ 8 or 7 or 6 ----- Exhibits a thorough understanding of topic as
demonstrated through presentation and/or correct responses to questions. Student has acquired
scientific skills.
----- 6 or 5 or 4 ---- Is somewhat familiar with topic area but cannot answer all questions effectively.
Demonstrates minimal acquired scientific skills.
----- 3 or 2 or 1 ----- Demonstrates little or no
knowledge gained, nor scientific skills.
Points Awarded
B Scientific Approach
------- 8 or 7 or 6 ------- Has a well defined problem and uses a logical,
orderly method for solving the problem. Problem was solved using scientific principles.
------- 6 or 5 or 4 ------- Has an adequately defined problem OR
attempted to follow Scientific Practice, but not both.
------ 3 or 2 or 1 ------ Little or no evidence of Scientific Practice used.
Points Awarded
C Experimental
Approach: Variable
------ 8 or 7 or 6 ------ Single variable was tested for each experimental
group; all other variables were controlled or accounted for.
------ 6 or 5 or 4 ------ Attempt was made at controlling variables but not all variables were accounted for.
------ 3 or 2 or 1 ------ Variables were not controlled.
Points Awarded
D Experimental
Approach: Control Group
------8 or 7 or 6 ------ Method was appropriate and effective.
A control or comparison group was in evidence.
------ 6 or 5 or 4 ------ Method was inappropriate, but an attempt
for control or comparison was made.
------ 3 or 2 or 1 ------ Experimentation was not
performed (i.e. a demonstration or exhibit). No control group
was present.
Points Awarded
E Reliability
Of Data
------ 7 or 6 or 5 ------ Data collected is numerical and metric, if
applicable. Repeated trials provide for more than adequate data. Data is reliable.
------ 9 or 8 or 7 ------ Data collected is numerical and metric, if
applicable OR data collected is adequate, but not
both.
------ 6 or 5 or 4 ------ Little or no data collected.
Points Awarded
F Validity of Conclusion
------ 9 or 8 or 7 ------ Conclusion is consistent with data and/or
observations. Conclusion is based on data collected.
------ 7 or 6 or 5 ------ Conclusion is present but inconsistent with
data.
------ 6 or 5 or 4 ------ No conclusion or no valid
conclusion present.
Points Awarded

45
(I & J) DISPLAY: (8 point maximum)
(K & L) ORAL PRESENTATION: (8 point maximum)
G Estimating
Experimental Error
------ 2 ------ Measurement error affecting the conclusion has
been considered.
------ 1 ------ Some measurement error affecting the
conclusion has been considered.
------ 0 ------ Experimental error has not been
considered.
Points Awarded
H Originality
------ 9 or 8 or 7 ------ Demonstrates a novel approach and/or idea.
------ 6 or 5 or 4 ------ Some creativity and/or originality
demonstrated.
------ 3 or 2 or 1------ No originality demonstrated.
Points Awarded
I Information
------ 4 ------ Gives complete explanation of the project.
Display includes graphics, charts, or pictures.
------ 3 or 2 ------ Adequate information is present, but not
thorough.
------ 1 or 0 ------ Missing pertinent information.
Points Awarded
J Artistic
Qualities
------ 4 ------ Backboard is neat, organized, and appealing.
------ 3 or 2 ------ Backboard is neat, but not well organized.
Spelling errors are present.
------ 1 or 0 ------ Backboard was carelessly
prepared, sloppy.
Points Awarded
K Presentation
Quality
------ 4 ------ Clear presentation; concisely summarizes the project. Information is relevant and pertinent.
------ 3 or 2 ------ Information given is adequate, but
presentation is difficult to follow.
------ 1 or 0 ------ Information jumbled, irrelevant;
Presentation unclear.
Points Awarded
L Dynamics
M Abstract
------ 4 ------ Speaks fluently with good eye contact; polite,
dynamic, and interested in their project. Abstract present; contains a summary of the
purpose, procedure, and conclusion.
------ 3 or 2 ------ Student was polite and interested in their
project. Moderate eye contact, relied heavily on
note cards. One or two parts of the abstract is/are
missing.
------ 1 or 0 ------ No eye contact, read from note
cards. Did not seem interested.
Abstract is missing.
Points Awarded
---------- 3 ----------
-------- 2 or 1 --------
---------- 0 ----------
Points Awarded

46
N Safety Sheet
---------- 2 ---------- Safety sheet is present and all safety hazards have
been identified.
---------- 1 ---------- Safety sheet is present, but not all hazards
have been identified.
---------- 0 ---------- Safety sheet is not present.
Points Awarded
O Title Page/ Table Of Contents
---------- 2 ---------- Both are present.
---------- 1 ---------- One is missing.
---------- 0 ---------- Both are missing.
Points Awarded
P Purpose
and Hypothesis
---------- 2 ---------- The problem has been defined and a prediction
has been made.
---------- 1 ---------- The problem has been defined, but a
prediction has not been made.
---------- 0 ---------- Neither the problem nor a
prediction is present.
Points Awarded
Q Review Of Literature (R. of L.)
----------5 or 4 ---------- Review of Literature is thorough, adequately
cited within R. of L., and pertinent to topic using APA format.
---------- 3 or 2 ---------- Review of Literature is adequate and
pertinent, but citations are inadequate, and/or did not follow APA format.
---------- 1 or 0 ---------- Little or no use of citations and
/or material is irrelevant to topic.
Points Awarded
R Materials
---------- 2 ---------- Materials are listed and measurements are in
metric, if applicable.
---------- 1 ---------- Not all materials are listed or
measurements are not in metric, where applicable.
---------- 0 ---------- No materials are listed.
Points Awarded
S Procedure
---------- 2 ---------- Procedure is easily followed; all steps included.
---------- 1 ---------- Procedure is present, but not complete or
confusing.
------ 0 ------ Procedure is missing.
Points Awarded
T
Results
---------- 4 or 3 ---------- Results are organized in tables or graphs; easily
read by someone not familiar with the work. Data is quantitative; explanations are given when
needed.
---------- 2 or 1 ---------- Results are less organized, not quantitative,
and/or difficult to understand.
---------- 0 ---------- Results are not present.
Points Awarded
U Conclusion
---------- 3 ---------- A concise evaluation and interpretation of the
data and/or results; referred to purpose and hypothesis.
---------- 2 or 1 ---------- Conclusion is present, but is not consistent
with data collected.
---------- 0 ---------- No conclusion present.
Points Awarded
V Reference
List
---------- 3 ---------- Quality and quantity of sources is adequate for topic. Sources listed are cited within R. of L.
using APA format.
---------- 2 or 1 ---------- Quality and quantity of sources is less than adequate, or sources not all cited within R.
of L., or APA format was not followed.
---------- 0 ---------- No literature cited present.
Points Awarded

47
(M-W) WRITTEN REPORT: (36 point maximum) POINT TOTAL FROM A-L: _________
STUDENT (S):____________________________________________PROJECT NUMBER:________ TOTAL POINTS = __________/99
W Convention
s
---------- 2 ---------- Good grammar and spelling are evident.
---------- 1 ---------- Some spelling and grammar mistakes are
evident.
---------- 0 ---------- Numerous spelling and grammar
mistakes are present.
Points Awarded
48
APPENDIX F
STUDENT INTERVIEW QUESTIONS
49
1. In what subject are you most confident? Why? 2. In what subject are you least confident? Why? 3. Do you like science class? a. What do you like and/or what don’t you like? b. What would make you like science class more? 4. Do you feel confident in science? a. Are you comfortable speaking up in class? b. Are you comfortable with your peers in science class? 5. How did what you do in your project connect with school, academics? 6. How important do you think the skills you are learning in the science fair project are to your future employment? 7. What experiences in this class have benefited you the most? Why did you choose these experiences? 8. Do you think the science fair project in Pre-AP physical science has helped you learn more about the nature of science? Why or why not? 9. Do you think participation in the science fair project should be mandatory or voluntary? Why? 10. Do you think you should be able to work with a partner or group to complete your science fair project? Why or why not? 11. Have you become more interested in science because of your participation in the science fair? Why or why not?
12. Is there anything else you would like to tell me concerning this class or the service learning projects? If so, please let me know.
13. How can I improve in the future? Any suggestions?