the impact of research grant funding on scientific … impact of research grant funding on...
TRANSCRIPT

NBER WORKING PAPER SERIES
THE IMPACT OF RESEARCH GRANT FUNDING ON SCIENTIFIC PRODUCTIVITY
Brian JacobLars Lefgren
Working Paper 13519http://www.nber.org/papers/w13519
NATIONAL BUREAU OF ECONOMIC RESEARCH1050 Massachusetts Avenue
Cambridge, MA 02138October 2007
We would like to thank Andrew Arnott, Andrew Canter, Jessica Goldberg, Lisa Kolovich, J.D. LaRock,Stephanie Rennae and Thomas Wei for their excellent research assistance. We thank Richard Suzman,Robin Barr, Wally Schafer, Lyn Neil, Georgeanne Patmios, Angie-Chon Lee, Don McMaster, VaishaliJoshi and others at NIH for their assistance. We gratefully acknowledge support provided by NIHExpress Evaluation Award 263-MD-514421. All remaining errors are our own. Jacob can be contactedat: Gerald R. Ford School of Public Policy, University of Michigan, 735 S. State Street, Ann Arbor,48109-3091; email: [email protected]. Lefgren can be contacted at: Department of Economics,Brigham Young University, 130 Faculty Office Building, Provo, UT 84602-2363; email: [email protected] views expressed herein are those of the author(s) and do not necessarily reflect the views of theNational Bureau of Economic Research.
© 2007 by Brian Jacob and Lars Lefgren. All rights reserved. Short sections of text, not to exceedtwo paragraphs, may be quoted without explicit permission provided that full credit, including © notice,is given to the source.

The Impact of Research Grant Funding on Scientific ProductivityBrian Jacob and Lars LefgrenNBER Working Paper No. 13519October 2007JEL No. H0,H51,I1,I12,I18,O3,O38
ABSTRACT
In this paper, we estimate the impact of receiving an NIH grant on subsequent publications and citations.Our sample consists of all applications (unsuccessful as well as successful) to the NIH from 1980to 2000 for postdoctoral training grants (F32s) and standard research grants (R01s). Both OLS andregression discontinuity estimates show that receipt of either an NIH postdoctoral fellowship or researchgrant leads to about one additional publication over the next five years. The estimates represent about20 and 7 percent increases in research productivity for F32 and R01 recipients respectively. The limitedresearch impact of NIH grants may be explained in part by a model in which the market for researchfunding is competitive, so that the loss of an NIH grant simply causes researchers to shift to anothersource of funding.
Brian JacobGerald R. Ford School of Public PolicyUniversity of Michigan735 South State StreetAnn Arbor, MI 48109and [email protected]
Lars Lefgren130 Faculty Office BuldingBrigham Young UniversityProvo, UT [email protected]

1
I. Introduction
Technological innovation is one of the primary forces driving economic growth. Yet
many economists have noted that the social rate of return to research and development (R&D)
expenditures is likely higher than the private rate of return, which will result in a suboptimal
level of investment in such activities (Jaffe 2002). As a result, governments devote
considerable resources to subsidize R&D, either through tax policy or direct investment. In
the United States, for example, the National Insittutes of Health (NIH) and the National
Science Foundation (NSF) allocate over $30 billion annually for basic and applied research in
the sciences.
Despite the magnitude of this investment and its importance for long-run economic
growth, there is suprisingly little evidence on the effectiveness of government expenditures in
R&D (Jaffe 2002). While economists have studied the labor market for scientists and the
productivity of scientists over the life cycle, they have not devoted as much energy to
understanding the effect of resources on the production of scientific output (Stephan 1996).
Moreover, studies that have attempted to examine this question have faced difficult selection
concerns – namely, researchers and organizations that receive funding likely differ from those
that do not receive funding on a host of unobservable as well as observable dimensions.
There are several reasons why understanding the impact of government expenditure is
critical. First, it is not obvious that such expenditures are effective. Waste or inefficiency may
result in the unproductive use of government resources, and public support for R&D may crowd
out private support (David et al. 2000). Insofar as taxes impose costs on the economy, society
may be worse off if the total level of R&D expenditure remains the same and public funding
simply replaces private funding. Second, the efficient allocation of government expenditures

2
requires an understanding of the circumstances under which investment is likely to be most
productive. For example, the social planner would like to know how the marginal impact of a
dollar of research funding varies across discipline, field, researcher and institution.
Government funding for scientific research may influence the size of the research
sector as well as the productivity of researchers within the sector. A comprehensive cost-
benefit analysis would examine the R&D consequences of government funding on both of
these margins. In this analysis, however, our focus is somewhat narrower. Here we attempt to
identify the causal effect of receiving an NIH grant on subsequent research productivity. This
effect reflects a combination of the marginal impact of financial resources on researcher
productivity and the ability of researchers to make alternative funding arrangements when one
source becomes unavailable.
In addition to regression analyses in which we control for demographics, prior research
productivity, and reviewers’ perception of application quality, we utilize a regression
discontinuity design to estimate the causal impact of NIH funding on scientific output. Our
sample consists of all applications (unsuccessful as well as successful) to the NIH from 1980
to 2000 for postdoctoral training grants (F32s) and standard research grants (R01s). Unlike
the NSF and most foundations, the NIH allocates research funding in a largely formulaic way
on the basis of priority scores derived from independent scientific reviews. We first show that
there is a highly nonlinear relationship between a proposal’s priority score and the likelihood it
is funded. We then use this nonlinearity in an instrumental variables framework to estimate
the effect of funding on a variety of outcomes, including publications, citations, and future
research funding.

3
We find that NIH postdoctoral fellowships increase research publications and citations
in the years following grant application. Receiving an NIH postdoctoral fellowship increases
five-year publication rates from 4.6 to about 5.3, or roughly 20 percent. It also increases the
likelihood the recipient has at least one publication by 11 percent, and increases the chances of
having five or more publications by 23 percent. This suggests that NIH postdoctoral grants
represent an important gateway to a research career for many young scholars. Since these
effects represent the effect of an NIH postdoctoral fellowship relative to the next best option,
the total effect of NIH postdoctoral fellowships is likely to be much larger because they
increase the total supply of training opportunities.
In contrast, we find that NIH research grants have at most a small effect on the
research productivity of the marginal applicants. The average award amount for a research
grant in our sample is $1.7 million. OLS estimates, which likely represent an upper bound to
the causal effect, suggest that grant receipt is associated with only 1.18 publications (and only
.20 first-author publications) over the next five years, and roughly double this over the 10
years following the grant. Given a baseline of 14 publications over a typical five-year period
for unsuccessful applicants, this represents a relative effect of only 7 percent. The IV estimates
are virtually identical to the OLS estimates, although less precisely estimated. Using the top
of the IV confidence interval as an upper bound to the causal impact yields effect sizes that are
somewhat larger than the OLS estimates, yet still small relative to the baseline productivity of
the applicants.
This small effect is consistent with the marginal publication impact of research funding
being quite small for the set of researchers on the margin of receiving NIH funding. The
findings are also consistent, however, with a model in which the market for research funding

4
is competitive, so that the loss of an NIH grant simply causes researchers to shift to another
source of funding. This phenomenon is analogous to the phenomenon by which public R&D
expenditures may crowd out private investments in R&D.
To explore the possibility that NIH grant receipt displaces other funding, we examine
the impact of an NIH grant award on both subsequent NIH funding as well as contemporary
and subsequent NSF funding. We find that receiving an NIH research grant does appear to
reduce subsequent NSF funding, although the magnitude of this displacement is quite small.
We also compare the average number of different funding sources cited on papers of
successful and unsuccessful NIH grant applicants over a five-year period following the grant
application. We find that 83 percent of papers have at least one listed funding source and that
the average paper has 2.45 different listed funding sources. While published papers of
unsuccessful applicants are less likely to be funded by the NIH, they are no less likely to have
at least one funding source. Furthermore, the difference in number of funding sources
between grant winners and losers is not statistically significant. This suggests that researchers
might be insured by coauthors or smaller funding agencies against the possibility that
productive research projects are not funded.
While this analysis presents new evidence on the effectiveness of public R&D
expenditures, as with any empirical analysis, it has several limitations. Most importantly, one
must recognize that our results do not imply that NIH research funding is not valuable. If overall
funding is in fixed supply, NIH research support may increase the amount of R&D in the
aggregate without having an impact on the marginal applicant. Ideally, one would like to know
the impact of changing overall funding. However, even in a purely experimental setting where

5
one is able to manipulate one source of funding, it is not feasible to prevent individuals and
markets from compensating.
In addition, our estimates will not capture any spillover benefits of research funding,1 nor
will they capture what some have referred to as the transformational impact of R&D
expenditures – i.e., the notion that public support for science may change the nature of the
research infrastructure which, in turn, may have a much more dramatic impact on future
productivity (see, for example, Jaffe 1998, 2002 and Popper 1999). Second, our estimates
capture the impact of funding on a particular subset of researchers – namely, those researchers
who were on the borderline of funding. To the extent that there are heterogeneous treatment
effects, our estimates may not reflect the average treatment effect. Third, the publication-based
measures we use as outcomes do not capture the increase in societal welfare as a result of
funding, though they arguably provide a good approximation of the potential welfare effects.2
The remainder of the paper proceeds as follows. In section II, we review the prior
literature relating to R&D investment and its impact on scientific output. In Section III, we
provide some background on the NIH funding process. Section IV discusses our methodology,
and Section V describes our data. In Section VI, we present our main results. Section VII
discusses our results and presents an economic model consistent with the main findings. Section
VIII concludes.
1 In fact, spillovers from successful to unsuccessful applicants in our sample will lead us to underestimate the direct benefits of research funding, as explained in greater detail below. 2 Because the aggregate number of publications is constrained by the number of journals, for example, an aggregate social welfare analysis of science using publications is not meaningful (Aurora and Gambardella 1998).

6
II. Prior Literature
As alluded to above, there is little persuasive evidence regarding the impact of resources
on the production of scientific output. Several studies that examine the relationship between
research funding and publications find small positive effects, but recognize the potential for
selection bias, which would lead them to overstate the true impact of funding (Averch 1987,
1988; Arora and Gambardella 1998, Benoit 2002). For example, Arora and Gambardella (1998)
find that past productivity and other observable researcher characteristics such as institution
quality are correlated with NSF award selection even after controlling for reviewer score,
suggesting that their estimates may be biased upward.
Another set of studies have evaluated the effects of government sponsored commercial
R&D using matched comparison groups (Irwin and Klenow 1996; Lerner 1999; Branstetter and
Sakakibara 2000). While these studies generally suggest that government funding can increase
productivity, Klette, Moen and Griliches (2000) note that all of these studies are susceptible to
serious selection biases.
A few earlier studies have examined the effect of research funding provided by NIH in
particular. Pion (2001) compared the career and research outcomes of participants in NIH
sponsored pre-doctoral training programs to two other groups of doctoral students and found that
NIH pre-doctoral support had little impact. However, due to questions regarding the similarity
of the comparison groups (i.e., students within the same university as the NIH-sponsored fellows
but who did not receive an NIH fellowship and students at institutions that did not receive NIH
support), it is hard to interpret these results. In their evaluation of NIH career development
awards, Carter, Winkler and Biddle (1987) compare successful versus unsuccessful applicants,
controlling for a linear measure of the applicant’s priority score. They find that the award may

7
increase future grant funding slightly, but that it does not appear to increase publication-based
measures of research productivity. This strategy leverages the intuition behind a regression
discontinuity analysis and thus, in theory, should eliminate selection concerns. However, the
implementation suffered from several potential shortcomings. The authors do not provide
evidence that career grants were, in practice, awarded strictly on the basis of priority scores, nor
do they include more flexible controls for the priority score to account for any underlying non-
linear relationship between score and productivity. Perhaps most importantly, the authors do not
analyze the standard large research grants (R grants) that NIH awards each year, which arguably
comprise the central function of the institute.
III. Institutional Background
Founded in 1887 as the Laboratory of Hygiene, the NIH is now one of the leaders in
promoting and supporting scientific and medical research. In 2002 NIH allocated approximately
50,000 awards totaling roughly $19 billion in funds for research and training in the sciences and
an additional $6 billion for intramural research. NIH has a variety of funding mechanisms, from
pre-doctoral fellowships to large-scale research program grants. In this study, we focus on two
granting mechanisms: post-doctoral fellowships and research grant awards.
Post-doctoral fellowships (F32 grants) are awarded to young researchers who have just
completed their graduate training. The grants are awarded for up to three years and include a
stipend for the individual and a payment made to the sponsoring institution. In 2003, NIH
granted approximately 1,600 postdoctoral fellowships with annual stipends ranging from
$35,000-$50,000. These fellowships are likely to comprise the primary or only source of

8
funding for individuals during this period in their career. A primary goal of the fellowship is to
steer recipients into a research career.
Research program grants (R01 grants) are provided to fund specific projects. They can
be awarded for up to five years, are renewable and generally provide substantial funding (e.g.,
the average R01 funded by the National Cancer Institute in 2000 awarded researchers $1.7
million over 3.1 years). These traditional research program grants compose the lion’s share of
the NIH budget for research support.
The Grant Application and Scoring Process
Grant applications can be submitted three times during the year. All applications are
subject to peer review within Integrated Review Groups (IRGs) organized around topics or areas.
Reviewers evaluate proposals on the basis of five criteria (Significance, Approach, Innovation,
Investigator and Environment) and assign each application a priority score on a scale of 1 to 5
(reviewers assign a score up to two significant digits, e.g. 2.2, with 1 being the highest quality).
The average of these scores is calculated and multiplied by 100 to obtain the priority score. A
certain fraction of the lowest quality applications (as determined by the reviewers) do not receive
priority scores. Typically, half of all research program grant applications do not receive scores,
whereas all fellowship and career applications receive scores, but this varies considerably across
institutes.3
Because funding decisions are made within institutes (in contrast to research grant
proposals, which are evaluated by review groups examining applications from different
institutes), the NIH normalizes scores within review groups. Specifically, research grant
3 Applications go through a second stage of review by the National Advisory Council, although the Council generally follows the recommendations of the review groups and institutes, and so does not have a significant influence on the relationship between priority scores and funding.

9
applications (R grants) are assigned a percentile score, which ranks the proposal in relationship
to other recent applications from the review group. Postdoctoral fellowship award applications
are generally reviewed by a single body within the particular institute, and are therefore not
transformed into percentile ranks.
The Funding Determination
The nature of the funding decision varies by the grant type. Funding determinations for
postdoctoral fellowships are made at the institute level, so that applications from different
programs within the institute compete against each other for funding. On the other hand,
research program grants are often, though not always, awarded by units (e.g., divisions,
programs, branches) within an institute.4 For this reason, we conduct the discontinuity analysis
for research grants within units underneath the institute level, such as branches, programs or
divisions. We provide more detail on this point in the following section.
The number of grants funded depends on the institute (program area) budget for the fiscal
year. In practice, each decision-making unit is allocated a budget. Funds from this budget are
first used to fund ongoing grants that were awarded in previous years. The remaining funds are
spread across the three funding cycles. During each of the first two funding cycles (October and
January), about 30 percent of the available funds are typically allocated. About 40 percent of the
funds are normally allocated during the last funding cycle (May).5
4 The level at which funding occurs varies considerably across institute, mechanism and year. 5 The funding of applications is weighted to the end of the fiscal year for strategic reasons. Administrators want to ensure that high quality applications that are submitted late in the fiscal year have an opportunity for funding. If there are few such applications, administrators fund a larger fraction of marginal applications that had passed over in early cycles. Because a disproportionate share of funding is saved for the last cycle of the fiscal year, most applications are funded in the same fiscal year they are received or not at all.
10
Generally, grants are awarded solely on the basis of priority score. This does not
always occur, however. Institute directors have the discretion to fund applications out of order
on the basis of their subjective judgment of application quality, or other factors such as how an
application fits with the institute’s mission or whether there were a large number of
applications submitted on a similar topic. Moreover, as noted above, institutes may also
choose to fund applications on their last evaluation cycle instead of newly submitted
applications that can be reconsidered later. Nonetheless, as we will see below, there is still a
very strong nonlinear relationship between a proposal’s priority score and the likelihood it will
be funded in the current funding cycle.
Researchers whose applications receive a poor score and do not receive funding have the
ability to respond to the criticisms raised by reviewers and submit an amended application.
Amended applications are treated in the same manner as new applications for the purposes of
evaluation and funding. As discussed below, this has important implications for our analysis.
IV. Methodology
Having discussed the context within which NIH grants operate, we will now outline
the methodological issues relevant to the paper. To begin, we outline our identification
strategies. In addition to non-experimental methods, we employ a quasi-experimental research
design, which relies on the highly nonlinear relationship between priority score and funding.
We discuss the assumptions underlying these approaches, and examine the plausibility of
these assumptions for our investigation. Finally, we highlight several important issues in
terms of interpretation of the results.

11
Identification Strategy
Our goal is to estimate the impact of grants on research productivity. If research grants
were randomly allocated to researchers, one could identify the causal effect of grant receipt by
simply comparing the research output of successful and unsuccessful applicants. However, the
allocation of funds to applicants is not random. In particular, more qualified and/or motivated
researchers are more likely to receive grant funding and to produce high quality research.
Similarly, the most promising research ideas may yield high quality publications and numerous
citations whether or not they are funded by a specific agency. These factors suggest that funding
is likely to be positively correlated with the unobserved characteristics of the applicant. To the
extent that this is true, naïve comparisons of successful and unsuccessful applicants are likely to
be biased upward, reflecting both the causal impact of receiving a grant as well as differences in
baseline productivity levels.
We will attempt to deal with the non-random assignment of grants to applications in two
ways. First, we will use the abundant information available to us regarding the quality of the
grant application and prior productivity of the researcher to control for the expected productivity
of the researcher in the absence of the grant. More specifically, we will estimate a regression of
the following form:
(1) ( )1 1it it it it itproductivity funded f n X Bβ ε+ += + + + .
where 1itproductivity + is the research productivity of individual i in period t+1, ,i tfunded
indicates whether the researcher’s application was ultimately successful, itn is the priority score
of the researcher’s application normalized relative to the grant funding cutoff (we describe this in
more detail below), f() is a smooth function, itX is a vector of researcher-level covariates, and
1itε + is a mean zero residual. Our hope is that by controlling adequately for the priority score of

12
the grant application, researcher characteristics, and prior productivity we can identify the
approximate causal effect of grant receipt on subsequent research productivity.
We recognize that this approach may not completely eliminate unobserved heterogeneity
and thus the estimates resulting from this approach should be considered upper bounds of the
causal effect. We do, however, control for an extraordinarily rich set of background
characteristics and prior productivity measures, including the priority score for the grant
application, which are highly correlated with research productivity. Thus our non-experimental
estimates of the productivity impacts of NIH grants may suffer from little bias.
Our second approach relies upon the fact that NIH funding is awarded on the basis of
observable priority scores, and that there is a highly nonlinear relationship between this score
and the probability of funding. This strategy is based on the regression discontinuity (RD)
design, which has become increasingly popular in empirical labor economics research in recent
years, and has been used to successfully evaluate a variety of education and criminal justice
programs. The intuition behind the RD design is that if one compares applicants just above and
just below some pre-specified cutoff, there will be little if any difference in unobservable
determinants of productivity but a large difference in the likelihood of receiving funding.6
Indeed, in a recent review article, Jaffe (2002) strongly endorses this startegy for evaluating
government R&D expenditures, noting that RD offers the best balance between political
feasibility and statistical robustness.
There is no pre-determined cutoff for funding that applies universally across the NIH.
Instead, the realized cutoff in each situation depends on the level of funding for a particular
institute, year and mechanism, along with the number and quality of applications submitted.
6 For a formal treatment of RD designs, see Hahn, Todd, and Van der Klaauw (2001). For empirical examples, see Jacob and Lefgren (2004a, 2004b), Thistlethwaite and Campbell (1960), Berk and Rauma (1983), Trochim (1984), Black (1999) and Angrist and Lavy (1999).

13
This political reality actually provides significant advantages for our identification since it
essentially establishes dozens of different cutoffs that we can exploit, and reduces the concern
that a single cutoff might coincide with some other factor that is correlated with research
productivity.
To aggregate across institutes and years, we define the cutoff in institute j in year t in
grant mechanism g , jgtc , as the score of the last funded application in the counterfactual case
that no out-of-order funding had occurred. Denote ijgtp as the priority score received by
researcher i’s application in institute j in year t in grant mechanism g. We then subtract this
cutoff from each priority score to obtain a normalized score, which will be centered around the
relevant funding cutoff: ijgt ijgt jgtn p c= − .7
Figures 1 and 2 show the probability that a grant application is funded as a function of the
normalized priority scores for researchers within our sample.8 Note that while the probability of
funding is a highly nonlinear function of the normalized application score, there is clearly
evidence of out-of-order funding. In the case of F32 applications, some successful applicants
ultimately decline the award in favor of alternative employment, further attenuating the
relationship between normalized score and grant receipt. For F32 applicants in our sample, 7
percent of individuals who scored above the cutoff received the grant, while 26 percent of those
below the cutoff did not receive a grant or declined the award. The corresponding error rates for
R01 applications are 8 and 4 percent.
7 Ideally, one would like to create the theoretical cutoff score taking into account the amount of funding associated with each application. Unfortunately, the NIH files do not contain any information regarding the requested funding amounts for the unfunded applications. Note that if all applications requested the same amount of funding, both approaches would yield identical cutoff scores. This is an excellent approximation for the postdoctoral fellowships and a reasonably good approximation for the research program grants. 8 The cutoff is defined based on all individuals, regardless of whether they happen to be in our analysis sample.
14
Another concern is that marginal applicants can reapply multiple times. While this is
uncommon among applicants to postdoctoral fellowships, it is quite common among R01
applicants. To the extent that marginal, unfunded applicants are likely to receive funding if
they reapply, missing the cutoff in any particular round (i.e., year) will be less predictive of
eventual grant receipt than it is of immediate grant receipt. Figures 3 and 4 show the
probability that an award is eventually funded as a function of the current application’s score.9
While the figure for F32 grants is virtually unchanged, the relationship between current grant
score and eventual grant funding becomes much less sharp for R01 applications. While the
probability of award drops rapidly in the vicinity of the cutoff, the probability of eventual
award continues to decline more gradually a fair distance from the cutoff. While 96 percent of
applicants with a score below the cutoff are awarded a grant, 24 percent of those above the
cutoff are also awarded a grant at some point.
While the existence of out-of-order funding, rejected awards, and reapplication makes
a sharp RD design infeasible, it is still possible to leverage the nonlinear relationship between
normalized priority score and the probability of eventual grant receipt to identify the causal
impact of research funding. This strategy is often referred to as a “fuzzy” RD design. As we
show below, however, this approach is simply a variant of standard instrumental variables
estimation where the nonlinearity in the rating variable provides a plausible exclusion
restriction. In this framework, the second stage of our IV estimation is represented by
equation (1).
When examining F32 grants, our first stage is given by:
9 Note here that we are tracking individual grants and their corresponding resubmissions over time. If an unsuccessful researcher submits a completely new application – even if the subject of the application is closely related to the original application – we consider this a new proposal and it will not be captured by the eventual award measure. However, our conversations with NIH staff suggest that the vast majority of unsuccessful applicants who submit a related proposal do so as a resubmission rather than a new application.

15
(2) ( ) 1_it it it it itfunded below cut g n Xγ η += + + Γ+ ,
where _ itbelow cut is a binary variable indicating that the normalized score was below the
imputed funding cutoff, and the other variables are as described earlier. The identifying
assumption is that, having controlled for a smooth function of the normalized application
score, any further change in research productivity associated with being below the cutoff is
attributable to receiving an F32 grant. Note that our first stage equation takes advantage of
variation attributable only to the observed priority score. Because of this, the estimated
treatment effect will be unbiased even if administrators fund out of order based on the
unobserved aspects of the applicant or research idea.
When examining R01 grants, we use a slightly different first stage given by
(3) ( )1 2 1_ _ *it it it it it it itfunded below cut below cut n g n Xγ γ η += + + + Γ + ,
which includes an interaction between the below_cut indicator variable and the normalized
priority score. This specification takes into account that the relationship between the
application score and the probability of being funding changes at the cutoff. It also allows for
a discrete increase in the probability of funding in the vicinity of the cutoff. In this case,
identification comes from two sources: (a) changes in productivity associated with being
below the cutoff, conditional on a smooth function of the normalized priority score, and (b)
changes in the slope of the relationship between the normalized priority score and subsequent
productivity above versus below the cutoff. More specifically, because a lower priority score
has little impact on the probability of grant receipt below the cutoff, if research funding does
indeed increase productivity, we should see a weaker relationship between normalized priority
score and productivity below the cutoff relative to above the cutoff.

16
Assumptions of RD Analysis and Threats to Identification
With a sharp regression discontinuity design and adequate data, identification only
requires that the outcome vary smoothly with the index used to assign treatment. This
assumption is most likely to be violated when agents can manipulate their index value, leading
to situations where those just below the cutoff differ systematically from those just above. In
our situation, applicants all have an incentive to write strong grant applications but have no
direct control over the score their application receives. Additionally, the cutoff is unknown
until all applications have been received and evaluated. Hence, concerns of this type are
unlikely to be severe.
With fuzzy regression discontinuity design, however, one relies on a broader range of
data around the cutoff and more stringent functional form assumptions. In our case, we
assume that a low-order polynomial in the normalized application score captures the baseline
relationship of this variable with future research productivity. To the extent that we fail to
control adequately for the baseline relationship between application score and future
productivity, our instrument may capture the residual relationship between these two
variables. This would lead to inconsistent estimates of the parameter of interest.
Fortunately, we can test our IV strategy by examining the relationship between grant
awards and research outcomes prior to the grant application. To the extent that our IV
strategy yields an estimated relationship between grant receipt and prior productivity that is
close to zero, our identification strategy would seem plausible. This presupposes, of course,
that the baseline relationship between normalized application score and prior productivity is
similar to that between application score and subsequent productivity. To further minimize
concerns regarding function form assumptions, we check the robustness of our results to the

17
use of more flexible controls of the normalized score and to the use of samples restricted to be
within varying distances from the cutoff.
Interpretation of Findings
As discussed earlier, the reported estimates capture only the impact of receiving an
NIH grant relative to the next best option, which will, in turn, depend on the nature of the
market for research funding. To the extent that funding agencies compete to fund the highest
caliber researchers, we might expect the treatment effect to be small due to the quality of the
outside option. Thus our estimates cannot answer the question of how NIH grants affect
future productivity relative to receiving no research training or support.
Second, note that our IV estimates rely on variation in treatment status generated by a
nonlinear function of the normalized application score. Because of this, the local average
treatment effect (LATE) implicitly compares the productivity of applicants who received a
grant because of a low application score to that of applicants who were rejected due to a
higher score (controlling for a smooth function of the normalized application score). While
sharp discontinuity designs reflect the experience only of individuals near the cutoff, our
baseline IV estimates leverage information regarding applicants somewhat further from the
cutoff. Still, to the extent that there are heterogeneous treatment effects, our estimates will not
necessary capture the average treatment effect.
Finally, the possibility of resubmission influences how one should interpret the
estimates for R01 grants. Consider applicants just below and above the funding cutoff on their
first application. These applicants can be divided into three groups, each of which contains
initially successful as well as initially unsuccessful applicants. The first group includes

18
researchers who respond to rejection by submitting an amended application that is successful.
Being above the funding cutoff generates no variation in these individuals’ eventual funding
status, and so their experience is not reflected in our LATE. The second group includes
individuals who, in the case of rejection, submit an amended application that is again rejected.
Being above the cutoff generates variation in these applicants’ funding status so they are
captured in our LATE. We might expect them to have somewhat worse projects than the first
group, however, because their grant applications could not withstand the scrutiny of multiple
reviews. On the other hand, since NIH funds only a small fraction of applications, any
application near the funding cutoff is likely to be considerably higher quality than the average
application. Perhaps more importantly, regardless of the quality of the project, it is not clear
the marginal benefit of NIH funding would necessarily be lower for this group. For example,
it is possible that these applicants might have had somewhat more difficulty obtaining other
funding. The third group contains researchers who do not submit an amended application if
their initial proposal is rejected. Being above the cutoff generates variation in the funding
status of these individuals as well, so they too are reflected in the LATE. To the extent that
unsuccessful applicants in this group do not reapply because they had outside funding options
or because their grant proposals were found to have limitations that could not be easily
remedied, we might expect these individuals to receive relatively less benefit from NIH
funding. This simple thought experiment suggests that the treatment effect we identify for
R01 applications (whether using OLS or IV) is likely to be somewhat lower than the treatment
effect for the full sample of individuals near the cutoff.10
10 Because of the low incidence of resubmission for F32 grants, this is much less of a concern when examining those grants.

19
Measurement Error and Estimation
An additional complication with the estimation presented above involves the presence of
measurement error in the dependent variable. As described more fully below, the imperfect
matching of NIH researchers to publications generates non-classical measurement error in many
of our outcome measures. While this measurement error will not affect the consistency of our
estimates, it will reduce our statistical power.
However, measurement error in the dependent variable does complicate our use of
nonlinear estimation methods, as is the case when estimating models to determine whether
receiving an NIH grant increases the probability that a researcher surpasses a particular threshold
of productivity. For example, suppose we want to examine how receiving an NIH grant affects
the probability that a researcher has at least one publication. This threshold could be met
because (a) the researcher actually has at least one publication, (b) the researcher has at least one
false match, or (c) both. To see why this is problematic, consider the case in which an individual
has a false match. We will observe that this individual has surpassed the cutoff regardless of her
true productivity, so that any factors that increase her actual productivity will appear to have no
impact. In other words, for the subset of individuals with false matches, the coefficient on grant
receipt will be zero by construction. For this reason, conventional estimation techniques for
binary outcomes (e.g., Logit or Probit) will yield attenuated coefficients. This is not a concern
when we attempt to estimate the impact of grant receipt on continuous outcomes using a linear
model because the measurement error introduced by false matches is additive. All applicants
with false matches will appear more productive than they were in reality, but assuming that the
assumptions described earlier are met, the difference in observed productivity between those who
do and do not receive NIH grants will not be attenuated.

20
To adequately address concerns regarding non-additive measurement error in the context
of our RD identification strategy, we develop a simple maximum likelihood estimator (analogous
to a probit model) that accounts for the fact that the false matches can push individuals across the
productivity threshold. To account for the potential endogeneity of grant receipt, we employ an
estimator analogous to a bivariate probit in which the nonlinear terms in the priority score
provide an exclusion restriction to identify the causal impact of grant receipt. For a more
detailed description of this estimator, see Appendix C.11
The issue of measurement error also complicates a calculation of the relative magnitude
of our estimates. While our point estimates will provide an unbiased estimate of the treatment
effect of receiving an NIH grant, both the number and variance of baseline publication and
citation rates in our sample will be inflated by the presence of bad matches. In the absence of
any correction, this will lead us to understate the relative magnitude of the impacts. In order to
address this concern, we compiled a sample of roughly 2,000 NIH applicants and conducted an
extensive manual search in order to verify which of the publications we obtained using our
standard matching approach were correct, and which were false positives. On the basis of this
analysis, we determined that the average number of false positives in any given year is 0.12 and
that the variance of false positives for a given year is roughly 0.56. We then use this estimate of
the variance of false positives to calculate the variance of “true” productivity. We define total
matches, mt , as the sum of good and bad matches, denoted as mg and mb respectively:
mt = mg + mb . Assuming that good matches are a function of true productivity and bad matches
are a function of name frequency alone, the variance of good matches will be uncorrelated with
11 A similar situation arises with other non-linear models, such as the Poisson or the Negative Binomial. We have experimented with Poisson and Negative Binomial models that account for measurement error in a manner analogous to that described in Appendix C. The results were similar to those presented in the paper, so for the sake of brevity we do not present them here.

21
variance of bad matches: var mt( )= var mg( )+ var mb( ). In this case, the variance of true
productivity is simply calculated as var mg( )= var mt( )− var mb( ). Using our estimate of the
variance of true productivity, we can accurately determine the relative magnitude of our impacts.
V. Data
This study relies on several data sources. Information on NIH applicants and
applications, including priority scores, are drawn from two administrative files: the Consolidated
Grant Applicant File (CGAF) and the Trainee and Fellow File (TFF). These files include records
for all applications for research grants and fellowships. The records provide information on the
principal investigator (name, department, home institution, etc.), the type of application
(including the date the grant was considered, the grant type or mechanism as well as the institute
and program area to which it was submitted), the priority score received by the application,
whether the application was funded and how much funding it received.
Matching NIH Applicants to Outcome Data
The outcomes we examine include publications and citations, future NIH funding, and
future NSF funding. While much of the data construction undertaken for this analysis is
standard, it is worth discussing one issue in greater detail since it presents a considerable
challenge for our analysis – namely, the matching of NIH applicants to the outcome data. The
NIH files utilize a unique individual identifier so that we are able to perfectly match applicants in
any given year, institute and mechanism to past and future funding information. Unfortunately,
matching is more difficult for our other outcomes.

22
Our basic approach is to match NIH applicants to publications and NSF funding
information using first and last names (first initial and last name in the case of publications and
citations). Of course, this will likely result in a number of false positives. Therefore, we utilize a
variety of different strategies to minimize the incidence of bad matches (for a complete
discussion, see Appendix A). For example, when matching to publication information, we
exclude matches to journals in the humanities and several other fields under the assumptions that
these are likely bad matches. It is very unlikely that a biochemist applying to the National
Cancer Institute has actually published in Poetry Quarterly and, even if she has published in this
journal, we do not necessarily want to attribute this output to receipt of an NIH grant. We also
eliminate matches in which the middle initial in the NIH administrative files differs from the
middle initial indicated in the publication. Similarly, when matching to NSF, we exclude all
matches to NSF divisions such as Geosciences and Engineering where a manual review of first
and last name matches indicated that the vast majority of these matches were erroneous.
It is also possible that our matching results in false negatives because of name
misspellings or name changes. In order to minimize this possibility, we rely on NIH records that
list multiple spellings (and even multiple names) for the same individual who has applied for
multiple NIH grants. This file exists as a result of the “un-duplication process” that NIH
periodically undertakes whereby it links all applicants to unique individual identifiers, and thus
tracks individuals who have changed their name or whose name was misspelled in selected files.
While we believe that we have eliminated the vast majority of bad matches in our sample,
some clearly remain. The primary consequence of unreliable matches is that the dependent
variable will contain non-classical measurement error. Given our reliance on name matches, we
are more likely to obtain false positives than false negatives. And the degree of measurement
23
error is likely to be greater for individuals with more common names. To minimize the impact
of extreme positive outliers in the outcome measures, we recode all values above the 99th
percentile to the 99th percentile value for all publication, citation, NSF funding and NIH funding
variables.12
Regardless of the nature or extent of the measurement error, it is important to keep in
mind that it will not affect the consistency of our estimates as long as the measurement error is
not correlated with priority scores in the same nonlinear fashion as the funding cutoff. In our
case, there is no reason to believe that applicants just above the cutoff are any more or less likely
to have bad matches than applicants who score just below the cutoff (or that the likelihood of bad
matches is correlated with the nonlinear term of one’s priority score), so that there is no reason to
believe that the measurement error will bias our results.
The presence of measurement error in the dependent variable will, however, reduce the
statistical power of the analysis. To remedy this, we limit our analysis to a sample of individuals
with uncommon names (for more details, see Appendix B). Since name frequency is unlikely to
be correlated with whether an individual is just above or below the funding cutoff (conditional
on flexible controls for her priority score), this restriction will not influence the consistency of
our estimates. However, if this group of researchers is different than the overall pool of
applicants in important ways, this strategy may change the interpretation of our estimates. For
example, if researchers with uncommon names are more likely to be immigrants or come from
relatively small ethnic groups, our estimates will reflect the impact of grant funding on these
groups. If such researchers use grant funding either more or less productively than other
individuals, our estimated treatment effects will not generalize to the broader population of
12 We do so for NIH funding variables in order to account for a small number of cases where individual researchers are listed as received extraordinarily large grants for research centers.

24
researchers. In order to assess the external validity of our estimates, we compared NIH
applicants with common and uncommon names on a variety of observable characteristics. The
results, reported in Appendix Table B2, suggest that those with uncommon names are quite
comparable to those with more common names.
Outcome Measures
The majority of our outcomes reflect the degree of productivity, including the number of
publications, citations, and subsequent grant funding, in different time periods following the NIH
grant application. In order to explore whether funding influences the direction or type of an
applicant’s research, we create an indicator which measures the extent to which a grant applicant
in one institute is publishing in the journals that are most popular among existing grant recipients
of the institute. To do so, we take a sample of researchers who received NIH grants and examine
all of their publications over a 35-year period. Using a data set where each article is the unit of
analysis, we calculate a market share measure for each journal, which is simply the fraction of all
articles published by the sample of researchers that appear in that journal. For example, a score
of 10 indicates that 10 percent of all articles published by researchers affiliated with the institute
appear in the particular journal. For example, the Journal of Biological Chemistry has the largest
market share among grant recipients from the Heart, Lung, and Blood Institute, with 4.9 percent
of the articles published by these researchers appearing in this journal. To measure the degree to
which a researcher is publishing in the institute’s field, we average this market share measure
across a researcher’s publications over the relevant time period.13
13 For some outcome measures, we do not have data for the full five or ten years after the grant application date. For example, we only have NIH funding data through 2003. When examining NIH funding for the five years subsequent to the application date, the lack of recent data causes problems for grant applications submitted after 1998. In these cases, we inflate performance over the available time period to generate a five-year equivalent. For

25
Sample
We start with all applications for postdoctoral fellowships (F32s) or research program
grants (R01s) submitted to NIH between 1980 and 2000. We exclude all applications that were
solicited (in a Request for Proposal or RFP) and focus exclusively on new grant applications or
competing continuations (i.e., applications that propose to continue an existing grant, but
nonetheless must compete against other applications). We also drop the 18,832 R01 applications
that did not receive a priority score since this score is crucial to our analysis.14 Note that
dropping these applications will not affect the consistency of our estimates since the unscored
applications are, by definition, those judged to be of the lowest quality, and therefore far from
the funding margin. To minimize measurement error, we focus on the 44 percent of F32 and the
45 percent of R01 applications in which the applicants have uncommon names, defined as those
whose last name was associated with 10 or fewer unique NIH applicants during our time period.
Of this sample, we drop a small number of applications (4,077 for the R sample and 246 for the
F sample) from institute-years with fewer than 100 applications since these observations
contribute very little to estimation and generally reflect unusual institutes within NIH. We also
drop 5,089 R01 applications from institute-years in which grants did not appear to be allocated
strictly on the basis of the observed priority score cutoff. Specifically, we dropped institute-
example, for grant applications submitted in 1999, we have only four years of subsequent grant data. For these observations, we multiply grant amounts by 5/4 to generate a five-year equivalent. For publications and NSF funding data, we have data through 2005. We therefore do not have the same problem when examining outcomes up to five years after the application date. When, examining outcomes six to ten years after the application date, we use the approach described above. The use of year fixed effects takes into account level differences associated with the imputation approach. Moreover, our results are also robust to the exclusion of observations without complete outcome data. 14 It is common for IRGs not to score the lowest quality applications. However, there does not appear to be a consistent rule adhered to by all IRGs. For some mechanisms in certain institutes and years, very few unfunded applications received a priority score. At other times, or in other institutes, nearly all applications (funded or unfunded) had priority scores.

26
years in which more than 10 percent of the applications were either above the cutoff and funded
or below the cutoff and not funded.
Summary statistics are shown in Table 1. Recall that the unit of observation is an
application. The final sample for the postdoctoral fellowships has 13,462 observations reflecting
12,189 unique individuals over 20 years and 16 different institutes. The final sample for the
research grant analysis contains 54,742 observations, reflecting 18,135 unique researchers
covering 20 years and 18 different institutes. Several facts are worth noting. First, researchers
from the biological sciences constitute 82 to 85 percent of the sample while researchers from
physical science departments constitute 6 to 9 percent and social scientists only account for 3 to
5 percent. Similarly, the majority of applicants from universities are housed in medical or dental
schools rather than arts and sciences or other professional schools. Roughly 34 percent of
applicants for research grants have a MD degree. Second, reflecting this emphasis, the largest
institutes within NIH are General Medicine, Heart, Lung and Blood and Cancer, which
contribute 16, 13 and 15 percent of the observations respectively. In comparison, Child Health
and Development and Mental Health contribute only 7 and 4 percent of the observations in our
R01 sample.
It is also useful to examine summary statistics for our outcome measures. First, note that
over 90 percent of applicants have at least one publication in the first five years following their
application, suggesting that most individuals in our sample are at least somewhat engaged in the
research process regardless of whether or not they are successful in obtaining the NIH grant.
Second, note that the variance of outcomes is extremely large. For example, in our R01 sample,
the standard deviation of publications and citations in the five years following application is 16

27
and 820 respectively. While part of this variance is due to bad matches, it nonetheless suggests
that there is a tremendous degree of variation in our sample.
VI. Findings
The results are presented in three parts. First, we present results from baseline OLS
estimates to gain a basic understanding of associations in the data and to explore how much
selection on observables appears to exist in the NIH funding process. This section also explains
several of our outcome measures in greater detail, and discusses several important issues
regarding interpretation. Second, we present our instrumental variables results for postdoctoral
fellowships. We will present the main results, followed by a series of sensitivity analyses and
extensions. The third section covers the results for research program grants.
A. Baseline OLS Estimates
To provide a baseline for understanding the relationship between NIH funding and future
productivity, Table 2 presents a series of OLS estimates. Columns 1-4 show outcomes for
postdoctoral fellowship while columns 5-8 include outcomes for research grants. For all
outcomes, row 1 shows unconditional estimates and rows 2-4 add in progressively more controls.
Robust standard errors that cluster by researcher are shown in parenthesis beneath the estimates.
Consider first the effect of a postdoctoral fellowship in columns 1-4. The unconditional
estimates reveal a positive association between receipt of the fellowship and subsequent research
productivity. For example, in column 1 we see that individuals who receive a fellowship have
roughly 0.83 publications more in the five years following the grant application compared with
their peers who did not receive a fellowship. Once we control for researcher background

28
characteristics and the application score, the point estimate drops considerably but is still
statistically significant. To judge the relative magnitude of the effect, consider that mean
(standard deviation) of true publications among unsuccessful applicants is 4.56 (4.53). Hence,
the effect of .67 shown in row 4 reflects a .15 standard deviation increase in the number of
publications. Finally, note that the point estimate drops considerably from row 1 to row 2, but
does not change significantly as additional covariates are added. This indicates that postdoctoral
fellowships are awarded almost entirely on the basis of IRG scores, as the formal NIH funding
process intends.
In an effort to identify the relative importance of publications, the second column
presents estimates of citations on fellowship receipt. The unconditional point estimate indicates
that fellowship recipients have nearly 40 more citations in the first five years compared with
unsuccessful applicants. Once one adds controls, however, the point estimate drops to 5 and is
no longer statistically significant.
Column 3 shows the effect of fellowship on this measure of research direction. The
estimate of 0.118 in row 4 suggests that researchers who receive an award from a particular
institute do indeed shift the focus of their research. But how should one interpret the magnitude
of this effect? Given the control group mean of 1.3 for this measure, the point estimate suggests
an effect of 9 percent, meaning that the receipt of a postdoctoral fellowship causes the individual
to publish in journals with a 9 percent larger market share for the awarding institute than
otherwise would be the case.
Column 4 shows the effect of a fellowship on the amount of NIH funding the individual
receives in years 6 to 10 following the grant. While the unconditional estimate of 0.49 in row 1

29
suggests a strong positive association between grant receipt and future funding, once we control
for the individual’s priority score this effect completely disappears.
Next consider the impact of receiving a NIH research grant. In columns 5 and 6, we see
that grant receipt is positively associated with future publications and citations, although the
introduction of a rich set of controls reduces the point estimates by over 50 percent.
Interestingly, the point estimates continue to decline with the inclusion of background
characteristics in rows 3 and 4, even after conditioning for application priority score. This
reflects the greater prevalence of successful resubmissions for R01 awards. More specifically, a
strong applicant with an initially poor priority score is likely to successfully resubmit an
improved application and eventually receive funding than a weak applicant. Column 7 shows
that NIH grant receipt is associated with a larger fraction of one’s publications in journals
relevant to the funding institute. Column 8 demonstrates that individuals who receive an R01
award will, on average, receive $252,000 more NIH funding in years 6 to 10 following the
original grant submission.
B. Instrumental Variable Estimates for Postdoctoral Training Grants (F32s)
The OLS estimates suggest that the receipt of an NIH postdoctoral fellowship increases
publications. However, the selection on observables that is evident in Table 2 raises concern that
selection on unobservable characteristics may also be present, and may bias the estimates. To
address this concern, we calculate instrumental variables (IV) estimates that exploit the plausibly
exogenous variation in grant receipt generated by the nonlinear relationship between priority
score and the likelihood of funding. Specifically, we estimate equations (1) and (2) where our
excluded instrument is a binary indicator for whether the applicant’s score was below the cutoff

30
for funding. As described above, since we also include flexible controls for the priority score,
the identifying variation is generated by the nonlinearity alone. The intuition is that one is
comparing applicants who scored just above the funding cutoff with those who scored just below
the funding cutoff.
Table 3 presents the baseline results. The first column shows the results of the first stage
estimates from equation (2). Controlling for a quadratic function of normalized application
score, applicants who scored below the cutoff were 34 percentage points more likely to receive a
postdoctoral fellowship than their peers who scored above the cutoff. Given that only 19 percent
of applicants above the cutoff received a grant, this represents a relative effect of nearly 200
percent. The failure of some applicants to accept a grant offer and out of order funding combine
to make this number somewhat smaller than it otherwise would be. Nonetheless, the first-stage
F-statistic of our instrument is quite large (roughly 620), suggesting that our estimates do not
suffer from weak instruments bias.
The remaining columns in Table 3 show the second-stage estimates for different outcome
measures. All models include the full set of controls as well as a quadratic in priority score.
Standard errors clustered by applicant are shown in parenthesis below the estimates. For each
outcome, row 3 shows the OLS estimate of receiving a postdoctoral grant, row 4 shows the
corresponding IV estimate and row 5 shows the difference between the OLS and IV estimates.
Because we cluster correct the standard errors at the researcher level, a conventional Hausman
test is inappropriate. Hence, to examine whether the differences between the OLS and IV
estimates are statistically different, we block bootstrap (at the researcher level) the difference
between the OLS and IV estimates and calculate the corresponding standard error.

31
Column 2 shows results for the number of publications. The IV estimates are positive
and significant, indicating that winning an NIH training grant increases productivity by roughly
.86 publications in the first five years. Moreover, there is no significant difference between the
OLS and the IV point estimates. The third column examines an alternative publication measure
that accounts for the fact that a single-author publication may reflect more effort than a
coauthored publication. The normalized publication measure is calculated by dividing each
publication by the total number of authors prior to summing across years. Conditional on the full
set of controls, receipt of a fellowship is associated with a 0.27 increase in normalized
publications.
The IV point estimate for citations is 23, which is modest relative to the adjusted control
group mean of 200 and is statistically insignificant. Column 5 shows the effect of a postdoctoral
fellowship on research direction. The IV estimate for research direction of 0.08 is not
statistically different from the OLS estimate of 0.12, but also not statistically different from zero.
Thus, overall it appears that researchers who receive an NIH postdoctoral fellowship enjoy a
boost in publications over the following five years, and that the fellowship does shift the
direction of their research toward the field of the granting institute. The magnitudes of the
impacts are roughly 20 percent for publications and 7 percent for research direction.
If individuals who receive NIH fellowships are more productive researchers, one might
expect them to have more interest and success in obtaining research funding in the future.
Interestingly, however, the results in columns 6 and 7 provide no support for this hypothesis.
We find no evidence that fellowship receipt leads to greater NIH funding 6 to 10 years following
the award, though the marginally significant point estimate for NSF funding suggests that grant
receipt may increase future NSF funding by a small amount.

32
But do these effects persist? It might be the case that a postdoctoral fellowship provides
recipients a head start, but in the long run those who did not receive the fellowship will catch up.
To explore this, we examined the effect of a fellowship on publications and research direction in
years 6 to 10 following the initial grant application. For the sake of brevity, we do not present all
of the results here, although all estimates are available from the authors upon request. The main
finding is that the initial effects do appear to persist.15
It is also informative to examine binary measures of research productivity in order to
explore whether fellowships have a substantial effect on the extensive vs. intensive margin. This
analysis provides insight into whether an F32 award represents a gateway to a research career, or
simply affects the productivity of individuals who would have enjoyed a research career
regardless. To do so, we estimate the binary choice model discussed earlier, which is outlined in
detail in Appendix C. The results are presented in Table 4. Treating funding status as
exogenous suggest that receiving an F32 fellowship causes grant recipients to cross a number of
career productivity thresholds. These include whether the researcher has any publications, has
more than 5 publications, has more than 50 citations, and received subsequent NIH funding. The
probabilities of crossing these thresholds increase by between 10 and 40 percent of the baseline
rate. Expanding the statistical model to allow funding to be endogenous reduces the statistical
precision of our estimates, though the coefficients and implied marginal effects are quite similar.
Indeed, in no specification can one reject the null hypothesis that grant receipt is exogenous.
15 The IV estimates on the number of publications was large (1.2 publications relative to a baseline of 5.8) but statistically significant at only the ten percent level. The OLS estimate was about half as large but statistically significant. The effect on normalized publications was significantly different than zero for both the OLS and IV specifications. The estimates for research direction are modest and positive, suggesting a 10 to 20 percent shift in the market share of the journals in which recipients publish, although only the OLS estimates were significantly different than zero.

33
C. Instrumental Variable Estimates for Research Grants (R01s)
Table 5 presents the main results for research grants, and follows a format identical to
Table 3. The F-statistic of 315 on our excluded instruments (shown in column 1) indicates
considerable power in the first-stage model. However, in contrast to the estimates for
postdoctoral fellowships, NIH research grants do not appear to have a substantial impact on total
publications or citations. The point estimates of 0.85 and 0.28 in columns 2 and 3 are quite small
relative to their respective means of 14.5 and 4.2 respectively, and are not statistically different
from zero. Similarly, the point estimate for citations of 38 is only 8 percent of the control mean
of 485. It is worth noting that our estimates are relatively precise. For example, the IV
confidence interval for publications ranges from -1.07 to +2.77. This means that we can rule out
positive impacts larger than .18 standard deviations with over 95 percent confidence.
Interestingly, column 4 provides some suggestive evidence that receipt of an NIH
research grant is associated with a modest increase in the number of first-author publications.
The point estimate of 0.60 is marginally significant and modest in size, reflecting a 22 percent
increase relative to the control mean and an effect size of .17 standard deviations.
D. Sensitivity Analysis and Other Extensions
The IV strategy we use in the analysis relies on assumption about the functional form
of the underlying relationship between an individual’s application priority score and his or her
future productivity. Specifically, we assume that in the absence of a NIH grant, the
relationship will be smooth and can be characterized by some type of polynomial. A common
test of this assumption in RD studies is to re-estimate the baseline models using some pre-
treatment measure as an outcome. We know that a NIH grant cannot have a causal impact on

34
publications prior to the award of the grant. Hence, any “effect” we find is an indication that
receipt of the award, even after we condition on a continuous function of the priority score, is
correlated with some unobservable factor that also determines research productivity. Such a
finding would cast doubt on our identification strategy.
Table 6 presents IV estimates of NIH grants on a variety of “pre-treatment”
characteristics, including prior publications and funding.16 Note that these models include a
quadratic in the priority score along with institute and year fixed effects, but none of the other
covariates that are included in the earlier models (since these variables are the outcomes in this
analysis). In order to account for the fact that many of these pre-treatment measures are
correlated within researcher, we estimate a Seemingly Unrelated Regression (SUR) that allows
us to test the joint significance of the treatment effects that takes this correlation into
account.17 For postdoctoral fellowships, there is no indication that our instruments are
associated with pre-treatment productivity or researcher demographics. For research program
grants, the evidence is somewhat less definitive. The p-value on the joint test of all 24 pre-
treatment measures is .17. However, if we focus specifically on the measures of pre-treatment
productivity, we see that researchers who were awarded a grant because they scored just
below the cutoff had lower productivity prior to the grant application. For example, R01 grant
recipients had 5.5 few publications in the 10 years prior to the grant application compared with
their comparable peers.
16 For the F-sample, the pre-treatment productivity measures reflect years 1-5 prior to the grant application. For the R-sample, these measures reflect years 1-10 prior the grant application. 17 The coefficients presented in Table 6 reflect IV estimates of each pre-treatment characteristic. However, the F-stats and p-values shown at the bottom of the table come from a reduced form estimate, and thus test the joint significance of the instruments on the pre-treatment measures, taking into account the correlation among pre-treatment measures within individual.

35
These results suggest that the nonlinear measure of priority score that we are using as
an instrument may be negatively correlated with observables that influence future
productivity. In this case, one should view the IV estimates presented above as lower bounds
on any positive impacts of NIH grant receipt. As noted earlier, the results in Table 2 suggest
that the OLS estimates are likely biased upward. Hence, together the OLS and IV estimates
provide likely bounds to the causal impact of grant receipt. Given that the magnitude of the
OLS estimates are at best modest and quite small in many cases, the sensitivity analyses
presented here do not change the overall interpretation of the findings. It still appears that
NIH grants have at most a small positive impact on future productivity.
Table 7 shows a series of additional sensitivity analyses. The first row reproduces the
IV estimates from the baseline model. Row 2 presents IV estimates with no covariates other
than institute and year fixed effects and a quadratic in the priority score. Rows 3 and 4
replicate the analysis using narrower and wider ranges of priority scores. Rows 5-7 show the
results with linear, cubic and quartic terms in the rating variable instead of the baseline
quadratic term. Finally, the specifications in rows 8 and 9 allow the relationship between
priority score and future productivity to have a different functional form on either side of the
cutoff. Overall, the results suggest that our estimates are robust to a variety of changes in
sample and specification, though increasing the flexibility of controls for normalized
application score substantially increase the standard error of the estimates.
Table 8 examines the impact of NIH grants on different subgroups. Due to the lack of
precision associated of the IV estimates, we focus on the OLS results. While the number of
comparisons suggests that one should be cautious in interpreting any differences, several
interesting patterns emerge. First, R01 grants appear have a larger impact on the productivity

36
of researchers under the age of 45 compared with older researchers. Second, there is evidence
that NIH grants may impact men and women differently, although the evidence is somewhat
mixed. On one hand, receipt of an NIH grant appears to have a bigger impact on the
publications and citations of male researchers. On the other hand, grant receipt has a larger
impact on future NIH funding for women. Finally, there are some interesting differences
across discipline and grant type. Postdoctoral fellowships have a significantly greater impact
on researchers in the social sciences than those in either the biological or physical sciences in
terms of publications and citations. The opposite is true for research grants. Receipt of an NIH
grant has a significantly larger impact for researchers in the biological sciences than those in
the physical or social sciences. One explanation for this difference is that postdocs are more
likely to push young social scientists into a research career than is the case for those in the
natural sciences. At the same time, it seems likely that grant support is a more important input
to research in the natural sciences, which often require lab equipment and other expensive
capital investments.
VII. Discussion
The results above suggest that NIH postdoctoral fellowships result in significant
relative increases in research productivity. At least part of this effect operates through the
extensive margin by inducing participation in research that would otherwise not have
occurred. In contrast, we find that standard NIH research grants have at most a relatively
small effect on the research productivity of the marginal applicants. In this section, we
describe an economic model of research funding and production that is consistent with these
findings. Our goal is not to provide a definitive explanation of the findings, but rather to
highlight alternative explanations of our findings.

37
The basic notion is that, under certain conditions, NIH funding will displace other
sources of funding. There are several ways in which unsuccessful researchers might obtain
funding to continue their research: (1) they might obtain funding from another source, such as
the NSF, a private foundation or their home institution; (2) they might collaborate with
another researcher who was successful at obtaining NIH funding; or (3) they might collaborate
with another researcher who was successful at obtaining non-NIH funding.
In order to understand the conditions under which this is likely to occur, consider a
market for research in which researchers supply time and expertise and funders supply financial
resources. We will loosely define the market as competitive if it has the following
characteristics: (1) there are a large number of researchers and a large number of funders; (2)
money is a productive input in the research process, though with a diminishing marginal product;
(3) researcher ability and money from outside sources are common knowledge; (4) funders have
a common objective, such as allocating funds to researchers with the highest marginal
productivity.18 An equilibrium in this market is defined by an allocation of money to researchers
such that the marginal productivity of money is the same for all funded researchers and the total
supply of funding available for grants equals the total amount of money received by all
researchers. In this case, a researcher who does not get funding from a particular agency will
receive compensating funds from another agency.
On the other hand, if funding agencies vary idiosyncratically in their objectives or posses
different information, each funding agency will possess some market power with regard to the
supply of funding. For example, the NIH may be particularly interested in particular subfields
which are of only limited interest to other funding organizations, or NIH may have a special
18 The implications are similar if all funding agencies pursue some other common objective. For example, agencies might allocate grants to researchers with the highest average productivity of money. Such an objective function would be consistent with funding agencies wanting to take credit for the largest amount of research output possible.

38
mandate to award grants to individuals of underrepresented groups. Alternatively, funding
agencies may have idiosyncratic knowledge regarding the quality of a particular applicant. In
such cases, the NIH may award grants to researchers with relatively poor outside options so that
crowd-out is incomplete.
In the context of this framework, a positive impact of NIH funding implies that there is a
positive marginal impact of funding on productivity and that NIH funding does not completely
displace other funding sources (i.e., there is imperfect competition in the market for research
funding). Conversely, observing an impact of NIH training close to zero is consistent with a
competitive market for research funding and/or a zero marginal impact of funding. In other
words, one would expect that the causal impact of receiving a particular grant on subsequent
research to be quite small, even if the marginal impact of funding were positive.
Even if the existence of displacement limits the causal effect of receiving an NIH grant
by a particular researcher, the social benefits of such funding are likely to be much larger. In
particular, the existence of the NIH increases the total number of research opportunities. These
benefits can only be understood and estimated, however, in the context of a general equilibrium
framework.
Testing the Displacement Hypothesis
As noted above, there are several reasons why one might not expect to find an impact of
NIH grants on research productivity. One possibility is that NIH funding could displace funding
from other public agencies or private entities, either because the researcher is less inclined to
apply for such funding if she has already received an NIH award or because other funding
agencies correctly perceive the marginal utility of an additional dollar to a funded researcher is

39
less valuable than an additional dollar to an unfunded researcher. Indeed, Table 5 presents
evidence of such displacement in the short-run. In column 8, we see that receipt of an NIH
research grant reduces NSF funding by roughly $22,000 in the five years following the NIH
grant application. Considering that the average R01 grant is roughly $1.7 million, the magnitude
of this displacement is quite small. However, it is important to note that this is likely a lower
bound on overall displacement since it only captures one of many potential funding sources.
While a grant from the NIH displaces other funding in the short run, column 7 suggests that it
might increase NIH funding in the longer run. Successful applicants receive $649,000 more NIH
funding in years 6-10 following their initial NIH grant compared with unsuccessful applicants.
In order to explore how receipt of NIH funding impacts other sources of funding, we
collected more complete funding information for a sub-sample of researchers in our data. We
randomly selected 500 researchers in the General Medicine, Heart, Lung, and Blood, and Cancer
Institutes and then randomly selected two publications from each researcher published between
three and five years after the grant application.19 For each article, we obtained funding
information from the acknowledgements sections in the articles. We recorded each of the
different grants listed for each of the authors along with funding information that referred to the
article or project as a whole rather than to any individual researcher. Finally, we noted
acknowledgements of in-kind and/or technical support (e.g., loan of a laser, or use of lab space or
a specific bacterial strain).20
19 These institutes were chosen because (a) they are the three largest institutes within NIH and (b) publications from these institutes are likely to be listed in PubMed, which facilitated data collection. The number of observations in the estimation sample (n=517) is larger than 500 because several researchers had applied for multiple grants. 20 One might be concerned that our sample is, by construction, limited to those researchers with publications. However, over 80 percent of R01 applicants have at least two publications during the sample period (i.e., 3-5 years after the grant application).

40
In total, we were able to locate 84 percent of the articles listed in our sample. Of the
articles we were able to locate, 83 percent reported some funding and the average (standard
deviation) number of different funding sources among this group is 2.9 (1.6).21 On average, the
sampled articles listed 2.45 sources of funding, with about 30 percent of articles listing at least
three different sources of funding. Roughly 67 percent of articles acknowledged NIH support
and 56 percent of articles acknowledged support from a non-NIH source.
It is important to note that most papers have multiple (and in some cases many) funding
sources, which will limit the scope of any single grant to make or break a promising project.
Presumably, if one researcher fails to receive a grant, his or her coauthors would be willing to
pay a larger fraction of research expenses from their own grants. Even in cases where no
individual lists a grant, they may be able to obtain material assistance that allows the research to
proceed.
In Table 9 we further explore how NIH grant receipt impacts the number and type of
funding sources listed on the researcher’s publications.22 Due to the limited sample size, the
IV estimates are extremely imprecise so we present OLS estimates of the impact of winning
an NIH grant on a variety of funding source outcomes. Following the specifications found in
row 4 of Table 2, these models include the full set of demographic variables and pre-treatment
productivity measures.
While published papers of unsuccessful applicants are less likely to be funded by the
NIH (columns 1 and 2), they are no less likely to have at least one funding source (column
21 Note that this is conservative since it is possible that some articles with missing acknowledgements actually were funded. 22 The dependent variables in this table include any funding source listed in the acknowledgements, regardless of whether it is associated with a particular author, or with the article as a whole. We do not examine grants associated with specific authors since we are concerned that acknowledgement conventions may vary, and some authors may list their own grants as funding the article or research project without specifically identifying themselves as the grant recipient.

41
5).23 Furthermore, the difference in the total number of funding sources between grant
winners and losers is not statistically significant (column 6). This is consistent with the
hypothesis that high value projects are funded regardless of the success of any particular grant.
These results suggest that researchers are insured by coauthors, smaller funding
agencies or their own institutions against the possibility that their most productive research
projects are not funded. Of course NIH grant receipt does appear to be correlated with a small
relative increase in publication rates. It is likely that the loss of an NIH grant makes it difficult
for a researcher to engage in marginal projects that have been unable to attract funded
coauthors.
VIII. Conclusion
In this paper, we utilize a regression discontinuity design to estimate the causal impact
of NIH funding on scientific output. We find that NIH postdoctoral fellowships increase
research publications and citations by about 20 percent in the five years following grant
application. In contrast, we find that NIH research grants have at most a small relative effect
on the research productivity of the marginal applicants. We show that these null results are
consistent with a model in which the market for research funding is competitive so that the
loss of an NIH grant simply causes researchers to tap other funding sources more intensively.
Of course, if overall funding is in fixed supply, NIH research support may increase the
amount of R&D in the aggregate without having an impact on the marginal applicant. In
23 The point estimate suggests that being successfully awarded an NIH grant is associated with 0.33 additional NIH sources listed in the publication. This may be less than one for a number of reasons. First, it may be that NIH funding sources are not always listed. Second, the published work may have been performed prior to grant receipt. Third, receipt of an NIH grant may displace another such grant. Finally, funding from a particular grant may not have been used on any given project. Note that if researchers do not use NIH funding for all research projects they are working on, we may not expect receipt of one particular grant to be critical for an individual’s entire research effort.
42
addition, our estimates will not capture any spillover benefits of research funding, nor will they
capture what some have referred to as the transformational impact of R&D expenditures – i.e.,
the notion that public support for science may change the nature of the research infrastructure
which, in turn, may have a much more dramatic impact on future productivity (see, for example,
Jaffe 1998, 2002 and Popper 1999).
This analysis presents the first step toward examining the effectiveness of government
expenditures in R&D. Given the importance of technological innovation for economic growth
and the considerable public resources devoted to R&D, further research is clearly warranted. In
future work, we plan to explore the impact of NIH funding on patents, which may be a more
useful measure of societal value.

43
References Angrist, J. D. and V. Lavy (1999). “Using Maimonides Rule to Estimate the Effect of Class Size on Scholastic Achievement.” Quarterly Journal of Economics 114(2): 535-75. Arora, A., and Gambardella, A. (1998). “The Impact of NSF Support for Basic Research in Economics.” Working paper, Carnegie-Mellon University. Averch, H. A. (1987). “Measuring the Cost-Efficiency of Basic Research: Input-Output Approaches.” Journal of Policy Analysis and Management, 6: 342-362. Averch, H. A. (1988). “Exploring the Cost-Efficiency of Basic Research Funding in Chemistry.” Research Policy, 18: 165-172. Berk, R. A. and D. Rauma (1983). “Capitalizing on Nonrandom Assignment to Treatments: A Regression-Discontinuity Evaluation of a Crime-Control Program.” Journal of the American Statistical Association 78(381): 21-28. Black, S. (1999) “Do Better Schools Matter? Parental Valuation of Elementary Education.” Quarterly Journal of Economics 114: 577-599. Paul Bourke, Linda Butler and Beverley Biglia (1999). “A Bibliometric Analysis of Biological Sciences Research in Australia.” Research Evaluation and Policy Project, Research School of Social Sciences, The Australian National University, June 1999 Boyack, Kevin W. and Borner, Katy (2002). “Indicator-Assisted Evaluation and Funding of Research: Visualizing the influence of Grants on the Number and Citation Counts of Research Papers.” Special Issue of the Journal of the American Society for Information Science and Technology. Carter, Grace M., Winkler, John D., and Andrea K. Biddle (1987). “An Evaluation of the NIH Research Career Development Award.” RAND Corporation Report. R-3568-NIH. Cockburn, Iain M. and Rebecca Henderson (1996). “Scale, Scope, and Spillovers: the Determinants of Research Productivity in Drug Discovery”, RAND Journal of Economics, 27(1): 32-59. Cockburn, Iain M. and Rebecca Henderson (1997). “Public-Private Interaction and the Productivity of Pharmaceutical Research,” National Bureau of Economic Research, Working Paper 6018. Cole, S., Rubin, L. and Cole, J. R. (1977). “Peer Reviews and the Support of Science.” Scientific American. 237(4): 30-42.

44
David, Paul A., Hall, Bronwyn H., and Toole, Andrew A (2000). “Is Public R&D a complement or substitute for private R&D? A review of the econometric evidence.” Research Policy 29, 497-529. Godin, Benoit (1996). “The Impact of Research Grants on the Productivity and Quality of Scientific Research.” Working paper. INRS. (Institut National de la Recherche Scientifique), Montreal, Quebec. Goolsbee, Austan, “Does Government R&D Policy Mainly Benefit Scientists and Engineers?” American Economic Review, vol. 88, no. 2, May 1998, pp. 298-302. Gordon, Michael E. and Julia E. Purvis (1991). “Journal Publication Records as a Measure of Research Performance in Industrial Relations.” Industrial and Labor Relations Review, 45(1): 194-201. Griliches, Zvi (1994). “Productivity, R&D, and the Data Constraint,” American Economic Review, 84(1): 1-23 Hall, Browyn Hughes, Adam B. Jaffe, and Manuel Tratjenberg (2001). “The NBER Patent Citation Data File: Lessons, Insights and Methodological Tools.” NBER Working Paper 8498. Hall, Bronwyn Hughes. and Van Reenan, John. (2000). “How Effective are Fiscal Incentives for R&D?” Resarch Policy. 29: 449-469. Hahn, Jinyong, Todd, Petra and Wilbert Van der Klaauw (2001). ‘‘Identification of Treatment Effects by Regression-Discontinuity Design.’’ Econometrica. 201-209. Jacob, B. and Lefgren, L. (2004). Remedial Education and Student Achievement: A Regression-Discontinuity Analysis.” Review of Economics and Statistics. LXXXVI (1): 226-244. Jacob, B. and Lefgren, L. (2004). “The Impact of Teacher Training on Student Achievement: Quasi-Experimental Evidence from School Reform Efforts in Chicago.” Journal of Human Resources. 39(1) : 50-79. Jaffe, Adam B. (2002). “Building Programme Evaluation into the Design of Public Research-Support Programmes.” Oxford Review of Economic Policy. 18: 22-34. Johnes, Geraint (1990). “Measures of Research Output: University Departments of Economics in the UK, 1984-88.” The Economic Journal, 100(401): 556-560. Klette, Tor Jakob, Moen, Jarle and Griliches, Zvi (2000). “Do subsidies to commercial R&D reduce market failures? Microeconomic evaluation studies.” Research Policy 29, 471-495. Lerner, Josh (1999). “The government as venture capitalist: The long-run impact of the SIBR program.” Journal of Business. 72(3): 285-318.

45
Pion, Georgine M. (2001). “The Early Career Progress of NRSA Predoctoral Trainees and Fellows.” NIH Publication Number 00-4900. Stephan, Paula (1996). “The Economics of Science.” Journal of Economic Literature, XXXIV, 1199-1235. Toole, Andrew (2000). “The Impact of Public Basic Research on Industrial Innovation: Evidence from the Pharmaceutical Industry.” The Stanford Institute for Economic Research Discussion Paper No. 00-07 Thistlewaite, D. and D. Campbell (1960). “Regression-Discontinuity Analysis: An Alternative to the Ex-Post Facto Experiment.” Journal of Educational Psychology 51: 309-317. Trochim, W. (1984). Research Design for Program Evaluation: The Regression-Discontinuity Approach. Beverley Hills, CA, Sage Publications. Ward & Dranove (1995). "The Vertical chain of R&D in the pharma industry." Economic Inquiry. 33, 1-18.

46
APPENDIX A MATCHING NIH APPLICANTS TO OUTCOME DATA
Matching to NSF Grant Data
We first matched NIH applicants to NSF grant recipients on the basis of first and last
name. We then manually reviewed the matches to determine the incidence of likely false
positives and whether excluded matches on the basis of any observable criteria would reduce the
rate of false positives without significantly reducing the rate of true positives. Based on this
preliminary analysis, we instituted a procedure whereby we excluded any match that met one or
more of the three criterion: (1) the NSF grant start date occurred before the researcher’s 20th
birthday, (2) the middle initial on the NIH and NSF files did not match (assuming that there were
middle initials listed in both files), and (3) the NSF grant was in any one of the following
directorates: Computer and Information Science and Engineering, Education and Human
Resources, Geosciences, Office of Information and Resource Management, Mathematics and
Physical Sciences (except the Chemistry division), Engineering (except the division titled Design
and Manufacturing Innovation), In short, we included grants from the Social, Behavioral and
Economic Sciences, the Office of International Science and Engineering, and the Biological
Sciences. After excluding matches on the basis of the criterion above, we randomly sampled a
new set of matches and manually checked them, finding that fewer than 2 percent of matches
were likely false positives.

47
Matching to Publication and Citation Data
In this study, we rely on publication and citation counts as our primary outcome
measures. Like all studies that utilize bibliometric data, our primary challenge is reliability
matching NIH applicants to their publication and citation records. We rely on ISI’s Web of
Science (WOS), an electronic database that catalogues publications for thousands of journals in
the natural and social sciences dating back to the 1950s. While the WOS contains detailed
information on each article published, it only provides the authors’ last name and first and
middle initial. In the past, researchers have often relied on surveys or extremely time consuming
manual matching techniques that generally yield low response rates and/or unreliable matches.
The primary consequence of unreliable matches is that the dependent variable may
contain considerable measurement error. Note that this measurement error is not classical. To
the extent that one relies on last name and first initial alone to match applicants to publications,
one is more likely to obtain false positives than false negatives. Nonetheless, to the extent that
this measurement error is uncorrelated with the variable of interest, the impact estimates will
remain consistent. In our case, since we are using the discontinuous relationship between
priority score and funding to identify the impact of funding, there is no reason to believe that the
measurement error will bias our results. That is, there is no reason to believe that applicants just
above the cutoff are any more or less likely to have bad matches than applicants who score just
below the cutoff. The presence of measurement error in the dependent variable, however, will
reduce the statistical power of the analysis.
Consequently, we take several approaches to reduce the prevalence of bad matches.
First, we focus only on journal articles (as opposed to letters, comments, notes, book reviews,
etc.) published in English language periodicals. More importantly, we restrict our analysis to a

48
sample of journals in fields in which the NIH grant applicants are likely to publish. For example,
we include journals such as Science, the American Economic Review and Gerontology, but
exclude all humanities journals and journals in fields such as aeronautical engineering,
mathematics and physics. Consider, for example, an individual who applies to the Institute for
Heart, Lung and Blood for a research grant. If, among the set of publications for this individual,
one finds an article published in the American Historical Review, these publications are likely to
be mistakes and are thus excluded. Given that the WOS catalogues over 15,000 journals, it is
impractical to make such distinctions on the basis of an individual journal. However, the WOS
categorizes journals into several hundred different fields. Each journal may be listed under one
or more fields. For example, the journal Alcohol is listed under the categories Pharmacology &
Pharmacy, Substantive Abuse and Toxicology. We determine a list of fields in which a NIH
funded researcher might publish, and if a journal that matches to an individual in our sample
appears in any of these fields, we will consider it a valid match. We also confirmed that our
results are not sensitive to a variety of plausible alternative field restrictions.
While this strategy will eliminate many incorrect matches, it is possible that it eliminates
some valid matches as well. This would be the case for articles published in less well-known or
less popular journals. Note, however, that this will not affect the internal consistency of our
estimates, but will simply change the interpretation of the effects. With these field/category
restrictions in place, our estimates should be interpreted as the impact of NIH funding on
publication in the more common journals in a particular discipline.

49
APPENDIX B USING UNCOMMON NAMES TO REDUCE MEASUREMENT ERROR
We use a measure of name frequency derived from the NIH database – namely, the
number of different individuals with a particular last name who applied for NIH funding (to any
institute and for any type of grant) at any time between 1980 and 2002. We use this measure
instead of name frequency based on the U.S. Census because it is likely that NIH researchers
differ from the U.S. population in ways that may be related to name frequency (e.g. researchers
are more likely to be of Asian descent than the average person in the U.S.). The three most
common last names in our sample are Smith, Johnson, and Miller. There were 1662 different
individuals with the last name of Smith who applied for NIH funding over this period, and 1320
and 1124 with the last names of Johnson and Miller respectively. In contrast, there were 69,382
individuals with unique last names in the sample. In each of these cases, there was only one
individual with the particular last name that applied for NIH funding over this 22-year period.
Several examples include Abass, Baatz, and Sabir.
In order to determine the effectiveness of this uncommon names approach, we conducted
a manual publication search for a small set of recent NIH grant recipients with uncommon
names. We then compared the “true” number of publications we found with the number
obtained using a last name-first initial match on the WOS. Table B1 presents the results.
Among individuals with the least common names (i.e., name frequency 1), roughly 5 percent of
individuals had at least one bad match and the average number of bad matches was roughly 4.
The number of false positives increases with name frequency, as one would expect. Based on
this analysis, we will limit our sample to individuals with name frequencies 10 or lower.

50
In order to assess the external validity of estimates on a sample of researchers with
uncommon names, Table B2 presents descriptive statistics on the sample of applicants with
common versus uncommon names. Overall, the two groups look quite similar. While there are
statistically significant differences between the two groups along a number of dimensions, the
magnitude of these differences is generally very small. For example, applicants with common
names were awarded a grant 32.2 percent of the time in comparison to 31.7 percent of the time
for applicants with uncommon names. Perhaps the most noticeable difference between the two
groups involves the fraction with MDs versus PhDs. Roughly 59 percent of applicants with
common names had a PhD compared with approximately 53 percent of applicants with
uncommon names. Conversely, 53 percent of applicants with uncommon names had an MD
compared with only 51 percent of those with a common name.

51
APPENDIX C ESTIMATING MODELS WITH BINARY OUTCOMES IN THE PRESENCE OF NON-
CLASSICAL MEASUREMENT ERROR
Examining continuous productivity measures is very helpful for understanding the
average research impact of receiving an F32 award. It is also interesting, however, to know how
receiving an F32 award increases the probability that a researcher surpasses a particular
threshold of productivity. This sheds insight into whether F32 awards represent a gateway to a
research career or simply affect the productivity of individuals who would have enjoyed a
research career regardless. This is complicated, however, by measurement error in publication
rates. For example, suppose we want to examine how receiving an F32 grant affects the
probability that a researcher has at least one publication. This threshold could be met because
the researcher actually has at least one publication, the researcher has at least one false match, or
both. Because the measurement error is not additive, estimation of a linear model will not yield
consistent estimates as is the case in our other specifications.
To overcome this challenge, we model the probability of observing a particular
realization given that if a researcher crosses a threshold it could have occurred either because of
actual productivity or measurement error.24 Assuming that a latent index of productivity is a
linear function of funding status, a set of control variables, and a normally distributed residual,
the probability that actual productivity exceeds a particular threshold can be written:
( )it itfunding XβΦ + Β . We model the latent index of false productivity as a linear function of
variables indicating last name commonness, iW and a normally distributed residual. Thus the
probability that false productivity surpasses the threshold can be written: ( )iWΦ Π . Given these
24 In cases where the threshold is greater than one, it is possible that the threshold was exceeded due to a combination of actual and false matches. This greatly complicates the modeling of the threshold effects. For simplicity, we abstract from this possibility and assume that the threshold is met only with true matches, only with false matches, or that both the false and true matches were sufficiently high to surpass the threshold.
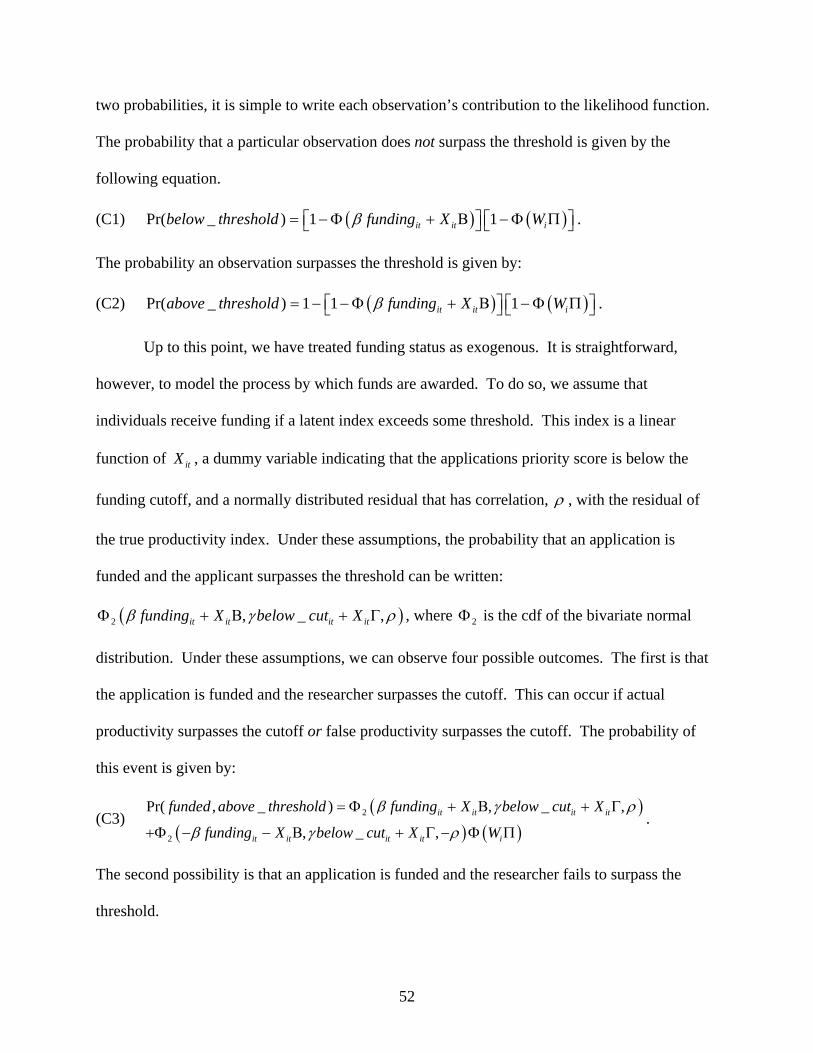
52
two probabilities, it is simple to write each observation’s contribution to the likelihood function.
The probability that a particular observation does not surpass the threshold is given by the
following equation.
(C1) ( ) ( )Pr( _ ) 1 1it it ibelow threshold funding X Wβ= ⎡ − Φ + Β ⎤ ⎡ − Φ Π ⎤⎣ ⎦ ⎣ ⎦ .
The probability an observation surpasses the threshold is given by:
(C2) ( ) ( )Pr( _ ) 1 1 1it it iabove threshold funding X Wβ= − ⎡ − Φ + Β ⎤ ⎡ − Φ Π ⎤⎣ ⎦ ⎣ ⎦ .
Up to this point, we have treated funding status as exogenous. It is straightforward,
however, to model the process by which funds are awarded. To do so, we assume that
individuals receive funding if a latent index exceeds some threshold. This index is a linear
function of itX , a dummy variable indicating that the applications priority score is below the
funding cutoff, and a normally distributed residual that has correlation, ρ , with the residual of
the true productivity index. Under these assumptions, the probability that an application is
funded and the applicant surpasses the threshold can be written:
( )2 , _ ,it it it itfunding X below cut Xβ γ ρΦ + Β + Γ , where 2Φ is the cdf of the bivariate normal
distribution. Under these assumptions, we can observe four possible outcomes. The first is that
the application is funded and the researcher surpasses the cutoff. This can occur if actual
productivity surpasses the cutoff or false productivity surpasses the cutoff. The probability of
this event is given by:
(C3) ( )
( ) ( )2
2
Pr( , _ ) , _ ,
, _ ,it it it it
it it it it i
funded above threshold funding X below cut X
funding X below cut X W
β γ ρ
β γ ρ
= Φ + Β + Γ
+Φ − − Β + Γ − Φ Π.
The second possibility is that an application is funded and the researcher fails to surpass the
threshold.

53
(C4) ( ) ( )2
Pr( , _ ), _ ,it it it it i
funded below thresholdfunding X below cut X Wβ γ ρ
=
Φ − − Β + Γ − Φ − Π.
The third possibility is that an application is not funded yet the researcher surpasses the cutoff.
(C5) ( )( ) ( )
2
2
Pr( _ , _ ) , _ ,
, _ ,it it it it
it it it it i
not funded above threshold funding X below cut X
funding X below cut X W
β γ ρ
β γ ρ
= Φ + Β − − Γ −
+Φ − − Β − − Γ Φ Π
The final possibility is that an application is not funded and the researcher fails to surpass the
threshold.
(C6) ( ) ( )2
Pr( _ , _ ), _ ,it it it it i
not funded below thresholdfunding X below cut X Wβ γ ρ
=
Φ − − Β − − Γ Φ − Π.
These probabilities generate the likelihood function we use to estimate the impact of funding on
the probability of surpassing the threshold—taking into account the possible endogeneity of
funding.
In addition to publication measures of productivity, we also examine the impact of an
F32 grant on the probability that an individual receives any subsequent NIH funding. In these
specifications, there is no measurement error. We therefore perform estimation using a probit
specification. To allow for potentially endogenous funding we also perform bivariate probit
analyses in which we estimate the joint probability of funding and surpassing the threshold.

54
TABLE B1 TEST OF MATCH QUALITY FOR UNCOMMON NAMES
Name Frequency
Number of
researchers
Fraction of researchers
with false hits (measure 1)
Fraction of researchers
with false hits (measure 2)
Average number of
false hits per researcher
(among those with at least one false hit) (measure 1)
Average number of
false hits per researcher
(among those with at least one false hit) (measure 2)
1 916 0.04 0.06 4.19 3.61 2 379 0.07 0.11 2.85 2.54 3 212 0.10 0.12 4.14 3.88 4 133 0.16 0.19 5.05 5.20 5 140 0.20 0.26 3.61 3.42 6 108 0.20 0.29 4.91 4.16 7 91 0.14 0.26 6.38 5.13 8 82 0.22 0.28 4.06 3.70 9 67 0.28 0.36 5.16 4.96 10 54 0.43 0.54 4.04 4.97
Notes: Sample includes recipients of F32 grants between 1999 and 2003 and any associated publications between 1987 and 1989. Measure 1 counts as a false hit any publication that we obtained through an ISI search that was definitively verified as not having been published by the researcher in question. Measure 2 counts as a false hit any publication that we obtained through an ISI search that could not be definitively excluded, but may in fact still be a false hit.

55
TABLE B2 ARE APPLICANTS WITH UNCOMMON NAMES SIMILAR TO APPLICANTS WITH
MORE COMMON NAMES?
Number of unique individuals with the name who applied for NIH for funding
between 1980-2000
1-10 11+ Diff:
Freq 1-10 – Freq 11+
Application characteristics
Normalized priority score 175.31 171.80 3.51** (1.05)
Awarded grant 0.317 0.322 -0.005** (0.002)
Ever awarded grant 0.469 0.474 -0.004** (0.002)
Researcher characteristics
Year of application 1990.41 1990.28 0.13** (0.02)
Age 45.87 45.81 0.06* (0.03)
Female 0.177 0.184 -0.007** (0.001)
Has MD degree 0.335 0.318 0.017** (0.002)
Has PhD degree 0.534 0.592 -0.059** (0.002)
In other department 0.042 0.043 -0.002** (0.001)
In physical science department 0.063 0.064 -0.000 (0.001)
In social science department 0.058 0.062 -0.005** (0.001)
In biological science department 0.837 0.830 0.007**
(0.001)
In university 0.829 0.836 -0.007** (0.001)
In research institute 0.079 0.075 0.004** (0.001)
In hospital 0.076 0.072 0.004** (0.001)
Rank of graduate institution 121.24 126.93 -5.69** (1.60)
Rank of current institution 84.42 84.36 0.07 (0.37)

56
NIH funding in years t-1 to t-5 /$100,000 4.64 4.69 -0.05
(0.04) Received any NIH funding in years t-1 to t-5 0.718 0.732 -0.014**
(0.002) Funding Outcomes
(Exclusive of Reference Grant)
NIH funding in years t+1 to t+5 /$100,000 7.03 7.00 0.03
(0.06) Received any NIH funding in years t+1 to t+5 0.621 0.627 -0.007**
(0.002) NIH funding in years t+6 to t+10 /$100,000 7.65 7.66 -0.01
(0.07) Received any NIH funding in years t+6 to t+10 0.489 0.494 -0.006**
(0.002) Notes: The standard error of the difference is in parentheses. ** indicates statistical significance at the 5 percent level. The sample includes all R01 applications in fiscal years 1981 to 2000 with non missing priority scores.
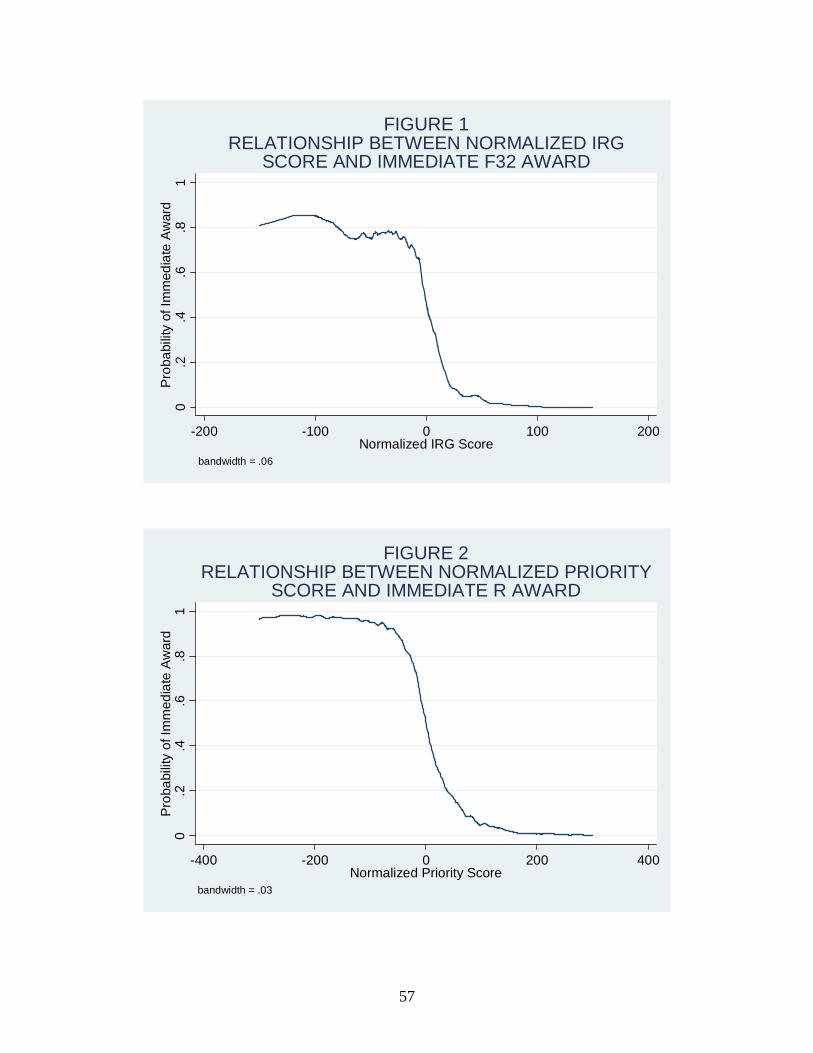
57
0.2
.4.6
.81
Pro
babi
lity
of Im
med
iate
Aw
ard
-200 -100 0 100 200Normalized IRG Score
bandwidth = .06
FIGURE 1RELATIONSHIP BETWEEN NORMALIZED IRG
SCORE AND IMMEDIATE F32 AWARD
0.2
.4.6
.81
Pro
babi
lity
of Im
med
iate
Aw
ard
-400 -200 0 200 400Normalized Priority Score
bandwidth = .03
FIGURE 2RELATIONSHIP BETWEEN NORMALIZED PRIORITY
SCORE AND IMMEDIATE R AWARD

58
0.2
.4.6
.81
Pro
babi
lity
of E
vent
ual A
war
d
-200 -100 0 100 200Normalized IRG Score
bandwidth = .06
FIGURE 3RELATIONSHIP BETWEEN NORMALIZED IRG
SCORE AND EVENTUAL F32 AWARD
0.2
.4.6
.81
Pro
babi
lity
of E
vent
ual A
war
d
-400 -200 0 200 400Normalized Priority Score
bandwidth = .03
FIGURE 4RELATIONSHIP BETWEEN NORMALIZED PRIORITY
SCORE AND EVENTUAL R AWARD

59
TABLE 1 SUMMARY STATISTICS
Postdoctoral Fellowships
(F32) (n=13,462)
Research Grants (R01s)
(n=54,742) Application Characteristics Mean SD Mean SD
Normalized score -1.303 46.121 0.813 115.26 Awarded 0.459 0.498 0.508 0.5 Ever awarded 0.505 0.500 0.718 0.45 Institute AA (Alcohol) 0.000 0.000 0.011 0.102 AG (Aging) 0.014 0.119 0.028 0.164 AI (Allergies and Infectious Diseases) 0.100 0.300 0.090 0.286 AM (Arthritis) 0.027 0.163 0.030 0.170 AR (Arthritis) 0.017 0.131 0.029 0.168 CA (Cancer) 0.103 0.305 0.154 0.361 DA (Drug Abuse) 0.011 0.103 0.016 0.126 DC (Deafness) 0.010 0.101 0.008 0.088 DE (Dental) 0.011 0.103 0.013 0.114 DK (Diabetes and Kidney) 0.056 0.23 0.078 0.269 ES (Environmental Health) 0.017 0.128 0.017 0.129 EY (Eyes) 0.038 0.192 0.035 0.183 GM (General Medicine) 0.292 0.454 0.160 0.366 HD (Child Health and Development) 0.059 0.235 0.069 0.253 HL (Heart, Lung and Blood) 0.102 0.302 0.132 0.338 HS (Agency for Health Care Policy and Research) 0.000 0.000 0.002 0.040 MH (Mental Health) 0.038 0.192 0.044 0.205 NS (Neurological Disorders) 0.105 0.306 0.086 0.281
Applicant’s Background Female 0.382 0.486 0.177 0.381 Age 31.944 3.903 45.817 8.370 Married 0.493 0.5 0.629 0.483 Divorced 0.281 0.45 0.353 0.478 Number of Dependents 0.272 0.445 0.480 0.500 Name frequency 2.122 2.574 2.220 2.531 Has PhD 0.766 0.423 0.542 0.498 Has MD 0.188 0.39 0.338 0.473 Has PhD & MD 0.048 0.214 0.079 0.270 Rank of graduate institution in terms of NIH funding 129.368 288.927 114.368 271.793
Rank of current Institution in terms of NIH funding 68.725 93.944 78.963 91.253 Region of current institution - East -- -- 0.338 0.473 Region of current institution - South -- -- 0.230 0.421 Region of current institution - West -- -- 0.203 0.402 Region of current institution - Midwest -- -- 0.214 0.410 Organization Research institute 0.109 0.312 0.083 0.275 Hospital 0.062 0.242 0.078 0.268 College or university 0.822 0.383 0.826 0.380 Medical or dental school 0.569 0.495 0.669 0.471 Arts and Sciences 0.298 0.458 0.186 0.389 School of public health 0.009 0.092 0.017 0.130 Hospital 0.003 0.056 0.009 0.097

60
Institute 0.018 0.131 0.017 0.128 Other 0.103 0.305 0.102 0.303 Department Biological sciences department 0.822 0.383 0.845 0.361 Physical sciences department 0.092 0.289 0.064 0.245 Social sciences department 0.037 0.189 0.055 0.228 Other department 0.049 0.215 0.035 0.184
Productivity Measures Years 1-5 prior to the application
Any NIH funding 0.018 0.131 0.781 0.413 Amount of NIH funding (/$100,000) 0.284 0.699 7.436 11.429 Any publications 0.768 0.422 0.911 0.284 Number of publications 3.539 2.245 16.427 13.209
Years 1-5 following the application Any NIH funding 0.228 0.420 0.716 0.451 Amount of NIH funding ($/100,000) 1.418 1.232 12.650 15.737 Any publications 0.913 0.282 0.907 0.290 Number of publications 6.067 5.530 18.661 15.724 Any citations 0.908 0.289 0.906 0.292 Number of citations 254.669 348.680 643.375 819.686 Any NSF funding 0.034 0.181 0.083 0.276 Amount of NSF ($/100,000) 0.867 0.531 2.786 2.291
Years 6-10 following the application Any NIH funding 0.295 0.456 0.654 0.476 Amount of NIH funding ($/100,000) 5.110 4.081 20.567 22.506 Any publications 0.773 0.419 0.886 0.318 Number of publications 8.154 8.265 18.843 17.289 Any citations 0.735 0.442 0.857 0.350 Number of citations 246.572 384.359 446.992 661.765 Any NSF funding 0.059 0.236 0.072 0.258 Amount of NSF funding ($/100,000) 2.637 1.765 3.202 2.537
Article Funding Information Any Funding Sources Listed in Sampled Publications for the Researcher -- -- 0.827 0.291
Average Number of Funding Sources per Article -- -- 2.929 1.596 Author Has Funding Source -- -- 0.789 0.308 Coauthor Has Funding Source -- -- 0.785 0.312 Notes: Sample includes applicants with uncommon names (name frequency <=10) who scored within +/- 100 points of the funding cutoff for F32s and +/- 200 points for R01s. The unit of observation is a grant application. Estimates of amount of NIH or NSF funding includes zeroes for those who received no funding.

61
TABLE 2 OLS ESTIMATES OF NIH FUNDING AND RESEARCH PRODUCTIVITY
Postdoctoral Fellowship (F32s) Research Program Grants (R01s)
Independent Variable: Binary Indicator for NIH Grant Receipt
Pubs in Yrs 1-5
Citations in Yrs 1-5
Research Direction in Yrs 1-5
NIH Funding in Yrs 6-10
(/$100,000)
Pubs in Yrs 1-5
Citations in Yrs 1-5
Research Direction in Yrs 1-5
NIH Funding in Yrs 6-10 (/$100,000)
Specification (1) (2) (3) (4) (5) (6) (7) (8)
(1) No controls 0.83** (0.10)
39.42** (6.27)
0.032 (0.029)
0.485** (0.063)
2.58** (0.19))
116.70** (8.88)
0.194** (0.013)
6.62** (0.25)
(2) Quadratic priority score + institute and year fixed effects
0.67** (0.12)
5.47 (7.69)
0.126** (0.033)
-0.006 (0.081)
1.61** (0.22)
75.95** (10.30)
0.127** (0.014)
3.81** (0.29)
(3) = (2) + applicant characteristics
0.59** (0.12)
2.64 (7.53)
0.118** (0.033)
-0.057 (0.078)
1.42** (0.21)
62.61** (9.97)
0.116** (0.014)
3.28** (0.28)
(4) = (3) + Measures of prior publications, funding
0.65** (0.10)
5.21 (7.32)
0.118** (0.032)
-0.041 (0.078)
1.18** (0.14)
49.54** (8.60)
0.078** (0.011)
2.52** (0.24)
Control group mean (s.d)
4.56 (4.53)
200.41 (323.13)
1.27 (1.50)
1.12 (2.90)
14.50 (15.10)
487.74 (737.51)
0.958 (1.056)
9.15 (18.01)
R-squared from model in row 4 0.35 0.17 0.20 0.14 0.62 0.36 0.50 0.35
Number of obs 13,426 13,426 12,381 11,311 54,742 54,742 49,667 44,859 Notes: Each cell in rows 1-4 of this table represents the coefficient (s.e.) from a separate OLS regression where the dependent variable is shown at the top of the column and the set of control variables are described in under “Specification” in the first column. The unit of observation is an application. In each case, the estimate shown is the coefficient (s.e.) on a binary indicator for eventual NIH grant receipt. The sample sizes in columns 3 and 7 are smaller than the others because researchers with zero publications do not have a value for the research direction variable. The sample sizes in columns 4 and 8 are smaller because we only have NIH funding information through 2003, and so we cannot calculate measures for years 6-10. For measures of years 1-5, we interpolate some values as described in the text. The control variables include fixed effects for institute, year of award, name frequency, name frequency squared, age and age squared at time of award, a binary indicators for female, married and divorced, a linear measure for the number of dependents, binary indicators for region (West, Central and South, with East omitted), binary indicators for degree type (MD, and MD/PhD with PhD as the omitted category), binary indicators for field (social sciences, physical sciences and other, with biological sciences as the omitted category), binary indicators for organization type (research institute, hospital with university as the omitted category), binary indicators for unit within organization which only applies to universities (hospital, arts and sciences, school of public

62
health, institute, or other with medical/dental school omitted), linear and quadratic terms for the rank of the applicant’s current and graduate institutions where rank is measured in terms of amount of NIH funding received in prior years, and linear and quadratic terms for a host of prior productivity measures including number of publications in years 1-5 prior to application, number of publications in years 6-10 prior to application, research direction in years 1-5 prior to application, research direction in years 6-10 prior to application, amount of NSF funding in years 1-5 prior to application, amount of NSF funding in years 6-10 prior to application, amount of NIH funding in years 1-5 prior to application, and amount of NIH funding in years 6-10 prior to application. The control group means and standard deviations for the publication and citation columns are adjusted to account for the presence of false positive matches, as described in the text. Standard errors are clustered by researcher. **=indicates statistical significance at the 5 percent level; *=indicates significance at the 10 percent level.

63
TABLE 3 THE EFFECT OF NIH POSTDOCTORAL FELLOWSHIPS (F32s) ON RESEARCH PRODUCTIVITY
First-Stage Estimates Second-Stage Estimates
Received Grant
Pubs in Yrs 1-5
Normalized Pubs in Yrs
1-5
Citations in Yrs 1-5
Research Direction in
Yrs 1-5
NIH funding in Yrs 6-10 (/$100,000)
NSF funding in Yrs 6-10 (/$100,000)
(1) (2) (3) (4) (5) (6) (7)
Below the cutoff 0.34** (0.01)
F-statistic of instrument [p-value]
616.81 (0.000)
OLS estimates 0.65** (0.10)
0.18** (0.03)
5.21 (7.32)
0.12** (0.03)
-0.041 (0.078)
-0.011 (0.019)
IV estimates 0.86** (0.41)
0.27** (0.12)
22.84 (28.89)
0.08 (0.13)
0.098 (0.262)
0.129* (0.067)
Diff: IV - OLS 0.22 (0.41)
0.09 (0.12)
17.63 (28.30)
-0.04 (0.14)
-0.057 (0.261)
0.140** (0.062)
Control group mean (s.d.)
0.19 (0.39)
4.56 (4.53)
1.28 (1.25)
200.41 (323.13)
1.27 (1.50)
1.12 (2.90)
0.16 (0.77)
Notes: The estimates are derived from specifications (1) and (2) in the text. Normalized publications are calculated by dividing each publication by the total number of authors on the publication prior to summing across years. Each regression includes the full set of control variables described in the notes to Table 2. The control group means and standard deviations for the publication and citation columns are adjusted to account for the presence of false positive matches, as described in the text. Standard errors are clustered by researcher. **=indicates statistical significance at the 5 percent level; *=indicates significance at the 10 percent level.

64
TABLE 4 THE EFFECT OF NIH POSTDOCTORAL FELLOWSHIPS ON BINARY MEASURES OF CAREER SUCCESS
Any Pubs in Yrs 1-5
5 or More Pubs in Yrs 1-5
50 or More Citations in
Yrs 1-5
Any Pubs in Yrs 6-10
5 or More Pubs in
Yrs 6-10
50 or More Citations in
Yrs 6-10
Any NIH Funding in Yrs 6-10
(1) (2) (3) (4) (5) (6) (7) Grant Receipt Exogenous
ML Point Estimate 0.37** (0.05)
0.21** (0.04)
0.21** (0.04)
0.22** (0.04)
0.12** (0.03)
0.15** (0.03)
.14** (.04)
Marginal Effect— Percent Points 0.08 0.07 0.07 0.06 0.04 0.04 .04
Marginal Effect— Percent of Mean 0.11 0.23 0.15 0.12 0.17 0.16 .20
Grant Receipt Endogenous
ML Point Estimate 0.17 (0.20)
0.13 (0.18)
0.16 (0.14)
0.10 (0.15)
0.26** (0.11)
0.17 (0.12)
.03 (.12)
Marginal Effect— Percentage Points 0.03 0.04 0.05 0.03 0.09 0.05 .0038
Marginal Effect— Percent of Mean 0.04 0.18 0.10 0.05 0.46 0.20 .04 Notes: The estimates shown above are derived from the specifications outlined in Appendix C. Each column represents a separate model. In each case, the dependent variable is a binary productivity measure. Standard errors are clustered by researcher. **=indicates statistical significance at the 5 percent level; *=indicates significance at the 10 percent level.

65
TABLE 5
THE EFFECT OF NIH RESEARCH GRANTS (R01s) ON RESEARCH PRODUCTIVITY
First-Stage Estimates Second-Stage Estimates
Received Grant
Pubs in Yrs 1-5
Normalized Pubs in Yrs 1-5
First-Author Pubs in Yrs 1-5
Citations in Yrs 1-5
Research Direction in Yrs 1-5
NIH funding in Yrs 6-10
(/$100,000)
NSF funding in Yrs 6-10
(/$100,000)
(1) (2) (3) (4) (5) (6) (7) (8)
Below the cutoff 0.16** (0.01)
Below cutoff*priority score
0.002** (0.000)
F-statistic of instruments [p-value]
315.56 (0.00)
OLS estimates 1.18** (0.14)
0.36** (0.04)
0.20** (0.05)
49.54** (8.60)
0.08** (0.01)
2.52** (0.24)
-0.07** (0.02)
IV estimates 0.85 (0.98)
0.28 (0.29)
0.60* (0.33)
37.78 (62.33)
-0.06 (0.08)
6.49** (1.79)
-0.22** (0.11)
Diff: IV - OLS -0.33 (1.09)
-0.08 (0.29)
0.40 (0.38)
-11.76 (66.70)
-0.14 (0.09)
3.97** (1.65)
0.15 (0.11)
Control group mean (s.d.)
0.48 (0.50)
14.50 (15.10)
4.15 (4.08)
2.72 (3.58)
484.74 (737.51)
0.96 (1.06)
9.15 (18.02)
0.33 (1.27)
Notes: Notes: The estimates are derived from specifications (1) and (3) in the text. Normalized publications are calculated by dividing each publication by the total number of authors on the publication prior to summing across years. First-author publications reflect the number of normalized publications in which the author was first author. Each regression includes the full set of control variables described in the notes to Table 2. The control group means and standard deviations for the publication and citation columns are adjusted to account for the presence of false positive matches, as described in the text. Standard errors are clustered by researcher. **=indicates statistical significance at the 5 percent level; *=indicates significance at the 10 percent level.

66
TABLE 6 SENSITIVITY ANALYSIS I – EFFECTS ON PRE-TREATMENT OUTCOMES
Postdoctoral Fellowship (F32s)
Research Program Grants (R01s)
Control
Group Mean (sd)
Coeff (se)
Control Group Mean
(sd)
Coeff (se)
Specification (1) (2) (3) (4)
Pre-treatment number of publications 2.68 (3.31)
0.50* (0.29)
24.74 (22.84)
-5.52** (2.23)
Pre-treatment index of research relevance 1.18 (1.60)
0.08 (0.16)
1.08 (1.04)
0.02 (0.10)
Pre-treatment NSF funding ($/100,000) 0.00 (0.12)
-0.01 (0.01)
0.59 (2.46)
-0.42* (0.25)
Pre-treatment NIH funding ($/100,000) 0.00 (0.09)
0.00 (0.01)
6.85 (14.44)
-3.04** (1.48)
Name frequency 2.12 (2.58)
-0.25 (0.24)
2.19 (2.52)
0.06 (0.25)
Female 0.39 (0.49)
0.01 (0.05)
0.17 (0.38)
0.02 (0.04)
Age 32.02 (4.03)
-0.38 (0.44)
45.77 (8.56)
0.27 (0.80)
Married 0.50 (0.50)
-0.01 (0.05)
0.64 (0.48)
0.00 (0.07)
Divorced 0.28 (0.45)
0.02 (0.04)
0.35 (0.48)
0.00 (0.07)
Number of Dependents 0.28 (0.45)
0.01 (0.05)
0.49 (0.50)
-0.02 (0.08)
Has PhD 0.76 (0.43)
-0.02 (0.04)
0.53 (0.50)
0.05 (0.05)
Has MD 0.17 (0.37)
0.04 (0.03)
0.33 (0.47)
0.01 (0.04)
Rank of graduate institution 134.48 (294.17)
-75.98** (32.71)
118.46 (279.19)
93.08** (39.45)
Rank of current institution 68.17 (88.82)
-10.05 (8.84)
86.49 (95.78)
5.74 (9.17)
Biological sciences department 0.82 (0.39)
0.04 (0.04)
0.84 (0.37)
0.00 (0.04)
Physical sciences department 0.10 (0.30)
-0.04 (0.03)
0.07 (0.25)
0.03 (0.02)
Social sciences department 0.03 (0.18)
0.00 (0.02)
0.06 (0.23)
-0.02 (0.02)
Research institute 0.11 (0.31)
0.00 (0.03)
0.08 (0.28)
-0.04 (0.03)
Hospital 0.06 (0.24)
-0.01 (0.02)
0.08 (0.27)
0.01 (0.03)
Arts and Sciences 0.31 (0.46)
0.00 (0.04)
0.19 (0.39)
-0.01 (0.04)
School of public health 0.01 (0.09)
0.00 (0.01)
0.02 (0.12)
-0.01 (0.01)
Hospital 0.00 (0.06)
0.01 (0.01)
0.01 (0.10)
-0.01 (0.01)
Institute 0.02 (0.13)
-0.02 (0.01)
0.02 (0.13)
-0.02 (0.01)
Other 0.10 0.01 0.12 -0.03

67
(0.30) (0.03) (0.33) (0.03) F-Statistic [p-value] of joint significance of excluded instruments for all outcomes listed above
1.05 [.392] 1.19
[.173]
F-Statistic [p-value] of joint significance of excluded instruments for the first 4 outcomes listed above (the productivity measures in years 1-5 prior to grant application)
1.37 [.243] 2.38
[.015]
Notes: These specifications were estimated using IV in which we control only for institute and year fixed effects and linear and quadratic measures of either the normalized IRG or priority scores. The instruments used in the F-specification include only whether the IRG score was below the cutoff. In the R specification, instruments include whether the priority score was below the cutoff and normalizes priority score interacted with a below cutoff indicator variable. Standard errors are clustered by researcher. **=indicates statistical significance at the 5 percent level; *=indicates significance at the 10 percent level.

1
TABLE 7 SENSITIVITY ANALYSIS II – ALTERNATIVE SPECIFICATIONS AND SAMPLES
Postdoctoral Fellowship (F32s) Research Program Grants (R01s)
Pubs in Yrs 1-5
Citations in Yrs 1-5
Index of Research Relevance in Yrs 1-5
NIH funding in Yrs 6-10
(/$100,000)
Pubs in Yrs 1-5
Citations in Yrs 1-5
Index of Research Relevance in Yrs 1-5
NIH funding in Yrs 6-10
(/$100,000) Specification (1) (2) (3) (4) (5) (6) (7) (8)
(1) Baseline 0.86** (0.41)
22.84 (28.89)
0.08 (0.13)
-0.10 (0.26)
0.85 (0.98)
37.78 (62.34)
-0.06 (0.08)
6.49** (1.79)
(2) No covariates 1.26** (0.50)
40.82 (30.41)
0.10 (0.14)
0.07 (0.27)
-2.30 (1.52)
-79.88 (74.03)
-0.06 (0.10)
4.56** (2.02)
(3) Narrower range 1.01** (0.51)
0.61 (31.20)
0.05 (0.17)
-0.39 (0.33)
0.90 (1.44)
67.70 (90.88)
-0.12 (0.12)
6.04** (2.57)
(4) Wider range 0.66** (0.33)
23.09 (23.43)
0.05 (0.10)
0.16 (0.21)
0.68 (0.72)
-6.35 (45.86)
-0.01 (0.06)
5.47** (1.32)
(5) Include only linear term in the rating
0.86** (0.41)
22.08 (28.84)
0.08 (0.13)
-0.14 (0.26)
-0.26 (0.66)
-161.44** (44.19)
-0.08 (0.06)
0.06 (1.30)
(6) Including 3rd order polynomials in the rating
1.45* (0.77)
-12.06 (54.98)
0.14 (0.24)
-0.84* (0.50)
0.24 (1.87)
92.71 (120.74)
-0.11 (0.15)
7.44** (3.36)
(7) Including 4th order polynomials in the rating
1.46* (0.79)
-13.38 (55.66)
0.13 (0.25)
-0.75 (0.51)
1.49 (2.17)
161.71 (136.57)
-0.25 (0.18)
8.88** (3.71)
(8) Including a linear term in the rating but allowing it to differ above vs. below the cutoff
0.88** (0.41)
24.79 (29.20)
0.07 (0.13)
-0.04 (0.27)
1.07 (1.03)
47.37 (66.29)
-0.07 (0.09)
6.91** (1.87)
(9) Including 2nd order polynomials, and allowing both terms to differ above vs. below the cutoff
1.91 (1.25)
-48.94 (87.97)
0.15 (0.40)
-1.27 (0.83)
1.12 (3.41)
282.98 (220.44)
-0.32 (0.30)
12.07** (5.73)
Notes: The specifications are identical to those in Tables 3 and 5 except as indicated. **=indicates statistical significance at the 5 percent level; *=indicates significance at the 10 percent level.

2
TABLE 8 HETEROGENEITY OF EFFECTS
Postdoctoral Fellowship (F32s) Research Program Grants (R01s)
Specification Norm Pubs in Yrs 1-5
Citations in Yrs 1-5
Index of Research
Relevance in Yrs 1-5
NIH funding in Yrs 6-10 (/$100,000)
Norm Pubs in Yrs 1-5
Citations in Yrs 1-5
Index of Research
Relevance in Yrs 1-5
NIH funding in Yrs 6-10 (/$100,000)
Baseline 0.18** (.03)
5.21 (7.32)
0.118** (0.032)
-0.041 (0.078)
.36** (.04)
49.54** (8.60)
0.194** (0.013)
2.52** (0.24)
Time Period
1980-1989 0.19** (0.04)
8.90 (11.42)
0.07* (0.04)
-0.03 (0.08)
0.36** (0.06)
57.05** (13.60)
0.08** (0.02)
1.67** (0.23)
1990-2000 0.17** (0.04)
4.37 (8.93)
0.15** (0.05)
-0.07 (0.15)
0.34** (0.05)
34.60** (10.41)
0.07** (0.02)
3.69** (0.46)
Chi-Square Test of Equal Coefficients [p-value]
0.13 [0.72]
0.10 [0.75]
1.38 [0.24]
0.06 [0.81]
0.15 [0.70]
1.72 [0.19]
0.21 [0.65]
15.48 [0.00]
Researcher Demographics
Female researchers 0.13** (0.05)
0.58 (10.26)
0.10* (0.06)
-0.05 (0.12)
0.29** (0.08)
18.10 (15.47)
0.04 (0.03)
3.84** (0.54)
Male researchers 0.21** (0.04)
9.96 (11.14)
0.14** (0.04)
-0.04 (0.12)
0.38** (0.05)
56.25** (10.10)
0.09** (0.01)
2.27** (0.28)
Chi-Square Test of Equal Coefficients [p-value]
1.35 [0.25]
0.38 [0.54]
0.32 [0.57]
0.00 [0.98]
0.65 [0.42]
4.27 [0.04]
2.47 [0.11]
6.60 [0.01]
Younger researchers 0.06 (0.07)
-3.19 (19.75)
0.03 (0.07)
-0.16 (0.17)
0.39** (0.05)
78.27** (12.58)
0.07** (0.02)
3.22** (0.30)
Older researchers 0.16** (0.05)
9.76 (11.82)
0.12** (0.04)
0.01 (0.13)
0.30** (0.06)
15.18 (11.38)
0.09** (0.01)
1.63** (0.38)
Chi-Square Test of Equal Coefficients [p-value]
1.57 [0.21]
0.32 [0.57]
1.06 [0.30]
0.62 [0.43]
1.40 [0.24]
13.84 [0.00]
0.53 [0.47]
10.53 [0.00]
Has a PhD 0.17** (0.03)
4.76 (8.49)
0.15** (0.04)
-0.03 (0.09)
0.38** (0.05)
41.84** (10.79)
0.07** (0.02)
2.68** (0.31)
Has a MD 0.26** (0.07)
26.32 (18.65)
0.003 (0.06)
-0.27 (0.19)
0.34** (0.08)
65.43** (17.19)
0.06** (0.02)
2.65** (0.53)
Chi-Square Test of Equal 1.49 1.11 4.09 1.34 0.26 1.35 0.17 0.00

3
Coefficients [p-value] [0.22] [0.29] [0.04] [0.25] (0.61) [0.25] [0.68] [0.97]
Department Type
Social science 0.34 (0.21)
65.82** (27.69)
0.11* (0.07)
-0.10 (0.38)
0.21 (0.16)
26.81 (26.48)
0.00 (0.03)
2.87** (1.01)
Physical science 0.00 (0.11)
-25.45 (20.88)
0.15 (0.12)
-0.03 (0.20)
0.17 (0.19)
-11.32 (35.68)
0.06 (0.05)
0.53 (0.54)
Biological science 0.17** (0.03)
7.15 (8.66)
0.09** (0.04)
-0.04 (0.09)
0.37** (0.04)
61.75** (9.68)
0.08** (0.01)
2.68** (0.28)
Chi-Square Test of Equal Coefficient [p-value]
3.08 [0.21]
6.93 [0.03]
0.28 [0.87]
0.03 [0.98]
1.87 [0.39]
5.04 [0.08]
8.24 [0.02]
12.93 [0.00]
Notes: These estimates are based on OLS regressions similar to those presented in row 4 of Table 2. Younger researchers are defined as those less than 30 and 45 years of age in the F and R samples respectively. **=indicates statistical significance at the 5 percent level; *=indicates significance at the 10 percent level.

4
TABLE 9 THE EFFECT OF RECEIVING AN NIH RESEARCH GRANT ON THE SOURCE OF RESEARCH FUNDING
Any NIH funding
Total number of NIH grants Any non-NIH
funding
Total number of other funding
sources
Any funding source
Total number of funding sources
(1) (2) (3) (4) (5) (6)
OLS estimates 0.18** (0.05)
0.33** (0.17)
-0.04 (0.05)
-0.08 (0.19)
0.01 (0.04)
0.26 (0.25)
Control group mean (s.d.)
0.57 (0.38)
1.15 (1.15)
0.60 (0.37)
1.14 (1.23)
0.82 (0.29)
2.29 (1.77)
Number of observations 517 517 517 517 517 517 Notes: In all cases, the sample is based on 840 publications identified on PubMed associated with 517 different grant applications. Funding information is aggregated to the level of the grant application. All specifications are performed using OLS with the full set of covariates described in Table 2. **=indicates statistical significance at the 5 percent level; *=indicates significance at the 10 percent level.