the impact of private equity ownership on portfolio firms’ … files/10-004... · 2017-10-31 ·...
TRANSCRIPT

Copyright © 2009, 2010 by Brad Badertscher, Sharon P. Katz, and Sonja Olhoft Rego
Working papers are in draft form. This working paper is distributed for purposes of comment and discussion only. It may not be reproduced without permission of the copyright holder. Copies of working papers are available from the author.
The Impact of Private Equity Ownership on Portfolio Firms’ Corporate Tax Planning Brad Badertscher Sharon P. Katz Sonja Olhoft Rego
Working Paper
10-004

The Impact of Private Equity Ownership on Portfolio Firms’ Corporate Tax Planning
Brad Badertscher University of Notre Dame
Sharon P. Katz
Harvard University
Sonja Olhoft Rego* University of Iowa
March 4, 2010
*Corresponding Author: University of Iowa, Tippie College of Business, 108 PBB, Iowa City, Iowa 52242. Phone: (319) 335-0891. Fax: (319) 335-1956. Email: [email protected]. We are grateful for constructive comments by Ramji Balakrishnan, Dan Collins, Cristi Gleason, Michelle Hanlon, Shane Heitzman, Dan Givoly, Paul Hribar, Michael Kimbrough, Josh Lerner, Greg Miller, Tom Omer, Krishna Palepu, Jim Seida, Joseph Weber, Ryan Wilson, and workshop participants at the 2009 Information, Markets & Organization Conference at Harvard Business School, the 2009 JAAF/KPMG Conference, the University of Iowa, and the Texas Tax Readings Group. All errors are our own.

The Impact of Private Equity Ownership on Portfolio Firms’ Corporate Tax Planning
ABSTRACT: This study investigates whether private equity (PE) firms influence the tax
practices of their portfolio firms. Prior research documents that PE firms create economic value
in portfolio firms through effective governance, financial, and operational engineering. Given
PE firms’ focus on value creation, we examine whether PE firms influence the extent and types
of tax avoidance at portfolio firms as an additional source of economic value. We document that
PE-backed portfolio firms engage in significantly more nonconforming tax planning and have
lower marginal tax rates than other private firms. Moreover, we document that PE-backed
portfolio firms pay 14.2 percent less income tax per dollar of pre-tax income than non-PE backed
firms, after controlling for NOLs and debt tax shields. We find additional tax savings for PE-
backed portfolio firms that are either majority-owned or owned by large PE firms, consistent
with PE ownership stake, expertise, and resources serving as important factors in the tax
practices of portfolio firms. We infer that PE firms view tax planning as an additional source of
economic value in their portfolio firms, where the benefits outweigh any potential reputational
costs associated with corporate tax avoidance.
Keywords: Private equity; ownership structure; tax avoidance; tax planning; book-tax differences;
cash effective tax rates; marginal tax rates.
Data Availability: Data are available from sources identified in the text.

1
The Impact of Private Equity Ownership on Portfolio Firms’ Corporate Tax Planning
I. INTRODUCTION
Private equity (PE) firms, such as The Blackstone Group, The Carlyle Group, and
Kohlberg Kravis & Roberts, manage investment funds that generally buy mature businesses via
leveraged buyout (LBO) transactions. We refer to these acquired businesses as “portfolio firms”
or “PE-backed firms”. While prior research suggests that PE firms create economic value in
their portfolio firms through effective governance, financial, and operational engineering (e.g.,
Cao and Lerner 2009; Kaplan and Stromberg 2009; Masulis and Thomas 2009), little is known
about the tax planning of these portfolio firms. PE firms and their portfolio firms are important
components of the U.S. capital markets as PE firms participated in more than one-third of initial
public offerings and in more than one-quarter of U.S. mergers during the past few years (Katz
2009). Given PE firms’ importance in the U.S. capital markets and their focus on value creation,
we investigate whether PE firms utilize tax planning in their portfolio firms as an additional
source of economic value and test whether PE-backed private firms engage in more tax
avoidance than other privately-held firms.1
We focus on tax avoidance as a source of value for several reasons. First, recent research
suggests that corporate tax departments were increasingly viewed as profit centers during the
1990s and early 2000s (e.g., Crocker and Slemrod 2005; Robinson, Sikes, and Weaver 2009).
This view of tax departments as profit centers complements PE firms’ focus on value creation at
portfolio firms, since successful tax planning can generate substantial tax savings that benefits
both present and future shareholders (e.g., Graham and Tucker 2006; Wilson 2009). Second,
1 We focus on private firms because public and private firms have different financial reporting incentives, which affect the amount and types of tax planning in which public and private firms engage (e.g. Penno and Simon 1986; Beatty and Harris 1998; Mikhail 1999; Badertscher, Katz and Rego 2010). By focusing on private firms, we control – in large part – for variation in financial reporting incentives across sample firms.

2
recent editorials suggest that PE firms excel at tax avoidance (e.g., Hutton 2009; Lumbis 2009)
and also claim that PE firms aggressively manage the tax liabilities of their portfolio firms
(Behind the Buyout 2007). Given their close monitoring and control over portfolio firms (e.g.
Cotter and Peck 2001), PE firms’ tax practices likely influence the tax practices of their portfolio
firms. While prior studies have documented that PE-backed portfolio firms substantially reduce
their tax liabilities through extensive debt financing (e.g. Kaplan 1989; Kaplan and Stromberg
2009), prior research has not investigated other types of tax planning at these firms.
We compare the tax practices of PE-backed private firms to those of other privately-held
firms. To make these comparisons, we compile samples of private firms with publicly-traded
debt that are: 1) majority- or minority-owned by PE firms (majority or minority PE-backed
firms), or 2) owned by the company’s management or employees (non-PE-backed firms). While
these different types of private firms are similar in many respects, including more highly
concentrated equity ownership and a greater reliance on debt financing than publicly-traded
firms (e.g., Renneboog and Simons 2005; Katz 2009; Givoly, Hayn and Katz 2010), they are
different in at least two important dimensions. First, as repeat players in the debt and equity
markets, PE firms are likely concerned with their reputations as creators of economic value (e.g.,
Cao and Lerner 2009). These reputational considerations may cause PE firms to discourage
aggressive tax avoidance at portfolio firms, since aggressive tax avoidance can impose net costs
on both firms and shareholders (e.g., Desai and Dharmapala 2006; Hanlon and Slemrod 2009;
Chen, Chen, Cheng, and Shevlin 2010). Second, PE firms have substantial expertise and
resources at their disposal (e.g., Cao and Lerner 2009; Kaplan and Stromberg 2009), enhancing
their ability to promote effective tax strategies that create economic value at portfolio firms.

3
Thus, it is an empirical question whether PE-backed private firms engage in more or less tax
avoidance than other private firms.
We utilize three measures of tax avoidance that reflect tax planning that reduces a firm’s
tax liability without reducing the firm’s financial income (i.e., book-tax nonconforming tax
planning). This type of tax planning includes standard tax practices that do not violate income
tax rules (e.g., locating subsidiaries in low-tax foreign countries), as well as aggressive tax
strategies that are considered abusive by the IRS and the Treasury Department (e.g., sale-in-
lease-out transactions). However, these three measures do not reflect tax planning that affects
book and taxable income in a similar manner (i.e., book-tax conforming tax planning), including
the tax benefits of debt financing. Thus, we also use simulated marginal tax rates as introduced
by Graham (1996) as an additional proxy for corporate tax avoidance. Finally, we hand-collect
tax footnote information from audited financial reports, to more precisely identify the methods of
tax avoidance used by private firms.
Our results indicate that PE-backed firms engage in significantly more nonconforming
tax planning and have lower marginal tax rates than other private firms. These results hold
despite controls for factors known to cause variation in tax avoidance across firms, including
current year losses, net operating loss carryforwards (NOLs), foreign income, leverage, size, and
the tax benefits of employee stock options. In particular, we find that PE-backed firms pay 14.2
percent less income tax per dollar of adjusted pre-tax income than non-PE-backed private firms,
even after controlling for NOLs and debt tax shields. In addition, we find that majority PE-
backed firms engage in more tax avoidance than minority PE-backed firms, and portfolio firms
that are owned by larger PE firms engage in more tax avoidance than portfolio firms that are

4
owned by smaller PE firms.2 Lastly, results from the tax footnote analyses are consistent with
portfolio firms using sale and leaseback transactions, foreign operations, tax-exempt
investments, and tax credits to reduce their income taxes.
Taken together, our results are consistent with PE firms having the resources and
expertise to promote greater tax avoidance at portfolio firms, and this effect is more prevalent for
portfolio firms that are either majority-owned or owned by larger PE firms. Our results are also
consistent with the benefits of tax planning by PE portfolio firms outweighing the associated
costs, including any potential reputational costs associated with aggressive tax avoidance. Thus,
PE ownership in general – and majority PE ownership or ownership by a large PE firm in
particular – generates additional tax benefits and creates additional economic value for portfolio
firms that exceeds those for other private firms. We infer that PE firms view tax planning as an
additional source of economic value in portfolio firms.
Our study makes several contributions to the accounting and finance literatures. First,
although private firms are important components of the U.S. economy, little is known about the
tax practices of private firms with different ownership structures, primarily due to the lack of
publicly available financial information.3 We utilize financial information for private firms with
publicly-traded debt to further our understanding of tax practices at large, private companies.
Second, Shackelford and Shevlin (2001) note that little is known about the cross-sectional
differences in the willingness of firms to minimize taxes, and point out that insider control and
other organizational features, such as ownership structure, are important but understudied factors
2 We measure PE firm size based on the amount of capital under management, where PE firm size is a proxy for PE firm reputation. See section IV for further discussion. 3 Ninety-nine percent of the companies operating in the United States are private (AICPA 2004) and therefore are not required to register under the Securities Act of 1933. Hence, prior tax research was primarily limited to the comparison of public and private firms in regulated industries or to the use of survey data (e.g. Beatty and Harris 1998; Mikhail 1999; Penno and Simon 1986; Cloyd, Pratt, and Stock 1996) and did not explore different ownership structures within private firms.

5
that impact corporate tax avoidance. Hence, our study furthers our understanding of the impact
of ownership structure on income tax reporting practices in general.
Finally, our research is important because of the growing significance of PE firms for the
U.S. capital markets. The cumulative capital commitments to non-venture capital PE firms in
the U.S. between 1980 and 2006 is estimated to be close to $1.4 trillion (Stromberg 2008). In
addition, approximately $400 billion of PE-backed transactions were announced in both 2006
and 2007, representing over 2 percent of the total capitalization of the U.S. stock market in each
of these years (Kaplan 2009). Despite a decline in PE transactions since 2007, experts maintain
that PE firms have become a permanent component of U.S. investment activity (e.g., Kaplan
2009; Kaplan and Stromberg 2009). While prior research examines PE-backed portfolio firms’
governance, financial and operational strategies, as well as their long-term financial performance
and financial reporting quality (e.g. Acharya, Hahn and Kehow 2009; Cao and Lerner 2009;
Kaplan and Stromberg 2009; Katz 2009; Masulis and Thomas 2009), little is known about PE-
backed portfolio firms’ tax practices. Given the strong criticisms of PE firms’ investment
policies and tax treatment, regulators, investors, and researchers will benefit from a deeper
understanding of whether and how PE firms create economic value in portfolio firms through tax
planning.4
The remainder of this paper is organized as follows. Section 2 discusses background and
develops hypotheses. Section 3 describes the research design. Section 4 provides a description
of the data collection procedures, descriptive statistics, and presents results. Section 5 concludes.
II. BACKGROUND AND HYPOTHESIS DEVELOPMENT
4 The rapid growth of the PE industry has raised concerns regarding anticompetitive behavior, excessive tax benefits, and stock manipulations in this sector [see Katz (2009) and section II for further discussion]. PE-backed initial public offerings (IPOs) have been the subject of particular scrutiny, as PE firms have been criticized for pushing over-leveraged portfolio firms too quickly into the public market (Cao and Lerner 2009).

6
Private Equity Firms
PE firms have received much attention in recent years due to their substantial impact on
merger and acquisition activity and their generous tax treatment in the U.S. and other countries.
PE firms, which are typically organized as limited partnerships, manage investment funds (PE
funds) that generally buy mature, profitable businesses via LBOs (see Figure 1). These
transactions often involve substantial amounts of debt, resulting in highly leveraged portfolio
firms. PE funds have limited life spans (approximately 10 years) and typically receive a 20
percent share (i.e., ‘carried interest’) of any gains generated by the sale or IPO of their portfolio
firms, in addition to an annual management fee (Kaplan and Stromberg 2009). While the
management fees are taxed as ordinary income (tax rate is 35 percent), the carried interest is
taxed as long-term capital gain (tax rate is 15 percent). This tax treatment of carried interest, as
well as the fact that some PE firms have been able to avoid corporate taxation once they file for
an initial public offering (e.g., The Blackstone Group) has provoked numerous negative press
reports, proposed changes to federal income tax laws, and several academic studies (e.g.
Fleischer 2007, 2008; Knoll 2007; Cunningham and Engler 2008; Lawton 2008).
The generally negative view of the tax benefits enjoyed by PE firms contrasts other
characteristics associated with their management of portfolio firms. PE firms typically take a
controlling stake in their portfolio firms with the intent of substantially improving the
performance of their investments. Results in prior research suggest that PE firms act as effective
monitors of their portfolios firms. This effective monitoring, combined with PE firms’ financial,
governance, and operational strategies, as well as reputational considerations, have a positive
impact on their portfolio firms’ long-term financial performance, as well as financial reporting

7
quality (e.g. Acharya et al. 2009; Cao and Lerner 2009; Kaplan and Stromberg 2009; Katz 2009;
Masulis and Thomas 2009).
Hypothesis Development
A priori, it is not clear whether PE-backed private firms will engage in more or less tax
avoidance than non-PE-backed, private firms. Indeed, PE- and non-PE-backed private firms are
similar in many dimensions, including their lower agency costs due to concentrated stock
ownership, less financial reporting pressure, and extensive reliance on debt financing relative to
public firms (e.g. Katz 2009). However, PE- and non-PE-backed private firms differ in at least
two important dimensions. First, PE-backed private firms are subject to greater reputational
concerns than other private firms. Second, PE-backed private firms generally have more
sophisticated owners that possess greater expertise and resources than other private firm owners.
We discuss the potential impact of these two institutional differences on private firms’ tax
avoidance in the paragraphs that follow.
Because PE firms are ‘repeat players’ in the LBO debt market and the initial public-
offering (IPO) equity market, they likely have greater reputational concerns than other owners of
private firms (Cao and Lerner 2009). If PE firms engage in aggressive behaviors that diminish
the value of their portfolio firms, they will incur reputational costs that can limit future access to
these capital markets. Indeed, Katz (2009) cites these reputational concerns as one reason for the
higher earnings quality exhibited by PE-backed firms.
Similar to connotations associated with low earnings quality, aggressive tax planning
could suggest that deception on a firm’s tax return extends to other managerial actions, and that
management is dishonest with shareholders, as well. For example, Desai and Dharmapla (2006)
conjecture that complex tax shelter transactions that are designed to obscure the economic

8
substance of such transactions may also obscure a firm’s financial reporting and increase the
opportunities for managerial rent extraction. Building on this conjecture, Chen et al. (2010)
argue that dominant owner-managers of family-owned firms are willing to forgo the benefits of
aggressive tax planning to avoid the potential non-tax (reputational) cost of a stock price
discount, which could be imposed by other minority shareholders that believe tax aggressiveness
masks rent extraction by the family owner-managers. Consistent with tax aggressiveness
imposing reputational costs, Hanlon and Slemrod (2009) provide empirical evidence that the
public disclosure of participation in a tax shelter transaction is associated with significant and
negative stock returns.
Thus, PE firms risk reputational costs if their portfolio firms are labeled as overly tax
aggressive. For example, when portfolio firms ‘go public,’ they could be valued at a discount by
investors due to concerns about contingent income tax liabilities. Alternatively, PE firms’ cost
of capital could be directly affected by tax aggressiveness if the capital markets view PE firms as
imposing excess risk on portfolio firms. These reputational considerations are intensified in light
of recent public scrutiny of the favorable tax treatments from which PE firms benefit (e.g. the
taxation of carried interest), and suggest that PE-backed private firms may engage in less tax
avoidance than other private firms that are not subject to similar reputational concerns.
The other dimension in which PE-backed private firms differ from other private firms is
the fact that their owners (i.e., PE firms) are generally more sophisticated and possess greater
expertise and resources than other private firm owners. Kaplan and Stromberg (2009) describe
PE firms as sophisticated managers of portfolio firms due to their financial, governance, and
operational engineering strategies. In particular, PE firms more closely align the incentives of
portfolio firm managers with those of shareholders through extensive use of stock-based

9
compensation (e.g., Jensen 1989; Jensen and Murphy 1990). PE firms rely on extensive debt
financing that generates substantial tax benefits (e.g., Kaplan 1989), and reduces the ‘free cash
flow’ problem by pressuring managers to maximize net cash flows to make interest and principle
payments (Jensen 1986). In addition, PE firms require the boards of portfolio firms to meet
frequently, monitor management teams closely, and bring industry and operating expertise to
portfolio firms through the use of consultants (Acharya et al. 2009).
The greater expertise and resources of PE firms should affect the tax strategies that they
and their portfolio firms employ. Over the past 20 years, successful tax strategies have
increasingly required greater financial and operational resources, as well as in-house tax
expertise and/or the use of high-priced tax consultants, to execute complex tax shelter
transactions (e.g., Crocker and Slemrod 2005; Robinson, Sikes, and Weaver 2009). In essence,
modern, aggressive tax avoidance requires a minimum level of corporate “sophistication,” where
sophistication implies access to managerial expertise. Consistent with this link between
corporate sophistication and tax avoidance, Dyreng, Hanlon, and Maydew (2009) find evidence
that firms with more sophisticated managers (i.e., those with an MBA degree) have lower cash
effective tax rates than firms with less sophisticated managers.
We assert that PE firm managers are generally more sophisticated than managers at other
privately-held firms. For example, Fraser-Sampson (2007) notes that PE managers often have
accounting, investment banking, or management consulting backgrounds. Managers with these
backgrounds are more likely to facilitate and promote aggressive tax avoidance at portfolio firms
than managers with other backgrounds (e.g., engineering or product development). These
arguments suggest that PE-backed firms may engage in more tax avoidance than other private
firms due to the greater expertise and resources of their PE owners.

10
In sum, PE-backed private firms differ from other private firms with respect to their
greater reputational concerns and to the greater expertise and resources of their private owners.
While their greater reputational concerns suggest that PE-backed firms engage in less tax
avoidance than other private firms, the superior expertise and resources of their private owners
suggest that PE-backed firms engage in more tax avoidance than other private firms. Thus, our
first hypothesis is non-directional:
H1: PE-backed private firms exhibit systematically different levels of tax avoidance than
non-PE-backed private firms.
A significant difference in tax avoidance between PE-backed private firms and non-PE-backed
private firms would suggest that PE ownership has a significant impact on the tax strategies of
private firms.
H1 compares the tax practices of PE-backed firms and non-PE-backed firms. However,
PE firms are likely to have the greatest impact on their portfolio firms when they have a majority
ownership stake, which would provide greater opportunities for close monitoring and control of
portfolio firms relative to a minority ownership stake (e.g. Cao and Lerner 2009; Kaplan and
Stromberg 2009; Katz 2009). As a consequence, PE firms with a majority ownership stake are
more likely to influence a portfolio firm’s tax strategies than PE firms with a minority stake.
Whether majority PE-backed firms engage in more or less tax avoidance than minority PE-
backed firms depends on the relative impacts of PE: 1) reputational concerns, and 2) expertise
and resources, on the tax practices of portfolio firms. Thus, our second hypothesis is also non-
directional:
H2: Private firms that are majority-owned by PE firms exhibit systematically different
levels of tax avoidance than private firms that are minority-owned by PE firms.

11
A significant difference in tax avoidance between majority- and minority PE-backed firms would
suggest that ownership control is important for PE firms to have a significant impact on portfolio
firms’ tax strategies.
Cao and Lerner (2009) and Katz (2009) contend that PE firm size is a good proxy for PE
reputational concerns. That is, large PE firms, with more assets under management, likely have
greater reputational concerns than small PE firms, since large PE firms have greater capital at
risk and engage in more LBO and IPO transactions than small PE firms. These greater
reputational concerns of large PE firms could lead to less aggressive tax planning at portfolio
companies. However, large PE firms also likely have greater expertise and resources than small
PE firms, consistent with large PE firms having the ability to promote more sophisticated and
effective tax planning at portfolio firms than small PE firms. Thus, our last hypothesis compares
the tax avoidance of private firms that are owned by large vs. small PE firms. Similar to our
prior hypotheses, our third hypothesis is non-directional:
H3: Private firms that are owned by large PE firms exhibit systematically different levels
of tax avoidance than private firms that are owned by small PE firms.
A significant difference in tax avoidance between private firms that are owned by large versus
small PE firms would suggest that PE firm size (as a proxy for PE firm reputation and/or
expertise and resources) is an important factor for PE firms to have a significant impact on
portfolio firms’ tax strategies.
III. RESEARCH DESIGN
Measures of Corporate Tax Avoidance
We rely on several proxies for corporate tax avoidance because different measures reflect
different types of tax planning and degrees of tax aggressiveness. We use three measures that

12
reflect book-tax nonconforming tax planning, which reduces a firm’s income tax liability but not
its financial income, including total book-tax differences, discretionary permanent book-tax
differences, and cash effective tax rates.5 We also use marginal tax rates, which are widely-used
in both accounting and finance research and reflect a broad range of tax strategies. We discuss
each of these proxies in the paragraphs that follow.
Our first proxy for nonconforming tax planning is an estimate of the difference between a
firm’s pretax book income and its taxable income, also referred to as total book-tax differences
or BTD. There are a number of studies that suggest book-tax differences can be used as a signal
of tax planning activity. Mills (1998) finds that proposed IRS audit adjustments are positively
related to large positive book-tax differences. Desai (2003) posits that the growing difference
between book and taxable income during the 1990’s was caused by increased levels of tax
sheltering. In addition, Wilson (2009) finds that book-tax differences are positively associated
with actual cases of tax sheltering. Despite evidence that large positive book-tax differences are
associated with tax avoidance activity, this measure has limitations. Manzon and Plesko (2002)
and Hanlon (2003) identify firm specific characteristics associated with book-tax differences that
are not necessarily reflective of corporate tax planning. For example, firms with large capital
expenditures likely have significant book-tax differences due to depreciation. In addition, results
in Phillips, Pincus, and Rego (2003) and Hanlon (2005) suggest that temporary book-tax
differences are associated with earnings management activities. To the extent that earnings
management and innate firm characteristics unrelated to tax avoidance are the primary
5 Book-tax nonconforming tax planning includes the utilization of research and development tax credits, locating operations in a low-tax foreign country, shifting income recognition from high-tax to low-tax locations, engaging in synthetic lease transactions (that are treated as operating leases for financial reporting purposes and capital leases for tax purposes), and utilizing non-corporate entities to generate deductions or losses that reduce consolidated taxable income. Each of these transactions affects book and taxable income differently, generating temporary or permanent book-tax differences.
13
determinants of book-tax differences, book-tax differences will be a noisy proxy for tax planning
activities.
Many aggressive tax strategies result in permanent book-tax differences. The majority of
cases of tax sheltering examined by Wilson (2009) resulted in permanent book-tax differences.
Further, the U.S. Congress Joint Committee on Taxation (1999), Weisbach (2002), and Shevlin
(2002) describe the ideal tax shelter as creating permanent, rather than temporary, book-tax
differences. Frank, Lynch and Rego (2009) adjust permanent differences to reflect only those
differences that reflect managerial discretion.6 Thus, our second measure of nonconforming tax
planning is discretionary permanent differences, DTAX, as computed by Frank et al. This
measure is also subject to several limitations. DTAX excludes tax strategies that defer income
recognition or accelerate expense recognition for tax relative to book purposes (i.e., that create
temporary book-tax differences). And similar to discretionary accrual models, DTAX attempts to
model ‘normal’ and ‘abnormal’ behavior for a firm, and thus is subject to many of the same
criticisms as discretionary accrual models. Nonetheless, Frank et al. (2009) show that both
DTAX and BTD are associated with actual cases of tax sheltering.
Our third measure of nonconforming tax planning is the cash effective tax rate
(CASH_ETR) introduced by Dyreng et al. (2008). We calculate CASH_ETR as the ratio of cash
income taxes paid to pretax book income less special items.7 Dyreng et al. (2008) describe how
this measure of tax avoidance has several advantages over the traditional effective tax rate (ETR)
(i.e., the ratio of total tax expense to pretax income). First, CASH_ETR is not affected by
6 Specifically, Frank et al. regress total permanent differences on nondiscretionary items unrelated to tax planning that are known to cause permanent differences. The nondiscretionary items include intangible assets and state tax expense, among others. Frank et al. use the residual from the regression as a proxy for tax aggressiveness, which they refer to as DTAX. See Appendix A for a detailed discussion of the computation of this variable. 7 We have insufficient time series data for each firm to follow the methodology in Dyreng et al. (2008), which computes CASH_ETR over 5- and 10-year time intervals. Thus, we compute CASH_ETR on an annual basis.

14
changes in tax contingencies, also known as the tax cushion.8 So regardless of whether a firm
records a tax cushion in its financial statements, the lower cash tax payments associated with
aggressive tax positions will be reflected in a lower CASH_ETR. Second, the CASH_ETR
measure is reduced by the tax benefit associated with employee stock options and therefore
provides a better measure of the firm’s true tax burden than the traditional ETR measure.
Despite these advantages, CASH_ETR still contains some measurement error, as this measure
does not control for nondiscretionary sources of book-tax differences (e.g., depreciable and
amortizable assets) and is biased downward for those firms that consistently manage their pretax
book-income upward over extended periods of time. In addition, CASH_ETR contains
measurement error as a proxy for current year tax avoidance when measured over short time
periods, due to the impact of estimated tax payments, tax refunds, and settlements with tax
authorities related to prior year tax returns.
Measures of nonconforming tax planning do not reflect tax planning that reduces a firm’s
book and taxable income (i.e., book-tax conforming tax planning), which is often accomplished
via “real transaction management”, such as accelerating research and development and
advertising expenditures or deferring revenue recognition to future periods. Prior research also
demonstrates that the tax benefits of debt financing (which are typically book-tax conforming)
are a major source of value in public-to-private transactions (e.g., Kaplan 1989; Schipper and
Smith 1991). Thus, we also use simulated marginal tax rates (MTR), as first introduced in
8 A firm must record a tax contingency or tax cushion when there is a significant probability that the firm will pay a tax authority (e.g., the IRS) additional income tax related to a prior or current year tax return. For example, if the firm expects to pay additional income tax related to an IRS audit of a prior year tax return. This increase in the tax contingency or tax cushion will increase the firm’s total tax expense, but does not reflect a true cash outflow for the firm, and thus current period tax expense is “overstated” from a cash flow perspective. See Cazier, Rego, Tian, and Wilson (2009) for further discussion of income tax contingencies.

15
Graham (1996), as a proxy for corporate tax avoidance,9 since these tax rates reflect both book-
tax conforming and nonconforming tax planning, including the tax benefits of debt financing.10
Marginal tax rates are generally defined as the present value of income taxes that would
be paid on an additional dollar of taxable income. One significant difference between marginal
tax rates and the nonconforming proxies for corporate tax avoidance is with respect to the types
of tax strategies these measures reflect. In particular, marginal tax rates (MTR) reflect book-tax
conforming and nonconforming tax planning, while BTD, DTAX, and CASH_ETR only reflect
tax strategies that affect book and taxable income differently. In addition, MTR, BTD, and
CASH_ETR reflect “temporary” tax strategies, while DTAX is designed to reflect “permanent” –
and some would argue more aggressive – tax strategies.11
Modeling the Impact of PE Ownership on Tax Avoidance Activity
To investigate whether PE ownership impacts a private firm’s level of tax avoidance, we
estimate equation (1) below, based on samples of PE-backed and non-PE-backed private firms.12
TAXi = 0 + 1PE_BACKEDi + 2LOSSi + 3LOSS×PE_BACKEDi + 4NOLi +
5NOL×PE_BACKEDi + 6LEVi + 7LEV×PE_BACKEDi + 8MNCi +
9INTANGi + 10EQ_EARNi + 11SALES_GRi + 12AB_ACCRi + 13ASSETSi +
14INV_MILLSi + ji YEARi + kl INDUSi + i (1)
9 We conduct our analyses based on marginal tax rates after interest expense to capture the tax benefits of debt financing. However, all results are quantitatively similar (untabulated) when we re-run our analyses based on marginal tax rates before interest expense (Graham 1996; Graham, Lemmon and Schallheim 1998). 10 Dyreng et al. (2008) suggest an alternative specification for CASH_ETR, the ratio of cash taxes paid to pre-tax cash flows from operations, to eliminate the use of pre-tax income as an earnings benchmark and to capture both conforming and nonconforming tax avoidance practices (similar to marginal tax rates). For further discussion see Hanlon and Heitzman 2009. Untabulated results for analyses based on this alternative specification for CASH_ETR are qualitatively similar to those tabulated for MTR across all analyses. 11 “Temporary” tax strategies reverse through time because they temporarily accelerate expense recognition or defer revenue recognition, while “permanent” tax strategies affect book and taxable income differently, and in a manner that is not expected to reverse (e.g., shifting income from a high-tax to a low-tax location). 12 As discussed in Section IV, we obtain our sample of private firms from COMPUSTAT. These firms have privately-owned equity but publicly-traded debt. The non-PE-backed private firms are firms whose equity is majority-owned by the company’s management or employees and hence are not owned by PE firms.

16
See Appendix A for a detailed definition of each variable included in equation (1). The
dependent variable, TAX, represents the four proxies for tax avoidance: BTD, DTAX,
CASH_ETR and MTR. We include an indicator variable, PE_BACKED, which equals one if a
PE firm has a majority or minority ownership stake in a private firm, and zero otherwise. If PE-
backed firms engage in more tax avoidance than non-PE-backed firms, then the coefficient on
PE_BACKED should be positive (negative) and significant in regressions where BTD and DTAX
(CASH_ETR and MTR) are the dependent variables.
Equation (1) includes controls for factors that affect a firm’s tax avoidance activity, as
documented by prior research (e.g., Manzon and Plesko 2002; Rego 2003; Dyreng et al. 2008;
Frank et al. 2009; Wilson 2009; Chen et al. 2010). The first set of control variables, which
includes LOSS, NOL, and LEV, controls for a firm’s need to tax plan. We include an indicator
variable, LOSS, as a proxy for current profitability, since profitable firms have greater incentive
to tax plan.13 LOSS equals 1 if a firm’s pre-tax income is less than zero, and 0 otherwise. We
include an indicator variable for the presence of net operating loss carryforwards (NOL) at the
beginning of the year, since firms with loss carryforwards have less incentive to engage in
current year tax planning. We include a firm’s leverage ratio (LEV) because firms with greater
leverage have less need to tax plan due to the tax benefits of debt financing. We also interact
PE_BACKED with LOSS, NOL, and LEV to control for any significantly different rates of LOSS,
NOL, and LEV in PE-backed vs. non-PE-backed private firm-years.
We include an indicator variable for foreign operations (MNC) in equation (1), since
firms with foreign operations have greater opportunities for tax avoidance by shifting income
between high and low tax rate locations (e.g., Rego 2003). MNC equals one if a firm reports
13 When we replace LOSS with alternative measures of profitability, including return on assets, return on net operating assets, and cash flows from operations, results are substantially the same as those tabulated in this study.

17
foreign income or foreign tax expense, and zero otherwise. We control for intangible assets
(INTANG) and equity in earnings of unconsolidated affiliates (EQ_EARN) because these items
often generate differences between book and taxable income and can thus affect our
nonconforming measures of tax avoidance.14 We include sales growth (SALES_GR) in equation
(1) because growing firms likely make larger investments in depreciable assets, which generate
larger temporary book-tax differences. We control for firm size (ASSETS), since large firms
enjoy economies of scale in tax planning, and we include year (YEAR) and industry (INDUS)
fixed-effects to control for fundamental differences in tax planning that may exist across years
and industries.15
Frank et al. (2009) find a strong positive relation between financial and tax reporting
aggressiveness. To the extent our test and control firms exhibit different financial reporting
quality, we need to control for financial reporting quality in equation (1). Katz (2009)
documents that PE-backed firms report more conservatively and engage in less earnings
management compared to non-PE-backed firms. Thus, we control for both timely loss
recognition and earnings management by including AB_ACCR in equation (1). AB_ACCR is the
amount of abnormal accruals after controlling for conservatism in our abnormal accruals
calculation (see Ball and Shivakumar 2006).
Our last control variable is the inverse Mills ratio (INV_MILLS) from the first stage of the
Heckman (1979) sample selection correction procedure. This two-stage estimation procedure
corrects for any endogeneity associated with PE firm investment decisions. In the first stage, we
14 We note that the Pearson correlation between intangible assets and property, plant, and equipment (PPE) is approximately 58 percent. Thus, we do not include both proxies for nondiscretionary sources of book-tax differences in equation (1). When we replace INTANG with PPE, results are qualitatively similar. 15 When we replace ASSETS with SALES our results remain qualitatively similar.

18
estimate the following probit regression (results not tabulated), which predicts whether a private
company is majority- or minority-owned by a PE firm (PE_BACKED):
PE_BACKED = 0 + 1BVE + 2RNOA + 3Q_RATIO + 4OPER_CYCLE +
5FIRM_AGE + 6CASH + 7CAP_EXP + 8BIG_AUDIT + 9LOSS +
10NOL + 11LEV + 12MNC + 13INTANG + 14EQ_EARN +
15SALES_GR + 16AB_ACCR + 17ASSETS + (2)
See Appendix A for complete definitions of the variables included in equation (2). Equation (2)
is based on models of PE ownership in Hochberg (2008), Beuselinck, Deloof, and Manigart
(2009), and Katz (2009). See also Ball and Shivakumar (2005) and Givoly et al. (2010) for a
similar approach in the comparison of private and public firms. We compute the inverse Mills’
ratio for each firm-year observation based on the estimated coefficients for equation (2), and then
include that variable in equation (1), the second stage of the Heckman estimation procedure.16
IV. SAMPLE SELECTION AND EMPIRICAL RESULTS
Sample Selection
Our initial sample consists of private firms that have publicly-traded debt. Because their
debt is public, these firms must file financial statements with the SEC, even though their equity
is privately-held. We follow Katz (2009) and select all firm-year observations on COMPUSTAT
in any of the 28 years from 1978 through 2005 that satisfy the following criteria: (1) the firm’s
stock price at fiscal year-end is unavailable, (2) the firm has total debt as well as total annual
revenues exceeding $1 million, (3) the firm is a domestic company, (4) the firm is not a
16 We estimate the Heckman (1979) two-stage procedure using Lee’s (1979) switching simultaneous equation (see Maddala, 1983, Chapter 9). The use of an endogenous switching regression model (as in Bharath, Sunder and Sunder 2008) produces estimates that are substantially similar to those tabulated in this study. We obtain a 68 percent MacKelvey-Zavonia pseudo-R-square in the first-stage probit regression that accompanies Table 3 (results untabulated), which validates the relevance of our chosen control variables.
19
subsidiary of another public firm, and (5) the firm is not a financial institution or in a regulated
industry (SIC codes 6000-6999 and 4800-4900).
To ensure that the sample includes only private firms with public debt, we examine each
firm and remove public firm observations (details provided in Table 1, Panel A). We further
categorize each firm as being in one of the following categories: (1) PE majority-owned, defined
as firms whose equity is majority-owned (i.e., more than 50 percent) by PE firms (according to
Thomson Financials VentureXpert), (2) PE minority-owned, defined as firms whose equity is
minority-owned (i.e., less than or equal to 50 percent) by PE firms, and (3) management- or
employee-owned, defined as firms that do not have a PE sponsor and are at least 50 percent
owned by founders, executives, directors, family members, or employees. In order to identify
large and small PE firms we follow Katz (2009) and rank the PE firms according to total U.S.
dollar investment during the years 1980-2005, utilizing the Thomson Financials VentureXpert.
The resulting sample consists of 2,615 private firm-year observations and 523 private firms.17
[PLACE TABLE 1 HERE]
To more precisely identify the specific means of tax avoidance used by portfolio firms, we hand-
collect tax footnote information from SEC financial filings. In particular, for each year in our
sample we randomly select three observations of minority-PE-backed firms18 and match them
with both majority-PE-backed firms and non-PE-backed private firms in the same year and the
17 Prior to the 1986 Tax Reform Act, firms could acquire other firms in taxable transactions that would generate a “step-up” in the target company’s adjusted tax basis in assets. Since the 1986 Tax Reform Act, taxable asset acquisitions only generate step-up in asset basis in transactions where the target company also recognizes gain on the sale of assets; consequently, few such transactions occur in the post-1986 time period (Chatfield and Newbould 1996). This differential tax treatment in the pre- and post- 1986 time periods could potentially affect our analyses. Hence, in untabulated sensitivity analyses we both cluster the standard errors in our regression analyses based on firm and year, and run tests excluding firms that engaged in public-to-private transactions between 1980 and 1986. All results are substantially similar to those tabulated in this study. 18 SFAS No. 109 significantly modified the accounting for income taxes and the related tax footnote disclosures. Thus, we hand-collected tax footnote data only for years since SFAS No. 109 went into effect (i.e., 1994 – 2005). To include all minority-PE-backed firms in our sample, we included four observations of minority PE-backed firms for fiscal years 1994 and 1995, instead of the three observations included for fiscal years 1996 – 2005.

20
same four-digit SIC code. If a match is not available in the same four-digit SIC code, we then
find a match in the same three- (or two-) digit SIC code. Thus, our sample of hand-collected
data includes 38 firms that are majority PE-backed, 38 firms that are minority PE-backed, and 38
firms that are non-PE backed.
Results for Tests that Compare PE-Backed and Non-PE-Backed Firm-Years
Table 2 presents descriptive statistics for our samples of PE-backed and non-PE-backed
private firms.19 Panel A contains the statistics for broad firm characteristics, while Panel B
contains statistics for the measures of tax avoidance. There are two rows of data shown for each
variable, where the first row (in bold) contains data for the PE-backed private firm-years and the
second row (not in bold) contains data for the non-PE-backed private firm-years. Panel A shows
that PE-backed private firms are significantly less profitable (e.g., ROA, RNOA, CFO, LOSS, and
NOL) than non-PE-backed firms. This lower profitability (except for RNOA, which measures
profitability but excludes the effect of leverage) could be driven in part by the heavy debt burden
that PE portfolio firms are known to carry. In fact, the results in Panel A indicate that PE-backed
private firms have significantly higher leverage ratios (e.g., mean LEV of 0.706 vs. 0.567) and
incur greater interest expense (e.g., mean INT_EXP of 0.084 vs. 0.071) than non-PE-backed
firms. Panel A also shows that PE-backed private firms are more likely to have foreign
operations (MNC), report more total and intangible assets (ASSETS and INTANG), but fewer
sales (SALES) and smaller abnormal accruals (AB_ACCR) than non-PE-backed firms. This latter
result is consistent with Katz (2009), which finds that PE-backed private firms report lower
abnormal accruals than non-PE-backed firms.
[PLACE TABLE 2 HERE]
19 We winsorize all continuous variables included in the regressions at the 1st and 99th percentiles. The t-statistics have been further adjusted to control for the clustering by multiple firm observations.

21
Panel B presents descriptive statistics for the measures of tax avoidance. The results
indicate that PE-backed firms engage in more tax avoidance than non-PE-backed firms. In
particular, mean BTD, the proxy for the difference between a firms’ pretax book income and its
taxable income, is statistically higher (-0.019 vs. -0.034) for PE-backed than non-PE-backed
private firm-years. Similarly, mean DTAX, a proxy for more aggressive, nonconforming tax
planning, is also significantly higher (-0.049 vs. -0.075) for PE-backed firm-years, while mean
CASH_ETR and mean MTR are significantly lower (0.318 vs. 0.351 and 0.123 and 0.211,
respectively) for PE-backed firm-years.
Panel C presents Pearson and Spearman correlations between the PE_BACKED indicator
variable and each measure of tax avoidance. Consistent with Panel B, the correlations in Panel C
indicate that PE-backed private firm-years engage in more tax avoidance than non-PE-backed
private firm-years. In addition, most of the correlations between the measures of tax avoidance
are as expected (under the assumption that all four variables capture the same underlying
construct). For example, BTD and DTAX should be positively associated with each other and
negatively associated with the effective tax rate measures (CASH_ETR and MTR). Similarly, the
effective tax rate measures should be positively associated with each other. In contrast to
expectations, MTR is positively related to total book-tax differences (BTD).20
Table 3 contains the regression results for tests of H1, which predicts that PE-backed
private firms engage in different levels of tax avoidance than non-PE-backed firms. The
coefficients on all four measures of tax avoidance in Table 3 are significant and suggest that PE-
backed private firms are more tax aggressive than non-PE-backed private firms. That is, the
coefficients on PE_BACKED are significant and positive (negative) in the BTD and DTAX
20 The positive correlation between MTR and BTD is driven in part by firms with negative pre-tax income. Specifically, the correlation between MTR and BTD is 0.125 and significant for firms with negative pre-tax income. In contrast, the correlation is 0.038 and not significantly different from zero for firms with positive pre-tax income.
22
(CASH_ETR and MTR) regressions. This result holds even after controlling for firm
profitability, leverage, and foreign operations, and suggests that PE ownership is an important
determinant of tax avoidance at private firms. Furthermore, the CASH_ETR regression results
indicate that PE-backed firms pay 14.2 percent less income tax per dollar of adjusted pre-tax
income than non-PE-backed private firms, even after controlling for NOLs and leverage. The
14.2 percent translates to $3.603 million in tax savings for the average PE-backed private firm.21
[PLACE TABLE 3 HERE]
Several control variables are also significant in Table 3. Consistent with prior research
(e.g., Graham 1996), the coefficient on LEV is negative and significant in the CASH_ETR and
MTR regressions. This result suggests that firms that are more highly levered have lower cash
and marginal tax rates and perhaps less need for non-debt tax shields. The coefficients on LOSS
and NOL are significantly negative in some regressions, indicating that less profitable firms and
firms with NOLs pay less tax, as indicated by the negative coefficients in the MTR regression,
and hence, have less incentive for tax planning, as indicated by the negative coefficients in the
BTD regression. Consistent with firms with foreign operations having greater opportunities for
tax avoidance, the coefficients on MNC are positive in the BTD and DTAX regressions. The
coefficient on INTANG is significantly positive in the BTD regression, indicating that firms with
more intangible assets have greater book-tax differences and lower cash ETRs. The results in
Table 3 also indicate that abnormal accruals are positively associated with two measures of
nonconforming tax planning (i.e., BTD and DTAX). This result is consistent with Frank et al.
(2009), which finds that financial and tax reporting aggressiveness are strongly positively
21 The BTD and DTAX regressions are based on 2,115 observations with all requisite COMPUSTAT data. The CASH_ETR regression is based on just 939 observations because we require firms to have positive pre-tax income and cash taxes paid in this regression, while the MTR regression is based on just 1,142 observations because MTR data is not available for all observations included in the BTD and DTAX regressions.

23
related, and Phillips et al. (2003), which finds that temporary book-tax differences, which are
embedded in BTD, reflect earnings management activity. Finally, the coefficient on INV_MILLS
is positive but not significant, consistent with sample selection bias having little impact on our
coefficient estimates.22, 23
Results for Majority PE-Backed Private Firms vs. Minority PE-Backed Private Firms
We now turn to the results for tests of H2, which predicts that private firms with majority
PE ownership engage in different levels of tax avoidance than private firms with minority PE
ownership. We empirically capture majority PE ownership in MAJORITY_PE, which equals one
if 50 percent or more of a company is owned by a PE firm, and zero otherwise. Table 4 contains
the descriptive statistics that compare majority and minority PE-backed private firms. Panel A
presents the results for broad firm characteristics, while Panel B presents the results for the
measures of tax avoidance.
[PLACE TABLE 4 HERE]
The statistics in Panel A suggest that majority PE-backed private firms are not
statistically different from minority PE-backed private firms in many respects, including
profitability (ROA, RNOA, CFO, LOSS), leverage (LEV), interest expense (INT_EXP), and
abnormal accruals (AB_ACCR). However, majority PE-backed firms are more likely to have
foreign operations (MNC), report more total and intangible assets (ASSETS and INTANG), but
have lower revenues (SALES). Thus, there are several significant operating differences between
majority and minority PE-backed private firms.
22 Stolzenberg and Relles (1997) argue that if selection bias is moderate then the two-step estimation approach can make estimates worse. In untabulated results we re-estimate equation (1) after excluding INV_MILLS and our primary inferences are unchanged. We lose 18 observations in the equation (1) regression due to missing values needed to compute the INV_MILLS ratio. 23 Tables 2 and 3 compare the tax avoidance of all PE-backed firms to non-PE-backed firms. Untabulated analyses reveal that all results hold for comparisons of both majority PE-backed firms versus non-PE-backed firms and minority PE-backed firms versus non-PE-backed firms, with majority PE-backed firms exhibiting the greatest amount of tax avoidance.

24
Panel B contains descriptive statistics for the measures of tax avoidance. The results
indicate that majority PE-backed firms engage in more tax avoidance than minority PE-backed
firms. In particular, majority PE-backed firms exhibit higher mean book-tax differences (BTD)
and discretionary book-tax differences (DTAX), but lower cash effective tax rates (CASH_ETR)
and marginal tax rates (MTR). The correlations in Panel C are consistent with the results in
Panel B. Specifically, the indicator variable for majority PE-backed firm-years
(MAJORITY_PE) is significantly, positively correlated with BTD and DTAX and significantly,
negatively correlated with CASH_ETR and MTR.
Table 5 contains the regression results for tests of H2. The coefficients on
MAJORITY_PE in all four regressions suggest that majority PE-backed firms engage in more tax
avoidance than minority PE-backed firms. In particular, the coefficients on MAJORITY_PE are
significant and positive in the BTD and DTAX regressions and significant and negative in the
CASH_ETR and MTR regressions. These results are consistent with majority ownership
providing PE firms greater opportunities to promote effective tax strategies at portfolio
companies than minority ownership. Moreover, the CASH_ETR regression results indicate that
firms that are majority-owned by PE firms pay 10.8 percent less income tax per dollar of
adjusted pre-tax income than firms that are minority-owned by PE firms, even after controlling
for variables known to impact cash ETRs, including LEV.24
[PLACE TABLE 5 HERE]
Results for Private Companies that Are Owned by Large vs. Small PE Firms
24 We do not include the INV_MILLS ratio in Tables 5 and 7 because all firms in these analyses are PE-backed. Therefore, the Heckman selection model for the presence of PE financing is no longer relevant. Nonetheless, untabulated results that include the inverse mills ratio are consistent with those presented in Tables 5 and 7.

25
Our last set of analyses test H3, which predicts private firms that are owned by large PE
firms engage in different levels of tax avoidance than private firms that are owned by small PE
firms. We empirically capture ownership by a large PE firm in LARGE_PE, which equals one if
a firm is owned by a large PE firm, and zero otherwise. To identify a PE firm’s size, we rank all
PE firms according to the total cumulative amount of capital investment between 1980 and 2005
as reported in Thomson Financials VentureXpert. The largest 14 PE firms with more than five
billion dollars of cumulative capital investment are considered large PE firms (i.e., LARGE_PE =
1), while the remaining are classified as small PE firms (i.e., LARGE_PE = 0).25
Table 6 contains the descriptive statistics that compare private firms that are owned by
large vs. small PE firms. The results in Panel A indicate private firms that are owned by large
PE firms are similar in many dimensions (e.g., ROA, RNOA, CFO, LOSS, INT_EXP, and
AB_ACCR) to those that are owned by small PE firms. Nonetheless, the mean and median
values in Panel A indicate that private firms that are owned by large PE firms are more likely to
have foreign operations (MNC), report more total and intangible assets (ASSETS and INTANG),
have higher leverage (LEV) and sales growth (SALES_GR), and greater SALES than private firms
owned by small PE firms. Despite the similar rates of profitability between private firms that are
owned by large vs. small PE firms, the results in Panel B suggest private firms that are owned by
large PE firms engage in significantly more tax avoidance than private firms that are owned by
small PE firms. In particular, private firms that are owned by large PE firms have significantly
higher mean BTD and DTAX and significantly smaller mean and median CASH_ETR and MTR
than private firms that are owned by small PE firms. These results are also supported by the
correlations in Panel C.
25 In particular, large PE firms include: Warburg Pincus, Carlyle Group, KKR, Apax, Blackstone, Goldman Sachs, J.P. Morgan, Welsh Carson Anderson & Stone, Hicks Muse Tate & Furst, 3i Group, Bain Capital, Thomas H. Lee, Morgan Stanley, and Cinven. Small PE firms include all other PE firms.

26
[PLACE TABLE 6 HERE]
Table 7 contains the regression results for tests of H3, which predicts private firms that
are owned by large PE firms engage in different levels of tax avoidance than private firms that
are owned by small PE firms. The coefficients on all four measures of tax avoidance suggest
private firms that are owned by large PE firms engage in more tax avoidance than those that are
owned by small PE firms. In particular, the coefficients on LARGE_PE are significant and
positive (negative) in the BTD and DTAX (CASH_ETR and MTR) regressions. These results are
consistent with large PE firms possessing greater expertise and resources to facilitate effective
tax planning at portfolio firms compared to small PE firms. Furthermore, the CASH_ETR
regression results indicate firms that are owned by large PE firms pay 5.9 percent less income tax
per dollar of adjusted pre-tax income than firms that are owned by small PE firms, even after
controlling for NOLs and leverage.
[PLACE TABLE 7 HERE]
Taken together, the results in Tables 2-7 consistently indicate that PE firms possess
greater expertise and resources to promote greater tax avoidance at portfolio firms relative to
other owners of private firms. Majority ownership provides PE firms greater control over their
portfolio firms than minority ownership, and this greater control translates into more tax
avoidance at majority PE-backed firms than minority PE-backed firms. In particular, majority
PE-backed firms pay 10.8 percent less income tax per dollar of pre-tax income than minority PE-
backed firms. In addition, our results suggest that large PE firms possess greater tax expertise
and resources than small PE firms and pay 5.9 percent less income tax per dollar of pre-tax
income. In all of our tests, the benefits of tax planning appear to outweigh any potential
reputational costs for PE firms, since PE firm ownership is consistently associated with greater

27
tax avoidance amongst the sample of privately-held firms. Prior research asserts that PE firms
strictly monitor and control their portfolio firms with the intent of creating economic value (e.g.
Cotter and Peck 2001; Lerner 1995; Renneboog and Simons 2005). Thus, our results are
consistent with PE firms utilizing tax avoidance as a tool to increase shareholder value.
Supplemental Analyses
Robustness Test of Ownership Stake vs. PE Firm Size
To determine whether the results reported in Table 7 are driven by PE ownership stake,
we perform additional analyses that compare private firms that are majority-owned by large vs.
small PE firms, and private firms that are minority-owned by large vs. small PE firms.26 The
untabulated results reveal that inferences from Table 7 generally hold regardless of ownership
stake. Specifically, inferences from Table 7 are unchanged when comparing private firms that
are majority-owned by large vs. small PE firms (with the exception of the coefficient on
LARGE_PE in the DTAX regression, which is positive as expected but has a two-sided t-statistic
of 1.55). Inferences from Table 7 are also similar when comparing private firms that are
minority-owned by large vs. small PE firms; however, the coefficient on LARGE_PE is positive
but no longer significant in the BTD regression (two-sided t-statistics of 1.39). In sum, the
results in Table 7 are not driven by the level of PE ownership; thus, PE firm size and reputation
are important factors, beyond ownership control, for PE firms to have a significant impact on
portfolio firms’ tax planning.
Employee Stock Options
Graham, Lang, and Shackelford (2004) find that employee stock options (ESOs) generate
significant tax savings and reduce marginal tax rates for many large firms, and thus are important
26 Ninety-three percent of firms that are owned by large PE firms are also majority owned, as compared to only sixty-nine percent of firms that are owned by small PE firms.

28
non-debt tax shields. While tax deductions from ESOs reduce cash effective tax rates, they are
not reflected in BTD, DTAX, or MTR. Nevertheless, in untabulated analyses we test whether our
results are sensitive to the tax benefits of ESOs. We control for the tax benefits of ESOs by
calculating the difference between a firm’s traditional effective tax rate and its cash effective tax
rate, which we refer to as ESO_BENEFIT.27 This variable reflects the tax benefits of ESOs, as
well as a firm’s tax contingency (a.k.a., tax cushion) and timing differences caused by estimated
tax payments. Thus, ESO_BENEFIT contains measurement error as a proxy for the tax benefits
of ESOs, but hand-collection of stock option data would be excessively costly. When we include
ESO_BENEFIT and its interaction with PE_BACKED, MAJORITY_PE, and LARGE_PE in the
equation (1) regressions, our results are qualitatively similar to those shown in Tables 3, 5, and 7.
We conclude that our results are not driven by any significant differences in the use of ESOs
between the different groups of private firms.
Inferences from Tax Footnote Data
To more precisely identify the specific methods of tax avoidance used by private firms,
we hand-collected tax footnote information from audited financial reports. In particular, we
hand-collected data regarding the components of: 1) temporary book-tax differences from
deferred tax asset and liability schedules [where positive (negative) values represent net deferred
tax assets (liabilities), which are then scaled by total assets and multiplied by 1,000 to avoid
small values], and 2) “permanent” book-tax differences from statutory reconciliation schedules
[where positive (negative) values represent items that cause a firm’s effective tax rate to be
27 We do not include ESO_BENEFIT in our tabulated regression results because this variable requires firms to have positive pretax income (due to the reliance on cash effective tax rates), and we do not want to limit our sample to firms with positive pretax income.

29
higher (lower) than the statutory U.S. tax rate].28 Three of our measures of tax avoidance, BTD,
DTAX, and CASH_ETR, reflect temporary and/or permanent book-tax differences. Thus, this
analysis reveals the sources of variation in those tax avoidance measures. Table 8 contains
descriptive statistics for the hand-collected data for majority PE-backed, minority PE-backed,
and non-PE-backed private firms.29
[PLACE TABLE 8 HERE]
The results in Table 8 indicate that comparisons of the aggregate measures of tax
avoidance for our hand-collected sub-samples are generally similar to those in Tables 2 and 4
except the t-statistics for differences are smaller, likely due to the smaller sample sizes. In
particular, both PE-backed private firms and majority PE-backed private firms have higher mean
and median BTD and DTAX and lower CASH_ETR and MTR than non-PE-backed private firms,
and minority PE-backed private firms, respectively.
We classified each deferred tax asset and liability disclosed in the tax footnotes in one of
seven categories: 1) accruals and reserves (ACCR_RES), 2) depreciation and amortization
(DEP_AMORT), 3) sale and leaseback transactions (SALE_LEAS), 4) inventory
(INVENTORY), 5) the valuation allowance account (VAA), 6) stock-based compensation
(STOCK_COMP), and 7) other (OTHER). Because changes in deferred tax assets and
liabilities generate deferred tax expense (and benefit), we compute the changes in each of these
deferred tax accounts. Positive values for these items indicate an increase in a deferred tax asset
or a decrease in tax expense. Thus, we expect PE-backed (majority-PE-backed) firms to report
more negative changes in their deferred tax accounts than non-PE-backed (minority-PE-backed)
28 “Permanent” book-tax differences include “traditional” permanent differences (e.g., tax-exempt interest and non-deductible expenses) and other items that cause a firm’s effective tax rate to differ from the U.S. statutory rate (e.g. foreign and state tax rate differentials and tax credits). 29 For brevity, we do not tabulate results for private firms that are owned by large versus small PE firms. For sample selection method see discussion in Section IV.

30
firms, if they engage in nonconforming tax planning that generates a temporary book-tax
difference (such that taxable income is lower than book income).
The results in Table 8 suggest that compared to non-PE-backed firms, PE-backed firms
report smaller changes in deferred tax accounts related to accruals and reserves (ACCR_RES),
sale and leaseback transactions (SALE_LEAS), and other deferred tax assets and liabilities
(OTHER), but larger INVENTORY and STOCK_COMP. The results also suggest that
compared to minority-PE-backed firms, majority-PE-backed firms report smaller ACCR_RES
and OTHER, but larger changes in most other deferred tax accounts. Taken together, we
conclude that to the extent that PE-backed firms systematically avoid taxes in a temporarily
nonconforming manner, then they mainly utilize tax strategies that generate deferred taxes
classified as accruals and reserves, sale and leaseback, and/or other.30
We classified each statutory reconciliation item disclosed in the tax footnotes in one of
nine categories, which include items related to: 1) foreign taxes (FOR_TAX), 2) state taxes
(STATE_TAX), 3) intangible assets (INTANG), 4) tax-exempt income (TAX_EXEMPT), 5) non-
deductible expenses (NONDED_EXP), 6) tax contingencies, aka “tax reserves” (TAX_RESERV),
7) tax credits (TAX_CREDITS), 8) change in the valuation allowance account (VAA)31, and 9)
other (OTHER). Statutory reconciliation schedules contain items that cause a firm’s effective tax
rate to differ from the statutory U.S. tax rate. If a firm engages in nonconforming tax planning
that causes its effective tax rate to be lower than the statutory tax rate, then the firm will report a
30 Examples of ACCR_RES are those related to: prepaid pension costs, benefit plan costs, self-insurance reserves, restructuring and other reserves, reserves not currently deductible, allowance for doubtful accounts, and warranty reserves. Phillips, Pincus, Rego, and Wan (2004) show that these deferred tax assets and liabilities can reflect upward earnings management to meet or beat an earnings target. These findings may not apply to our sample, since Katz (2009) finds that PE-backed firms employ less upward earnings management than non-PE-backed firms. Nonetheless, we control for earnings management in our multivariate regressions. 31 Firms are required to disclose the beginning and ending balance of the valuation allowance account in the deferred tax asset and liability schedule, and if the change in that account is considered material, then it should also be disclosed as a separate item in the statutory reconciliation schedule.

31
negative statutory reconciliation item. Thus, we expect PE-backed (majority-PE-backed) firms
to report more negative statutory reconciliation items than non-PE-backed (minority-PE-backed)
firms, if they avoid taxes in a “permanently” nonconforming manner.
The results in Table 8 suggest that compared to non-PE-backed firms, PE-backed firms
report more negative statutory reconciliation items related to foreign taxes (FOR_TAX),
intangible assets (INTANG), tax-exempt income (TAX_EXEMPT), and tax credits
(TAX_CREDIT). Except for TAX_CREDIT, the results are similar for the comparison of
majority-PE-backed and minority-PE-backed firms. The differences in INTANG are likely
caused – at least in part – by the different financial and tax accounting rules for goodwill, rather
than tax avoidance.32 The differences in FOR_TAX are likely caused by U.S. tax avoidance
through low-tax foreign operations, and the differences in TAX_EXEMPT and TAX_CREDIT are
also likely reflective of common tax strategies.33 In sum, the results in Table 8 indicate that PE-
backed firms utilize foreign operations, tax-exempt investments, as well as tax credits to reduce
their tax liabilities.
V. CONCLUSION
This study investigates the tax planning at firms with different private ownership
structures. In particular, we examine whether PE-backed private firms engage in more or less
tax avoidance than other privately-held firms. Our results indicate that PE-backed firms engage
32 Because non-PE-backed firms and minority-PE-backed firms report positive INTANG on average (while PE-backed and majority-PE-backed firms report negative INTANG on average), we infer that the statistical differences in INTANG across the sub-samples are caused – at least in part – by the different book and tax accounting rules for goodwill, rather than tax avoidance. A positive statutory reconciliation item related to intangibles is consistent with the existence of goodwill for book purposes but not for tax purposes, a common phenomenon since the 1986 Tax Reform Act. This result underscores the importance of controlling for intangible assets that cause book-tax differences but are not related to tax avoidance in our multivariate regressions. 33 Although many firms in our hand-collected sub-samples used the generic terms “income exempt from tax” and “tax-exempt income”, one firm disclosed a negative statutory reconciliation item for “increase in cash surrender value of officers’ life insurance”, consistent with the use of corporate-owned life insurance policies as a tax planning tool.

32
in significantly more nonconforming tax planning and have lower marginal tax rates than other
private firms. We find that PE-backed firms pay 14.2 percent less income tax per dollar of
adjusted pre-tax income than non-PE-backed private firms, even after controlling for the
presence of NOLs and debt tax shields. In addition, we find that majority PE-backed firms
engage in more tax avoidance than minority PE-backed firms and that portfolio firms that are
owned by larger PE firms engage in more tax avoidance than portfolio firms that are owned by
smaller PE firms. Results from the tax footnote analyses are consistent with portfolio firms
using sale and leaseback transactions, foreign operations, tax-exempt investments, and tax credits
to reduce their income taxes.
Taken together, our results are consistent with PE firms having the resources and
expertise to promote greater tax avoidance at portfolio firms, and this effect is magnified for
portfolio firms that are either majority-owned or owned by larger PE firms. Our results are also
consistent with the benefits of tax planning outweighing the associated costs for our PE portfolio
firms (and their PE firm owners), including any potential reputational costs associated with
aggressive tax avoidance.
To our knowledge, this is the first study to compare the tax practices of firms with
different private ownership structures and to document that PE firms utilize tax planning in their
portfolio firms as an additional source of economic value, above and beyond debt tax shields.
Our study should be of interest to tax regulators that are concerned with the tax practices of
private firms in general and PE-backed firms in particular, and to researchers that are interested
in the impact of ownership structure on tax avoidance activity. In addition, our investigation into
the tax practices of companies owned by PE firms should be of interest to critics that contend PE
firms extract excessive tax benefits from their portfolio firms.

33
REFERENCES
Acharya, V., M. Hahn, and C. Kehoe. 2009. Corporate governance and value creation evidence from private equity. Working paper, London Business School.
American Institute of Certified Public Accountants (AICPA). 2004. Private company financial
reporting. Discussion paper. Available at: http://www.aicpa.org/download/news/2004/Discussion_Paper_5-10-04.pdf, accessed June 3, 2007.
Badertscher, B., S. Katz, and S. Rego. 2010. The impact of public ownership of equity on
corporate tax avoidance. Working paper, University of Notre Dame. Badertscher, B., J. Phillips, M. Pincus, and S. Rego. 2009. Evidence on motivations for
downward earnings management. Working paper, University of Iowa. Ball, R., and L. Shivakumar. 2005. Earnings quality in UK private firms: Comparative loss
recognition timeliness. Journal of Accounting and Economics 39 (1): 83–128. Ball, R. and L. Shivakumar. 2006. The role of accruals in asymmetrically timely gain and loss
recognition. Journal of Accounting Research 44 (2): 207–242. Beatty, A. and D. Harris. 1998. The effects of taxes, agency costs and information asymmetry on
earnings management: A comparison of public and private firms. Review of Accounting Studies 4 (3/4): 299-326.
Behind The Buyout, Inside the World of Private Equity. 2007. Private equity and taxes. Available
at: http://www.behindthebuyouts.org/private-equity-and-taxes/, accessed November 9, 2008.
Beuselinck, C., M. Deloof, and S. Manigart. 2009. Private equity involvement and earnings
quality. Journal of Business Finance and Accounting 36 (5/6): 587-615. Bharath, S. T., J. Sunder, and S. V. Sunder. 2008. Accounting quality and debt contracting. The
Accounting Review 83 (1): 1–28. Cazier, R., S. Rego, X. Tian, and R. Wilson. 2009. Early evidence on the determinants of
unrecognized tax benefits. Working paper, University of Iowa Cao, J. and J. Lerner. 2009. The performance of reverse leveraged buyouts. Journal of Financial
Economics 91 (2): 139-157. Chatfield, R. and G. Newbould. 1996. Leveraged buyouts: Implications for U.S. Treasury tax
receipts. Quarterly Journal of Business & Economics 35 (1): 51-65.

34
Chen, S., X. Chen, Q. Cheng, and T. Shevlin. 2010. Are family firms more tax aggressive than non-family firms? Journal of Financial Economics 95 (1): 41-61.
Cloyd, B., J. Pratt, and T. Stock. 1996. The use of financial accounting choice to support
aggressive tax positions: Public and private firms. Journal of Accounting Research 34 (1): 23- 43.
Cotter, J. and S. Peck. 2001. The structure of debt and active equity investors: The case of the
buyout specialist. Journal of Financial Economics 59 (1): 101–147. Crocker, K., and J. Slemrod. 2005. Corporate tax evasion with agency costs. Journal of Public
Economics 89 (9/10): 1593-1610, Cunningham, N. and M. Engler. 2008. The carried interest controversy: Let's not get carried
away. Tax Law Review, Cardozo Legal Studies Research Paper No. 211. Desai, M. 2003. The divergence between book and tax Income. Tax Policy and the Economy, J.
M. Poterba (ed.), (Cambridge, MA: MIT Press) 17:169–206. Desai, M. and D. Dharmapala. 2007. Corporate tax avoidance and firm value. Working paper,
Harvard University. Desai, M., A. Dyck, and L. Zingales. 2007. Theft and taxes. Journal of Financial Economics 84
(3): 591–623. Dyreng, S., M. Hanlon, and E. Maydew. 2008. Long-Run Corporate Tax Avoidance. The
Accounting Review 83 (1): 61-82 Dyreng, S., M. Hanlon, and E. Maydew. 2009. The effects of managers on corporate tax
avoidance. Working paper, Duke University, University of Michigan, University of North Carolina.
Fleischer, V. 2008. Two and twenty: Taxing partnership profits in private equity funds.
Forthcoming in New York University Law Review. Fleischer, V. 2007. Taxing Blackstone. University of Illinois Law & Economics Research Paper
No. 07-036. Frank, M., L. Lynch, and S. Rego. 2009. Tax reporting aggressiveness and its relation to
aggressive financial reporting. The Accounting Review 84 (2): 467-496. Frank, M., L. Lynch, S. Rego, and H. Wan. 2004. Decomposing changes in deferred tax assets
and liabilities to isolate earnings management activities. Journal of the American Taxation Association 26 (Supplement): 43-66.

35
Fraser-Sampson, G. 2007. Private equity as an asset class. Chichester, West Sussex, England: John Wiley & Sons, Ltd.
Fruhan, W. 2009. Role of private equity firms in merger and acquisition transactions. Harvard
Business School Technical Note # 9-206-101 (July): 1-15. Givoly, D., C. Hayn, and S. Katz. 2009. Does public ownership of equity improve earnings
quality? The Accounting Review 85 (1): 195-225. Graham, J. R. 1996. Debt and the marginal tax rate. Journal of Financial Economics 41(1): 41-
73. Graham, J., M. Lang, and D. Shackelford. 2004. Employee stock options, corporate taxes, and
debt policy. Journal of Finance 59 (4): 1585-1618. Graham, J., M. Lemmon, and J. Schallheim. 1998. Debt, leases, taxes, and the endogeneity of
corporate tax status. Journal of Finance 53 (1): 131-162. Graham, J., and A. Tucker. 2006. Tax shelters and corporate debt policy. Journal of Financial
Economics 81 (3): 563-594. Hanlon, M. 2003. What can we infer about a firm's taxable income from its financial statements?
National Tax Journal 56 (4): 831-864. Hanlon, M. 2005. The persistence and pricing of earnings, accruals, and cash flows when firms
have large book-tax differences. The Accounting Review 80 (1): 137-166. Hanlon, M., and S. Heitzman. 2009. A review of tax research. Working Paper, Massachusetts
Institute of Technology and University of Rochester. Hanlon, M., and J. Slemrod. 2009. What does tax aggressiveness signal? Evidence from stock
price reactions to news about tax shelter involvement. Journal of Public Economics 93 (1/2): 126-141.
Heckman, J. 1979. Sample selection bias as a specification error. Econometrica 47 (1): 153–162. Hochberg, Y. 2008. Venture capital and corporate governance in the newly public firm. Working
paper, Northwestern University. Hribar, P., and D. Collins. 2002. Errors in estimating accruals: Implications for empirical
research. Journal of Accounting Research 40 (1): 105–134. Hutton, W. 2009. Behind tax avoidance lies an ideologoy that has had its day. The Guardian,
February, 14, 40.
36
Jensen, M. 1986. Agency costs of free cash flow, corporate finance, and takeovers. American Economic Review 76 (2): 323-329.
Jensen, M., and K. Murphy. 1990. Performance pay and top-management incentives. Journal of
Political Economy 98 (2): 225-264. Jones, J. 1991. Earnings management during import relief investigations. Journal of Accounting
Research 29 (2): 192–228. Kaplan S. 1989. Management buyouts: Evidence on taxes as a source of value. Journal of
Financial Economics 24 (2): 217-254. Kaplan S. 2009. The future of private equity. Journal of Applied Corporate Finance 21(3): 8-20. Kaplan S. and P. Stromberg. 2009. Leveraged buyouts and private equity. Journal of Economic
Perspectives 23 (1): 121-146. Katz, S. 2009. Earnings quality and ownership structure: The role of private equity sponsors. The
Accounting Review 84 (3): 623-658. Knoll, M. 2007. The taxation of private equity carried interests: estimating the revenue effects of
taxing profit interests as ordinary income. Working Paper, University of Pennsylvania Law School.
Lawton, A. 2008. Taxing private equity carried interest using an incentive stock option analogy.
Harvard Law Review 121 (3): 846. Lee, L. 1979. Identification and estimation in binary choice models with limited (censored)
dependent variables. Econometrica 47 (4), 977-996. Lerner, J. 1995. Venture capitalists and the oversight of private firms. Journal of Finance 50 (1):
301–318. Lim, J. 2006. Lone Star's offices in Korea raided as part of tax probe. The Wall Street Journal.
March 31, J, C4. Lumbis, P. 2009. Perfect partners. Reinsurance, March 17, 6. Maddala, G. 1983. Limited-dependent and Qualitative Variables in Econometrics. Cambridge
University Press, Cambridge, UK. Manzon, G. and G. Plesko. 2002. The relation between financial and tax reporting measures of
income.” Tax Law Review 55 (2): 175 - 214.

37
Masulis, R., and R. Thomas. 2009. Does private equity create wealth? The effects of private equity and derivatives on corporate governance. University of Chicago Law Review 76 (1): 219-259.
Mikhail, M. 1999. Coordination of earnings, regulatory capital and taxes in private and public
companies. Working Paper, Massachusetts Institute of Technology Mills, L. 1998. Book-Tax Differences and Internal Revenue Service Adjustments. Journal of
Accounting Research 36 (2): 343-356. Nissim, D. and S. Penman. 2003. Financial statement analysis of leverage and how it informs
about profitability and price-to-book ratios. Review of Accounting Studies 8 (4): 531–559. Penno, M. and D. Simon. 1986. Accounting choices: Public versus private firms. Journal of
Business Finance & Accounting 13 (4): 561-569. Phillips, J., M. Pincus, and S. Rego. 2003. Earnings management: New evidence based on
deferred tax expense. The Accounting Review 78 (2): 491-521. Rego, S. 2003. Tax-avoidance activities of U.S. multinational corporations. Contemporary
Accounting Research 20 (4): 805-833. Renneboog, L., and T. Simons. 2005. Public-to-private transactions: LBOs, MBOs, MBIs, and
IBOs. Working paper, Tilburg University and McKinsey & Co., Inc. (Amsterdam office). Robinson, J., S. Sikes, C. Weaver. 2009. Performance measurement of corporate tax
departments. Forthcoming, The Accounting Review. Schipper, K. and A. Smith. 1991. Effects of management buyouts on corporate interest and
depreciation tax deductions. Journal of Law and Economics 34 (2): 295–341. Shackelford, D. and T. Shevlin. 2001. Empirical tax research in accounting. Journal of
Accounting and Economics 31 (1-3): 321-387. Shevlin, T. 2002. Symposium on corporate tax shelters part II: Commentary: Corporate tax
shelters and book-tax differences. New York University Tax Review 55 (Spring): 427. Stolzenberg, R. and D. Relles. 1997. Tools for intuition about sample selection bias and its
correction. American Sociological Review 62 (June): 494-507. Stromberg P. 2008. The new demography of private equity. Working paper, Swedish Institute for
Financial Research. U.S. Congress. Joint Committee on Taxation. 1999. Study of present-law penalty and interest
provisions as required by Section 3801 of the Internal Revenue Service restructuring and

38
reform act of 1998 (Including provisions relating to corporate tax shelters). JCS 3-99, Washington, D.C.: Government Printing Office.
Weisbach, D. 2002. Ten truths about tax shelters. Tax Law Review 55 (2): 215 - 253. Wilson, R. 2009. An examination of corporate tax shelter participants. The Accounting Review
84 (3): 969-999.

39
APPENDIX A Variable Measurement
Measures of Tax Avoidance: BTD = Firm i’s book-tax differences, which equal book income less taxable income scaled
by lagged total assets. Book income is pre-tax income (#170) in year t. Taxable income is calculated by summing current federal tax expense (#63) and current foreign tax expense (#64) and dividing by the statutory tax rate (STR) and then subtracting the change in NOL carryforwards (#52) in year t. If current federal tax expense is missing, total current tax expense is calculated by subtracting deferred taxes (#50), state income taxes (#173) and other income taxes (#211) from total income taxes (#16) in year t.
DTAX = Firm i’s residual from the following regression, estimated by industry and year:
PERMDIFFit = 0 + 1 INTANGit + 2 UNCONit + 3 MIit + 4 CSTEit + 5 NOLit + 6 LAGPERMit + eit; where PERMDIFF = Total book-tax differences – temporary book-tax differences = [{BI – [(CFTE +CFOR) / STR]} – (DTE / STR)], scaled by beginning of year assets (#6); BI = pretax book income (#170); CFTE = current federal tax expense (#63); CFOR = current foreign tax expense (#64); STR = statutory tax rate; DTE = deferred tax expense (#50); INTANG = goodwill and other intangible assets (#33), scaled by beginning of year assets (#6); UNCON = income (loss) reported under the equity method (#55), scaled by beginning of year assets (#6); MI = income (loss) attributable to minority interest (#49), scaled by beginning of year assets (#6); CSTE = current state tax expense (#173), scaled by beginning of year assets; NOL = change in net operating loss carryforwards (#52), scaled by beginning of year assets (#6); LAGPERM = PERMDIFF in year t-1.
CASH_ETR = Firm i’s cash effective tax rate, which equals cash taxes paid (Compustat #317),
divided by pretax net income (#170) minus special items (#17) in year t. CASH_ETR is set to missing when the denominator is zero or negative. We truncate CASH_ETR to the range [0,1].
MTR = After financing marginal tax rate, which equals the simulated marginal tax rate after
both depreciation and financing related tax shields (Graham 1996; Graham , Lemmon and Schallheim 1998).
Private Firm Indicator Variables: PE_BACKED = 1 if a PE firm has a majority or minority ownership stake in a private company and 0
otherwise.
LARGE_PE = 1 if the firms is one of the following: Warburg Pincus, Carlyle Group, KKR, Apax, Blackstone, Goldman Sachs, J.P. Morgan, Welsh Carson Anderson & Stone, Hicks Muse Tate & Furst, 3i Group, Bain Capital, Thomas H. Lee, Morgan Stanley, and Cinven and 0 for all other PE firms. PE firms are ranked according to total U.S. dollar investment during the years 1980-2005. (Source: Thomson Financials, VentureXpert.)
MAJORITY_PE = 1 if 50 percent or more of the firm is backed by private equity firms and 0 otherwise.

40
Control Variables and Other Variables of Interest: LEV = Firm i’s leverage in year t, measured as total debt (#9+#34) divided by total assets
(#6);
LOSS = 1 if firm i reports a loss, where loss is net income before extraordinary items (#123) and 0 otherwise.
NOL = 1 if firm i has net operating loss carryforwards (#52) available at the beginning of
year t, and 0 otherwise.
MNC =1 if firm i has foreign income taxes or refunds (#64) or foreign pretax income or loss (#273) in year t, and 0 otherwise.
INT_EXP = Firm i’s interest expense (#15) in year t, scaled by lagged total assets
INTANG = Firm i’s intangible assets (#33) in year t, scaled by lagged total assets.
EQ_EARN = Firm i’s equity income in earnings (#55) in year t, scaled by lagged total assets.
SALES_GR = Firm i’s sales growth, where sales growth is sales (#12) at the end of year t minus
sales at the beginning of year t divided by sales at the beginning of year t.
AB_ACCR = Firm i’s abnormal total accruals in year t computed derived from the modified cross-sectional Jones (1991) model. To estimate the model yearly by two-digit SIC code, we require that at least 10 observations be available. The regression is: TACCj,t / TAj, t–1 = a1*[1 / TAj, t–1] + a2*[(ΔREVj, t – ΔTRj, t)/TAj, t–1] + a3*[PPEj, t / TAj, t–1] where: TACC is total accruals for firm j in year t, which is defined as income before extraordinary items (#123) minus net cash flow from operating activities, adjusted to extraordinary items and discontinued operations (#308 – #124). For the years prior to 1988, TACC is defined as Δ(current assets #4) – Δ(current liabilities #5) – Δ(cash #1) + Δ(short-term debt #34) – (depreciation and amortization #125). To correct for measurement errors in the balance-sheet approach, we eliminate firm-year observations with "non-articulating" events (Hribar and Collins 2002). TA is the beginning-of-the-year total assets (lagged #6). ΔREV is the change in sales in year t (#12), PPE is gross property, plant, and equipment in year t (#7), and ΔTR is the change in trade receivables in year t (#151). To control for the asymmetric recognition of gains and losses, the modified Jones model is augmented with the following independent variables: cash flow from operations in year t (CFt), a dummy variable set to 1 if CFt <1 and 0 otherwise (DCFt), and an interactive variable, CFt × DCFt (as suggested by Ball and Shivakumar 2006). CFt is defined, for years after 1988, as cash from operations in year t adjusted for extraordinary items and discontinued operations (#308 – #124), and prior to 1988 as funds from operations (#110) – Δ(current assets #4) + Δ(cash and cash equivalent #1) + Δ(current liabilities #5) – Δ(short-term debt #34). All variables are standardized by total assets at year-end t-1.
ROA = Firm i’s income before extraordinary items (#18) in year t divided by lagged total
assets.

41
RNOA = Firm i’s return on net operating assets defined as operating income divided by net operating assets. Operating income is net income (#172) + Δ(cumulative translation adjustment #230) + after-tax interest expense (#15) – after-tax interest income (#62) + minority interest in income (#49). Net operating assets (NOA) are common equity (#60) + debt in current liabilities (#34) + total long-term debt (#9) + preferred stock (#130) – cash and short-term investments (#1) – investments and advances (#32) + minority interest (#38); (see Nissim and Penman 2003).
SALES = Firm i’s total sales (#12) for year t.
CFO = Firm i’s cash flows from continuing operations (#308 - #124) for year t, scaled by
lagged total assets.
ASSETS = Natural logarithm of the total assets (#6) for firm i, at the end of year t.
INV_MILLS = The inverse mills ratio from Heckman (1979) two-stage sample selection correction procedure. In the first stage, we estimate the following probit model (results not tabulated):
PE_BACKED = 0 + 1BVE + 2RNOA + 3Q_RATIO + 4OPER_CYCLE +
5FIRM_AGE + 6CASH + 7CAP_EXP + 8BIG_AUDIT + 9LOSS + 10NOL + 11LEV + 12MNC + 13INTANG + 14EQ_EARN + 15SALES_GR + 16AB_ACCR +17ASSETS +
Where: BVE = book value of equity (Compustat #60t + #130t + #35t, scaled by #6t-
1); RNOA = profitability (defined as operating income divided by net operating assets, see above), Q_RATIO = quick ratio [cash and short-term investments (#1t) + total receivables (#2t), scaled by current liabilities (#5t)], OPER_CYCLE = length of operating cycle [calculated as (yearly average accounts receivable (#2t)) / (total revenues (#12t)/360) + (yearly average inventory (#3t)) / (cost of goods sold(#41t)/360)], FIRM_AGE = firm age (years since first appearance on Compustat), CASH = cash holdings (#1t scaled by #6t-1), CAP_EXP = capital expenditures (#128t) scaled by #6t-1, LOSS = 1 if net income (#172) less than zero, and 0 otherwise; and BIG_AUDIT = an indicator variable for large accounting firms (#149t). All other variables as defined above. We use the estimates from the first-stage probit model to compute the inverse Mills’ ratio for each sample firm-year. The inverse Mills’ ratio serves as a control variable in equation (1), which is the second step of the Heckman estimation procedure.34
STR = Firm i’s statutory tax rate. From 1980 to 1986 the STR is 46%, for 1987 the STR is
40%, from 1988 to 1992 the STR is 34%, from 1993 to 2005 the STR is 35%.
34 Inverse Mills ratio is defined as: λ(Z) = φ(Ζ)/Ф(Z) if private or PE-backed = 1, and λ(Z) = -φ(Ζ)/(1 − Ф(Z)) if private or PE-backed = 0, where: φ(Ζ) is the standard normal pdf, Ф(Z) is the standard normal cdf, and Z are the estimates of the first stage probit model.

42
FIGURE 1 Diagram of Typical Organizational Structure for a Private Equity Firm with One PE Fund and Four PE Portfolio Firms
* Approximately ten percent of the total gain is usually distributed to the management team as part of performance based compensation, reducing the investors’ share to approximately seventy percent (Fruhan 2009)
Private Equity Firm
“Manager” (General Partner)
LP, LLP, LLC
Investors
(Limited Partners)
Private Equity
Investment Fund
LP, LLP, LLC
Portfolio
Firm #1
Portfolio
Firm #2
Portfolio
Firm #3
Portfolio
Firm #4
80% of gain*
(Upon Sale/IPO of Portfolio Firm)
20% of gain (“carried interest”)
(Upon Sale/IPO of Portfolio Firm)
90 – 95% 5 – 10%

43
TABLE 1
Sample Selection Procedures for Private Firms with Public Debt (1980 – 2005)
No. of Firm-year
Observations No. of Firms“Potential” private firms with public debt (COMPUSTAT)a
13,062 3,355
Eliminate firms that:
Do not have historical (non-prospectus) datab (3,233) (1,242)
Are public firms (2,324) (371)
Are subsidiaries of public firms (561) (102)
Are public spin-offs (111) (34)
Are involved in bankruptcy proceedings (295) (100)
Have insufficient information (1,683) (344)
Are foreign firms (772) (184)
Otherc (918) (396)
Subtotal of private firms with public debt 3,165 582
Eliminate firms that: Are cooperatives, LPs, government-owned and firms for which ownership structure cannot be ascertained
(550) (59)
Private firms with public debt 2,615 523
Private firms that are majority-owned by PE firms 1,404 318
Private firms that are minority-owned by PE firms 339 75
Private firms without PE ownership 872 130
a The sample of “potential” private firms with public debt consists of all firm-year observations on Compustat in any year from 1978 to 2005 that satisfy the following criteria: (1) the firm’s stock price at fiscal year-end is unavailable, (2) the firm has total debt as well as total revenues exceeding $1 million, (3) the firm is a domestic company, (4) the firm is not a subsidiary of another public firm, and (5) the firm is not a financial institution or in a regulated industry (SIC codes 6000-6999 and 4800-4900).
b Compustat reports three years of historical information for public firms that file for initial public offering. This financial information is taken from the prospectus.
c “Other” includes observations of the same firm with different names, firms that do not have information for consecutive years, firms that have joint ventures and partnerships with public firms, holding companies of public firms, and observations with information available only for the years 1978-1979.

44
TABLE 2
Descriptive Statistics that Compare PE-Backed Private Firms (Upper Rows, in Bold) to Non-PE-Backed Private Firms (Lower Rows, No Bold)
Panel A: Descriptive Statistics for Firm Characteristics 25th 75th Standard Difference between: # Obs Percentile Mean Median Percentile Deviation Mean Median ROA 1,743 -0.039 -0.004 0.000 0.039 0.262 -0.071*** -0.025** 872 -0.001 0.068 0.026 0.114 0.461 RNOA 1,743 -0.068 -0.029 -0.012 0.038 0.163 -0.108*** -0.052** 872 -0.010 0.079 0.040 0.140 0.185 CFO 1,649 0.017 0.065 0.054 0.098 0.099 -0.019*** -0.011*** 722 0.027 0.084 0.065 0.145 0.115 LOSS 1,743 0.000 0.557 1.000 1.000 0.497 0.226*** 1.000*** 872 0.000 0.331 0.000 1.000 0.448 NOL 1,743 0.000 0.347 0.000 1.000 0.476 0.139*** 0.000 872 0.000 0.208 0.000 0.000 0.388 LEV 1,743 0.518 0.706 0.673 0.819 0.363 0.139*** 0.091*** 872 0.193 0.567 0.582 0.688 0.334 INT_EXP 1,743 0.057 0.084 0.082 0.105 0.042 0.013* 0.015* 872 0.027 0.071 0.067 0.087 0.043 MNC 1,743 0.000 0.447 0.000 1.000 0.498 0.124*** 0.000 872 0.000 0.323 0.000 1.000 0.468 INTANG 1,743 0.000 0.258 0.156 0.356 0.446 0.118*** 0.153*** 872 0.000 0.140 0.003 0.125 0.406 EQ_EARN 1,743 0.000 0.001 0.000 0.000 0.008 -0.003 0.000 872 0.000 0.004 0.000 0.000 0.103 SALES_GR 1,743 -0.035 0.097 0.004 0.103 0.695 -0.016 -0.020

45
872 -0.007 0.113 0.024 0.121 0.644 AB_ACCR 1,416 -0.058 -0.025 -0.018 0.018 0.099 -0.026*** -0.021*** 717 -0.026 0.001 0.003 0.032 0.078 SALES 1,743 227 773 430 836 1,204 -292*** 46** 872 188 1,065 384 1,060 2,921 ASSETS 1,743 5.325 5.922 5.926 6.500 1.060 0.192*** 0.240*** 872 4.980 5.730 5.686 6.620 1.420 Panel B: Descriptive Statistics for Measures of Tax Avoidance 25th 75th Standard Difference between: # Obs Percentile Mean Median Percentile Deviation Mean Median BTD 1,743 -0.048 -0.019 -0.013 0.007 0.078 0.015*** 0.002 872 -0.022 -0.034 -0.015 0.032 0.071 DTAX 1,743 -0.081 -0.049 0.011 0.094 0.249 0.026** 0.016* 872 -0.032 -0.075 -0.005 0.078 0.323 CASH_ETR 684 0.085 0.318 0.264 0.450 0.282 -0.033** -0.034** 436 0.104 0.351 0.298 0.441 0.271 MTR 732 0.000 0.123 0.024 0.292 0.146 -0.088*** -0.256*** 508 0.024 0.211 0.280 0.350 0.165 *,**,*** indicates significance at the 10%, 5%, and 1% level, respectively. Differences between means are tested for significance using a two-tailed t-test; differences in medians are tested for significance using a two-tailed Wilcoxon signed rank test. All variables are as defined in Appendix A. Panel C: Pearson (Spearman) Correlation Coefficients for PE_BACKED and Measures of Tax Avoidance PE_BACKED BTD DTAX CASH_ETR MTR
PE_BACKED ---- 0.067*** 0.078*** -0.064*** -0.329***
BTD 0.071*** ---- 0.027 -0.383*** 0.366***
DTAX 0.067** 0.067** ---- 0.019 -0.084***
CASH_ETR -0.060** -0.557*** -0.001 ---- 0.054*
MTR -0.317*** 0.416*** 0.017 0.106** ----

46
TABLE 3
Results for OLS Regressions of Measures of Tax Avoidance on Indicator Variable for PE Ownership (PE_BACKED) and Controls for Determinants of Corporate Tax Avoidance, where the Comparison Sample is a Sample of Non-PE-Backed
Private Firms
BTD DTAX CASH_ETR MTR
Coeff T-Stat Coeff T-Stat Coeff T-Stat Coeff T-Stat
Intercept -0.002 -0.16 0.071 1.99** 0.367 7.02*** 0.326 17.18***
PE_BACKED 0.011 1.81* 0.033 1.87* -0.142 -4.16*** -0.087 -6.19***
LOSS -0.072 -10.58*** -0.005 -0.17 -0.135 -8.27***
LOSS×PE_BACKED 0.001 0.06 -0.001 -0.04 0.007 0.44
NOL -0.011 -1.58 0.036 1.12 -0.053 -1.51 -0.198 -13.75***
NOL×PE_BACKED 0.007 0.90 0.050 1.29 0.039 0.85 0.087 5.36***
LEV 0.010 0.94 0.027 0.67 -0.239 -5.31*** -0.093 -5.02***
LEV×PE_BACKED 0.003 0.24 0.009 0.19 0.305 5.12*** 0.081 3.95***
MNC 0.016 6.09*** 0.026 1.56 -0.089 -4.77*** -0.012 -1.05
INTANG 0.019 1.77* -0.055 -3.65*** 0.009 0.57
EQ_EARN 0.038 9.65*** -0.001 -0.02 0.021 2.67***
SALES_GR -0.014 -2.69*** 0.008 0.65 -0.032 -2.61*** 0.015 0.99
AB_ACCR 0.218 5.62*** 0.422 3.16*** -0.089 -0.51 -0.006 -0.14
ASSETS 0.005 2.83*** -0.006 -1.21 0.005 0.64 0.002 0.83
INV_MILLS 0.031 1.12 -0.015 -0.028 0.071 1.04 0.020 0.74
Adjusted R-Squared 0.3656 0.0714 0.1609 0.4823
N 2,115 2,115 939 1,142 *,**,*** indicates significance at the 10%, 5%, and 1% level, respectively. All variables are as defined in Appendix A. Regressions include industry and year indicator variables, which have not been tabulated. The t-statistics have been adjusted to control for the clustering by multiple firm observations.

47
TABLE 4
Descriptive Statistics that Compare Majority-Owned PE-Backed Private Firms (Upper Rows, in Bold) to Minority-Owned PE-Backed Private Firms (Lower Rows, No Bold)
Panel A: Descriptive Statistics for Firm Characteristics 25th 75th Standard Difference between: # Obs Percentile Mean Median Percentile Deviation Mean Median ROA 1,404 -0.039 -0.003 0.000 0.039 0.286 0.003 -0.002 339 -0.033 -0.006 0.002 0.046 0.128 RNOA 1,404 -0.069 -0.029 -0.012 0.039 0.155 0.002 0.001 339 -0.057 -0.031 -0.013 0.036 0.193 CFO 1,335 0.014 0.065 0.053 0.098 0.099 -0.005 -0.006 314 0.026 0.069 0.059 0.100 0.097 LOSS 1,404 0.000 0.554 1.000 1.000 0.497 -0.015 0.000 339 0.000 0.569 1.000 1.000 0.569 NOL 1,404 0.000 0.362 0.000 1.000 0.481 0.075*** 0.000 339 0.000 0.287 0.000 1.000 0.453 LEV 1,404 0.511 0.704 0.671 0.822 0.357 -0.010 -0.014 339 0.541 0.714 0.685 0.808 0.387 INT_EXP 1,404 0.054 0.083 0.079 0.104 0.042 -0.007 -0.008 339 0.068 0.090 0.087 0.111 0.037 MNC 1,404 0.000 0.479 0.000 1.000 0.498 0.161*** 0.000 339 0.000 0.318 0.000 1.000 0.466 INTANG 1,404 0.001 0.283 0.173 0.387 0.485 0.124*** 0.120*** 339 0.000 0.159 0.053 0.271 0.211 EQ_EARN 1,404 0.000 0.001 0.000 0.000 0.008 0.001 0.000 339 0.000 0.000 0.000 0.000 0.002 SALES_GR 1,404 -0.043 0.099 0.000 0.100 0.743 0.005 -0.022

48
339 -0.019 0.094 0.022 0.110 0.462 AB_ACCR 1,137 -0.058 -0.025 -0.018 0.018 0.099 0.002 -0.002 279 -0.054 -0.027 -0.016 0.015 0.102 SALES 1,404 225 732 422 814 1,104 -206** -28 339 238 938 450 898 1,529 ASSETS 1,404 5.367 5.950 5.960 6.530 0.970 0.110* 0.245** 339 5.220 5.840 5.715 6.340 1.010 Panel B: Descriptive Statistics for Measures of Tax Avoidance 25th 75th Standard Difference between: # Obs Percentile Mean Median Percentile Deviation Mean Median BTD 1,404 -0.049 -0.013 -0.013 0.008 0.078 0.030*** 0.005 339 -0.051 -0.043 -0.018 0.005 0.079 DTAX 1,404 -0.095 -0.043 0.011 0.115 0.241 0.030** 0.016** 339 -0.054 -0.073 -0.004 0.053 0.261 CASH_ETR 553 0.081 0.302 0.249 0.417 0.288 -0.083*** -0.068*** 131 0.141 0.385 0.317 0.562 0.322 MTR 560 0.000 0.115 0.021 0.271 0.141 -0.032*** -0.048*** 172 0.000 0.147 0.069 0.324 0.131 *,**,*** indicates significance at the 10%, 5%, and 1% level, respectively. Differences between means are tested for significance using a two-tailed t-test; differences in medians are tested for significance using a two-tailed Wilcoxon signed rank test. All variables are as defined in Appendix A. Panel C: Pearson (Spearman) Correlation Coefficients for MAJORITY_PE and Measures of Tax Avoidance MAJORITY_PE BTD DTAX CASH_ETR MTR
MAJORITY_PE ---- 0.067*** 0.069** -0.097*** -0.095***
BTD 0.074*** ---- 0.021 -0.369*** 0.273***
DTAX 0.064** 0.060*** ---- 0.037 -0.025
CASH_ETR -0.083** -0.546*** -0.019 ---- 0.029
MTR -0.089*** 0.368*** -0.047* 0.051 ----

49
TABLE 5 Results for OLS Regressions of Measures of Tax Avoidance on Indicator Variable for Majority Private Equity Ownership
(MAJORITY_PE) and Controls for Determinants of Corporate Tax Avoidance, where the Comparison Sample is a Sample of Minority-Owned PE-Backed Private Firms
BTD DTAX CASH_ETR MTR
Coeff T-Stat Coeff T-Stat Coeff T-Stat Coeff T-Stat
Intercept -0.061 -2.67** 0.144 2.33** 0.192 1.85* 0.153 5.31***
MAJORITY_PE 0.020 2.00** 0.033 1.70* -0.108 -2.94*** -0.029 -1.99**
LOSS -0.061 -7.11*** -0.077 -2.08** -0.117 -6.04***
LOSS×MAJORITY_PE -0.007 -0.87 0.091 2.10** -0.005 -0.36
NOL -0.013 -1.56 0.089 1.96* 0.124 1.65* -0.133 -7.36***
NOL×MAJORITY_PE 0.012 1.22 -0.009 -0.18 -0.140 -1.72* 0.033 1.65*
LEV 0.023 1.52 -0.004 -0.12 0.015 0.15 0.027 2.11***
LEV×MAJORITY_PE -0.012 -0.69 0.049 0.94 0.061 0.57 -0.056 -3.21***
MNC 0.013 4.62*** 0.048 2.65** -0.088 -3.59*** -0.009 -0.89
INTANG -0.001 -0.06 0.026 0.91 0.017 1.05
EQ_EARN 0.438 0.87 -2.881 -3.21*** -0.946 -0.91
SALES_GR -0.010 -1.90* -0.002 -0.36 -0.026 -2.04** 0.000 -0.02
AB_ACCR 0.226 4.79*** 0.463 2.81** -0.303 -1.55 -0.002 -0.04
ASSETS 0.010 3.53*** -0.011 -1.49 0.021 1.83* 0.010 2.59***
Adjusted R-Squared 0.3749 0.0399 0.1677 0.3786
N 1,416 1,416 578 693 *,**,*** indicates significance at the 10%, 5%, and 1% level, respectively. All variables are as defined in Appendix A. Regressions include industry and year indicator variables, which have not been tabulated. The t-statistics have been adjusted to control for the clustering by multiple firm observations.
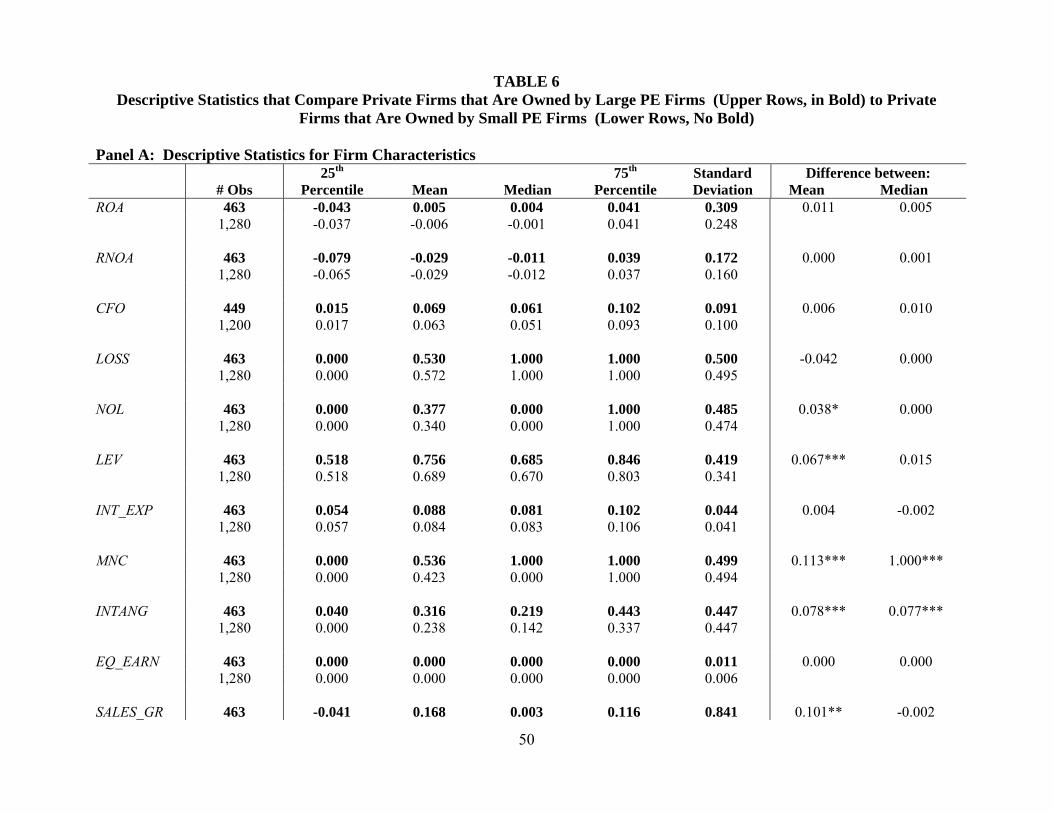
50
TABLE 6 Descriptive Statistics that Compare Private Firms that Are Owned by Large PE Firms (Upper Rows, in Bold) to Private
Firms that Are Owned by Small PE Firms (Lower Rows, No Bold)
Panel A: Descriptive Statistics for Firm Characteristics 25th 75th Standard Difference between: # Obs Percentile Mean Median Percentile Deviation Mean Median ROA 463 -0.043 0.005 0.004 0.041 0.309 0.011 0.005 1,280 -0.037 -0.006 -0.001 0.041 0.248 RNOA 463 -0.079 -0.029 -0.011 0.039 0.172 0.000 0.001 1,280 -0.065 -0.029 -0.012 0.037 0.160 CFO 449 0.015 0.069 0.061 0.102 0.091 0.006 0.010 1,200 0.017 0.063 0.051 0.093 0.100 LOSS 463 0.000 0.530 1.000 1.000 0.500 -0.042 0.000 1,280 0.000 0.572 1.000 1.000 0.495 NOL 463 0.000 0.377 0.000 1.000 0.485 0.038* 0.000 1,280 0.000 0.340 0.000 1.000 0.474 LEV 463 0.518 0.756 0.685 0.846 0.419 0.067*** 0.015 1,280 0.518 0.689 0.670 0.803 0.341 INT_EXP 463 0.054 0.088 0.081 0.102 0.044 0.004 -0.002 1,280 0.057 0.084 0.083 0.106 0.041 MNC 463 0.000 0.536 1.000 1.000 0.499 0.113*** 1.000*** 1,280 0.000 0.423 0.000 1.000 0.494 INTANG 463 0.040 0.316 0.219 0.443 0.447 0.078*** 0.077*** 1,280 0.000 0.238 0.142 0.337 0.447 EQ_EARN 463 0.000 0.000 0.000 0.000 0.011 0.000 0.000 1,280 0.000 0.000 0.000 0.000 0.006 SALES_GR 463 -0.041 0.168 0.003 0.116 0.841 0.101** -0.002
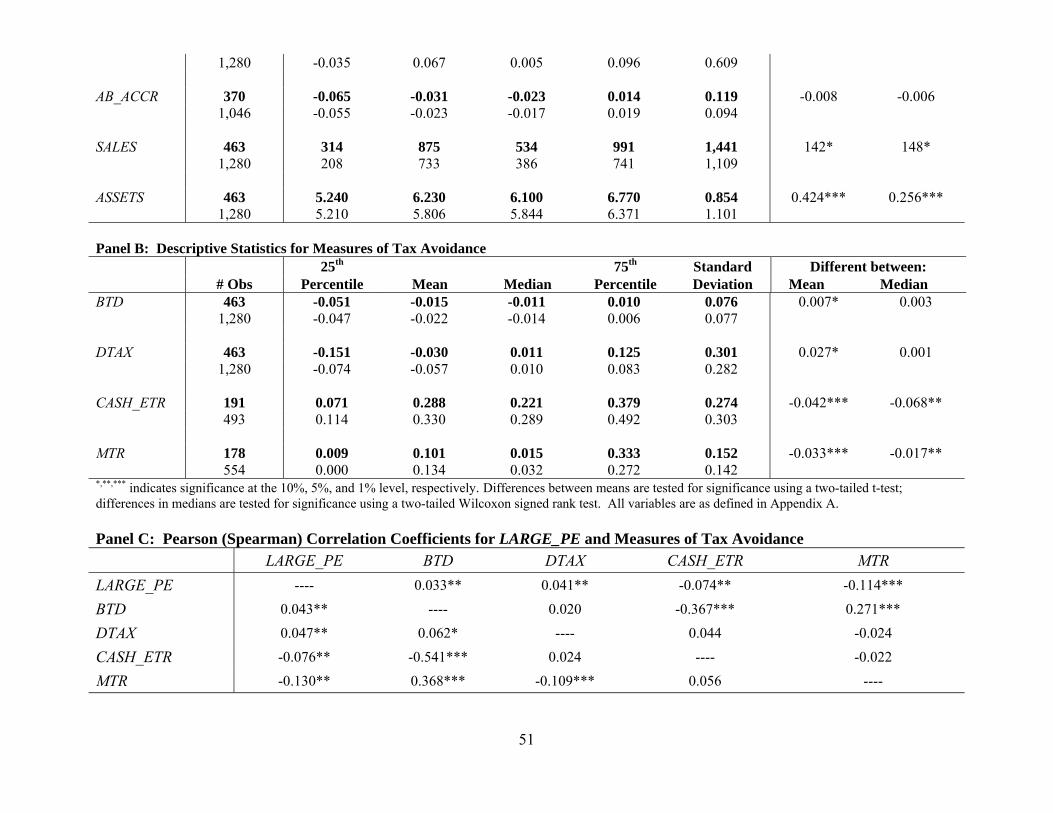
51
1,280 -0.035 0.067 0.005 0.096 0.609 AB_ACCR 370 -0.065 -0.031 -0.023 0.014 0.119 -0.008 -0.006 1,046 -0.055 -0.023 -0.017 0.019 0.094 SALES 463 314 875 534 991 1,441 142* 148* 1,280 208 733 386 741 1,109 ASSETS 463 5.240 6.230 6.100 6.770 0.854 0.424*** 0.256*** 1,280 5.210 5.806 5.844 6.371 1.101 Panel B: Descriptive Statistics for Measures of Tax Avoidance 25th 75th Standard Different between: # Obs Percentile Mean Median Percentile Deviation Mean Median BTD 463 -0.051 -0.015 -0.011 0.010 0.076 0.007* 0.003 1,280 -0.047 -0.022 -0.014 0.006 0.077 DTAX 463 -0.151 -0.030 0.011 0.125 0.301 0.027* 0.001 1,280 -0.074 -0.057 0.010 0.083 0.282 CASH_ETR 191 0.071 0.288 0.221 0.379 0.274 -0.042*** -0.068** 493 0.114 0.330 0.289 0.492 0.303 MTR 178 0.009 0.101 0.015 0.333 0.152 -0.033*** -0.017** 554 0.000 0.134 0.032 0.272 0.142 *,**,*** indicates significance at the 10%, 5%, and 1% level, respectively. Differences between means are tested for significance using a two-tailed t-test; differences in medians are tested for significance using a two-tailed Wilcoxon signed rank test. All variables are as defined in Appendix A. Panel C: Pearson (Spearman) Correlation Coefficients for LARGE_PE and Measures of Tax Avoidance LARGE_PE BTD DTAX CASH_ETR MTR
LARGE_PE ---- 0.033** 0.041** -0.074** -0.114***
BTD 0.043** ---- 0.020 -0.367*** 0.271***
DTAX 0.047** 0.062* ---- 0.044 -0.024
CASH_ETR -0.076** -0.541*** 0.024 ---- -0.022
MTR -0.130** 0.368*** -0.109*** 0.056 ----

52
TABLE 7 Results for OLS Regressions of Measures of Tax Avoidance on Indicator Variable for Private Firms that Are Owned by Large PE
Firms (LARGE_PE) and Controls for Determinants of Corporate Tax Avoidance, where the Comparison Sample is a Sample of Private Firms that Are Owned by Small PE Firms
BTD DTAX CASH_ETR MTR
Coeff T-Stat Coeff T-Stat Coeff T-Stat Coeff T-Stat
Intercept -0.051 -2.70*** 0.132 2.57** 0.043 0.62 0.192 7.86***
LARGE_PE 0.020 2.54** 0.041 1.99** -0.059 -2.99*** -0.030 -1.68*
LOSS -0.068 -14.60*** 0.011 0.47 -0.126 -11.25***
LOSS×LARGE_PE -0.005 -0.68 -0.064 -1.28 0.006 0.35
NOL 0.004 0.84 0.062 2.39** -0.049 -1.48 -0.099 -10.18***
NOL×LARGE_PE -0.025 -3.06*** 0.067 1.27 0.119 1.80* -0.031 -1.45
LEV 0.023 2.76** 0.032 0.83 0.107 2.18** -0.020 -1.87*
LEV×LARGE_PE -0.018 -1.78* -0.011 -0.19 -0.060 -0.71 0.014 0.88
MNC 0.014 4.48*** 0.057 2.75*** -0.072 -2.87*** -0.008 -0.82
INTANG 0.003 0.34 -0.002 -0.09 0.015 0.89
EQ_EARN 0.532 1.11 -4.400 -4.30*** -0.763 -0.64
SALES_GR -0.011 -1.99** -0.003 -0.28 -0.010 -0.80 0.004 0.12
AB_ACCR 0.235 4.92*** 0.451 2.78*** -0.385 -1.94* 0.004 0.06
ASSETS 0.010 3.36*** -0.014 -1.79* 0.040 3.44*** 0.007 1.70*
Adjusted R-Squared 0.3788 0.0369 0.1749 0.3746
N 1,416 1,416 578 693 *,**,*** indicates significance at the 10%, 5%, and 1% level, respectively. All variables are as defined in Appendix A. Regressions include industry and year indicator variables, which have not been tabulated. The t-statistics have been adjusted to control for the clustering by multiple firm observations.

53
TABLE 8
Means and Medians for Components of Total Book-Tax Differences, Including Changes in Deferred Tax Assets and Liabilities and Items in the Statutory Reconciliation Schedule
PE-Backed vs. Non-PE-Backed PE-Majority vs. PE-Minority
PE Non-PE T-Stat Majority Minority T-Stat Measures of Tax Avoidance: BTD
Mean 0.016 -0.011 3.54 0.023 0.008 1.75 Median 0.008 -0.006 1.66 0.001 -0.014 1.67
N 76 38 38 38 DTAX
Mean -0.039 -0.122 1.99 -0.020 -0.057 0.80 Median 0.022 -0.018 0.40 0.025 0.017 0.56
N 76 38 38 38 CASH_ETR
Mean 0.285 0.331 -0.87 0.283 0.287 -0.05 Median 0.314 0.332 -0.76 0.273 0.390 -1.73
N 35 27 13 22 MTR
Mean 0.134 0.215 -2.38 0.091 0.165 -1.81 Median 0.045 0.350 -1.74 0.020 0.055 -1.04
N 31 22 13 18
PE-Backed vs. Non-PE-Backed PE-Majority vs. PE-Minority
PE Non-PE T-Stat Majority Minority T-Stat Changes in Deferred Tax Assets and Liabilities: ACCR_RES
Mean -2,144.8 1,893.8 -2.02 -3,958.2 -426.8 -1.06 Median -723.0 913.4 -1.39 -1,352.0 -48.4 -1.13
74 38 36 38 DEP_AMORT
Mean -985.9 -1,492.1 0.22 -1,273.2 -713.8 0.84 Median -1,132.8 -1,033.9 -0.07 -1,497.7 -792.7 -0.57
74 38 36 38 SALE_LEAS
Mean -94.8 575.2 -1.69 0.000 -184.6 1.07 Median 0.000 0.000 -0.26 0.000 0.000 0.95
74 38 36 38

54
INVENTORY Mean 320.6 -637.0 2.21 959.1 -284.3 1.29
Median 0.000 0.000 1.27 0.000 0.000 1.33 74 38 36 38
VAA Mean -4,225.9 -4,071.3 -0.05 515.3 -8,717.7 1.32
Median 0.000 0.000 0.68 0.000 0.000 0.39 74 38 36 38
STOCK_COMP Mean 185.5 -50.33 1.26 381.4 0.000 1.08
Median 0.000 0.000 0.83 0.000 0.000 1.48 74 38 36 38
OTHER Mean 599.4 1,403.1 -0.45 343.9 841.4 -0.27
Median 0.004 -89.34 -0.66 -89.18 171.3 -2.17 N 74 38 36 38
PE-Backed vs. Non-PE-Backed PE-Majority vs. PE-Minority
PE Non-PE T-Stat Majority Minority T-Stat Statutory Reconciliation Items: FOR_TAX
Mean -0.020 -0.002 -1.14 -0.051 0.010 -1.12 Median 0.000 0.000 -0.49 0.000 0.000 -0.34
N 73 36 36 37 STATE_TAX
Mean 0.019 0.022 -0.12 0.015 0.024 -0.14 Median 0.008 0.011 -0.47 0.002 0.016 -2.21
N 73 36 36 37 INTANG
Mean -0.007 0.038 -1.69 -0.032 0.017 -1.62 Median 0.000 0.000 -0.41 0.000 0.000 -0.40
N 73 36 36 37 TAX_EXEMPT
Mean -0.015 0.012 -2.33 -0.004 0.001 -1.61 Median 0.000 0.000 -1.22 0.000 0.000 -1.00
N 73 36 36 37 NONDED_EXP
Mean 0.013 0.001 1.74 0.010 0.016 -0.39 Median 0.000 0.000 0.06 0.000 0.000 -0.30
N 73 36 36 37 TAX_RESERV
Mean 0.006 0.003 0.61 0.013 -0.001 0.77 Median 0.000 0.000 0.38 0.000 0.000 -0.31
N 73 36 36 37

55
TAX_CREDITS Mean -0.013 -0.001 -1.67 0.000 -0.025 1.42
Median 0.000 0.000 -0.03 0.000 0.000 0.66 N 73 36 36 37
VAA Mean 0.012 0.016 -0.16 -0.010 0.034 -0.91
Median 0.000 0.000 -0.08 0.000 0.000 -0.52 N 73 36 36 37
OTHER Mean -0.004 -0.001 -0.13 0.005 -0.013 0.22
Median 0.000 0.000 -0.08 0.001 0.000 0.83 N 73 36 36 37
ETR Mean 0.235 0.339 -1.71 0.192 0.278 -0.81
Median 0.309 0.370 -1.87 0.254 0.335 -0.82 N 73 36 36 37
Notes: Differences between means are tested using a t-test while differences in medians are tested using a Wilcoxon signed rank test. We classified each deferred tax asset and liability disclosed in the tax footnotes in one of seven categories: 1) accruals and reserves (ACCR_RES), 2) depreciation and amortization (DEP_AMORT), 3) sale and leaseback transactions (SALE_LEAS), 4) inventory (INVENTORY), 5) the valuation allowance account (VAA), 6) stock-based compensation (STOCK_COMP), and 7) other (OTHER). Positive (negative) values indicate net deferred tax assets (liabilities), scaled by current year total assets and then multiplied by 1,000. We classified each statutory reconciliation item disclosed in the tax footnotes in one of nine categories, which include items related to: 1) foreign taxes (FOR_TAX), 2) state taxes (STATE_TAX), 3) intangible assets (INTANG), 4) tax-exempt income (TAX_EXEMPT), 5) non-deductible expenses (NONDED_EXP), 6) tax contingencies, aka “tax reserves” (TAX_RESERV), 7) tax credits (TAX_CREDITS), 8) change in the valuation allowance account (VAA), and 9) other (OTHER). All other variables are as defined in Appendix A