the impact of platform integration on consumer demand in ... instagram paper.pdf · the impact of...
TRANSCRIPT
Electronic copy available at: http://ssrn.com/abstract=2456769
The Impact of Platform Integration on Consumer Demand in Complementary Markets:
Evidence from Facebook’s Integration of Instagram
Zhuoxin (Allen) Li, Ashish Agarwal
McCombs School of Business, The University of Texas at Austin {[email protected], [email protected]}
Abstract
Platform owners often choose to provide tighter integration with their own complementary applications
(i.e., first-party applications) as compared to that with other complementary third-party applications. We
study the impact of such integration on consumer demand for first-party applications and competing third-
party applications by exploring Facebook’s integration of Instagram in its photo-sharing application
ecosystem. We find that consumers obtain additional value from Instagram after its integration with
Facebook, leading to a large increase in the use of Instagram for Facebook photo-sharing. While
consumer valuations of small third-party applications decrease, consumer valuations of big third-party
applications slightly increase after the integration event. As a result, big third-party applications face
much smaller reduction in demand as compared to small third-party applications. Interestingly, a large
fraction of the new users Instagram attracted are new users who did not use any photo-sharing
application, rather than incumbent users of third-party applications. As a consequence, the overall demand
for the photo-sharing application ecosystem actually increases, which suggests that Facebook’s
integration strategy benefits the complementary market overall. Our results highlight the value of
platform integration for first-party applications and the application ecosystem overall, and have
implications for strategic management of first-party applications in the presence of third-party
applications.
Keywords: platform, first-party application, third-party application, demand estimation, network effect
Electronic copy available at: http://ssrn.com/abstract=2456769
1
The Impact of Platform Integration on Consumer Demand in Complementary Markets:
Evidence from Facebook’s Integration of Instagram
1. Introduction
Platform-based technologies such as computer operating systems (e.g., Windows, Mac OS, and Linux),
mobile operating systems (e.g., iOS and Android) and video game consoles (e.g., Xbox, Play Station, and
Wii) have become an essential part of the information economy (Evans et al. 2006). As noted by
Boudreau (2007), such platforms are defined as the set of core components whose functionalities can be
extended by complementary applications. Platform owners often seek complementary innovations from
third-party providers to meet the needs of heterogeneous users. This approach of complementary
innovation has given rise to the model of a platform ecosystem which makes a platform more valuable
(Gawer and Cusumano 2002, Tiwana et al. 2010). More recently, social networking services such as
Facebook have also adopted this platform approach of complementary innovations. Facebook launched its
platform in May 2007, providing a set of programming interfaces and tools for third-party software
developers to create applications that interact with Facebook’s core features (e.g., user profile and
friendship network). As of February 2012, the Facebook platform supported more than 9 million
applications in a variety of categories such as games, photo-sharing, music-sharing, news, entertainment,
sports, travel, and lifestyle,1 which in total attract more than 235 million users.2
While continuing to expand their ecosystem through third-party applications, platform owners
may also provide their own applications to consumers (i.e., first-party applications), either by in-house
development or by acquisition from third-party developers. These first-party applications tend to compete
with third-party applications. A critical aspect of this vertical integration strategy is the platform owner’s
decision to make a tighter integration of first-party applications relative to the integration of other third-
1 http://www.insidefacebook.com/2012/04/27/facebook-platform-supports-more-than-42-million-pages-and-9-
million-apps/. 2 http://techcrunch.com/2012/08/14/facebook-says-it-now-has-235m-monthly-gamers-app-center-hits-150m-e
monthly-users/.
2
party applications. For example, Facebook acquired Instagram for $1 billion in April 2012. Instagram3
and other Facebook photo-sharing applications offer social networking features for Facebook users to
discover, like, comment on, or vote for photos from their friend network or even the entire Facebook
network (the total number of active users of these applications was over 113 million in December 2012).
After the acquisition, a partial integration was made by Facebook in June 2012 to facilitate photo-sharing
between Instagram and Facebook. This integration provided Instagram users an easy-to-use interface to
access Facebook data (e.g., user profiles and friendship network) and share photos on Facebook through
Instagram automatically. However, users of third-party applications needed several extra steps to
complete the same tasks.4 Similarly, in May 2012, Facebook acquired a gift-giving application called
Karma, which competes with other Facebook gift-giving applications (e.g., Wrapp).5 Facebook also
made tighter integration with Karma after the acquisition.6
Integration of first-party applications is an important platform design decision. As consumers
value inter-product integration (Nambisan 2002), platform owners may benefit from providing tighter
integration with their first-party applications. However, third-party developers may resist such moves and
hesitate to contribute to the ecosystem as they fear the platform owner’s ability to squeeze them ex post
(Gawer and Henderson 2007). For example, Facebook’s vertical integration strategy has raised concerns
about the viability of the platform for third-party developers, as voiced in the following quote from the
CEO of Wrapp: “The $100 billion question now is whether Facebook will remain an open platform that
partners and supports companies like Wrapp…” The partial congruence of interests between the platform
owner and third-party developers are evidenced in Facebook’s response to its platform strategy: “Our
company is specifically looking for acquisitions that complement our core products. However, we've
3 Instagram can be used independently of Facebook. Instagram users can use the application to interact with other
social networking services, such as Twitter, Tumblr and Flickr. Our focus in this paper is Instagram’s features that enable users to share photos on Facebook.
4 http://androidcommunity.com/instagram-update-adds-deeper-facebook-integration-and-search-options-20120626/. 5 http://www.businessweek.com/articles/2012-05-23/what-facebook-will-get-out-of-gift-giving-app-karma. 6 http://blogs.wsj.com/venturecapital/2012/05/18/on-ipo-day-facebook-finds-time-to-buy-social-gifting-site-karma/.
3
never been more invested in supporting and expanding the ecosystem of applications and developers that
build with Facebook.” 7
Managing the tension between first-party applications and third-party applications has been a
critical part of major platforms’ strategies (Gawer and Henderson 2007, Huang et al. 2013). Platform
owners have to carefully evaluate the impact of the integration of a first-party application on its
application ecosystem. Analysis of the resulting consumer preferences and the substitution or
complementary effects between first-party applications and third-party applications can help platform
owners determine the overall impact of their strategy. While we focus on the Facebook platform, this
study has implications for a number of other platforms that routinely provide first-party applications and
have to devise their vertical integration strategy. For example, Apple has also introduced its own
applications (e.g., Apple Maps, Facetime, and iMovie) for its iOS platform, while Google has launched a
variety of first-party applications for its Android platform (e.g., Google Chat, Google Finance, and
Google Maps).
The consequences of platform integration are multifold and not obvious. In the case of
Facebook’s integration of Instagram, one possibility is that the integration has little impact as it does not
introduce new product features. Without the integration, users could still complete the same tasks using
Instagram or any third-party application. However, past literature suggests that ease of use is positively
associated with product adoption (Davis 1989, Cooper 2000, Dhebar 1995). Therefore, users may derive
additional utility from the tighter integration of Instagram with Facebook as it enhances Instagram’s ease
of use as compared to that for other third-party applications. Integration by the platform owner may also
signal high quality/credibility of the application. As a result, consumers may perceive the first-party
application more viable than third-party applications. Due to these benefits, consumers may find the first-
party application more appealing relative to third-party applications, resulting in higher demand for the
first-party application and lower demand for third-party applications. However, the platform owner’s
7 http://online.wsj.com/news/articles/SB10001424052702304441404577480611248317178.
4
integration strategy can also stimulate consumer demand for applications as users may perceive the
platform owner’s strategy as its commitment to grow the applications ecosystem. As a consequence,
third-party applications may also benefit from this market expansion effect. Finally, the impact of the
platform owner’s integration strategy can vary across different third-party applications. Thus, the overall
impact of platform integration on market demand in the ecosystem is not known.
Despite its importance, empirical research on consumer demand for first-party applications and
third-party applications has been limited. 8 Furthermore, the impact of platform integration remains
unclear. Gawer and Henderson (2007) use a qualitative approach to explore why Intel entered its
complementary markets and how Intel balances its own strong incentives to enter against the risk of
discouraging complementors’ innovations. However, they do not empirically evaluate the effect of
platform entry on consumer demand in complementary markets. Huang et al. (2013) focus on the role of
intellectual property rights on third-party developers’ incentives to join the SAP platform, but they do not
study the impact of first-party application on consumer demand for third-party applications. Lee (2013)
investigates the role of exclusive titles on platform competition in the U.S. videogame industry. However,
he evaluates the impact of exclusive titles on the demand for competing videogame platforms rather than
competing titles. No empirical evidence on the impact of a platform’s integration with its first-party
applications has been documented. Furthermore, related theoretical papers have focused on how price
competition influences market demand, leaving out consumer preferences for empirical studies. Thus, the
effect of non-pricing strategy like platform integration in influencing consumer preferences and market
demand is not known.
We fill the gap in the literature by studying the impact of Facebook’s integration of Instagram on
Facebook’s photo-sharing applications market. The unique dataset from this integration event allows us to
8 Platform owners conventionally do not release demand data about their tightly integrated first-party applications.
For example, Facebook stops releasing application usage data once an application gets acquired by Facebook. The Instagram case we study is an exception - Facebook continued to provide publicly available data on consumers’ use of Instagram for Facebook photo-sharing until December 2012.
5
evaluate the changes in consumer preferences and market demand after Instagram became a tightly
integrated first-party application. We aim to address the following questions:
(1) What is the impact of the platform owner’s integration strategy on consumer demand for the
first-party application and third-party applications?
(2) How does the integration strategy impact the overall demand in the complementary market?
We build a structural model of consumer choices and estimate demand for the first-party
application, third-party applications and the overall photo-sharing application market before and after the
integration event. Our model extends existing static structural demand estimation models (see, e.g., Berry
et al. 1995) by incorporating network effects and switching costs arising from the social characteristics of
photo-sharing applications. We estimate the model using a unique dataset that consists of daily usage of
different applications on the Facebook platform.
The main findings are as follows. First, we find that consumers obtain additional utility from
Instagram after its tighter integration with Facebook, leading to a dramatic increase in the demand for
Instagram. This is possibly due to the real benefits from the integration as well as the perceived long-term
viability of the first-party application. Second, while integration lowers consumer valuations of third-
party applications with a small user base, it actually has a positive effect on consumer valuations of big
third-party applications. This result suggests that the size of an application’s user base influences
consumer preferences for different types of third-party applications following the integration of the first-
party application. As a consequence, the integration event has large negative impact on demand for
competing third-party applications with a small user base, whereas it has much smaller negative impact
on competing third-party applications with a large user base. Finally, we find that a large fraction of new
users gained by Instagram are new users who did not use any photo-sharing application, rather than
incumbent users of third-party applications. As a result, the overall demand in the market actually
increases, which suggests that Facebook’s integration strategy benefits the complementary market overall.

6
Our research makes several contributions. Our study contributes to the literature on platform
strategies in complementary markets. Previous research has mostly relied on theoretical models to study
strategic interactions between the platform owner and third-party developers (supply-side behavior),
given various assumptions on consumer behavior (Katz and Farrell 2000, Hagiu and Spulber 2013).
Additionally, they do not focus on platform’s decision to have variable integration across applications and
its implication for the consumer demand. Our paper is the first study that empirically evaluates consumer
preferences for first-party applications vis-à-vis third-party applications (demand-side behavior) and its
implication for the platform owner’s integration strategy. Our research also contributes to the literature on
network effects. Previous research has focused on the role of network effects on the adoption and
diffusion of products (Brynlofsson and Kemerer 1996, Kauffman et al. 2000, Fuentelsaz et al. 2012). Our
research adds to this stream by evaluating the role of network effects on consumer preference for first-
party applications and third-party applications and its implications in the context of platform ecosystems.
Specifically, we show that third-party applications with a larger user base may actually benefit from a
platform owner’s integration of a first-party application.
To the best of our knowledge, our paper is the first one to empirically demonstrate the value of
integration of an application by a platform owner. Previous research has assumed that cross-product
integration is valuable and demonstrated how initial technology architecture/design enables future cross-
product integration (Nambisan 2000, Baldwin and Clark 2000). In these studies, platform owners do not
own first-party applications that compete with third-party applications. Our paper demonstrates the effect
of platform integration on consumer valuations and demand for applications in the context of a platform
ecosystem with first-party applications and competing third-party applications.
From the platform owner’s perspective, our findings shed light on the efficacy of the platform’s
integration strategy. On one hand, such a strategy may be beneficial particularly in a market where
network effects and switching costs are present. In such a scenario, the platform owner may gain new
users due to the appeal of the tightly integrated first-party application while not hurting third-party

7
applications too much. On the other hand, our research informs small third-party applications, platform
owners, and policy makers about the potential dark side of platform integration. As small third-party
applications are more vulnerable to the negative shock from vertical integration, such strategies may
cause small third-party developers to exit the market, which reduces the variety of products/services
available in the complementary market. Platform owners and policy makers should evaluate the trade-off
between the demand decrease in the short-turn and the potential losses in product variety in the long-turn.
The remainder of our paper is organized as follows. Section 2 reviews the related literature. In
Section 3, we describe Facebook’s partial integration of Instagram and the dataset we collected. In
Section 4, we present the empirical model and estimation procedure. We present the main empirical
results in Section 5 and additional analyses in Section 6. Robustness checks with different instrumental
variables are reported in Section 7. Finally, in Section 8, we discuss the implications of our study and
point out directions for future research.
2. Literature Review
Our research is related to the literature on platform-based ecosystems with a focus on complementary
markets and the literature on product adoption subject to network effects and switching costs. We discuss
these two streams of research below.
Platform Ecosystems and Complementary Markets
Existing studies have mostly relied on analytical modeling to study the strategic interactions between the
platform owner and third-party developers (i.e., supply-side behaviors). Eisenmann et al. (2011) study
platform entry strategies when new entrants face entry barriers driven by strong network effects and high
switching costs. Katz and Farrell (2000) evaluate how a platform owner’s entry into its complementary
market allows it to extract higher rents. Hagiu and Spulber (2013) investigate the strategic use of first-
party applications and show that the level of investment in these applications is driven by the relationship
between first-party applications and third-party applications and the market conditions. All these
8
theoretical papers above focus on supply-side behavior and firm strategies, give various assumptions on
consumer behavior. Our paper is the first study that empirically evaluates consumer preferences for first-
party applications vis-à-vis third-party applications (i.e., demand-side behavior). Furthermore, theoretical
papers have focused on how price competition influences market demand. Our study of the Facebook
platform highlights the role of a non-pricing strategy like platform integration in influencing market
demand.
Empirical research on platform-based ecosystems, with a focus on complementary markets, is
limited. Chipty (2001) examines the consequences of vertical integration between programming and
distribution in the cable television industry. She assesses the role of ownership structure in program
offerings and finds that integrated operators tend to exclude rival program services from their distribution
networks. In our study, the platform owner did not exclude rival applications and instead adopted an
approach of tighter integration with its own application. Gawer and Henderson (2007) use a deductive,
qualitative approach to explore why Intel entered its complementary markets and how Intel balanced its
own strong incentives to enter against the risk of discouraging complementors’ innovations. Our paper
provides concrete empirical evidence on the effects of a platform owner’s vertical integration strategy in
shaping consumer demand in the complementary market.
Using firm-level financial data, Huang et al. (2013) highlights the role of intellectual property
rights in third-party developers’ incentives to join SAP’s enterprise software platform. Third-party
developers that hold patents and copyrights, which protect developers from being squeezed by the
platform owner, are more likely to join the platform. The focus of their paper is on third-party developers’
entry behavior, whereas our paper controls for entry behavior and focuses on understanding consumer
choices of first-party and third-party applications before and after platform integration. Lee (2013)
investigates the role of exclusive titles on platform competition in the U.S. videogame industry. However,
he evaluates the impact of exclusive titles on consumer demand for competing videogame consoles rather
than competing third-party applications. Furthermore, in our study of Facebook photo-sharing
9
applications, consumers may prefer the tightly integrated first-party application for its ease of use, a
characteristics that is absent in the videogame setting.
Product Adoption in the Presence of Network Effects
Several studies have focused on the role of network effects on product adoption. Brynjolfsson and
Kemerer (1996) estimate the impact of installed base and compatibility on the price of packaged software.
Their empirical analysis shows that the size of a product’s installed base is positively associated with the
price of the product. Using electronic banking as a context, Kauffman et al. (2000) provide empirical
evidence on network externality as a determinant of product adoption and diffusion. They find that banks
in markets that can generate a larger effective network size and a higher level of externalities tend to
adopt electronic banking early. Xue et al. (2011) study consumer adoption of online banking services.
They find that customers who reside in areas with a larger number of online banking adopters are faster to
adopt online banking as well. Zhu et al. (2006) develop a conceptual model that captures network effects,
expected benefits, and adoption costs as drivers in the adoption of internet-based interorganizational
systems. They highlight that the extent to which a firm’s trading partners is willing to support the same
systems as a key driver of the focal firm’s adoption decisions. Gallaugher and Wang (2002) show a
positive effect of network size on the price of Web server software. They attribute network effects to three
sources: exchange value, staying power, and extrinsic benefits. Fuentelsaz et al. (2012) analyze the role of
switching costs and network effects in determining the level of competition in the European mobile
communications industry. Consistent with theoretical predictions, their empirical results suggest that
higher switching costs and stronger network effects lead to lower level of rivalry in the market.
Thus previous works have primarily focused on the role of network effects on product adoption
and price competition. Our paper extends this stream of literature by evaluating the role of network
effects in influencing consumer responses to a platform owner’s integration of a first-party application.
10
3. Photo-Sharing Application Ecosystem on Facebook & Data Description
In this paper we focus on photo-sharing applications that enable Facebook users to discover, edit and
share photos on Facebook. Photo-sharing applications provide tools to create personalized photo collages,
import pictures from an existing Facebook album, retouch, add filters or text, and share photos with
friends. These applications also offer social networking features for Facebook users to discover, like,
comment on, or vote for photos from their friendship network or even the entire Facebook network. These
social features create a local social network within a focal photo-sharing application. Instagram has been
one of the most popular photo-sharing applications on the Facebook platform.
On April 12, 2012, Facebook acquired Instagram for approximately $1 billion. After the
acquisition, Facebook continued to run Instagram as an independent application, instead of fully
integrating it into Facebook.com.9 There were no significant changes to Instagram and Facebook.com
after the acquisition deal, except that, on June 26, 2012, a partial integration was made to facilitate photo-
sharing between Instagram and Facebook. After the tighter integration, if an Instagram user likes or
comments a photo on Instagram, the photo along with the “like” or comment may automatically appear as
the user’s news feed on Facebook; if a Facebook user likes or comments the photo, the “like” or comment
may appear in the original post on Instagram as well. The update also offers Instagram users enhanced
capacity to find and connect to their Facebook friends and explore Facebook’s network using this
application. Users of third-party applications have to take several extra steps to complete these tasks.
We obtained a unique dataset from a business analytics company that tracks usage of applications
on Facebook. While Facebook routinely stopped releasing application usage data after an application was
acquired by Facebook, the Instagram case was an exception. Facebook continued to report data on
consumers’ use of Instagram for Facebook photo-sharing until December 2012. Our dataset consists of
the number of daily active users for the top 20 photo-sharing applications on the Facebook platform from
9 https://newsroom.fb.com/News/321/Facebook-to-Acquire-Instagram.
11
April 27, 2012 to December 15, 2012.10 All the top 20 applications are free applications and cumulatively
account for over 88% of the market share among all Facebook photo-sharing applications. Except
Instagram, all other applications were owned by third-party developers. Besides the time-variant demand
data, we also observe time-invariant product attributes such as release dates and distribution channels
(Facebook canvas, iOS/Android applications). The dataset also consists of an app’s average user star
ratings on Facebook’s application center. The star ratings remained constant during the panel period,
suggesting there were no visible quality improvements to the photo-sharing applications during the panel
period.
We divide the dataset into two subsamples, one for estimation and the other for model validation.
The subsample for estimation covers the first 124 days (two months before and two months after the
integration event), whereas the subsample for validation covers the remainder of 109 days.
Table 1 summarizes some descriptive statistics of the subsample used for estimation. We compute
market shares by dividing the number of application users by the total number of Facebook users (see,
e.g., Berry 1995, Nevo 2001). The statistics show that a large fraction of Facebook users did not use any
photo-sharing application regularly.
-- Insert Table 1 Here --
Figure 1 illustrates the demand changes for different applications before and after the integration
event. Since its tighter integration with Facebook, Instagram has experienced significant growth in its user
base. Moreover, the combined demand of the top third-party applications remains relatively stable, but the
growth rate becomes noticeably lower after the integration event, suggesting certain degree of substitution
between Instagram and third-party applications. The negative impact is particularly significant for third-
party applications with a small network size. Finally, the total demand for Instagram and third-party
applications is growing. By the end of August, 2012, the total demand in the photo-sharing category
10 After December 2012, Facebook stopped providing accurate application usage data (it only reports the range of
application users, e.g., 10,000 – 50,000).

12
almost tripled. These results imply that a large fraction of users joining Instagram are new users, rather
than incumbent users of third-party applications. In the remainder of the paper, we look into these results
and their implications by building and estimating a random-coefficient discrete choice model that
captures consumer choices.
-- Insert Figure 1 Here --
4. The Model
Our objective is to estimate demand for different photo-sharing applications on the Facebook platform.
We build a structural model of consumer choices based on the literature of structural demand estimation
using aggregate data (Berry et al. 1995). This structural approach allows us to derive market share of each
application as a function of product characteristics while accounting for unobserved consumer
heterogeneity and demand shocks. Similar models have been used to study consumer choices in electronic
markets and mobile applications markets (see, e.g., Ghose et al. 2012, Ghose and Han 2014, Danaher et
al. 2014).
4.1 Model Setup
We observe period , 1,… , , with consumers. Each consumer chooses at most one application ,
1,… , , in each period. In our setup of Facebook photo-sharing applications, 20. All these photo-
sharing applications are free and thus price is not relevant to consumer choices. We categorize the
applications into two groups: {first-party applications, third-party applications}. Denote 0 the
option of outside good, the option of not using any of these applications. Consumer ’s utility of using
application in period is specified as
, (1)
where is the lagged application user base that determines the direct network effect (see, e.g.,
Fuentelsaz et al. 2012). Network externalities are known to play a role in consumers’ adoption of

13
technology products (Katz and Shapiro 1986). Products and services with a larger user base may provide
higher exchange value to users. Such installed base effect may also come from behavioral factors such as
social preferences, observational learning, and word-of-mouth, which influence product diffusion (Bass
1969, Mahajan et al. 1990). Note that consumers may also derive utility from the overall user base of
Facebook (i.e., indirect network effect). This common network effect, however, is not identified, as it
enters the utility function for each application and will be cancelled out.
Consumer valuation of the first-party application may increase after its tighter integration with
the platform due to better ease of use (Davis 1989, Cooper 2000, Dhebar 1995). For example, reciprocal
sharing between Instagram and Facebook allow Instagram users to manage photos across Instagram and
Facebook in a seamless fashion. This may have negative impact on third-party applications. These effects
are capture by which represents a vector of interaction terms Integration×AppGroup
(Integration×Instagram, Integration×ThirdPartyApp), whose value is one if application belongs to
group and ( is the integration time), and zero otherwise. These two interaction terms capture
the impact of integration on consumer valuation of Instagram and third-party applications.
Our model controls for various unobserved shocks. In Equation (1), is the app-specific shock
that enters a consumer’s utility in period but are not observed by our econometrician, and is the
idiosyncratic shock which is assumed to be drawn from the Type 1 extreme value distribution
independently across consumers, applications, and time periods (Berry 1995). The model also includes
application dummies and time dummies to control for time-invariant fixed effects and potential time
trends that shift consumers’ utility. Application dummies also account for observed and unobserved
product characteristics that do not vary during the panel period. As noted by Nevo (2001), the rich
specifications of fixed effects and time effects capture various components of unobservables such as
unobserved promotional activities, unquantifiable product characteristics (e.g., brand equity), or
systematic shocks to demand which are common across all photo-sharing applications. Such rich
specifications provide a semi-parametric control that assuages potential misspecification concerns.

14
Following Berry et al. (1995), we model the distribution of consumers’ taste parameters as
multivariate normal, i.e.,
, ~ 0, , (2)
where is the dimension of product characteristics , is a vector of the means of taste parameters,
is a vector of unobserved individual tastes, and is a scaling diagonal matrix that represents the standard
deviations of the taste distributions. In our setup, product attributes except application user bases do not
change during the panel period and are already captured by the application dummy. Thus, we set K = 1.
We assume random coefficient for the key variable, i.e., the network effect , to account for
the possibility that consumers may be heterogeneous in their valuation of the size of an application’s user
base. Identification of random coefficients for dummy regressors is difficult as these variables have very
limited cross-sectional or temporal variations, which hinder the identification of . As a result, we do not
assume random coefficients for dummy regressors and interaction terms to avoid the explosion of
parameters.11 Finally, we normalize the mean utility from the outside option to zero, i.e., .
Combining Equations (1) and (2), we have
, (3)
where
(4)
represents the mean utility and corresponds to consumer ’s individual-specific utility
from using application in time .
A consumer’s decision in current period may depend on her previous adoption and usage. For
example, when facing high switching costs, consumers may continue to use the same product they have
11 Other studies using similar methodologies, such as Song (2011) and Gowrisankaran and Rysman (2012), assume
only one random coefficient on the key explanatory variable.
15
been using, even when more favorable alternatives are available. In the base model described above, we
do not consider such dynamic behavior. In Section 6.4, we extend our base model to explicitly consider
the role of switching costs in consumer choices.
Our model implicitly assumes that consumers are myopic and non-strategic. An individual
consumer is “small” relative to the size of the entire network such that she anticipates her individual
adoption decision will not significantly influence the adoption behavior of other consumers. This is a
common assumption in other papers using similar approaches (see, e.g., Ghose et al. 2012, Ghose and
Han 2014, Danaher et al. 2014). In our context of Facebook photo-sharing applications, consumers have
limited incentives to behave forward-looking because all applications are free and it is not impossible to
switch to other applications. Therefore, we believe that our assumption of myopic and non-strategic
consumers is appropriate.
Our structural model has several advantages over the traditional Difference-in-Differences (DD)
technique used to measure the treatment effect. Platform integration impacts consumer choices over
multiple periods, with both first-order effect (directly shifting consumer utility in current period) and
second-order effect (indirectly shifting utility in future periods through lagged user base). Our model
explicitly captures both these effects that are difficult to bed modeled using a DD approach. Further, the
structural model allows us to run counterfactual simulations to estimate the market outcome in alternative
scenarios, i.e., with and without integration. These counterfactual experiments are valuable in evaluating
whether or not it is beneficial to conduct platform integration, instead of simply knowing the changes in
market demand before and after integration.
4.2 Identification and Estimation
Our focus in this paper is consumer choices before and after platform integration. To reduce the
interference from supply-side behaviors such as entry and exit following the integration, we restrict our
analysis to a relative short horizon, two months before and two months after integration, such that
application developers possibly have not yet responded to the integration event. This restriction allows us
16
to estimate the demand equation in (1) without modeling the strategic interactions between the platform
owner and third-party developers.
The panel structure of the dataset allows us to use the fixed-effects approach to control for
potential unobserved/omitted time-invariant product characteristics and promotion efforts. The fixed-
effects approach provides a semi-parametric control that assuages many misspecification concerns
(Wooldridge 2002). However, fixed-effects estimators are inconsistent when the model includes
predetermined explanatory variables such as lagged user base (Nickell 1981, Anderson and Hsiao 1982).
The intuition for the inconsistency is that future adoptions are a function of current adoptions, implying
that current unobservables are correlated with the size of application user base in all future periods. This
violates the strict exogeneity condition required for the consistency of fixed-effects estimators. However,
this inconsistency becomes insignificant when the number of time periods T is relatively large (Hahn and
Kuersteiner 2002), as it is the case in our model. Hahn and Kuersteiner (2002) find that the magnitude of
biases is close to 2/T, which is about 0.01, a negligible number in our setting (parameter estimate of
network effect is about 0.7 in our model.). As a robustness check, we also validate our results with
various instruments for the lagged user base in Section 7.
It is possible that Facebook may coordinate the timing of integration based on some market trends
for photo sharing. For example, an increased interest in photo sharing among consumers may influence
the consumer response to integration. We account for such time trends using the time dummies. It is also
possible that Facebook may coordinate the timing of Integration with higher level of external promotions
for the Instagram application. We conducted a comprehensive review of Instagram’s internet activities
during the same panel period. We went through historical news feeds and articles on major search engines
(Google, Yahoo!, and Bing), mobile applications marketplaces (iTunes and Google Play), tech media
websites (CNET and TechCrunch), and Instagram’s company page on Facebook. We do not find any
evidence that Instagram was executing unusual advertising or other promotional campaigns that may
explain the demand patterns observed in Figure 1. However, it is possible that there are external

17
unobserved market dynamics which influence consumer valuation and are correlated with the integration
terms. As a robustness check, we validate our results with a suitable instrument for the integration
variable in Section 7.
Details of the estimation algorithm are provided in Appendices A and B. Here we present the
intuition of the estimation procedure. The model is of individual behavior, yet only aggregate data is
observed. Our goal is to estimate the mean and variance of the vector of model parameters while
accounting for consumer heterogeneity. We apply iterative methods similar to the contraction mapping
algorithm used by Berry et al. (1995) and Nevo (2001). With an initial value of , we can predict
individual utility and aggregate individual choices to obtain predicted market shares. We solve for the
mean utility , such that the model-predicted market shares are equal to the observed market shares. We
then form a minimal distance objective function based on the sum of squared errors (if instrument
variables are used, we replace the minimal distance by a GMM objective function based on a set of
moment conditions.) We then update the parameter value and use it as the starting point for the next
iteration. This procedure is repeated until the algorithm finds the optimal value of that minimizes the
objective function. We tried different starting points and they routinely lead to the same estimates.
5. Empirical Analysis and Results
In this section, we explain the empirical results and provide evidence on the fit of the model. At the end of
this section, we conduct counterfactual simulations and estimate market demand for a hypothetical
scenario in which Facebook did not seek tighter integration with Instagram. By contrasting demand
estimates from this counterfactual “without integration” scenario with those from the real “with
integration” scenario, we are able to estimate the impact of platform integration on different types of
applications.

18
5.1 Parameter Estimates
Estimation results are in Table 2. Estimates in the first column are from the model without consumer
heterogeneity (fixing to zero). The second column provides the results from the enhanced model with
consumer heterogeneity on network effect. The last two columns present estimates from the same models,
but with control of unobserved time trends. The sum of squared errors in Table 2 reveal that model fit
increases as controls of consumer heterogeneity and time effects are included in the model (smaller
squared errors mean better model fit).
-- Insert Table 2 Here --
The coefficient of lagged application user base is positive and significant. This suggests that
consumers derive a higher utility from using an application with a larger user base. The strong network
effect may be attributed to the unique features of Facebook applications: social and sharing. Facebook
users use these applications to share their photos with other users and comment/vote on photos posted by
others. Many Facebook applications embed a local social network within the Facebook social network, a
phenomenon we refer to as “social network within social network”. Also note that the small but
significant parameter of consumer heterogeneity indicates that users differ in their valuations of the
network size. Some users value a large network size more than others. Ignoring this heterogeneity leads to
overestimation of network effect.
The coefficient of Integration×Instagram is positive and significant, indicating that consumers
derive additional value from Instagram after its tighter integration with Facebook. The additional value
may come from better ease of use due to tighter integration. It may also come from consumers’ perceived
long-term viability of the first-party application after its tighter integration with the platform (Katz and
Shapiro 1992, Gallaugher and Wang 2002). Tighter integration by the platform owner may also signal
high quality/credibility of the application. Due to these benefits, users are more likely to choose the first-
party application after the integration.

19
The integration event reduces consumer valuation of third-party applications, as evident from the
negative coefficient of Integration×ThirdPartyApp. If consumer valuation of integration is purely from
the better ease of use of the first-party application being integrated, then the integration event should not
have any effect on consumer valuations of third-party applications. However, the negative effect suggests
that other factors such as stability or long-term viability of an application may also play a role in
consumer valuation of the application. Consumers may perceive the integration event as lower future
support of third-party applications from the platform owner, and as result, weaker perceived staying
power of third-party applications.12 To our best knowledge, these results provide the first empirical
evidence on how consumer valuations of first-party applications and third-party applications change
following platform integration.
Evaluating the overall impact of platform integration in the presence of network effect is
nontrivial. The parameter estimate of integration in Table 2 captures the one-period effect (first-order
effect). The one-period effect impacts consumer choices in current period , but the resulting application
user base will give rise to network effect in the next period through the lagged application user base ,
which enters consumer’s utility function in period 1 (second-order effect). As a result, the overall
effect of platform integration will be larger than the one-period effect. In other words, the second-order
effect amplifies the one-period effect of platform integration by a multiplier that is strictly larger than one.
In discrete choice models, it is impossible to derive a closed-form expression for the accumulated effect
of platform integration. However, as demonstrated in Section 5.3, this accumulated effect can be easily
computed by simulations using our structural model and parameter estimates.
5.2 Model Fit and Validation
Before doing further analysis, we first evaluate the performance of our proposed model. The proposed
model and parameter estimates enable us to predict each individual app’s demand and market share. It
12 The perception of weaker staying power could be driven by past consumer experiences in other contexts such as
the desktop OS ecosystems where Microsoft’s first-party applications eventually dominated in many complementary markets and drove away other competing third-party applications.
20
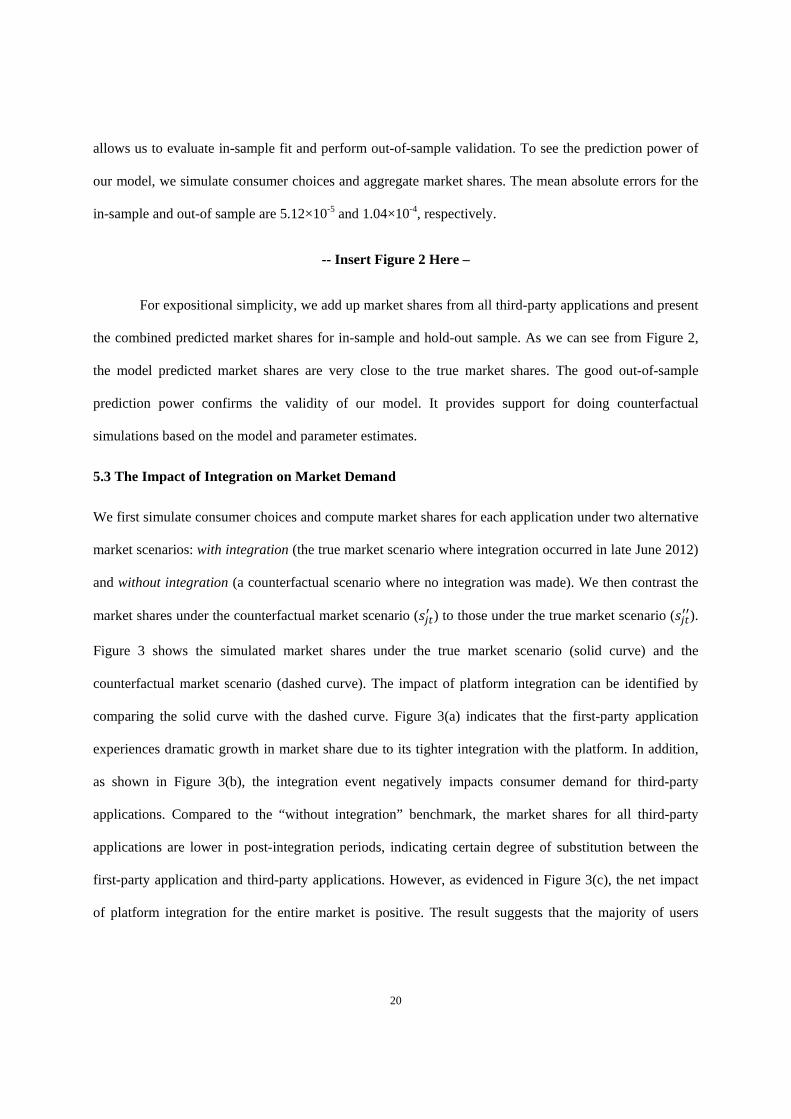
allows us to evaluate in-sample fit and perform out-of-sample validation. To see the prediction power of
our model, we simulate consumer choices and aggregate market shares. The mean absolute errors for the
in-sample and out-of sample are 5.12×10⁻⁵ and 1.04×10⁻⁴, respectively.
-- Insert Figure 2 Here –
For expositional simplicity, we add up market shares from all third-party applications and present
the combined predicted market shares for in-sample and hold-out sample. As we can see from Figure 2,
the model predicted market shares are very close to the true market shares. The good out-of-sample
prediction power confirms the validity of our model. It provides support for doing counterfactual
simulations based on the model and parameter estimates.
5.3 The Impact of Integration on Market Demand
We first simulate consumer choices and compute market shares for each application under two alternative
market scenarios: with integration (the true market scenario where integration occurred in late June 2012)
and without integration (a counterfactual scenario where no integration was made). We then contrast the
market shares under the counterfactual market scenario ( ) to those under the true market scenario ( ).
Figure 3 shows the simulated market shares under the true market scenario (solid curve) and the
counterfactual market scenario (dashed curve). The impact of platform integration can be identified by
comparing the solid curve with the dashed curve. Figure 3(a) indicates that the first-party application
experiences dramatic growth in market share due to its tighter integration with the platform. In addition,
as shown in Figure 3(b), the integration event negatively impacts consumer demand for third-party
applications. Compared to the “without integration” benchmark, the market shares for all third-party
applications are lower in post-integration periods, indicating certain degree of substitution between the
first-party application and third-party applications. However, as evidenced in Figure 3(c), the net impact
of platform integration for the entire market is positive. The result suggests that the majority of users

21
gained by Instagram are new users who did not use any application, rather than the incumbent users of
third-party applications. Therefore, the overall market demand increases after platform integration.
-- Insert Figure 3 Here --
We compute the percentage change in market share due to platform integration. In period ∆
(i.e., ∆ days after integration), this measure is calculated as
∆ ∆ ∆ ∆
∆ 100%. (5)
Table 3 summarizes the changes in market shares for the first-party application, third-party applications,
and the overall market. Compared to the “without integration” benchmark, tighter integration with
Facebook increases the market share of the first-party application by about 177.74% within 30 days after
the integration. In addition, the integration decreases the market share of third-party applications by
6.70%. However, the combined market share of all the 20 applications increases by 59.11%.
-- Insert Table 3 Here --
Our results suggest that tighter integration of Instagram has an overall positive effect on the
ecosystem for photo sharing applications.
6. Additional Analysis
The impact of the platform owner’s integration decision may vary across third-party applications. In this
section, we investigate the effect of integration on big and small third-party applications. In addition, we
extend the base model to capture the role of switching costs in consumer choices.
6.1 Variable Impact on Big and Small Third-Party Applications
In our main analysis we find that integration of the first-party application lowers consumer utility from
using third-party applications (Table 2). The negative effect suggests that long-term viability of an
application may play a role in consumer valuation. Consumers may lower their perception of the staying
22
power of third-party applications after the platform exercised its integration strategy. However, for
technology products that exhibit network effect, consumers associate a large user base with strong staying
power (Katz and Shapiro 1992, Gallaugher and Wang 2002). As a result, the effect of integration may be
different for third-party applications with different network sizes.
To capture this potential variable effect, we rank all the 19 third-party applications according to
their user base in the first period (two months before the integration event).13 We create a dummy variable
SmallThirdPartyApp where SmallThirdPartyApp equals to one if an app’s user base ranks below 10th,
and zero otherwise. Similarly, we create a dummy variable BigThirdPartyApp for the top 9 third-party
applications. After the segmentation, there are now three groups of applications, i.e., {first-party
applications, small third-party applications, big third-party applications}. We replace the interaction term
Integration×ThirdPartyApp in Equation (1) by two interaction terms Integration×SmallThirdPartyApp
and Integration×BigThirdPartyApp and re-estimate our model.
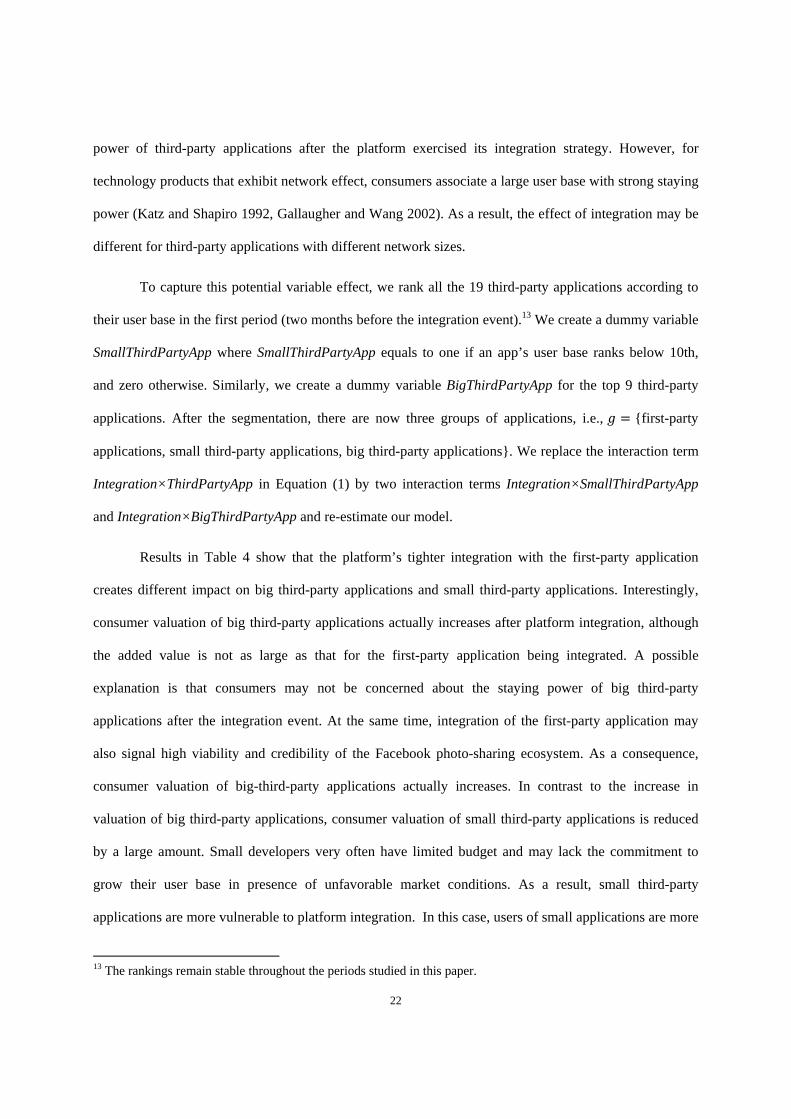
Results in Table 4 show that the platform’s tighter integration with the first-party application
creates different impact on big third-party applications and small third-party applications. Interestingly,
consumer valuation of big third-party applications actually increases after platform integration, although
the added value is not as large as that for the first-party application being integrated. A possible
explanation is that consumers may not be concerned about the staying power of big third-party
applications after the integration event. At the same time, integration of the first-party application may
also signal high viability and credibility of the Facebook photo-sharing ecosystem. As a consequence,
consumer valuation of big-third-party applications actually increases. In contrast to the increase in
valuation of big third-party applications, consumer valuation of small third-party applications is reduced
by a large amount. Small developers very often have limited budget and may lack the commitment to
grow their user base in presence of unfavorable market conditions. As a result, small third-party
applications are more vulnerable to platform integration. In this case, users of small applications are more
13 The rankings remain stable throughout the periods studied in this paper.
23
likely to migrate to bigger applications when the perceived long-term viability of these small applications
is weakened by the platform owner’s integration behavior.
Note that the overall impact of integration on demand for each application depends on consumer
utility of using the focal application relative other applications. Platform integration leads to a much
larger increase in consumer utility of Instagram as compared to big third-party applications (Table 4). As
a consequence, the overall market share for the big third-party applications grows at a slower rate after
integration as compared to the scenario without integration (Figure 4).
-- Insert Table 4 & Figure 4 Here --
Our results suggest that Facebook’s tighter integration with Instagram hurts small third-party
applications more. This variable impact has important implications for the platform owner. In the short-
run, the platform owner may benefit from demand increase following the integration of the first-party
application. However, in the long run, the platform may suffer from the loss in product variety in the
complementary market. The negative shock from platform owner’s integration strategy may cause
existing small third-party developers to exit the market. Further, potential new entrants may not see a fair
chance to appropriate their innovations and choose not to participate in the platform ecosystem. This may
hurt the platform in the long run.
6.2 Other Counterfactual Experiments
We conduct additional counterfactual experiments to highlight the impact of platform integration on the
first-party application, third-party applications, and the entire marketplace.
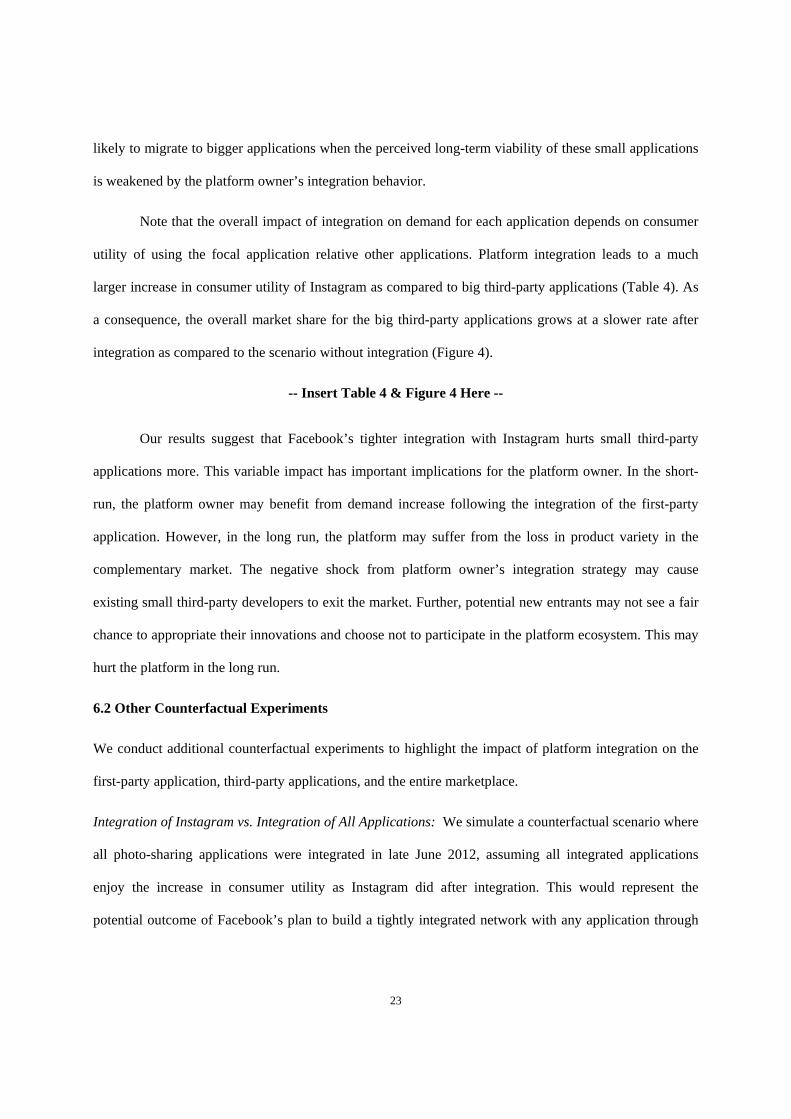
Integration of Instagram vs. Integration of All Applications: We simulate a counterfactual scenario where
all photo-sharing applications were integrated in late June 2012, assuming all integrated applications
enjoy the increase in consumer utility as Instagram did after integration. This would represent the
potential outcome of Facebook’s plan to build a tightly integrated network with any application through
24
its Open Graph interface.14 In Figure 5, the dotted curves correspond to the counterfactual scenario where
all applications were integrated. Compared to the true market scenario where only Instagram was
integrated, both big and small third-party applications are better off, but small third-party applications
benefit more from this aggressive integration strategy. Additionally, a loss in demand for Instagram is
compensated by an increase in demand for all third-party applications. As a result, the overall demand for
the photo-sharing ecosystem is much higher. However, note that the platform owner has to evaluate the
rent15 increase due to higher demand for third-party applications against the revenue loss due to lower
demand for Instagram and the additional integration cost for integrating third-party applications.
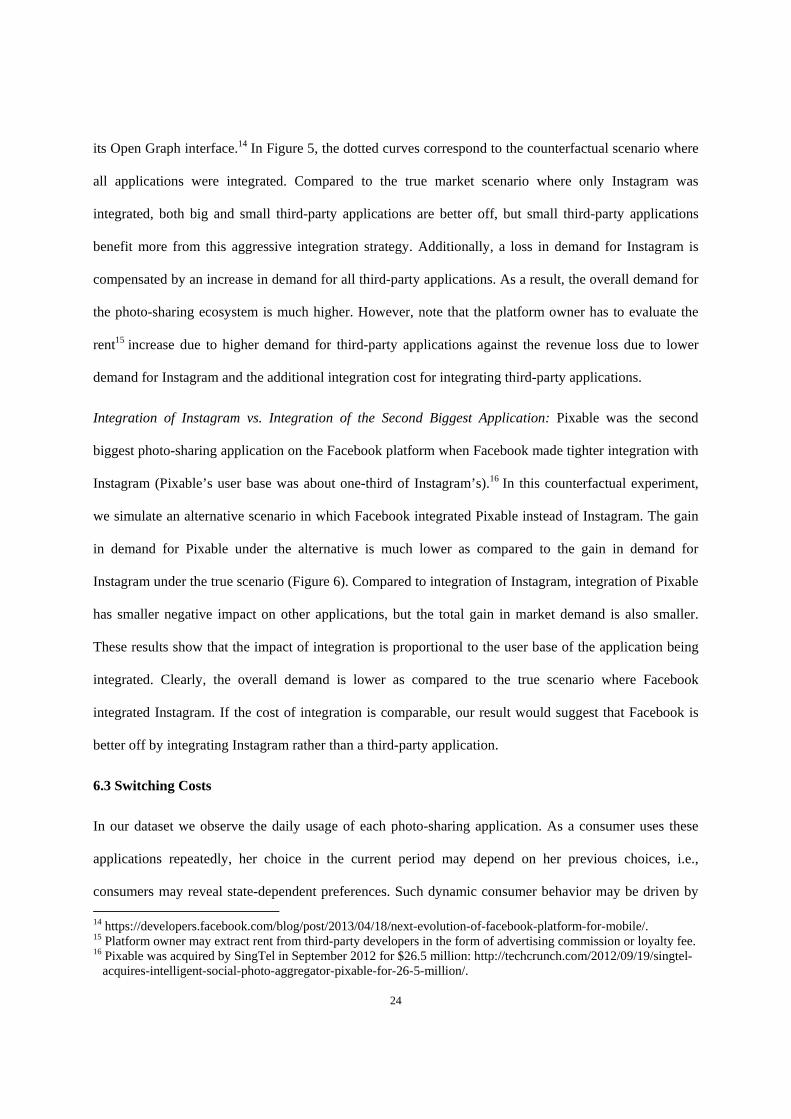
Integration of Instagram vs. Integration of the Second Biggest Application: Pixable was the second
biggest photo-sharing application on the Facebook platform when Facebook made tighter integration with
Instagram (Pixable’s user base was about one-third of Instagram’s).16 In this counterfactual experiment,
we simulate an alternative scenario in which Facebook integrated Pixable instead of Instagram. The gain
in demand for Pixable under the alternative is much lower as compared to the gain in demand for
Instagram under the true scenario (Figure 6). Compared to integration of Instagram, integration of Pixable
has smaller negative impact on other applications, but the total gain in market demand is also smaller.
These results show that the impact of integration is proportional to the user base of the application being
integrated. Clearly, the overall demand is lower as compared to the true scenario where Facebook
integrated Instagram. If the cost of integration is comparable, our result would suggest that Facebook is
better off by integrating Instagram rather than a third-party application.
6.3 Switching Costs
In our dataset we observe the daily usage of each photo-sharing application. As a consumer uses these
applications repeatedly, her choice in the current period may depend on her previous choices, i.e.,
consumers may reveal state-dependent preferences. Such dynamic consumer behavior may be driven by 14 https://developers.facebook.com/blog/post/2013/04/18/next-evolution-of-facebook-platform-for-mobile/. 15 Platform owner may extract rent from third-party developers in the form of advertising commission or loyalty fee. 16 Pixable was acquired by SingTel in September 2012 for $26.5 million: http://techcrunch.com/2012/09/19/singtel-
acquires-intelligent-social-photo-aggregator-pixable-for-26-5-million/.

25
switching cost which reduces a consumer’s utility for other alternatives, or by variety-seeking behavior
which reduces a consumer’s utility from using the same application. For Facebook photo-sharing
applications, state-dependent preferences may be attributed to the social features (e.g., social network) in
these applications. Switching to a new application means leaving the current network and joining a
different community, which can be infeasible to some consumers with high switching costs but attractive
to others with strong variety-seeking preferences.
The consumer utility function in Equation (1) can be modified to capture the effect of previous
choices. Given that consumer chose application in period 1 , her utility from choosing
application in period is
∉ 0, , (6)
where is consumer ’ cost (or benefit if negative) from using another application and ∉
0, is an indicator function defined as
∉ 0,1, if 0and 0, otherwise.
Specifically, we assume that a consumer incurs a cost for switching to a different application. However,
switching to/from the outside option does not incur such cost.
We assume is drawn from a normal distribution ~ , , with mean and variance .
We fix 1 as it is difficult to identity both the mean and variance. Therefore, , where
follows the standard normal distribution. Again, we normalize the mean utility from the outside option to
zero, i.e., .
Identification of switching cost is methodologically challenging when only aggregate-level
demand data are available. In the dataset, we do not observe an individual consumer’s historical choices.
Our identification strategy relies on the observed demand patterns. We observe the volume of incumbent

26
application users as well as the number of new users joining the ecosystem. Incumbent application users
face switching costs whereas new users do not. Given an initial set of parameter values, our iterative
estimation procedure computes both existing and new users’ probability of choosing an application based
on product characteristics, users’ previous choices, and switching costs. We equate the model-predicted
market shares and the actual market shares in each period to solve for the mean utility and estimate the
next set of parameter values. The algorithm iterates until the parameter estimates converges. Appendix C
provides the details of the estimation procedure. Estimates of the mean switching costs are shown in
Table 5. Comparing the sum of squared errors with those in Table 2, we can see that the model fit
improves after accounting for the switching costs.
-- Insert Table 5 & Figure 7 Here –
Our results show that consumers on average incur high switching costs (Table 5). Figure 7 shows
that demand predictions, after accounting for switching costs, are qualitatively similar to those from the
base model.
Switching costs may explain the observed demand patterns after the integration event. If there
was no switching cost, the fast growth of Instagram’s user base (and thus the increase in consumer utility
from choosing Instagram) will attract many third-party applications users to Instagram. But we do not
observe such big migration following the integration due to high switching costs which override the
benefits of switching to Instagram. As outside option users and new users do not incur switching costs,
they are far more likely to use Instagram after the tighter integration. Therefore, a large fraction of users
Instagram gained are new users who did not use any application in previous period, rather than incumbent
users of third-party applications.
27
7. Endogeneity Issues
We conduct several robustness checks to account for potential endogeneity issues. We discuss how to
address these endogeneity concerns using appropriate instruments.
7.1 Endogeneity of Lagged User Base
As explained earlier, our model estimates might be biased due to the use of predetermined lagged user
base which may be correlated with unobservables. In order to correct for this bias, we follow the approach
of Arellano and Bover (1995) and use lagged differences of application user base as instruments for the
mean utility function in Equation (4) and lagged application user base as instruments for the first-
difference of this equation. The former equation is often referred to as “level equation”, while the latter
“first-differenced” equation. Blundell and Bond (1998) show that these instruments are correlated with
explanatory variables and orthogonal to unobserved errors. These instruments have been successfully
applied by researchers in a wide variety of fields within marketing and economics (see, e.g., Acemoglu
and Robinson 2001, Durlauf et al. 2005, Clark et al. 2009, Yoganarasimhan 2012). To check the validity
of these instruments in our context, we first perform weak identification tests on the instruments. The F
statistic is greater than the recommended threshold of 10, suggesting the instruments are correlated with
the suspected endogeneous variable (i.e., our instruments are not weak). We then perform the
overidentification test (Hansen’s J test) and cannot reject the null hypothesis of valid overidentifying
restrictions. We apply these instruments using the generalized method of moments (GMM) method. Our
estimation approach is explained in Appendix B.
-- Insert Table 6 Here --
GMM estimates of the models are in Table 6. Compared to the base model where instruments are
not included, the two set of instruments both give qualitatively similar results. In models using lagged
user bases as instruments, estimates of network effect are slightly larger and estimates of impact of
integration are slightly smaller. In models using lagged differences of user bases as instruments, estimates
28
of network effect are smaller and estimates of impact of integration are larger. Our estimates without
using any instruments are located between the estimates using these two sets of instruments.
7.2 Endogeneity of Integration Timing
Facebook and Instagram might have chosen the integration timing such that the integration is more likely
to lead to positive outcome. In other words, the integration event might be correlated with the unobserved
shocks that enter a consumer’s utility function but are unobservable to us. To control for this potential
endogeneity, we use Facebook’s stock price as an instrument for the integration timing.
Corporate investments are sensitive to stock prices (Baker et al. 2003, Chen et al. 2007).
Additionally, firms are expected to increase their innovation activities and exploratory search after going
public (Wu 2012). Facebook held its initial public offering (IPO) in May 2012, but following that the
share price dropped and the stock was considered disappointing.17 The company was under pressure from
investors to generate more revenue (e.g., by monetizing Instagram) to improve its stock performance.18
Therefore, Facebook’s subsequent investments were likely to be driven by its unsatisfactory stock price.
Tighter integration of Instagram was one such innovation investment where Facebook explored seamless
data exchange between Instagram and Facebook. Thus, the decision on the timing of integration was
likely to be influenced by Facebook’s stock price. The suspected correlation between the integration
timing and Facebook’s stock market performance is evident from the high correlation between the
integration dummy and Facebook’s stock price (correlation coefficient is -0.68).
Meanwhile, we expect that Facebook’s stock price is not likely to influence consumers’ relative
preferences for various photo-sharing applications. The stock price may influence a user’s decision to join
Facebook. However, conditional on the fact that a consumer already joined Facebook, the stock price is
not very likely to be directly correlated with the consumer’s utility of using Instagram vis-à-vis any other
photo-sharing application on the Facebook platform. Further, the Facebook platform was supporting over
17 http://www.forbes.com/sites/davidmaris/2012/05/21/facebook-stock-drops-what-really-goes-on-in-ipos/. 18 http://www.businessinsider.com/5-ways-facebook-can-monetize-instagram-2012-4.
29
9 million applications in different categories and only a small fraction (<1%) of Facebook users were
using Instagram for photo-sharing on Facebook during our panel period (Table 1). As a result, although
the stock price may be correlated with platform-specific unobservables, it is less likely to be correlated
with unobservables specific to an individual application (e.g., promotions by Instagram).
We test the validity of using Facebook’s stock price alone as an instrument for the integration
timing. The F statistic is far greater than the recommended threshold of 10, suggesting the instruments are
correlated with the integration timing. Note that we use stock performance data from SecondMarket19 for
the month of April 2012 as Facebook’s IPO took place in May 2012. We also test the validity of using
Facebook’s stock price together with lagged differences of application user base as instruments for both
of the suspected endogenous variables (i.e., integration timing and lagged application user base). The F
statistic is much larger than the recommended threshold of 10, suggesting the instruments are not weak.
The Hansen’s J test cannot reject the null hypothesis of valid overidentifying restrictions. These tests
provide statistical evidence that the instruments are valid.
-- Insert Table 7 Here --
Estimates with this instrument, as reported in Table 7, remain qualitatively unchanged compared
to estimates of the models without using any instruments. These additional analyses provide evidence that
our results and main findings are robust.
8. Discussion and Conclusion
In this paper, we build a structural model of consumer choices and estimate application demand using
aggregate data on application usage before and after platform integration. We find that consumers obtain
additional value from Instagram after its tighter integration with Facebook, leading to dramatic growth in
demand for Instagram. However, a large fraction of new users Instagram gained are new users who did
not use any photo-sharing application, rather than incumbent users of third-party applications. As a result,
19 https://www.secondmarket.com/facebook-on-secondmarket/.
30
the overall demand for Instagram and third-party applications actually increases, which suggest that
Facebook’s integration strategy benefits the complementary market. We find that the integration has
different impact on big third-party applications and small third-party applications. Consumer valuations
of small third-party applications are reduced by a larger amount, whereas valuations of big third-party
applications are resistant to the integration shock. Such variable effects may be attributed to users’ lower
perceived staying power of small third-party applications after platform integration.
Our study makes several contributions. Managing the tension between first-party content and
third-party content has been a critical part of major platforms’ strategies. Previous research has mostly
relied on theoretical models to study strategic interactions between the platform owner and third-party
developers (i.e., supply-side behaviors). Our paper is the first study that empirically evaluates consumer
preferences for first-party applications vis-à-vis third-party applications (i.e., demand-side behaviors).
This paper is also the first to empirically demonstrate the impact of integration of an application by a
platform on the application ecosystem. Our model and findings provide important implications for
managing platform-based businesses. Analysis of the substitution and complementary effects between
first-party applications and third-party applications may help platform owners determine the overall
impacts of their platform strategies. Our structural demand analysis can also help platform owners
evaluate whether it is beneficial to tightly integrate certain third-party applications with the platforms.
Third-party developers may also benefit from better understanding of consumer preferences for first-party
applications and third-party applications. Our models and results may help developers decide whether it is
profitable to participate in a platform in the presence of first-party applications.
Our findings shed light on the effectiveness of the platform’s strategy to provide tighter
integration with the first-party application. On one hand, our results suggest that such a strategy may be
beneficial particularly in a market where network effects and switching costs are present. In such a market
scenario, the platform owner may gain new users due to the appeal of the tightly integrated first-party
application while not hurting third-party applications too much. On the other hand, our research informs

31
platform owners and policy makers about the potential dark side of platform integration. As small third-
party applications are more vulnerable to the negative shock from vertical integration, such integration
strategy may cause small third-party developers to exit the market, which may reduce the variety of
products/services available in the complementary market. For platform owners and policy makers, our
research informs the trade-off between the gains in accumulated demand in the short-run and losses in
product variety in the long-run due to platform integration. As small third-party applications are more
vulnerable to platform integration, platform owners may come up with certain subsidy schemes to
incentivize small developers to stay in their ecosystems.
For third-party developers, our research has implications for their product design. Social
applications like Facebook applications exhibit network effects and switching costs. Third-party
developers may incorporate social features into their products/services to create large user base that
mitigates the negative impact of platform integration. Building a large user base not only creates high
exchange value for users, but also helps maintain users’ perceived staying power of the products. For
small third-party applications facing the threat of first-party applications, the priority of their business
strategies may be given to continuously growing the user base, instead of rushing to monetize the existing
customers.
Our study is not without limitations. The focus of this paper is short-run demand-side consumer
behaviors, i.e., how consumers respond to platform integration and the resulting demand patterns for
different types of applications in the complementary market. We do not model third-party developers’
strategic decisions such as entry and exit, which require completely different models and assumptions.
Future research may use a longer panel dataset to investigate these strategic responses and see how they
impact the long-term viability of the ecosystem. Future research can also look into the role of product
characteristics and product differentiation in influencing demand for first-party and third-party
applications. Understanding the role of product differentiation may provide third-party developers
important insights into optimal product design. It may also help platform owners decide what product
32
attributes should be included in their first-party applications. Finally, out study is restricted to one
platform ecosystem. Future studies may evaluate the robustness of the results in other platform-based
ecosystems.
References
Acemoglu, D., and Robinson, J. (2001). “A theory of political transition,” American Economic Review (91:4), pp. 938–963.
Anderson, T.W., and Hsiao, C. 1982. “Formulation and estimation of dynamic models using panel data,” Journal of Econometrics (18:1), pp. 47-82.
Arellano, M, and Bover, O. 1995. “Another look at the instrumental variable estimation of error-components models,” Journal of Econometrics (68:1), pp. 29-51.
Baldwin, C.Y., and Clark, K.B. 2000. Design rules: The power of modularity. MIT Press.
Baker, M., Stein, J.C., and Wurgler, J. 2003. “When does the market matter? Stock prices and the investment of equity-dependent firms,” Quarterly Journal of Economics (118:3), pp. 969-1005.
Bass F.M. 1969. “A new product growth model for consumer durables,” Management Science (15:5), pp. 215–227.
Berry, S., Levinsohn, J., and Pakes, A. 1995. “Automobile prices in market equilibrium,” Econometrica (63:4), pp. 841-890.
Blundell, R., and Bond, S. 1998. “Initial conditions and moment restrictions in dynamic panel data models,” Journal of Econometrics (87:1), pp. 115-143.
Boudreau, K. 2007. “Does opening a platform stimulate innovation? The effect on systemic and modular innovations,” MIT Sloan Research Paper No. 4611-05, Massachusetts Institute of Technology, Cambridge, MA.
Brynjolfsson, E, and Kemerer, C.F. 1996. “Network externalities in microcomputer software: An econometric analysis of the spreadsheet market,” Management Science (42:12), pp. 1627-1647.
Chen, Q., Goldstein, I., and Jiang, W. 2007. “Price informativeness and investment sensitivity to stock price,” Review of Financial Studies (20:3), pp. 619-650.
Chipty, T. 2001. “Vertical integration, market foreclosure, and consumer welfare in the cable television industry.” American Economic Review (91:3), pp. 428-453.
Clark, C.C., Doraszelski, U., and Draganska, M. 2009. “The effect of advertising on brand awareness and perceived quality: an empirical investigation using panel data,” Quantitative Marketing and Economics (7:2), pp. 207–236.

33
Cooper, R. G. 2000. Product Leadership: Creating and Launching Superior New Products. New York: Perseus Publishing.
Davis, F. D. 1989. “Perceived usefulness, perceived ease of use, and user acceptance of information technology,” MIS Quarterly (13:3), pp. 319-340.
Danaher, B., Huang, Y., Smith, M.D., and Telang, R. 2014. “An empirical analysis of digital music bundling strategies,” Forthcoming, Management Science.
Dhebar, A. 1995. “Complementarity, compatibility, and product change: breaking with the past?,” Journal of Product Innovation Management (12:2), pp. 136-152.
Durlauf, S., Johnson, P., and Temple, J. 2005. “Growth econometrics,” In P. Aghion & S. Durlauf (Eds.), Handbook of Econometric Growth. Amsterdam: North-Holland.
Eisenmann, T. R., Parker, G., and Van Alstyne, M.W. 2011. “Platform envelopment,” Strategic Management Journal (32:12), pp. 1270-1285.
Evans, D. S., Hagiu, A., and Schmalensee, R. 2006. Invisible Engines: How Software Platforms Drive Innovation and Transform Industries. Cambridge, MA: MIT Press.
Fuentelsaz, L., Maicas, J.P., and Polo, Y. 2012. “Switching costs, network effects, and competition in the European mobile telecommunications industry,” Information Systems Research (23:1), pp. 93-108.
Gallaugher, J.M., and Wang, Y.M. 2002. “Understanding network effects in software markets: Evidence from web server pricing,” MIS Quarterly (26:4), pp. 303-327.
Gawer, A., and Cusumano, M. A. 2002. Platform leadership: How Intel, Microsoft, and Cisco drive industry innovation. Boston: Harvard Business School Press.
Gawer, A., and Henderson, R. 2007. “Platform owner entry and innovation in complementary markets: Evidence from Intel,” Journal of Economics & Management Strategy (16:1), pp. 1-34.
Ghose, A., Ipeirotis, P., and Li, B. 2012. “Designing ranking systems for hotels on travel search engines by mining user-generated and crowd-sourced content,” Marketing Science (31:3), pp. 493-520.
Ghose, A., and Han, S. 2014. “Estimating demand for mobile apps in the new economy,” Forthcoming, Management Science.
Gowrisankaran, G., and Rysman, M. 2012. “Dynamics of consumer demand for new durable goods,” Journal of Political Economy (120:6), pp. 1173-1219.
Hagiu, A., and Spulber, D. 2013. “First-party content and coordination in two-sided markets,” Management Science (59:4), pp. 933-949.
Hahn, J., and Kuersteiner, G. 2002. “Asymptotically unbiased inference for a dynamic panel model with fixed effects when both n and T are large,” Econometrica (70:4), pp. 1639-1657.
Huang, P., Ceccagnoli, M, Forman, C., and Wu, D.J. 2013. “Appropriability mechanisms and the platform partnership decision: Evidence from enterprise software,” Management Science (59:1), pp. 102-121.
34
Kauffman, R.J., McAndrews, J., and Wang, Y.M. 2000. “Opening the “black box” of network externalities in network adoption,” Information Systems Research (11:1), pp. 61-82.
Katz, M.L., and Shapiro, C. 1986. “Technology Adoption in the Presence of Network Externalities,” Journal of Political Economy (94:4), pp. 822-841.
Katz, M.L., and Shapiro, C. 1992. “Product introduction with network externalities,” Journal of Industrial Economics (40), pp. 55-83.
Farrell, J., and Katz, M.L. 2000. “Innovation, rent extraction, and integration in systems markets,” Journal of Industrial Economics (48:4), pp. 413-432.
Lee, R.S. (2013). “Vertical integration and exclusivity in platform and two-sided markets,” American Economic Review (103:7), pp. 2960-3000.
Mahajan, V., Müller, E., and Bass, F.M. 1990. “New product diffusion models in marketing: A review and directions for research,” Journal of Marketing (54:1), pp. 1-26.
Nambisan, S. 2002. “Complementary product integration by high-technology new ventures: the role of initial technology strategy,” Management Science (48:3), pp. 382-398.
Nevo, A. 2001. “Measuring market power in the ready‐to‐eat cereal industry,” Econometrica (69:2), pp. 307-342.
Nickell, S. 1981. “Biases in dynamic models with fixed effects,” Econometrica (49:6), pp. 1417-1426.
Song, M. 2011. “A hybrid discrete choice model of differentiated product demand with an application to personal computers,” Working Paper, University of Rochester.
Tiwana, A., Konsynski, B., and Bush, A.A. 2010. Platform evolution: Coevolution of platform architecture, governance, and environmental dynamics,” Information Systems Research (21:4), pp. 675-687.
Wooldridge, J.M. 2010. Econometric Analysis of Cross Section and Panel Data. MIT Press.
Wu, G.A. 2012. “The effect of going public on innovative productivity and exploratory search,” Organization Science (23:4), 928-950.
Xue, M., Hitt, L.M, and Chen, P.Y. 2011. “Determinants and outcomes of internet banking adoption,” Management Science (57:2), pp. 291-307.
Yoganarasimhan, H. 2012. “Impact of social network structure on content propagation: A study using YouTube data,” Quantitative Marketing and Economics (10:1), pp. 111-150.
Zhu, K., Kraemer, K.L., Gurbaxani, V., and Xu, S.X. 2006. “Migration to open-standard interorganizational systems: Network effects, switching costs, and path dependency,” MIS Quarterly (30:SI), pp. 515-539.

35
Appendix A-C. Available upon request
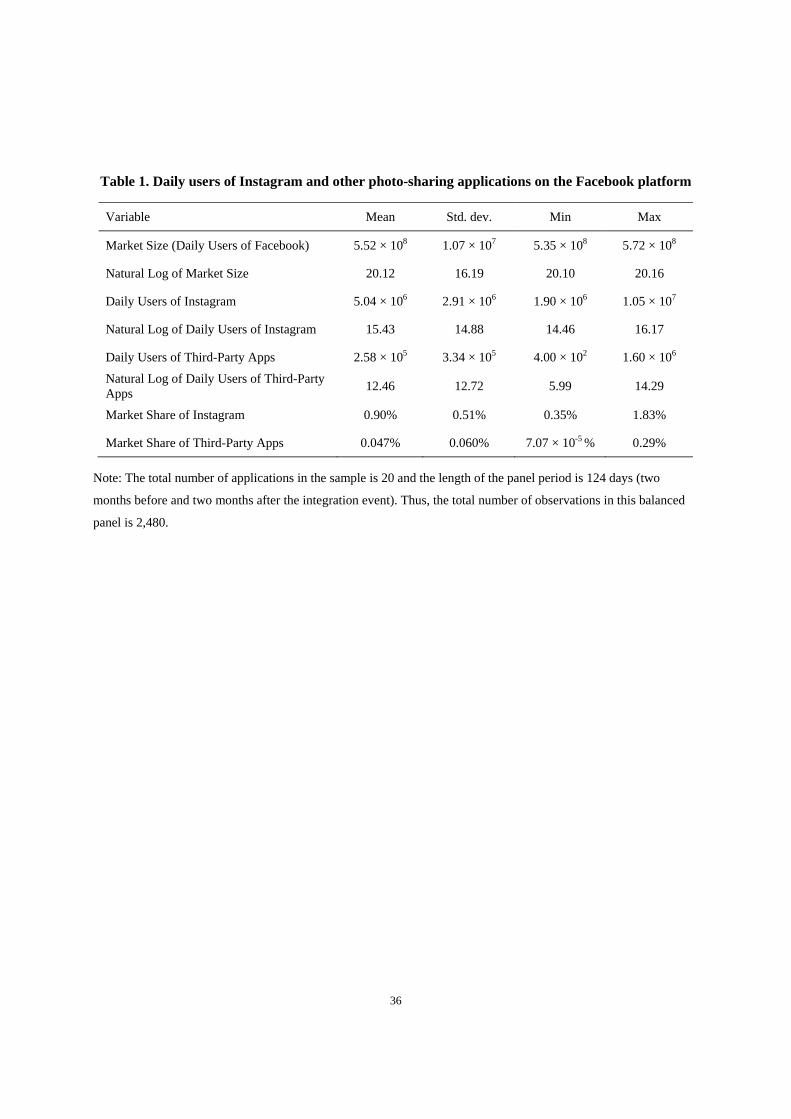
36
Table 1. Daily users of Instagram and other photo-sharing applications on the Facebook platform
Variable Mean Std. dev. Min Max
Market Size (Daily Users of Facebook) 5.52 × 10⁸ 1.07 × 10⁷ 5.35 × 10⁸ 5.72 × 10⁸
Natural Log of Market Size 20.12 16.19 20.10 20.16
Daily Users of Instagram 5.04 × 10⁶ 2.91 × 10⁶ 1.90 × 10⁶ 1.05 × 10⁷
Natural Log of Daily Users of Instagram 15.43 14.88 14.46 16.17
Daily Users of Third-Party Apps 2.58 × 10⁵ 3.34 × 10⁵ 4.00 × 10² 1.60 × 10⁶
Natural Log of Daily Users of Third-Party Apps
12.46 12.72 5.99 14.29
Market Share of Instagram 0.90% 0.51% 0.35% 1.83%
Market Share of Third-Party Apps 0.047% 0.060% 7.07 × 10⁻⁵ % 0.29%
Note: The total number of applications in the sample is 20 and the length of the panel period is 124 days (two
months before and two months after the integration event). Thus, the total number of observations in this balanced
panel is 2,480.
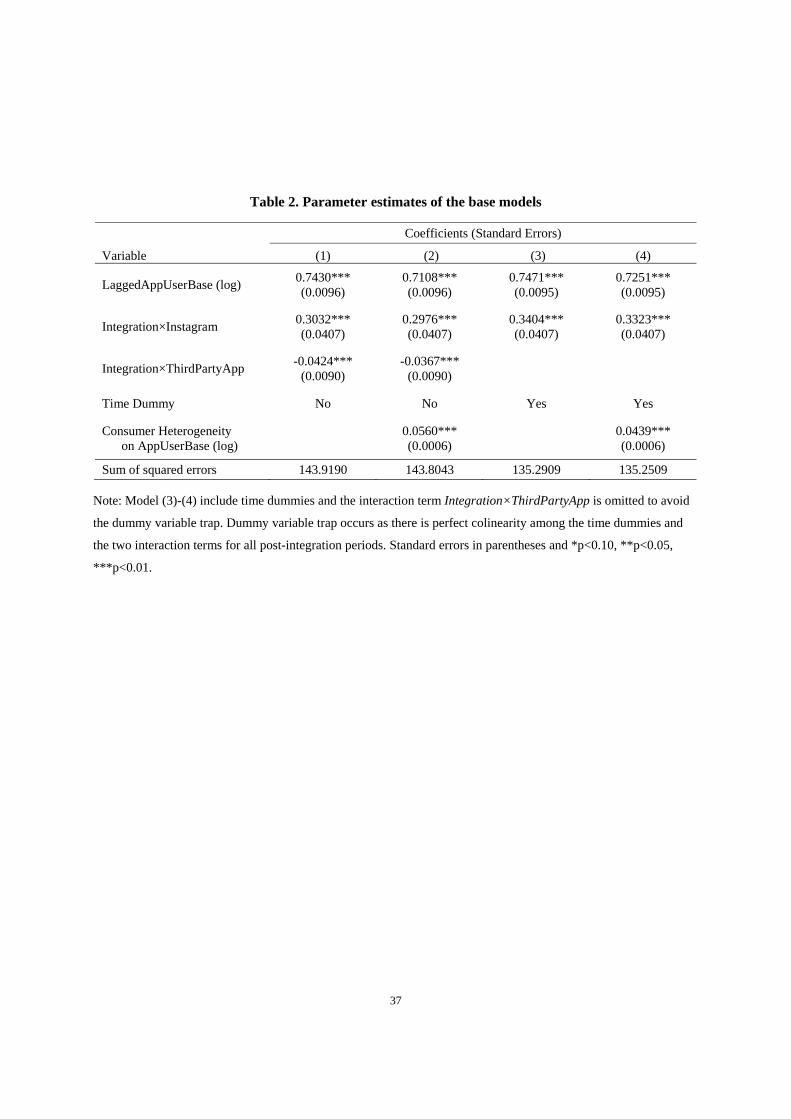
37
Table 2. Parameter estimates of the base models
Variable
Coefficients (Standard Errors)
(1) (2) (3) (4)
LaggedAppUserBase (log) 0.7430*** (0.0096)
0.7108*** (0.0096)
0.7471*** (0.0095)
0.7251*** (0.0095)
Integration×Instagram 0.3032*** (0.0407)
0.2976*** (0.0407)
0.3404*** (0.0407)
0.3323*** (0.0407)
Integration×ThirdPartyApp -0.0424***
(0.0090) -0.0367***
(0.0090)
Time Dummy No No Yes Yes
Consumer Heterogeneity on AppUserBase (log)
0.0560*** (0.0006)
0.0439*** (0.0006)
Sum of squared errors 143.9190 143.8043 135.2909 135.2509
Note: Model (3)-(4) include time dummies and the interaction term Integration×ThirdPartyApp is omitted to avoid
the dummy variable trap. Dummy variable trap occurs as there is perfect colinearity among the time dummies and
the two interaction terms for all post-integration periods. Standard errors in parentheses and *p<0.10, **p<0.05,
***p<0.01.
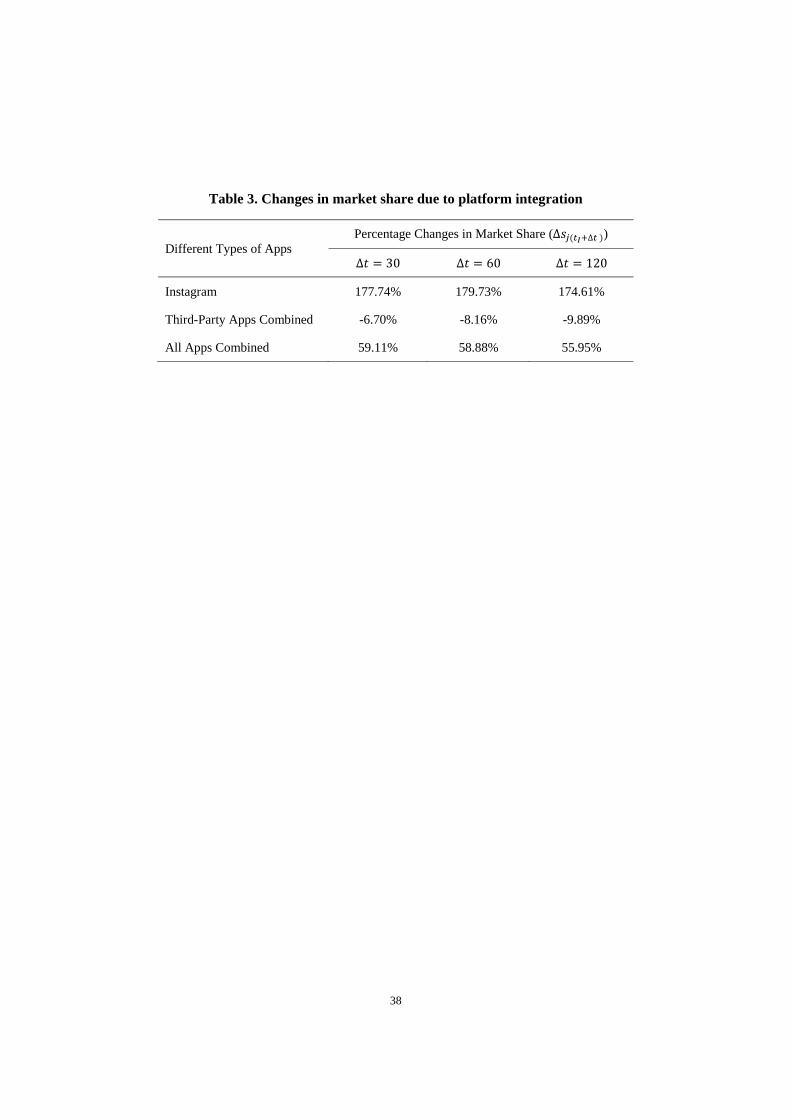
38
Table 3. Changes in market share due to platform integration
Different Types of Apps Percentage Changes in Market Share (∆ ∆ )
∆ 30 ∆ 60 ∆ 120
Instagram 177.74% 179.73% 174.61%
Third-Party Apps Combined -6.70% -8.16% -9.89%
All Apps Combined 59.11% 58.88% 55.95%

39
Table 4. Variable impact of integration on big and small third-party applications
Variable
Coefficients (Standard Errors)
(1) (2) (3) (4) (5) (6)
LaggedAppUserBase (log) 0.7118*** (0.0102)
0.6358*** (0.0102)
0.7153*** (0.0101)
0.6182*** (0.0101)
0.7155*** (0.0101)
0.6278*** (0.0101)
Integration×Instagram 0.3419*** (0.0404)
0.3489*** (0.0403)
0.3090*** (0.0403)
0.2826*** (0.0402)
0.4639*** (0.0427)
0.4531*** (0.0426)
Integration×SmallThirdPartyApp -0.1293***
(0.0136) -0.1166***
(0.0135) -0.1576***
(0.0184) -0.1735***
(0.0183)
Integration×BigThirdPartyApp 0.0307** (0.0124)
0.0618*** (0.0123)
0.1571*** (0.0184)
0.1737*** (0.0183)
Time Dummy No No Yes Yes Yes Yes
Consumer Heterogeneity on AppUserBase (log)
0.0847*** (0.0004)
0.1042*** (0.0004)
0.0936*** (0.0004)
Sum of squared errors 140.2847 139.7101 131.7789 131.3666 131.7984 131.3949
Note: Model (3)-(4) include time dummies and the interaction term Integration×BigThirdPartyApp is omitted to avoid the dummy variable trap. Dummy variable
trap occurs because there is perfect colinearity among the time dummies and the three interaction terms for all post-integration periods. Similarly, Model (5)-(6)
include time dummies and the interaction term Integration×SmallThirdPartyApp is omitted. Standard errors are in parentheses and *p<0.10, **p<0.05,
***p<0.01.
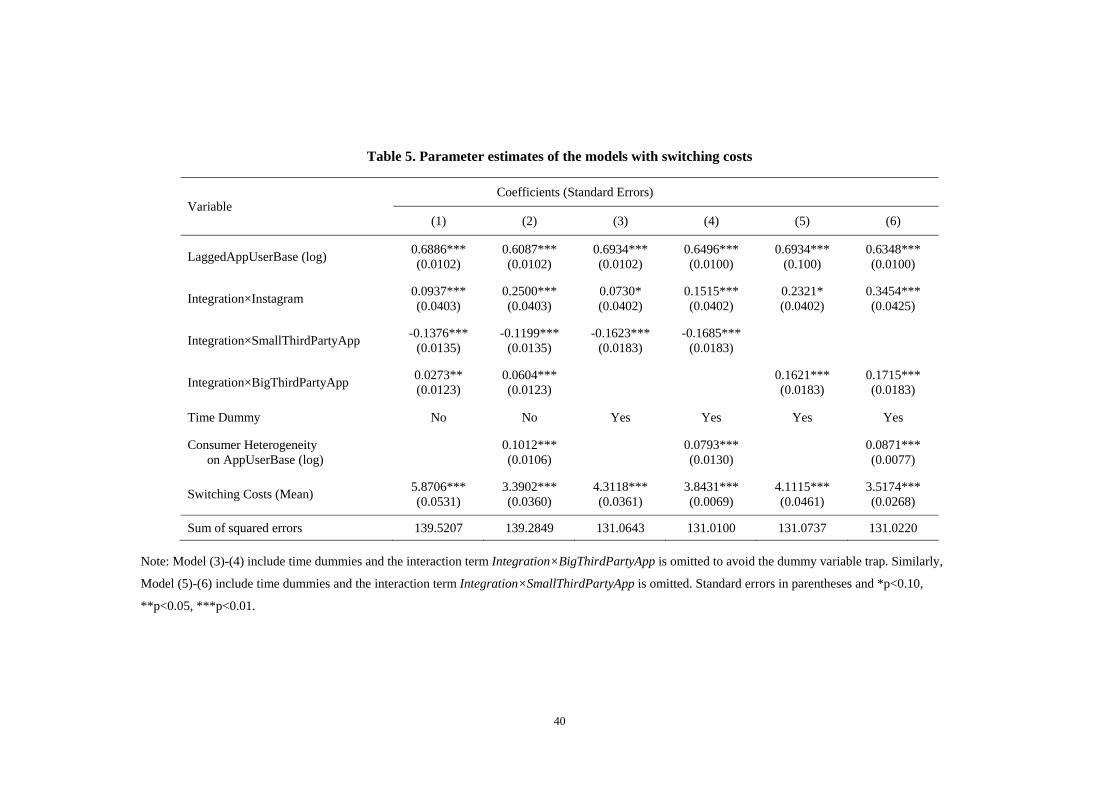
40
Table 5. Parameter estimates of the models with switching costs
Variable Coefficients (Standard Errors)
(1) (2) (3) (4) (5) (6)
LaggedAppUserBase (log) 0.6886*** (0.0102)
0.6087*** (0.0102)
0.6934*** (0.0102)
0.6496*** (0.0100)
0.6934*** (0.100)
0.6348*** (0.0100)
Integration×Instagram 0.0937*** (0.0403)
0.2500*** (0.0403)
0.0730* (0.0402)
0.1515*** (0.0402)
0.2321* (0.0402)
0.3454*** (0.0425)
Integration×SmallThirdPartyApp -0.1376***
(0.0135) -0.1199***
(0.0135) -0.1623***
(0.0183) -0.1685***
(0.0183)
Integration×BigThirdPartyApp 0.0273** (0.0123)
0.0604*** (0.0123)
0.1621*** (0.0183)
0.1715*** (0.0183)
Time Dummy No No Yes Yes Yes Yes
Consumer Heterogeneity on AppUserBase (log)
0.1012*** (0.0106)
0.0793*** (0.0130)
0.0871*** (0.0077)
Switching Costs (Mean) 5.8706*** (0.0531)
3.3902*** (0.0360)
4.3118*** (0.0361)
3.8431*** (0.0069)
4.1115*** (0.0461)
3.5174*** (0.0268)
Sum of squared errors 139.5207 139.2849 131.0643 131.0100 131.0737 131.0220
Note: Model (3)-(4) include time dummies and the interaction term Integration×BigThirdPartyApp is omitted to avoid the dummy variable trap. Similarly,
Model (5)-(6) include time dummies and the interaction term Integration×SmallThirdPartyApp is omitted. Standard errors in parentheses and *p<0.10,
**p<0.05, ***p<0.01.
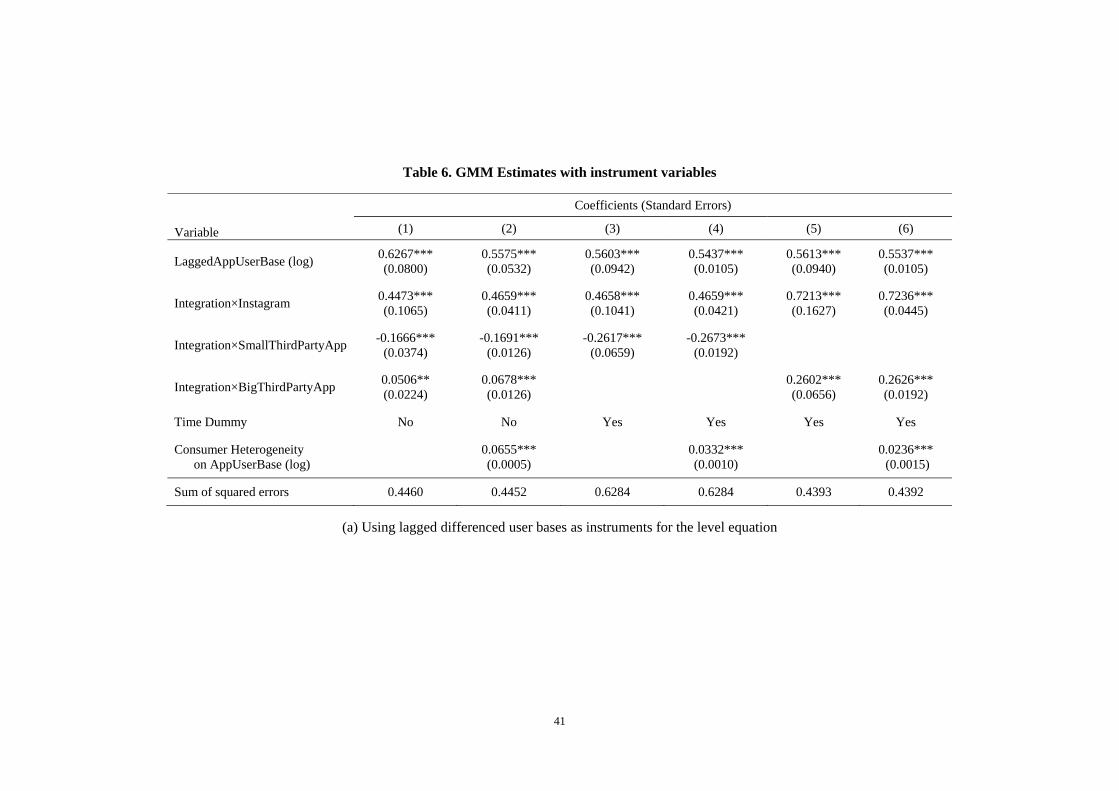
41
Table 6. GMM Estimates with instrument variables
Variable
Coefficients (Standard Errors)
(1) (2) (3) (4) (5) (6)
LaggedAppUserBase (log) 0.6267*** (0.0800)
0.5575*** (0.0532)
0.5603*** (0.0942)
0.5437*** (0.0105)
0.5613*** (0.0940)
0.5537*** (0.0105)
Integration×Instagram 0.4473*** (0.1065)
0.4659*** (0.0411)
0.4658*** (0.1041)
0.4659*** (0.0421)
0.7213*** (0.1627)
0.7236*** (0.0445)
Integration×SmallThirdPartyApp -0.1666***
(0.0374) -0.1691***
(0.0126) -0.2617***
(0.0659) -0.2673***
(0.0192)
Integration×BigThirdPartyApp 0.0506** (0.0224)
0.0678*** (0.0126)
0.2602*** (0.0656)
0.2626*** (0.0192)
Time Dummy No No Yes Yes Yes Yes
Consumer Heterogeneity on AppUserBase (log)
0.0655*** (0.0005)
0.0332*** (0.0010)
0.0236*** (0.0015)
Sum of squared errors 0.4460 0.4452 0.6284 0.6284 0.4393 0.4392
(a) Using lagged differenced user bases as instruments for the level equation
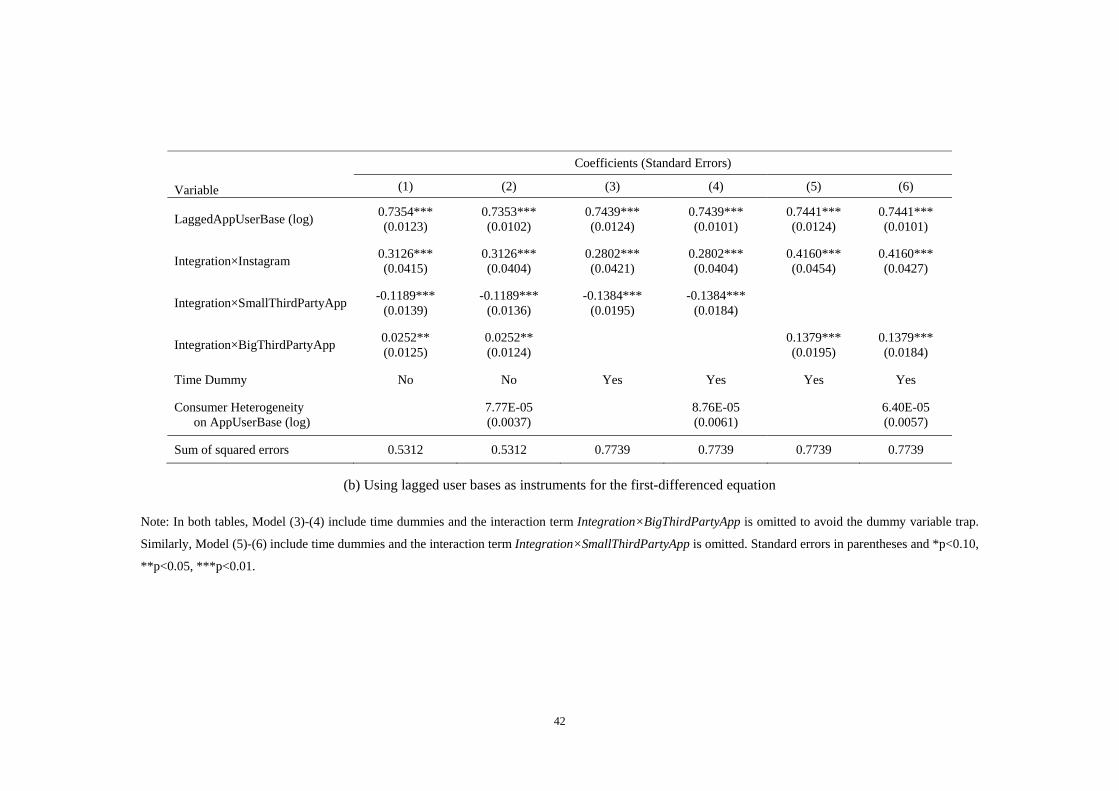
42
Variable
Coefficients (Standard Errors)
(1) (2) (3) (4) (5) (6)
LaggedAppUserBase (log) 0.7354*** (0.0123)
0.7353*** (0.0102)
0.7439*** (0.0124)
0.7439*** (0.0101)
0.7441*** (0.0124)
0.7441*** (0.0101)
Integration×Instagram 0.3126*** (0.0415)
0.3126*** (0.0404)
0.2802*** (0.0421)
0.2802*** (0.0404)
0.4160*** (0.0454)
0.4160*** (0.0427)
Integration×SmallThirdPartyApp -0.1189***
(0.0139) -0.1189***
(0.0136) -0.1384***
(0.0195) -0.1384***
(0.0184)
Integration×BigThirdPartyApp 0.0252** (0.0125)
0.0252** (0.0124)
0.1379*** (0.0195)
0.1379*** (0.0184)
Time Dummy No No Yes Yes Yes Yes
Consumer Heterogeneity on AppUserBase (log)
7.77E-05 (0.0037)
8.76E-05 (0.0061)
6.40E-05 (0.0057)
Sum of squared errors 0.5312 0.5312 0.7739 0.7739 0.7739 0.7739
(b) Using lagged user bases as instruments for the first-differenced equation
Note: In both tables, Model (3)-(4) include time dummies and the interaction term Integration×BigThirdPartyApp is omitted to avoid the dummy variable trap.
Similarly, Model (5)-(6) include time dummies and the interaction term Integration×SmallThirdPartyApp is omitted. Standard errors in parentheses and *p<0.10,
**p<0.05, ***p<0.01.
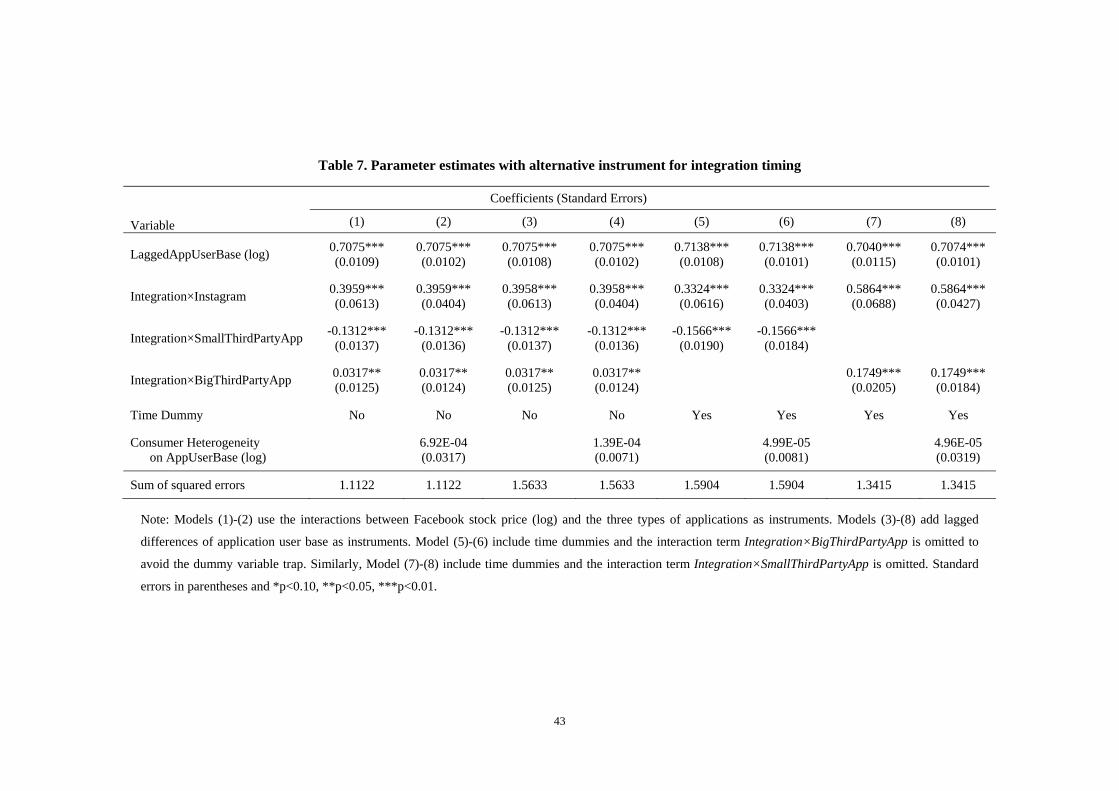
43
Table 7. Parameter estimates with alternative instrument for integration timing
Variable
Coefficients (Standard Errors)
(1) (2) (3) (4) (5) (6) (7) (8)
LaggedAppUserBase (log) 0.7075*** (0.0109)
0.7075*** (0.0102)
0.7075*** (0.0108)
0.7075*** (0.0102)
0.7138*** (0.0108)
0.7138*** (0.0101)
0.7040*** (0.0115)
0.7074*** (0.0101)
Integration×Instagram 0.3959*** (0.0613)
0.3959*** (0.0404)
0.3958*** (0.0613)
0.3958*** (0.0404)
0.3324*** (0.0616)
0.3324*** (0.0403)
0.5864*** (0.0688)
0.5864*** (0.0427)
Integration×SmallThirdPartyApp -0.1312***
(0.0137) -0.1312***
(0.0136) -0.1312***
(0.0137) -0.1312***
(0.0136) -0.1566***
(0.0190) -0.1566***
(0.0184)
Integration×BigThirdPartyApp 0.0317** (0.0125)
0.0317** (0.0124)
0.0317** (0.0125)
0.0317** (0.0124)
0.1749*** (0.0205)
0.1749*** (0.0184)
Time Dummy No No No No Yes Yes Yes Yes
Consumer Heterogeneity on AppUserBase (log)
6.92E-04 (0.0317)
1.39E-04 (0.0071)
4.99E-05 (0.0081)
4.96E-05 (0.0319)
Sum of squared errors 1.1122 1.1122 1.5633 1.5633 1.5904 1.5904 1.3415 1.3415
Note: Models (1)-(2) use the interactions between Facebook stock price (log) and the three types of applications as instruments. Models (3)-(8) add lagged
differences of application user base as instruments. Model (5)-(6) include time dummies and the interaction term Integration×BigThirdPartyApp is omitted to
avoid the dummy variable trap. Similarly, Model (7)-(8) include time dummies and the interaction term Integration×SmallThirdPartyApp is omitted. Standard
errors in parentheses and *p<0.10, **p<0.05, ***p<0.01.
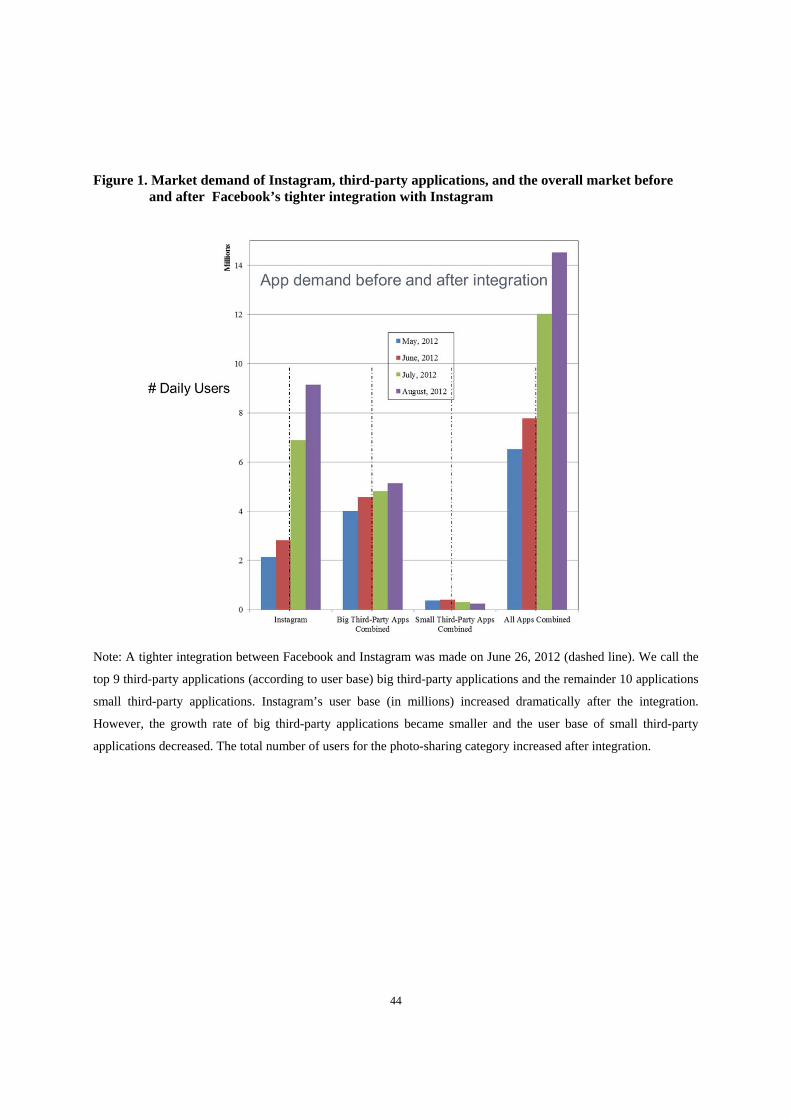
44
Figure 1. Market demand of Instagram, third-party applications, and the overall market before and after Facebook’s tighter integration with Instagram
Note: A tighter integration between Facebook and Instagram was made on June 26, 2012 (dashed line). We call the
top 9 third-party applications (according to user base) big third-party applications and the remainder 10 applications
small third-party applications. Instagram’s user base (in millions) increased dramatically after the integration.
However, the growth rate of big third-party applications became smaller and the user base of small third-party
applications decreased. The total number of users for the photo-sharing category increased after integration.
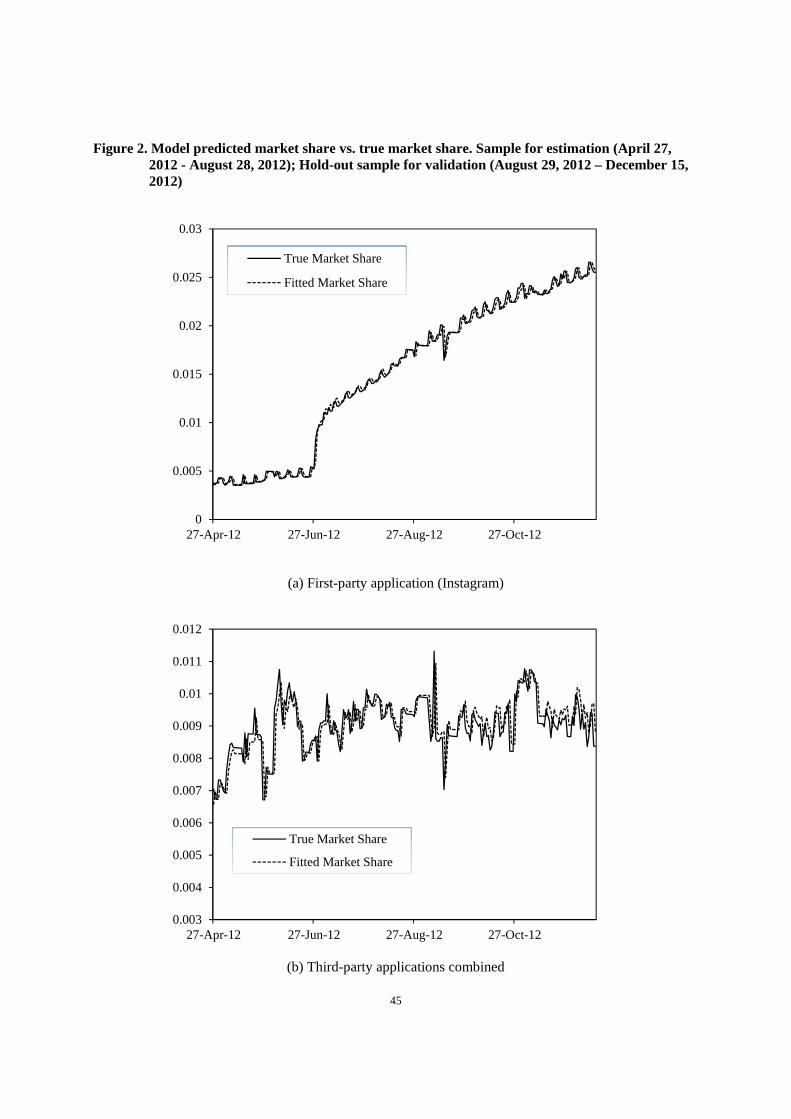
45
Figure 2. Model predicted market share vs. true market share. Sample for estimation (April 27, 2012 - August 28, 2012); Hold-out sample for validation (August 29, 2012 – December 15, 2012)
(a) First-party application (Instagram)
(b) Third-party applications combined
0
0.005
0.01
0.015
0.02
0.025
0.03
27-Apr-12 27-Jun-12 27-Aug-12 27-Oct-12
True Market Share
Fitted Market Share
0.003
0.004
0.005
0.006
0.007
0.008
0.009
0.01
0.011
0.012
27-Apr-12 27-Jun-12 27-Aug-12 27-Oct-12
True Market Share
Fitted Market Share
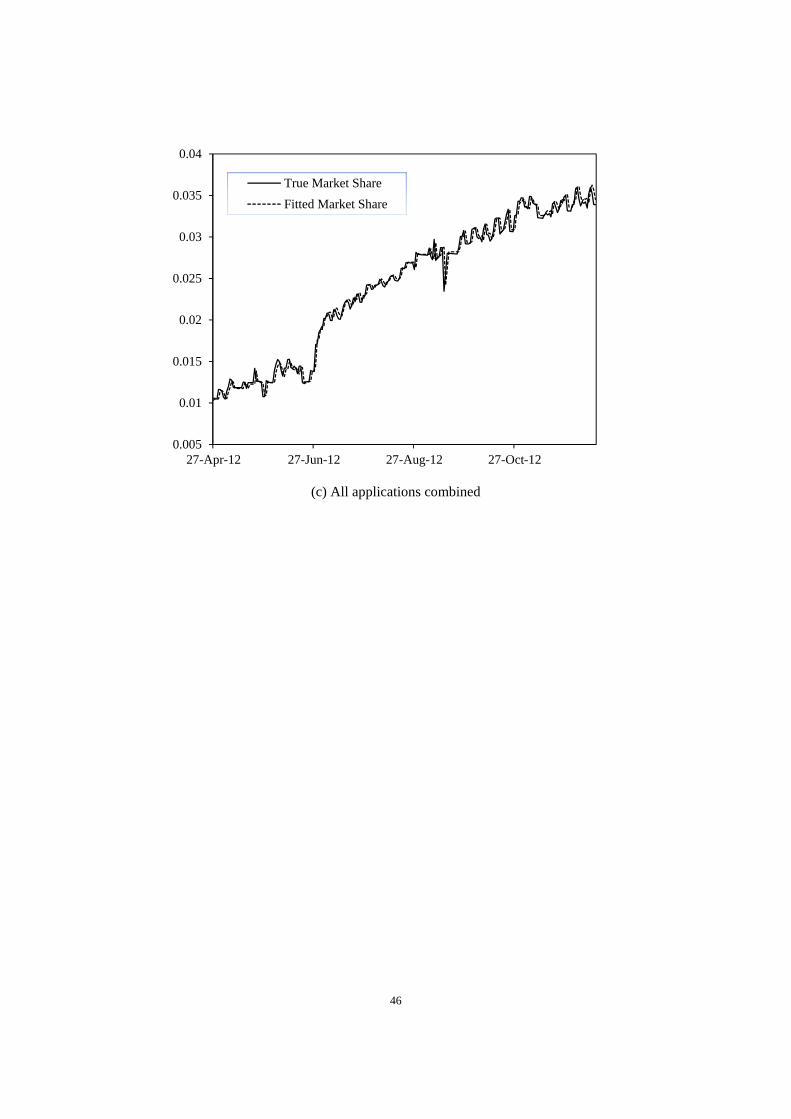
46
(c) All applications combined
0.005
0.01
0.015
0.02
0.025
0.03
0.035
0.04
27-Apr-12 27-Jun-12 27-Aug-12 27-Oct-12
True Market Share
Fitted Market Share
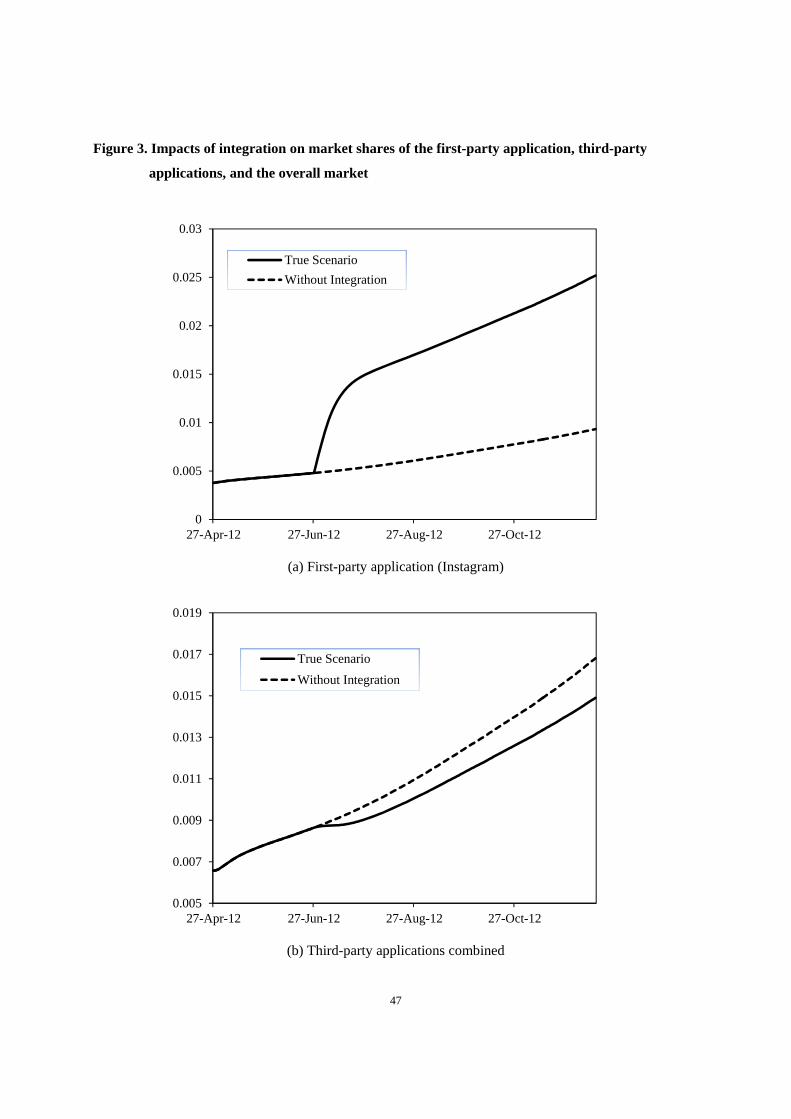
47
Figure 3. Impacts of integration on market shares of the first-party application, third-party
applications, and the overall market
(a) First-party application (Instagram)
(b) Third-party applications combined
0
0.005
0.01
0.015
0.02
0.025
0.03
27-Apr-12 27-Jun-12 27-Aug-12 27-Oct-12
True Scenario
Without Integration
0.005
0.007
0.009
0.011
0.013
0.015
0.017
0.019
27-Apr-12 27-Jun-12 27-Aug-12 27-Oct-12
True Scenario
Without Integration
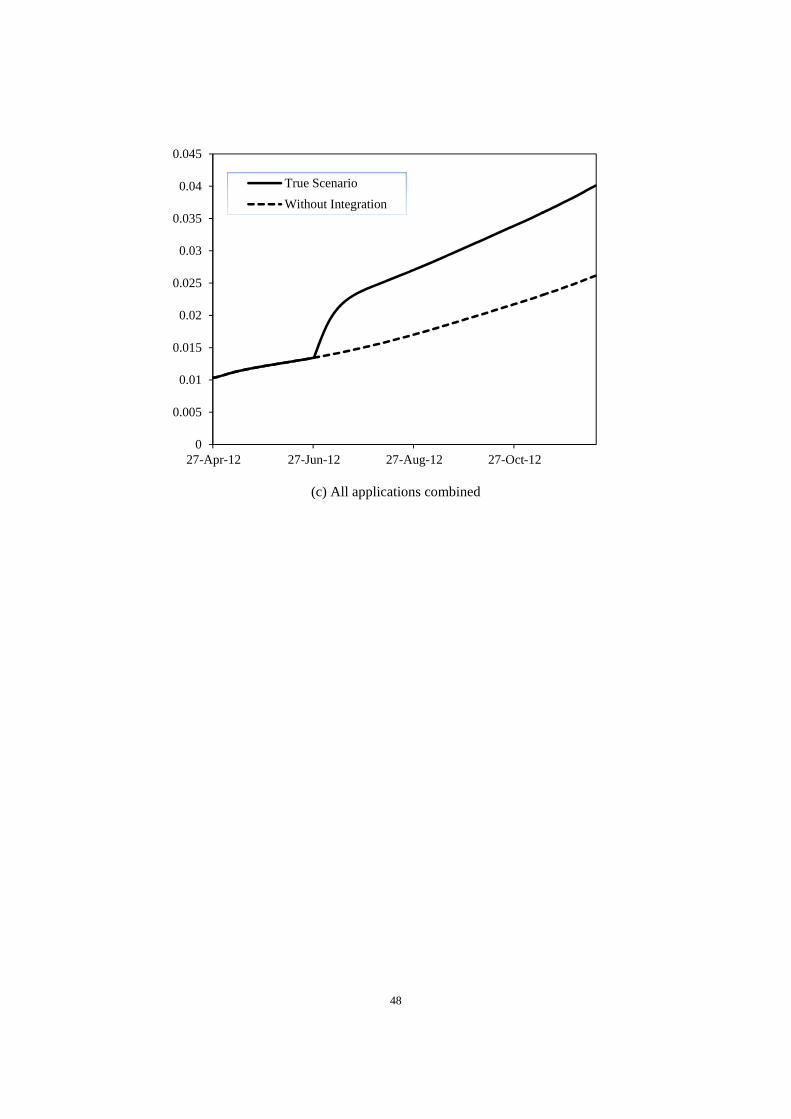
48
(c) All applications combined
0
0.005
0.01
0.015
0.02
0.025
0.03
0.035
0.04
0.045
27-Apr-12 27-Jun-12 27-Aug-12 27-Oct-12
True Scenario
Without Integration
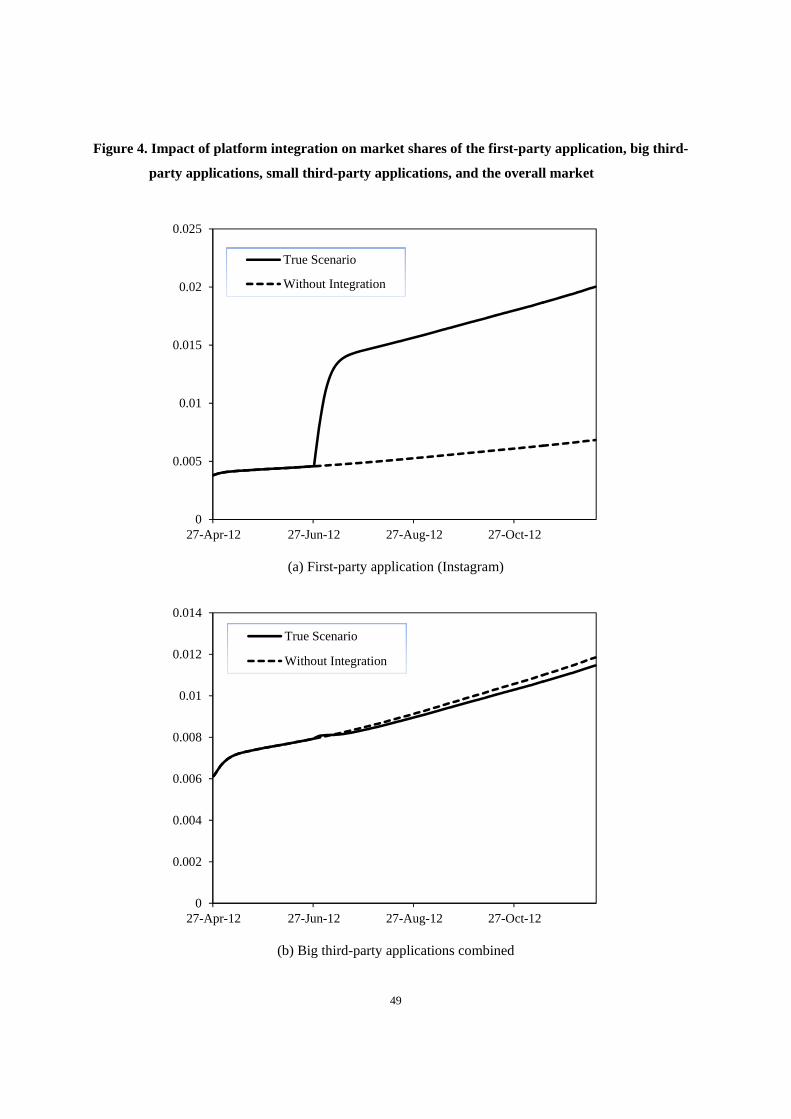
49
Figure 4. Impact of platform integration on market shares of the first-party application, big third-
party applications, small third-party applications, and the overall market
(a) First-party application (Instagram)
(b) Big third-party applications combined
0
0.005
0.01
0.015
0.02
0.025
27-Apr-12 27-Jun-12 27-Aug-12 27-Oct-12
True Scenario
Without Integration
0
0.002
0.004
0.006
0.008
0.01
0.012
0.014
27-Apr-12 27-Jun-12 27-Aug-12 27-Oct-12
True Scenario
Without Integration
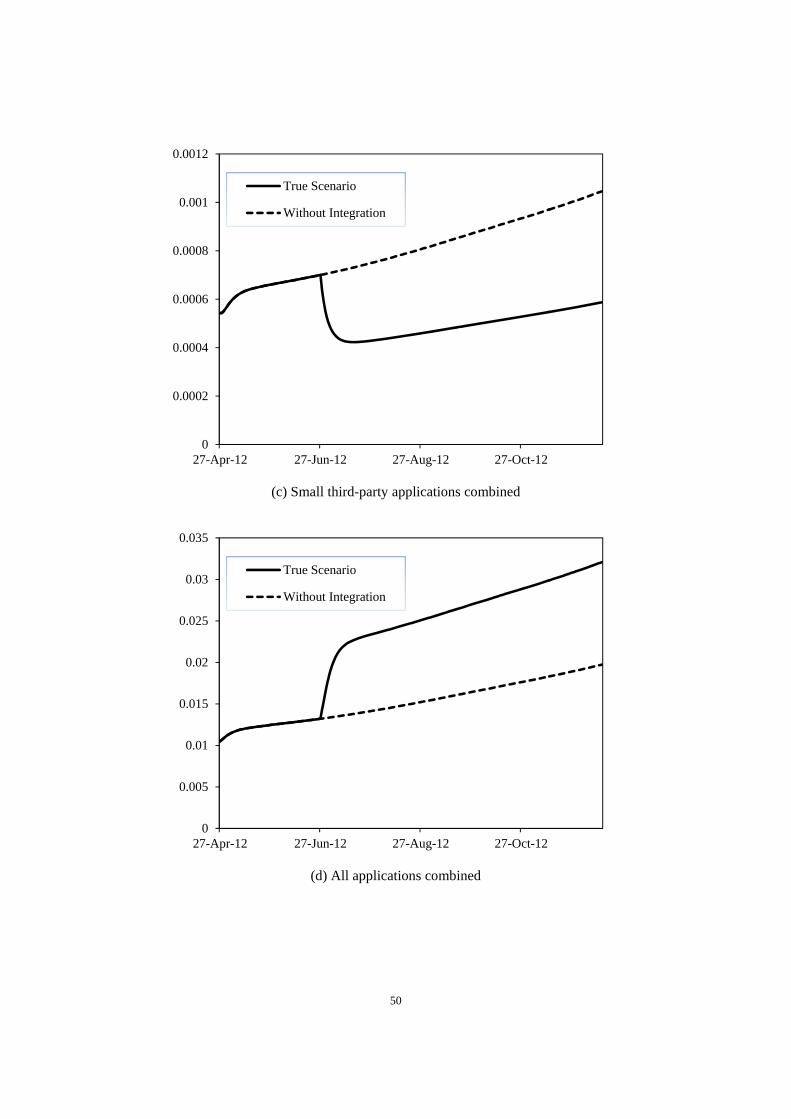
50
(c) Small third-party applications combined
(d) All applications combined
0
0.0002
0.0004
0.0006
0.0008
0.001
0.0012
27-Apr-12 27-Jun-12 27-Aug-12 27-Oct-12
True Scenario
Without Integration
0
0.005
0.01
0.015
0.02
0.025
0.03
0.035
27-Apr-12 27-Jun-12 27-Aug-12 27-Oct-12
True Scenario
Without Integration

51
Figure 5. Integration of Instagram vs. integration of all applications
(a) First-party application (Instagram)
(b) Big third-party applications combined
0
0.005
0.01
0.015
0.02
0.025
27-Apr-12 27-Jun-12 27-Aug-12 27-Oct-12
True Scenario
Without Integration
All Integration
0
0.005
0.01
0.015
0.02
0.025
0.03
0.035
27-Apr-12 27-Jun-12 27-Aug-12 27-Oct-12
True Scenario
Without Integration
All Integration
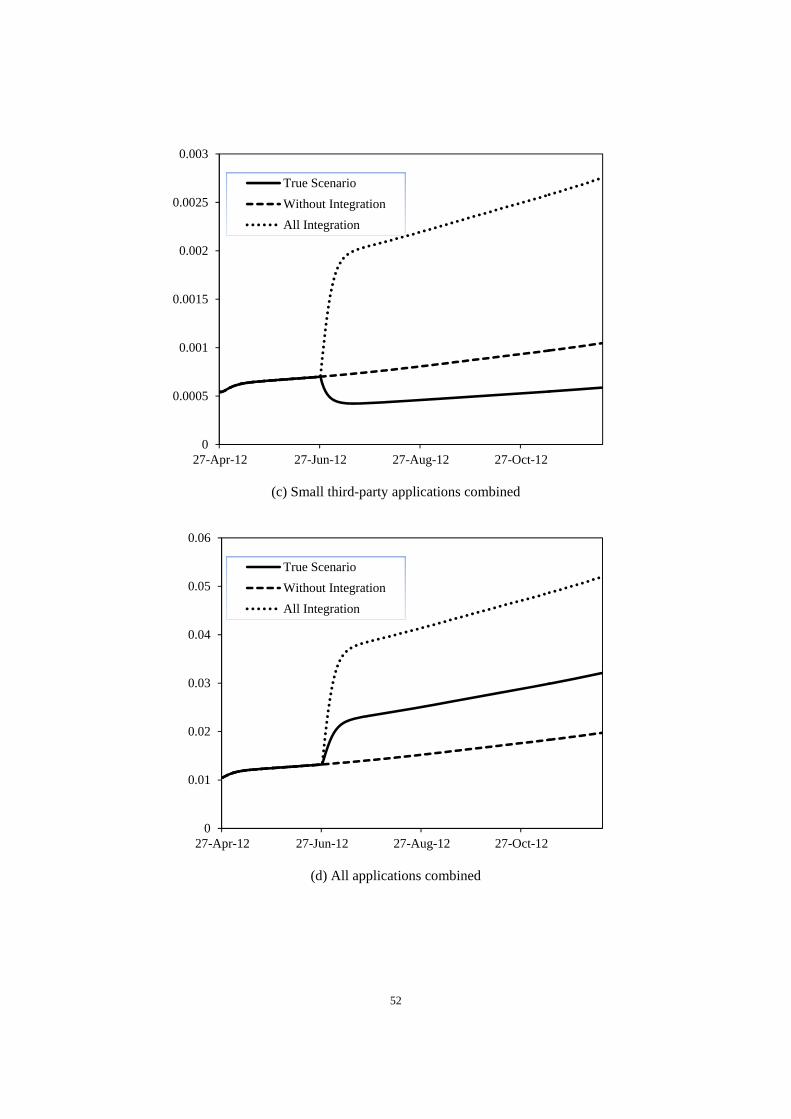
52
(c) Small third-party applications combined
(d) All applications combined
0
0.0005
0.001
0.0015
0.002
0.0025
0.003
27-Apr-12 27-Jun-12 27-Aug-12 27-Oct-12
True Scenario
Without Integration
All Integration
0
0.01
0.02
0.03
0.04
0.05
0.06
27-Apr-12 27-Jun-12 27-Aug-12 27-Oct-12
True Scenario
Without Integration
All Integration

53
Figure 6. Integration of Instagram vs. integration of the 2nd biggest application
(a) First-party app (Pixable)
(b) Big third-party applications combined
0
0.002
0.004
0.006
0.008
0.01
0.012
27-Apr-12 27-Jun-12 27-Aug-12 27-Oct-12
True Scenario
Integration of the 2nd Biggest App Instead
0.004
0.0045
0.005
0.0055
0.006
0.0065
0.007
0.0075
0.008
0.0085
0.009
27-Apr-12 27-Jun-12 27-Aug-12 27-Oct-12
True Scenario
Integration of the 2nd Biggest App Instead
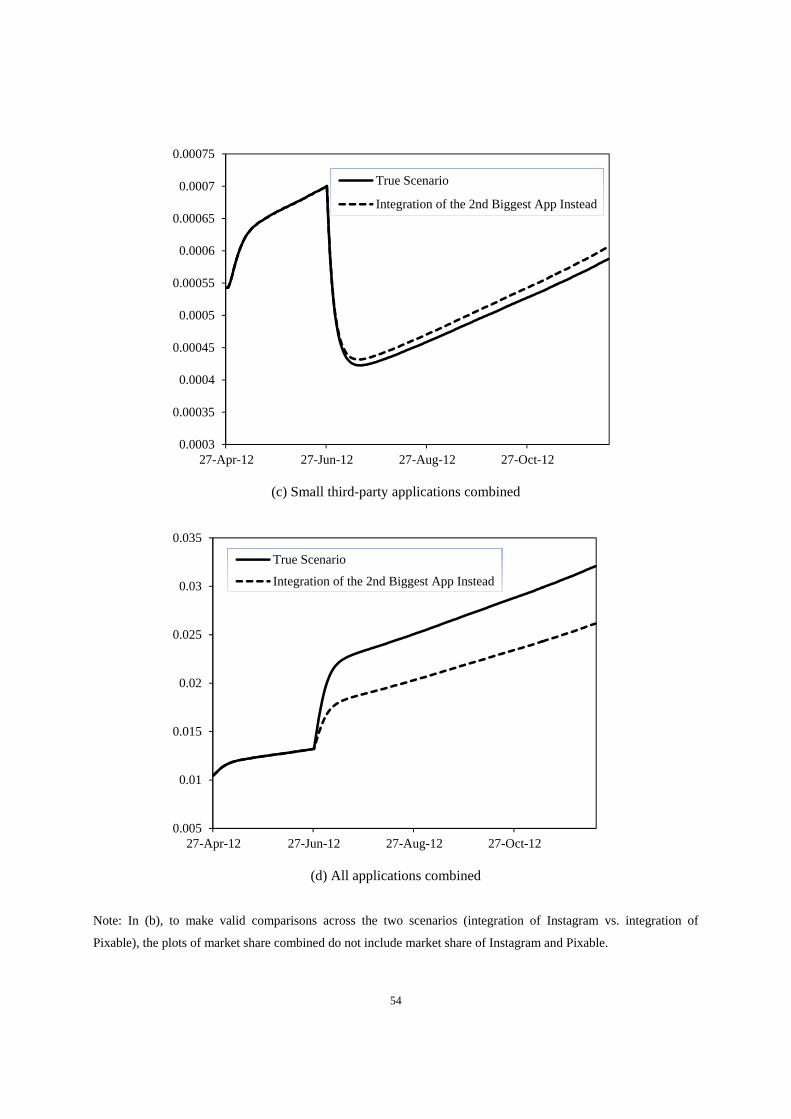
54
(c) Small third-party applications combined
(d) All applications combined
Note: In (b), to make valid comparisons across the two scenarios (integration of Instagram vs. integration of
Pixable), the plots of market share combined do not include market share of Instagram and Pixable.
0.0003
0.00035
0.0004
0.00045
0.0005
0.00055
0.0006
0.00065
0.0007
0.00075
27-Apr-12 27-Jun-12 27-Aug-12 27-Oct-12
True Scenario
Integration of the 2nd Biggest App Instead
0.005
0.01
0.015
0.02
0.025
0.03
0.035
27-Apr-12 27-Jun-12 27-Aug-12 27-Oct-12
True Scenario
Integration of the 2nd Biggest App Instead
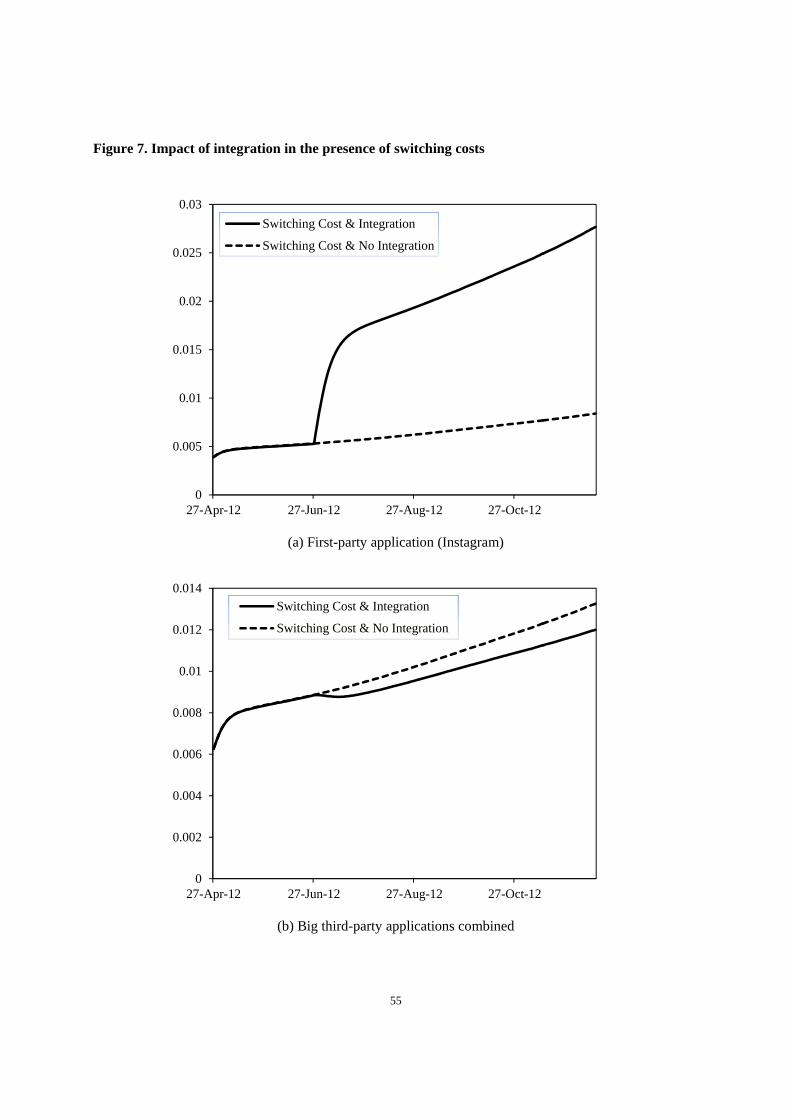
55
Figure 7. Impact of integration in the presence of switching costs
(a) First-party application (Instagram)
(b) Big third-party applications combined
0
0.005
0.01
0.015
0.02
0.025
0.03
27-Apr-12 27-Jun-12 27-Aug-12 27-Oct-12
Switching Cost & Integration
Switching Cost & No Integration
0
0.002
0.004
0.006
0.008
0.01
0.012
0.014
27-Apr-12 27-Jun-12 27-Aug-12 27-Oct-12
Switching Cost & Integration
Switching Cost & No Integration

56
(c) Small third-party applications combined
(d) All applications combined
0
0.0002
0.0004
0.0006
0.0008
0.001
0.0012
27-Apr-12 27-Jun-12 27-Aug-12 27-Oct-12
Switching Cost & Integration
Switching Cost & No Integration
0
0.005
0.01
0.015
0.02
0.025
0.03
0.035
0.04
0.045
27-Apr-12 27-Jun-12 27-Aug-12 27-Oct-12
Switching Cost & Integration
Switching Cost & No Integration