the impact of operating system structure on personal
TRANSCRIPT

The Impact of Operating System Structureon Personal Computer Performance
The Harvard community has made thisarticle openly available. Please share howthis access benefits you. Your story matters
Citation Chen, J. Bradley, Yasohiro Endo, Kee Chan, David Mazieres, AntonioDias, Margo Seltzer, and Michael D. Smith. 1995. The Impact ofOperating System Structure on Personal Computer Performance.Harvard Computer Science Group Technical Report TR-09-95.
Citable link http://nrs.harvard.edu/urn-3:HUL.InstRepos:24829608
Terms of Use This article was downloaded from Harvard University’s DASHrepository, and is made available under the terms and conditionsapplicable to Other Posted Material, as set forth at http://nrs.harvard.edu/urn-3:HUL.InstRepos:dash.current.terms-of-use#LAA
0
The Impact of Operating System Structure onPersonal Computer Performance
J. Bradley Chen, Yasohiro Endo, Kee Chan, David Mazières,Antonio Dias, Margo Seltzer, and Michael D. Smith
TR-09-95
Center for Research in Computing TechnologyHarvard University
Cambridge, Massachusetts

1
The Impact of Operating System Structure
on Personal Computer Performance
J. Bradley Chen, Yasuhiro Endo, Kee Chan, David MazièresAntonio Dias, Margo Seltzer, and Michael Smith
Division of Applied SciencesHarvard University
May 1995
AbstractThis paper presents a comparative study of the performance of three operating systems that run on the personal
computer architecture derived from the IBM-PC. The operating systems, Windows for Workgroups (tm), WindowsNT (tm), and NetBSD (a freely available UNIX (tm) variant) cover a broad range of system functionality and userrequirements, from a single address space model to full protection with preemptive multi-tasking. Our measurementswere enabled by hardware counters in Intel’s Pentium (tm) processor that permit measurement of a broad range ofprocessor events including instruction counts and on-chip cache miss rates. We used both microbenchmarks, whichexpose specific differences between the systems, and application workloads, which provide an indication of expectedend-to-end performance. Our microbenchmark results show that accessing system functionality is more expensive inWindows than in the other two systems due to frequent changes in machine mode and the use of system call hooks.When running native applications, Windows NT is more efficient than Windows, but it does incur overhead from itsmicrokernel structure. Overall, system functionality can be accessed most efficiently in NetBSD; we attribute this toits monolithic structure, and to the absence of the complications created by backwards compatibility in the other sys-tems. Measurements of application performance show that the impact of these differences is significant in terms ofoverall execution time.
1. IntroductionWhile most current operating systems research takes place using a variant of UNIX, the vast majority of main-
stream computing occurs on personal computer (PC) systems (those derived from the IBM-PC architecture) runningMicrosoft Windows. The differences between the OS platforms used in research and mainstream OS products makessome systems research irrelevant with respect to the current needs of the software industry. At the same time,researchers ignore important problems in non-UNIX systems.
The most common operating system used on PC platforms is Microsoft Windows. Windows lacks many fea-tures the OS research community consider mandatory, most notably preemptive multitasking and protected addressspaces. New operating systems for the PC market like Windows NT and OS/2(tm) incorporate the timesharing sup-port found in modern UNIX systems while also supporting the Windows operating system interface. Though theoperating systems community is familiar with the benefits of features such as separate protected address spaces, wedon’t know that much about systems without them. Our goal is to address this shortcoming by illuminating the impor-tant differences between UNIX and commodity systems and measuring their impact on application performance.
As a first step towards understanding this issue, we present a quantitative comparison of three operating systemsall of which run on the same PC hardware: Microsoft Windows for Workgroups(tm); NetBSD, a freely distributedversion of UNIX; and Microsoft Windows NT (tm), a system which combines support for Windows applications withoperating system features found in UNIX systems. There are important similarities in how the systems are used. Allare used in personal (i.e. single-user) computing. All are used to load multiple applications into memory and switchbetween them. All are used with an interactive, window-based interface. These similarities give us a basis for com-parison.
This is an extended version of a paper to appear in the 15th ACM Symposium on Operating System Principles. This paper is alsoavailable from the Center for Research in Computing Technology, Division of Applied Sciences, Harvard University as technicalreport TR-09-95.

2
Although the three systems support personal computing, they use different core functionality. The commercialsuccess of Windows is evidence that the following UNIX features are not mandatory for the success of a mainstreamoperating system:
• Protected address spaces: People learn to work around bugs that cause systems to crash.• Preemptive multi-tasking: People wait for printers and batch jobs and initiate context switches manu-
ally.• High-level system abstractions: Abstractions like pipes and background jobs are not immediately
useful for applications that use a graphical user interface.A key distinction between UNIX systems and the Microsoft OS products we studied is support in the Microsoft
products for backwards compatibility with MS/DOS and Windows. The requirement of compatibility with Windowshas influenced many aspects of the Windows NT structure. The structural impact of backwards compatibility is diffi-cult to evaluate in isolation; nonetheless the performance impact of the microkernel architecture chosen to implementthis compatibility is substantial. This study explores how compatibility and the system structures it requires affectsperformance in the three systems.
For this paper we quantify the impact of differences between the three operating systems using hardware eventcounters in the Pentium microprocessor [Intel 94, Mathisen 94]. We will present results from two sets of experiments,one using microbenchmarks and another using application workloads. The general strategy for our analysis is:
• Measure microbenchmarks.• Explain microbenchmark results from available documentation.• Measure application performance.• Explain application performance based on microbenchmark results and available documentation.
In our comparison we were obliged to make compromises on certain factors outside of our control. For example, wecould not compile the three operating systems using the same compiler since we do not have access to source code forWindows or Windows NT. Instead we measured systems that were compiled in the same way as the systems in com-mon use. There were also occasions where the lack of access to source code for Windows or Windows NT preventedus from answering detailed questions about the internals of the proprietary systems. Nonetheless, analysis of datafrom the measurements yields revealing and frequently surprising results. We found that:
• There are large performance penalties inherent in the structure of Windows.• System functionality implemented at user level requires extra instruction overhead in Windows.• There was no performance benefit from the shared Windows address space in our experiments.• Windows NT structure adds significantly to the cost of accessing system functionality.
The next section provides some background on the three operating systems and the hardware on which they run. InSection 3 we discuss issues specific to our experiments, in particular, configuration details for the specific machinewe used for our experiments, information on the hardware counters used for these experiments and how we accessedthem, and a description of the specific microbenchmarks and application workloads used in our experiments. In Sec-tions 4 and 5 we report our experimental results. In Section 6 the ramifications of our work are discussed and we notesome issues which require further investigation.
2. BackgroundThis section gives background on the systems we measured and machines on which they run. We start with a
brief overview of the essential distinctions between the three systems we measured. Table 1 gives some general dataon the three operating systems. Due to space constraints we cannot give all relevant details of the system structure.Suggested references are provided for readers unfamiliar with one or more of the systems.
2.1 WindowsWindows is the defacto standard operating environment for PCs. Windows is sometimes referred to as anMS/
DOS extender and must be used in conjunction with MS/DOS, which provides a thin layer of system functionalityupon which Windows is built. MS/DOS also defines a system interface which Windows must support for backwardscompatibility. This requirement has numerous ramifications on the machine model used by Windows programs.Because Windows cannot be used without MS/DOS and MS/DOS is not often used without Windows, we will notdistinguish between the two systems and will use “Windows” to refer to the composition of Windows for Workgroupsrunning on top of MS/DOS.

3
Current Windows applications execute using an application programmer’s interface (API) which we will referto as “Win16,” for “sixteen-bit Windows applications.” For Win16 applications, the CPU runs in 16-bit 80286 mode,ignoring the top half of 32 bit registers. Win16 applications operate in a segmented address space, with a maximumsegment size of 64 KBytes imposed by the register size limitation. Segment registers must be reloaded frequentlywhen an application uses large amounts of memory or requires memory structures larger than 64 KBytes.
The Win16 API provides for a single address space which is shared by the system and all active applications.Context switches between applications occur when an application voluntarily yields control. The system does notsupport isolated address spaces or involuntary context switches.
Windows system software is composed of four components which are loaded separately: KRNL386.EXE,USER.EXE, WIN386.EXE, and GDI.EXE. Table 1 gives a rough description of the content of the different pieces.Although it is composed of separate pieces and runs on top of MS/DOS, Windows differs from microkernel systemsin that all parts of the system run in the same address space.
Unlike UNIX systems, Windows does not allow third-party developers to relink the operating system. Third-party developer who need to extend Windows must do so without source code for the operating system and withoutreloading the system modules. To accommodate developers, Windows supports dynamically loaded libraries (DLLs)and loadable device drivers (VxDs). These make it possible to incorporate new system functionality into the pre-loaded system and are used extensively in Windows software.
In our experiments we used Windows for Workgroups version 3.11. We selected Windows for Workgroupsbecause it provides network support comparable to that provided by Windows NT and NetBSD. Network support hasminimal impact on most of our experiments. The two only two workloads we used that make use of the network arethe network microbenchmark and the Web server application workload.
Although we did not have source code for Windows, we did have a Windows debugger which made it possible
to single-step through interrupt handlers and other parts of the system. This made it possible to answer many ques-tions about Windows control structure in spite of the lack of source code. In addition, an abundance of referencebooks on Windows exists. See [Chappell 94, Microsoft 90, Pietrek 93, Schulman et al. 92] for a more completedescription of Windows internals.
2.2 Windows NTWindows NT is microkernel operating system that supports protected address spaces, preemptive multi-tasking,
and multiple application APIs, including the MS/DOS and Win16 APIs supported by Windows as well as the Win32(tm) API [Shaw 94].
The kernel in Windows NT is called the NT Executive. It provides interrupt and exception handling, virtualmemory and IPC support, as well as other higher-level services such as file system and network access. The NT Exec-utive implements a set of native services, which are used by user-levelprotected subsystems to implement specificAPIs. In particular there are Win16 and Win32 subsystems which handle system requests from applications that usethe Win16/Win32 API.
We used the SoftIce (tm) debugger from NuMega Technologies Inc.
system principal components executable size (bytes)
Windows MS/DOS (resident size) 213000
KRNL386.EXE - control for segmented memory 76400
WIN386.EXE - the Virtual Machine Manager (VMM) and other VxDs.The VMM handles task switching, paging, and other low-level services
577577
USER.EXE - the windowing system 264096
GDI.EXE - graphics engine module 220800
Windows NT Executive - interrupt handling, VM, IPC, file system, network 752944
Win32 (tm) subsystem - Win32 user interface, windowing system (resident size)4 MBytes
NetBSD vmunix - monolithic Unix kernel 606208
XF86_S3 - X11 Windowing System Server 2400256
Table 1. Components of the three systems
4
The Win32 API is the preferred API for Windows NT applications. It provides a flat 4 GByte address space withno segments. The lower half is for user processes and the upper half is reserved for the system. User-mode computa-tions are not allowed to access system memory in Windows NT, although protection of system memory is not arequirement of the Win32 API. The Win32 protected subsystem owns the display and the console input devices. Itimplements the window manager and also maintains input queues for each Win32 client. Other subsystems (includingWin16) become Win32 subsystem clients when they want to access the display and console input devices.
In order to minimize interprocess communication overhead, Windows NT includes a Local Procedure Call(LPC) facility. LPC supports message delivery via shared memory, to avoid copies when large amounts of data mustbe transferred. To reduce communication overhead, the NT Executive can cache information in the client DLL andwithin the executive. Additionally, multiple system call requests are sometimes batched in a single message.
For our Windows NT experiments we used Windows NT Workstation Version 3.5, build 807. We used the FATfile system for both Windows and Windows NT experiments. We did not have source code for Windows NT. In ana-lyzing Windows NT behavior we were limited to our measurement results and to publicly available reference works.See [Custer 93, Microsoft 93] for more complete documentation on Windows NT.
2.3 NetBSDWe chose NetBSD 1.0 as a representative example of a modern Unix system. NetBSD is a descendent of the
original Berkeley UNIX systems and is in most ways typical of UNIX implementations. It is structured as a mono-lithic UNIX kernel, with the UNIX system call interface implemented directly by the operating system kernel. Thisdifferentiates it from microkernel systems such as Mach 3.0 [Accetta et al. 86, Golub et. al. 90] and Windows NT.NetBSD supports timesharing, with each user process in its own protected address space. The windowing system runsoutside the operating system kernel as a user process, unlike Windows and Windows NT, where the windowing sys-tem is considered an inseparable part of the operating system. We used the XFree86 3.1.1 distribution of the X11Windowing System (X11R6) and the twm window manager.
Although NetBSD supports dynamically loaded device drivers, all device drivers used in our experiments werestatically loaded. NetBSD also supports shared libraries. NetBSD supports coalesced I/O operations, and our system
was built with this optimizations enabled. Our NetBSD kernel was compiled from the 1.0 distribution at the default
optimization level (-O6) with gcc version 2.4.5. The availability of source code for NetBSD made it straightforwardto answer questions about system internals.
2.4 Related WorkAlthough some authors have considered the impact of structure for UNIX systems [Chen & Bershad 92] very
little attention has been given to the behavior of commodity operating systems.In the commodity computing world, performance measurement studies are typically based on the assumption
that the Windows operating system will be used, and concentrate primarily on the performance for variations in com-puter hardware [Van Name & Catchings 1994]. Popular computing magazines regularly publish articles which com-pare current operating system offerings for PCs, but generally these evaluations focus on functionality. In generalthey do not explore performance issues [Ezzell 93, Udell et al. 94], and when they do their analysis is superficial, pre-senting end-to-end benchmark results with little attempt to explain or understand performance differences or theimpact of structural issues [Linthicum & Vaughan-Nichols 93]. In addition, these articles frequently anticipateupcoming OS offerings, going to press before the featured system is ready for performance evaluation [Linthicum &Vaughan-Nichols 93, Udell et al. 94]. We did find one study that compared 32 bit operating systems including severalcommercial UNIX products, however, the article gave little attention to quantitative comparison of performance,focusing their evaluation instead on qualitative differences in functionality with criteria such as “Graphics and Multi-media,” “Business Productivity,” and “DOS and Windows emulation” [Linthicum 94]. Another study compared Net-work Operating Systems, but the only performance results they present were for local and remote file transfers[Gunnerson 93].
Our NetBSD system was configured with clustering enabled, rotdelay = 0 and maxcontig = 8.Aside from the addition of a device driver to access the Pentium counters, one change was made locally to the system: a trivial (3line) change was required to the initialization code of the NCR PCI SCSI device driver to support the NCR 815 controller.

5
Some attention from the research community has gone to supporting MS/DOS interfaces under UNIX. Forin &Malin [Forin & Malin 94] compare FAT and Berkeley FFS file systems implemented for a Mach 3.0 system. Anotherproject implemented a server for the MS/DOS interface on top of Mach 3.0 [Rashid et al. 91].
3. MethodologyIn this section we document hardware and software details specific to our experiments. We start by describing
the hardware platform on which this study is based. Next we describe the Pentium counters, and the software we usedto access them. We go on to describe our microbenchmarks and application workloads, then close with a discussionof the metrics we will use as the basis of our comparison of the three systems.
3.1 PC HardwareThe current plethora of vendors who manufacture and market personal computers makes defining a “PC” diffi-
cult. For this project, we will define a PC as a computer that runs the MS/DOS operating system from Microsoft. Wefurther restrict our study to the class of machines which can run NetBSD or Windows NT. These systems requirememory management features of an Intel 80386 compatible processor [Intel 94].
A current PC system typically includes a motherboard with CPU, BIOS ROM, and 4 MBytes or more of RAMon a memory bus. Current systems also typically include an ISA bus for adding peripheral devices, and a VESA localbus or a PCI bus for high-throughput devices like disk and display controllers.
We ran our experiments on a PC based on the Intel Premiere II motherboard, with a 90 MHz Intel Pentium pro-cessor, a 256KB direct-mapped second level cache and 32MBytes of main memory. Table 2 gives some relevant fea-tures of the Pentium processor. Table 3 gives configuration details specific to our system.
3.2 The Pentium CountersWe made our measurements using event counters implemented in the Intel Pentium processor. Although the
counters are not documented in the public specification for the Pentium chip, they have been reported in popular mag-azines [Mathisen 94], and it is rumored that they will become a documented feature in future microprocessors fromIntel [Gwennap 95]. The following description of the Pentium counters and our use of these undocumented hardwarefeatures is based on the description from a unencumbered document [Mathisen 94] as well as publicly availablesource code referenced in the same document.
The Intel Pentium processor includes two hardware counters. Each counter can be configured to count one of anumber of different events. Table 4 lists the subset of the Pentium event that we counted in our experiments. In addi-tion to the two hardware counters, the Pentium also implements a cycle counter.
A further configuration option makes it possible to obtain separate event counts for user mode and kernel mode.An 80386 compatible processor implements four protection rings. The counters can be configured to count events inring 0 (kernel mode), events in rings 1-3 (user mode), or all events. This feature is useful in that it permits some sep-aration of user and system activity; however such counts cannot be compared directly across the three systemsbecause each of the systems implements a different amount of functionality in kernel mode. In Windows, the VirtualMemory Manager (VMM) and device drivers run in kernel mode, but the rest of the system (including MS/DOS andthe BIOS) runs in user mode. In Windows NT, the NT Executive runs in kernel mode, with applications and the
PCI SCSI-II controller based on the NCR 815 chip
Two Seagate ST32550N Barracuda disks: one forWindows NT and Windows, one for NetBSD
SMC-8013W ISA Ethernet Controller
Diamond Stealth 64D video adaptor with 2MB ofDRAM and Vision864 graphics chip.
Table 3. Configuration of gouda.harvard.edu.
90 MHz, two-way superscalar
8 KByte, 2-way assoc., split caches, 32 byte lines
256 entry 4-way assoc. branch target buffer
64 entry, 4-way assoc. Data TLB (4K translations)
8 entry, 4-way assoc. Data TLB (4M translations)
32 entry, 4-way associative Instruction TLB
Main memory width is 8 bytes
Table 2. The Pentium Processor

6
Win32 subsystem running in user mode. In NetBSD, the Unix kernel runs in kernel mode. This partitioning must beconsidered when comparing kernel and user mode events across the different systems.
We used the Pentium cycle counter to monitor repeatability of our experiments. The experimental results in thispaper are the average of repeated runs unless otherwise noted. The standard deviation between runs is low. Everyexperiment was run with the cycle counter, and the cycle counts were used to ascertain that our experimental runswere controlled and that our measurements were not unexpectedly affected by non-deterministic activity.
3.3 Device DriversThe Pentium counters are accessed and controlled using special instructions that are available in kernel mode
only. We augmented each of the three operating systems with mechanisms to support user level counter access andcontrol. To accomplish this under Windows, we used a virtual device driver, commonly known as a VxD. A VxD is adynamically-loadable module which runs in protection ring 0, in 32-bit mode. VxDs are commonly used to multiplexphysical devices for virtual machines. Windows uses a dozen or so VxDs; additional VxDs can be specified in thesystem configuration files that are processed during Windows initialization. VxDs are commonly activated by hard-ware interrupts or system calls, but they can also publish an entry point, thereby permitting user-level programs tocall them directly. We used the latter method to access our Pentium counter VxD.
For NetBSD, we accessed the Pentium counters using device drivers and named files in /dev. We used four sep-arate named devices: one each for system and user event counts, one for the cycle counter, and a fourth that imple-mented a software-based count of idle loop iterations. This gave us a measure of the I/O requirements for a givenworkload. The event counters were configured using ioctl system calls. Further ioctl calls zero or freeze both countersin a single operation.
Windows NT provides an elaborate API to support dynamically-loadable device drivers. Using this API we cre-ated a device driver which is dynamically loaded into the NT Executive to access the Pentium counters. This devicedriver allows user programs to manipulate the counters by using reads and writes of a device special file, similar tothe driver used with NetBSD.
Number Name Comments
0x00 Data Read Count of data read operations, independent of size. Misaligned reads count twice.
0x01 Data Write Misaligned writes count once.
0x02 Data TLB miss
0x03 Data read cache miss
0x04 Data write cache miss
0x0b Misaligned references
0x0c Code read code reads from I-Cache. At least 17 and at most 32 bytes are read per operation.
0x0d Code TLB misses
0x0e Code cache misses
0x0f Segment register loads
0x12 Branches
0x13 Branch Target Buffer Hits
0x14 Taken branch or BTB hit
0x15 Pipeline flushes A pipeline flush occurs when branch prediction fails
0x19 data write miss cycles
0x1a data read miss cycles
0x16 Instructions executed Instructions using the REP prefix count as a single instruction.
0x1e Noncached memory reference
0x27 Hardware Interrupts
0x28 Data read or write
0x29 Data read or write miss
Cycle counter Continues when machine is halted in idle loop
Table 4. Pentium Counters.

7
3.4 MicrobenchmarksWe used a suite of microbenchmarks to measure and compare specific aspects of system functionality. Most of
our microbenchmarks are based on thelmbench portable system measurement suite [McVoy 95], and all of them bor-row from the lmbench methodology. They include:
• Null -- counter access latency. Measures the time to access a third-party operating system extension,namely our counter control device. The Null benchmark serves as a starting point for understandingmore complex behavior. This benchmark is not from the lmbench suite.
• Syscall -- minimum system call latency. Time to invoke functionality implemented in the operatingsystem.
• Exec -- latency to load and run a trivial program. We tested Exec with both static and dynamicallyloaded libraries.
• Memory access time -- memory access time for references spanning arrays of various sizes. Thismeasures the impact of the segmented architecture in Windows, and of page-mapping policy in Win-dows NT and NetBSD.
• A suite of file system performance tests.• Bitblt - a graphics microbenchmark to test bitblt performance.• Netbw - a network throughput test.
The insights gained from understanding the microbenchmark results provide a basis for analyzing composite behav-ior for the application workloads. A more detailed description of individual microbenchmarks accompanies theexperimental results in Section 4.
The benchmarks were compiled for each of the three systems with the highest available optimization level. Win-dows does not support static linking for all libraries. All benchmarks on NetBSD and Windows NT were linked stati-cally, with the exception of the Exec benchmark, for which we compare the overheads for both static and dynamiclinking. The impact of microbenchmark compilation is small -- most of the measured execution time is system timeand very little time is spent in the actual code for the microbenchmark. The microbenchmarks were compiled for Net-BSD with gcc version 2.6.3 using optimization level -O6. For Windows and Windows NT, benchmarks were com-piled with Visual C++ (tm) at “release level” (optimized for speed). No Pentium-specific optimizations were appliedfor any of the experimental workloads or systems.
3.5 Application WorkloadsFor application workloads we restricted ourselves to software that ran on all three systems. Regrettably this
excludes the “shrink-wrapped” software which makes up the bulk of Windows computation. Our workloads may tendto favor UNIX because all of them were developed for the UNIX API. Despite this bias, they provide grounds forcomparison, which Windows software would not. We selected our application workloads to test a range of realisticloads. Because all of the workloads have a working set size of under 32 MBytes, no significant paging activityoccurred during the experiments.
Wish is a graphical user interface builder for the Tcl language [Ousterhout 94]. Our goal using this workload wasto model behavior that might be a part of an interactive workload. Our workload was CPU intensive, making exten-sive use of the windowing system with little disk activity. Our Wish benchmark was based on the “widget” demoincluded with the standard Wish release. We used the “source” Tcl command to load the widget file, then “invoke”commands to exercise various widgets on the screen. Wish was compiled with standard optimizations (-O) on allthree systems.
Ghostscript is a publicly available Postscript(tm) previewer [Adobe 85]. For our experiment, we used Ghost-script to display a 13 page, 372 K byte conference paper dissertation. This workload was compute intensive and madesignificant use of the windowing system and display. Relatively little time went to file access. Ghostscript was runwith the same screen resolution, view size, and magnification on all three systems, and was compiled at the highestoptimization level. Ghostscript was dynamically linked on all three systems.
Our third application, a World Wide Web Server [Berners-Lee et al. 92], uses the network and the file system.The client load for this workload used a trace of 1024 requests from an NSCA server which services requests towww.nsca.uiuc.edu. The client downloads a total of 9.7 MBytes of data. We ran our test using a dedicated networkbetween host and client. So as to measure the server at maximum throughput, our server load was generated by a cli-ent which used non-blocking socket I/O to issue parallel HTTP requests.
8
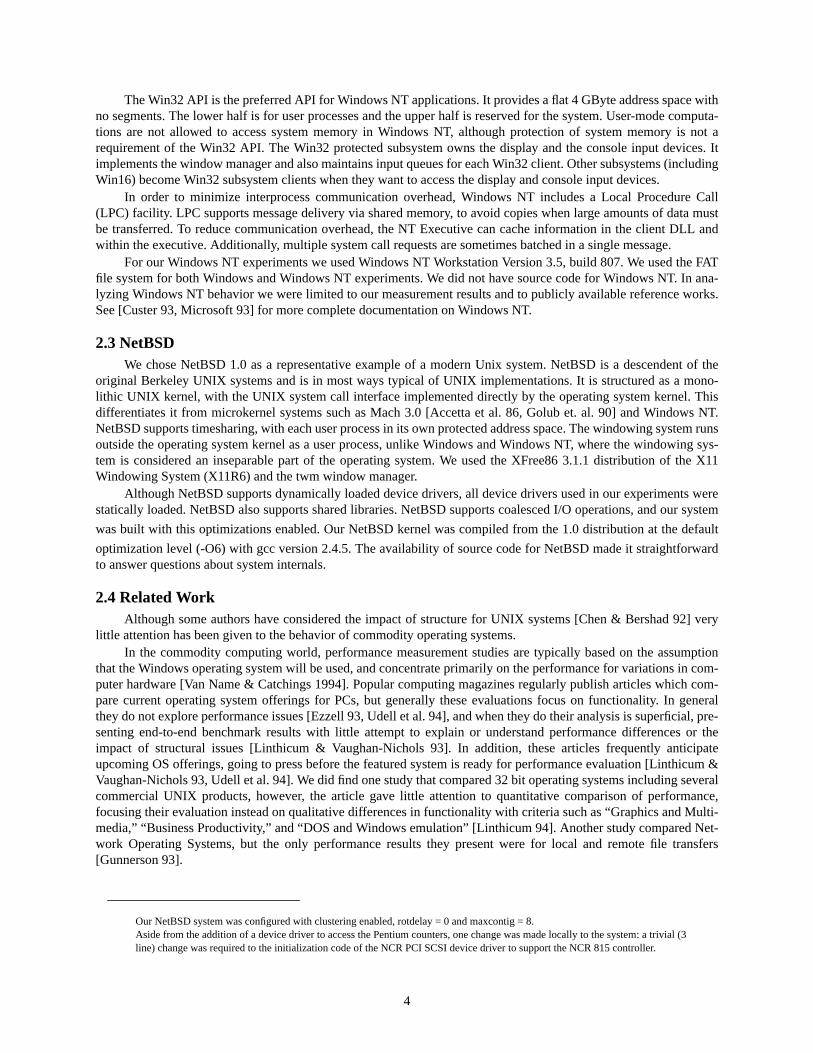
The UNIX HTTP server used was version 1.3R of the NCSA HTTP daemon, compiled with gcc 2.6.3 at optimi-zation level -O2. The Windows NT server was distributed as an executable from the European Microsoft WindowsNT Academic Centre at the University of Edinburgh [Adie 94], and is the server used by Microsoft (hostwww.microsoft.com). The Windows HTTP server we used is from Alisa Corporation and is based on the NCSAMosaic code base.
We used a separate counter-control program to start, stop, and record counter values. In this way we avoidedincluding server start-up and shutdown overhead in our experiments. The Web experiments ran long enough so thatthe activity generated by the counter control program not significant. To improve the reproducibility of our results, wedefragmented our FAT disk before loading the Web server tree. Because FFS has better aging properties, FFS defrag-mentation was not required.
For each operating system, we tuned the Web client parameters to maximize the server throughput. The acceptqueues of both Windows for Workgroups and Windows NT were easily overrun by parallel connection attempts,resulting in a significant performance penalty. Windows throughput dropped significantly under a load of nine ormore concurrent requests, so we limited the number of concurrent Windows requests to eight. The Windows servergenerated approximately 900 connection-refused messages for 1024 successful HTTP retrievals. For Windows NT,even a small number of back-to-back connection requests caused long periods of idle time which we could notexplain. By inserting a 20ms pause in the client between requests we were able to achieve reasonable throughput withtwenty concurrent requests. The throughput of NetBSD increased in a stable way with increased client parallelism.We drove the NetBSD web server with 32 concurrent requests. No connections were refused under NetBSD.
3.6 MetricsWe use several different metrics in our comparison of the different operating systems executing on the Pentium.
The most important measure is the time required by the computer system to perform a specific task, so we will fre-quently usecycle countto compare the total latency for comparable computations on the three different systems.Instruction count also gives a measure of total work, although multi-cycle instructions mean this count does notalways give a reliable metric. We will use thepercent of total cyclesto get a precise idea of how specific functionalunits are contributing to the cycle count, for example, percent of total cycles due to data cache misses. Miss rates interms of misses per reference (e.g. data cache misses per data reference) provide another useful metric for analyzingthe performance of specific functional units.
workloadExecution time (seconds) Executable size (kilobytes) Resident Size (kilobytes)
NetBSD NT Windows NetBSD NT Windows NetBSD NT Windows
Wish 7.048 14.944 18.946 433 1080 836 1740 1000 799
Ghostscript 16.922 9.3 20.322 397 472 555 2380 3000 1535
Web Server 74.767 69.044 78.567 243 225 243 3684 4688 1004
Table 5. Application Workloads. Extensive use of dynamically loaded libraries makes it difficult to interpret executable sizes forthese programs. For this reason we have provided both executable size and resident size. Executable size for Wish includes exe-cutables and DLLs. The resident sizes were measured using theps command under UNIX, the Performance Monitor under Win-dows NT, and Stretch utility from Microsoft Visual C++ 1.5 under Windows. Although the measurements are very approximate,they do give an indication of the real memory requirements of the application. The Web Server under NetBSD forks approxi-mately 22 processes, each of which has an average resident size of 399 K Bytes. These resident sizes are not additive becausetext pages are shared between the processes. The NetBSD Web resident size assumes 156 K bytes of unique data per processes.
instruction operation cycles
INC AX increment register AX 1
INC memloc increment variable in memory 3 with cache hit
LDS DX, memloc load address at memloc into DS:DX 4 with cache hit
INT imm call to interrupt procedure 16-108, depending on protection and machine mode changes
IRET return from interrupt procedure 8-97, depending on protection and machine mode changes.
REP MOVSB string copy many - can copy up to 4 GBytes
Table 6. Some Multicycle Pentium instructions.

9
In analyses of RISC-based computer systems, per-instruction metrics such as Cycles per Instruction (CPI) ormisses per instruction are typically used as a measure of how effectively a machine architecture supports a givencomputation. In a hypothetical RISC architecture where each instruction has the same minimum latency and does acomparable amount of work, per-instruction metrics can be interpreted in an immediate and straightforward way asthe amount of time required to do a quantum of work. Such an interpretation relies on the assumption that the amountof work done by a computation is proportional to the number of instructions executed. This assumption does notapply for a multiple cycle per instruction architecture such as the Intel 80386. Table 5 gives some examples of multi-ple cycle Pentium instructions and their latencies. Many common Pentium instructions require multiple cycles and dosignificantly more computational work than a single cycle instruction. Simply taking an event count and dividing bythe number of instructions can be misleading. Although we sometimes analyze CPI for isolated systems, we avoidusing it as a basis for cross-system comparison.
The problem with interpreting instruction counts on a machine like the Pentium is that an operation such as ablock copy can be implemented in different ways with comparable cycle counts but different instruction counts. Wehave determined that all three systems make extensive use of repeated string instructions such as REP MOVSB. InNetBSD and Windows NT, routines such as bcopy() are implemented using REP. Additionally, Windows uses REPextensively in hand-coded assembler. Section 4 discusses in detail how changes in machine mode (INT and IRETinstructions) are used in the three systems.
The Pentium provides a count of instruction cache misses but not instruction cache stall cycles. In our analysiswe sometimes use an estimate of instruction stall cycles as a percentage of total cycles. This estimate is a lower boundwhich assumes that all on-chip instruction cache misses hit in the second level cache.
Idle time is implemented differently on each of the three system, and these differences must be accounted forwhen interpreting counter values. Windows NT executes a HALT instruction when the system is idle. Although thecycle counts continue to increment when the CPU is halted, no instructions or other events occur. NetBSD uses anidle loop. We adjusted our NetBSD counts for idle loop activity so that they would be comparable with counts forWindows NT. Windows also halts the machine during idle time, however the idle halt is not used during disk activity.I/O requests cause Windows to busy wait. This makes it harder to interpret counts for Windows when significant diskactivity occurs.
NetBSD experiments ran in single-user mode. Windows NT and Windows experiments were run with minimalbackground activity. The network was disconnected for all tests except for the Web server.
4. Microbenchmark Results
4.1 The Null BenchmarkOur Null benchmark measures the overhead for invoking a third party system extension, namely our device for
controlling the Pentium counters. Pseudocode for our Null benchmark is as follows:for (each counter)
for (i = 0; i < 50; i++) { start(); stop();}
The function start() zeros the current counter, and stop() stores the counter value in an in-memory log. We used thisbenchmark to understand and tune our code for reading and controlling the counters, and to measure correction fac-tors for counter maintenance overhead to be used in other experiments.
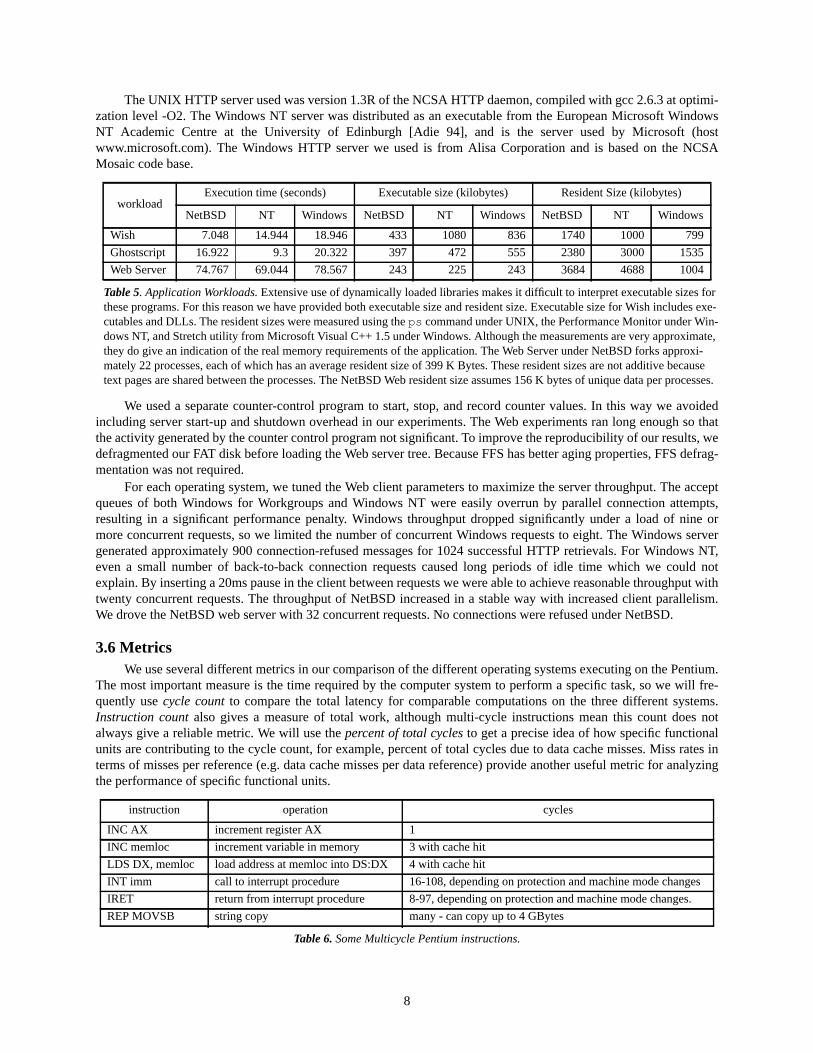
Figure 1 shows baseline results for the Null benchmark on the three systems. Comparison of the instructioncounts shows that Windows requires far fewer instructions to access the counters than do the other systems. This isbecause the Windows protected mode driver can be called directly from a user program without invoking the operat-ing system. Windows NT requires many more instructions to access the counters relative to the other systems. Thisoverhead is due to the multiple protection domain crossings required to access the counter device in Windows NT.From the Windows NT documentation [Custer 94] we have inferred that six protection boundary crossings arerequired for this operation between the application, Executive, and Win32 subsystem. In comparison, NetBSDrequires two protection boundary crossings. Windows does not require protection boundary crossings, although itdoes require two changes of machine mode.
10
On the Pentium, CPI can be used as an indicator of multi-cycle instructions. The wide variation in CPI acrossthe three systems is due to the combined effect of multi-cycle instructions and variations in system structure. First,note that the CPI for Windows is very high (450 cycles / 106 instructions). The high CPI is due to the high density ofmulti-cycle instructions in the access path for our counter VxD. In particular, VxD subroutines are called using theINT instruction and return using IRET. INT requires 70 or more cycles. IRET requires 90 or more cycles. The corre-sponding mechanisms for Windows NT and NetBSD have lower latency (44 cycles for call, 27 for return) because nochange in processor mode is required.
High CPI in Windows can be attributed to multi-cycle instructions. In Windows NT we identified three phenom-ena which contribute to elevated cycle counts:
• Branch Prediction Performance (Figure 1). This may be due to procedure call patterns and relativelyfew loops.
• I Cache miss rate (Figure 1a). This is an indication of poor instruction locality in Windows NT. Bothbranch density and larger code size (Table 1) could be contributing factors.
• More multi-cycle instructions relative to NetBSD.Our Null benchmark accurately reflects the overhead for accessing third-party kernel mode functionality in the
three systems. The results show that Windows applications which access hardware devices directly get a substantialperformance advantage compared to the other two systems. However, the results are not indicative of the timerequired to access system functionality in general. The Syscall benchmark presented in the next section gives a moreprecise measure of the cost of accessing functionality implemented in the system.
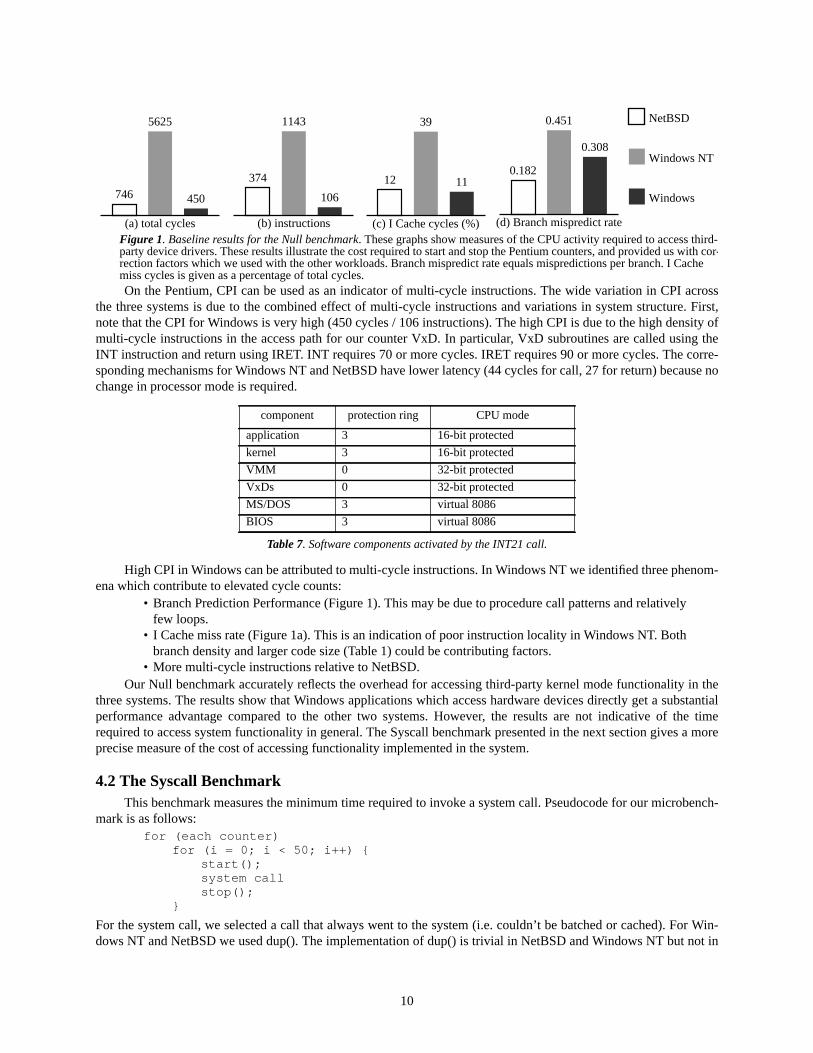
4.2 The Syscall BenchmarkThis benchmark measures the minimum time required to invoke a system call. Pseudocode for our microbench-
mark is as follows:for (each counter)
for (i = 0; i < 50; i++) {start();system callstop();
}
For the system call, we selected a call that always went to the system (i.e. couldn’t be batched or cached). For Win-dows NT and NetBSD we used dup(). The implementation of dup() is trivial in NetBSD and Windows NT but not in
component protection ring CPU mode
application 3 16-bit protected
kernel 3 16-bit protected
VMM 0 32-bit protected
VxDs 0 32-bit protected
MS/DOS 3 virtual 8086
BIOS 3 virtual 8086
Table 7. Software components activated by the INT21 call.
(a) total cycles
746
5625
450
(b) instructions
374
1143
106
(c) I Cache cycles (%)
12
39
11
Figure 1. Baseline results for the Null benchmark. These graphs show measures of the CPU activity required to access third-party device drivers. These results illustrate the cost required to start and stop the Pentium counters, and provided us with cor-rection factors which we used with the other workloads. Branch mispredict rate equals mispredictions per branch. I Cachemiss cycles is given as a percentage of total cycles.
(d) Branch mispredict rate
0.182
0.451
0.308
NetBSD
Windows NT
Windows

11
Windows; for Windows we used the “get extended error function” call (INT21 Function 59). The results in Figure 2are corrected for counter manipulation overhead.
The overhead for the dup() system call in Windows NT and NetBSD is similar to the overhead required to startand stop the counters in the Null benchmark. Also, observations from the Null benchmark with respect to the instruc-tion cache and branch behavior continue to hold (Figure 2c,d).
We were surprised by the large overhead required to access the minimum system functionality in Windows. Twoaspects of Windows structure contribute to this high cost. First, Windows requires frequent changes between threeCPU modes: virtual 8086 mode, 16-bit protected mode, and 32-bit protected mode. The cost of the CPU mode changeis in addition to the cost of privilege level changes required to enter kernel mode. Table 7 shows the modules that areactivated for the INT21 call and the CPU mode they require. Each change of CPU mode requires a single instructionwith latency of 80 - 100 cycles to save and restore hardware state, plus additional overhead to maintain software state.
Another control structure which contributes to the cost of Windows system calls is the use of “hooks,” a mecha-nism by which a program can change MS/DOS functionality by intercepting system calls. Many programs use hooks,including disk caching software, CD-ROM drivers and disk compression software. A system call hook requires mod-ifying the system call vector; in this way, a chain of interested programs can filter system calls as they arrive to see ifthe requested functionality is something they implement. This chain of filters lengthens the time required to process asystem call.
Our Syscall benchmark shows that the cost of using functionality implemented in the system is comparable forWindows and Windows NT, both of which have higher overhead than NetBSD. As it exercises minimal system func-tionality, a large percentage of total activity corresponds to system call invocation overhead, so our benchmark tendsto exaggerate the impact of this overhead. The more complicated workloads that follow give a better indication of theimpact of this overhead in more realistic situations.
4.3 The Exec BenchmarkThis benchmark measures how quickly the system can load and run a trivial program. Pseudo code for our
benchmark is as follows:for each counter
start();for (i = 0; i < 100; i++) {
fork+exec(); /* or equivalant */wait_for_child_to_exit();
}stop();
The activity required to execute a program is slightly different for each system. NetBSD uses the vfork() and exec()system calls. The vfork() avoids the overhead of duplicating the parent address space. In Windows NT, the CreatePro-cess() system call takes an executable file as one of its parameters, and creates a new address space in which that exe-cutable is consequently run. For Windows, Win16 applications run in a single shared address space so no addressspace creation occurs. WinExec() takes an executable file along with other parameters for running a program, loadsthe specified program into the shared address space, and starts it.
(a) Total Cycles
912
5149 4874
(b) Instruction Count
288
1076
811
NetBSD
Windows NT
Windows
(c) I Cache cycles (%)
23
44
20
(d) Branch mispredict rate
0.453
0.670
0.333
Figure 2. Baseline results for the Syscall benchmark. These results show that the cost of accessing system functionality ismuch lower in NetBSD than in the other two systems. The difference is due to system structure. These results were cor-rected for the cost of accessing the Pentium counters.

12
Comparing the cycle and instruction counts, the NetBSD static case gives by far the best performance. Addressspace creation and program loading is a relatively cheap operation in UNIX. The overhead is a factor of five higher inWindows NT. Although we cannot attribute the higher costs relative to NetBSD to specific aspects of Windows NTinternals, two likely sources are the extra communications required by microkernel structure and support for back-wards compatibility.
Compared to NetBSD, the NT Executive leaves much of process creation to the environment subsystems. TheNT Executive provides an NtCreateProcess() system call which creates a new process object by duplicating theaddress space of the calling process. The thread (another object type) must be created separately. A subsystem mustperform several system calls to implement the equivalent of a Unix execve(), resulting in more protection domainswitches and associated overhead. This is consistent with earlier results comparing microkernel and monolithic ker-nel behavior [Chen & Bershad 93].
Our measurements show that program execution in Windows NT requires many more data references than Net-BSD; six times as many data reads and five times as many data writes. Some possible sources for this overheadinclude extra copies introduced by the microkernel structure and inefficiencies introduced in the duplication of theaddress spaces, however we were not able to determine the exact source of this increased data activity.
Executing a dynamically loaded binary more than doubles the cost of program execution for both NetBSD andWindows NT. This represents the cost of relinking a program at execution time, and suggests that static linking maybe preferable for small programs with short execution times.
In Windows, program execution does not require creation of a new address space, but it does require dynamiclinking. Although this cost is high relative to NetBSD static execution, one should keep in mind that programs underWindows are typically long-lived and interactive. Short lived computations are more likely to be implemented as asubroutine (such as thedir command in the MS/DOS command interpreter) thereby avoiding the overhead of pro-gram execution.
Although the NetBSD static case has the lowest overhead in terms of total cycles, it has the highest CPI (7.25).Figure 4 shows that memory system penalties are a major contributor. We attribute this higher memory system loadto:
• a short, straight code path with little looping. In particular, loops required for dynamic linking areavoided.
• reads and writes are due to copies of large structures such as page tables, hence poor locality.
(a) total cycles (x1000)
450
17392409
5335
1272
(b) instructions (x1000)
62
447 491
1256
243
Figure 3. Baseline results for the Exec benchmark. The minimum cost for executing a program is dependent on the systemand also whether libraries used by the program are statically or dynamically linked.
NetBSD Static
NetBSD Dynamic
Windows NT Static
Windows NT Dynamic
Windows
(a) Data Stall Cycles (%)
56.7545.93
40.94 38.9547.22
NetBSD Static
NetBSD Dynamic
Windows NT Static
Windows NT Dynamic
Windows
Figure 4. Memory stall cycles as a percent of total cycles for the Exec benchmark. The high penalty for the NetBSD Staticcase is deceptive because the total cycle count for NetBSD Static is very low.
(b) ICache Cycles (%)
13.0610.51
17.09 15.94
6.44

13
Data Stall Cycles/Miss is higher for NetBSD than for the other two systems. This indicates that a greater propor-tion of data cache misses go through to main memory, rather than hitting in the second level cache. The results for theExec benchmark serve as an example of the cost of invoking significant system functionality. They also give evidencethat the structure and compatibility requirements for NetBSD permit a much more efficient implementation than ispossible with Windows or Windows NT.
4.4 Memory Access TimeWe used the memory read microbenchmark from lmbench [McVoy 94] to measure average memory access time
for repeated references to arrays of various sizes, using a stride of 128 bytes. Pseudocode for the benchmark is as fol-lows:
for (i = 0; i < SIZE; i++)a[i] = &a[(i+32)% SIZE]
p = a[0];start();for (1,000,000 iterations)
p = *p;stop();
Figure 5 shows experimental results for array sizes ranging from 512 Bytes to 1 MByte. The curves show how theeffects of operating system policy, the API, and memory hierarchy parameters combine to determine memory accesstime. Comparing Windows NT and NetBSD, both systems get similar average access times below 8 KBytes, wherethe test array fits in the on-chip cache. Above 8 KBytes, access times are determined by how pages are mapped intothe 256 KByte board cache. Windows NT uses a deterministic page mapping policy [Chen & Bershad 93] that givessimilar performance for arrays up to the size of the second level cache and a smooth performance degradation forarrays from 256 KBytes up to 512 KBytes (twice the size of the second level cache). The deterministic page mappingpolicy guarantees that no two pages will conflict for arrays less than 256 KBytes, and that pages will conflict in pairsfor arrays from 256-512 KBytes. At the 512 KByte boundary, each page conflicts with at least one other page; thusthe board cache is of no benefit as the array is traversed sequentially.
NetBSD uses the trivial page mapping policy of simply taking the next page off the free list. The curve for Net-BSD shows that the random NetBSD policy can do a poor job of avoiding conflicts. The randomness in the NetBSDpolicy causes unnecessary conflicts, thus giving NetBSD worse performance relative to Windows NT up to a cross-over point slightly before 500 KBytes. Above 500 KBytes, NetBSD policy randomly avoids conflicts, giving betterperformance relative to Windows NT.
0
10
20
30
40
50
0 200000 400000 600000 800000 1e+06 1.2e+06
NetBSDNT
Win
Cycles
Array size in bytesFigure 5. Memory Access Time. This graph illustrates the relationship between cycles per memory reference and array size,for arrays ranging from 512 Bytes to 1 MByte. A stride of 128 bytes was used. The shape of the curves show how system pol-icy, API, and memory hierarchy parameters combine to determine memory access time.
14
The policy used by Windows NT depends on its ability to allocate a physical page of a suitable color. We foundthat the integrated buffer cache used by Windows NT can sometimes interfere with the page allocation policy; appar-ently the page allocator prefers to disregard the requested page color rather than take a page from the cache manager.The NT measurements for Figure 5 were run with a recently booted NT system. An NT system with a greater balanceof “free” memory in use by the file data cache would show worse behavior between 8 and 256 KBytes.
Turning to Windows, the segment size limitation of the Win16 interface causes performance degradations in allthe tests. The Win16 interface imposes a 64 Kbyte upper limit for allocation of contiguous memory. Because of thepointer-chasing loop used by our microbenchmark, it impossible for the Win16 compiler to determine when a mem-ory reference will cross a segment boundary. This forces the Win16 compiler to generate a four-instruction sequenceto load the segment register which is executed before every array reference. Segment register maintenance increasesthe instructions per iteration from one to five, and cycles per iteration from a minimum of two (in case of a 512 KBytearray) to a minimum of nine.
As the size of the array increases, we see that the effects of the memory hierarchy on Windows reference timesis similar to the behavior for the other two systems, except that the Windows curve is shifted up due to the overheadof maintaining segment registers. The segmented address space used by the Win16 API causes significantly increasedoverhead both in terms of cycles and instructions for the Windows test, and is representative of behavior expected inWin16 programs that use significant amounts of data (more than 64 KBytes) but haven’t been carefully tuned toaccommodate segment boundaries.
Overall, our memory access test shows that the operating system can impact application performance in waysthat have little to do with the latency of operating system activity during program execution. API and system policyhave a large impact on the average memory access times for user code.
4.5 File System PerformanceDifferences in software overhead, meta-data handling policy, and file system layout lead to performance differ-
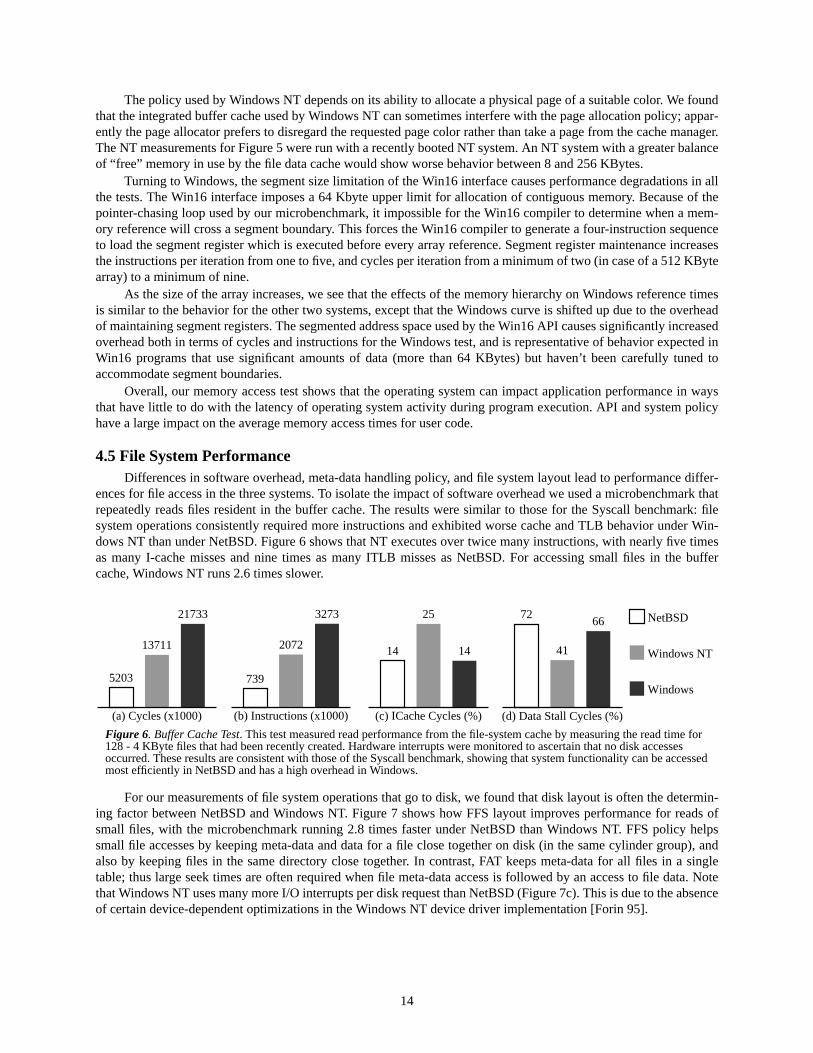
ences for file access in the three systems. To isolate the impact of software overhead we used a microbenchmark thatrepeatedly reads files resident in the buffer cache. The results were similar to those for the Syscall benchmark: filesystem operations consistently required more instructions and exhibited worse cache and TLB behavior under Win-dows NT than under NetBSD. Figure 6 shows that NT executes over twice many instructions, with nearly five timesas many I-cache misses and nine times as many ITLB misses as NetBSD. For accessing small files in the buffercache, Windows NT runs 2.6 times slower.
For our measurements of file system operations that go to disk, we found that disk layout is often the determin-ing factor between NetBSD and Windows NT. Figure 7 shows how FFS layout improves performance for reads ofsmall files, with the microbenchmark running 2.8 times faster under NetBSD than Windows NT. FFS policy helpssmall file accesses by keeping meta-data and data for a file close together on disk (in the same cylinder group), andalso by keeping files in the same directory close together. In contrast, FAT keeps meta-data for all files in a singletable; thus large seek times are often required when file meta-data access is followed by an access to file data. Notethat Windows NT uses many more I/O interrupts per disk request than NetBSD (Figure 7c). This is due to the absenceof certain device-dependent optimizations in the Windows NT device driver implementation [Forin 95].
(b) Instructions (x1000)
739
2072
3273
(a) Cycles (x1000)
5203
13711
21733
(c) ICache Cycles (%)
14
25
14
(d) Data Stall Cycles (%)
72
41
66 NetBSD
Windows NT
Windows
Figure 6. Buffer Cache Test. This test measured read performance from the file-system cache by measuring the read time for128 - 4 KByte files that had been recently created. Hardware interrupts were monitored to ascertain that no disk accessesoccurred. These results are consistent with those of the Syscall benchmark, showing that system functionality can be accessedmost efficiently in NetBSD and has a high overhead in Windows.

15
The structure and semantics of FFS require two synchronous writes for every file creation. In contrast FATsemantics permit meta-data to be buffered in memory. To quantify the performance impact of this policy difference,we used a benchmark that created 128 zero-length files (See Figure 8). Meta-data updates can be an order of magni-tude faster under Windows NT/FAT than under NetBSD/FFS. The low number of non-clock hardware interruptsshows that meta-data updates remain in memory for Windows NT rather than being written synchronously to disk (asin NetBSD), so that this workload is disk-bound under NetBSD and CPU bound under Windows NT.
Because we used FAT for both Windows NT and Windows, some aspects of file access are the same for the twosystems. Both handle meta-data better than NetBSD (Figure 8a), although the high cost of accessing the system inWindows also increases the overall instruction and cycle counts (Figures 6 and 8). Windows instruction behavior dif-fers greatly from the other systems in that Windows busy waits during disk requests rather than using I/O interrupts
(Figure 7c). This a probable explanation for the high instruction counts (Figure 7b) and relatively low cycle count(Figure 7a) for Windows as compared to Windows NT.
Overall, our file system measurements show that the time to access system functionality (as in the Syscallbenchmark) has significant latency for operations that hit in the buffer cache. For operations that go to disk, file layoutpolicy must be considered. Windows NT performs worse than NetBSD when it must go to disk, but its unified buffercache prevents a decrease in performance for many workloads. We will see an example of this behavior in Section 5.3when we discuss our Web Server workload.
4.6 Graphics Performance: BitbltThe goals of our graphics microbenchmark experiments were to carefully study performance on all three sys-
tems with respect to a specific graphics operation and to gain insight on the impact of graphics performance on theGhostscript workload. Although a comprehensive study of graphics performance is beyond the scope of this work,
Windows performance is a factor of five worse (in cycles) when the default device driver is used to access the SCSI device. As MS/DOS runs in Virtual 8086 mode and Windows applications run in Protected 16-bit mode, the standard driver requires an expensivecopy operation to transfer the I/O data from MS/DOS memory to memory the application can use. Better performance is possiblewith a SCSI device and device driver that use a technique called “VDMA” - DMA to virtual memory [NCR 94]. VDMA is sup-ported by the NCR 815 SCSI interface we used.
(a) Cycles (millions)
3832
10655
4672
(b) Instructions (millions)
85
521
1191
(c) Non-clock Interrupts
8842
59944
711
NetBSD
Windows NT
Windows
Figure 7. Small File Disk Test. Performance of file accesses to disk was measured by reading 8192 - 8 KByte files. The fileswere split among 32 directories (256 files per directory). FFS file layout favors small files accesses to disk by keeping meta-data and data for a file close together. As Windows busy-waits for I/O requests, the interrupt count is low.
(a) Cycles (x1000)
226368
20064
112779
(b) Instructions (x1000)
21675578
17419NetBSD
Windows NT
Windows
Figure 8. Meta-Data Test. This test measured the overhead of creating 128 zero-length files. NT requires many fewer cyclesbecause it keeps meta-data in memory rather than writing it to disk.
(c) Non-clock Interrupts
261
528

16
the performance for the bitblt operation reveals key differences between the three systems that may be useful inunderstanding other aspects of graphics performance.
Our Bitblt benchmark displayed a 560x1520 array of pixels in a window of size 560x760, repeating this opera-tion 760 times. The first iteration displayed rows 0-759 and the row index was increased by one with each iteration.Figure 9 shows microbenchmark results using an array of one-bit pixels. NetBSD requires a factor of ten more datareferences and a factor of 100 more instructions than Windows or Windows NT. To understand this behavior we con-sider the specific operations used in each system to move a pixel array from its source to the screen.
A 560x760 bitmap occupies 52 K bytes. Copying this bitmap into graphics memory 760 times implies a transferof approximately 40 M Bytes or 10 million 32-bit words. Windows and Windows NT copy each bitmap only once,from application memory directly into graphics memory as a 1-bit pixel array. This explains the approximately 10million data writes for Windows and Windows NT. X11 copies each pixelmap multiple times. The first copy happensthe kernel, copying the bitmap from the X11 client to the X11 server. The last copy and the most expensive trans-forms the 1-bit pixel array is into an 8-bit pixel array, increasing the required number of writes by a factor of eight.These two data movements account for 90 million writes. Our experiments indicate that the additional 26 millionwrites occur in the X11 server, although the complexity of the X11 source and the limitations of our tools made it dif-
ficult to identify the source of the writes with any greater precision.The number of instructions executed in Windows and Windows NT is significantly less than the number of data
references. This indicates that the REP prefix is being used to copy many words with a single instruction. In X11 pix-els are copied using machine independent code written in C. The REP prefix is not used, and each write instructionissued writes at most a single word. X11 uses twice as many read operations as write operations because each word isread twice during the conversion from one-bit to eight-bit pixels. Overall we see that protection and portability in X11has a significant cost for the bitblt operation.
Windows and Windows NT use a device-dependent bitmap for the above test, while X11 uses a device indepen-dent format. In a future version of this paper we will compare bitblt performance when all three systems use a device-independent format and eight bits per pixel.
4.7 Network ThroughputOur network throughput benchmark measured the time to send a 256 K byte buffer to a remote host on a dedi-
cated Ethernet, using a 24 K byte receive buffer. Figure 10 shows comparable networking behavior for NetBSD andWindows NT, with similar instruction counts, data references, and data cache miss. The only difference we notedbetween the two systems was worse code locality for Windows NT, with both instruction TLB and cache misses sig-nificantly higher. This is consistent with results for other benchmarks, suggesting that Windows NT has worse overallinstruction locality as compared to the other systems.
Although Windows shows higher event counts than the other systems, throughput is comparable with the othertwo systems at about 1M byte per second, suggesting that all three systems are limited by the capacity of the rawEthernet.
X11 does support a shared-memory extension and this could conceivably reduce the number of copies by one. However, this exten-sion is inconvenient because it uses a special API, thus it is not generally used.
Figure 9. Bitblt test. This figure illustrates the performance of the three systems for a bitblt graphics operation. The over-head of machine-independent graphics in X11 is evident in the elevated data read and write operations. Higher instructioncounts occur because X11 doesn’t use REP instructions to copy bytes. This results in a higher overall cycle count for X11.The elevated cycle count in Windows is due to memory system contention. We suspect this is due to conflicts between seg-ments.
(a) Cycles (millions)
1197
196
635
(b) Instructions (millions)
793
7.6 7.9
(c) Data Reads (millions)
272
12 12
(d) Data Writes (millions)
116
10 11
NetBSD
Windows NT
Windows
17
4.8 SummaryOur experiments with microbenchmarks have identified several sources of overhead in Windows and Windows
NT that differentiate them from NetBSD. In Windows, frequent CPU mode changes require expensive multicycleinstructions, and the 64 KByte segment size limitation imposes extra overhead in application code. The Null andSyscall benchmarks show that higher instruction counts and instruction cache penalties in Windows NT are due to itsmicrokernel structure. In the next section we will look at the impact of these sources of overhead in real applications.
5. Application Workloads
5.1 Wish
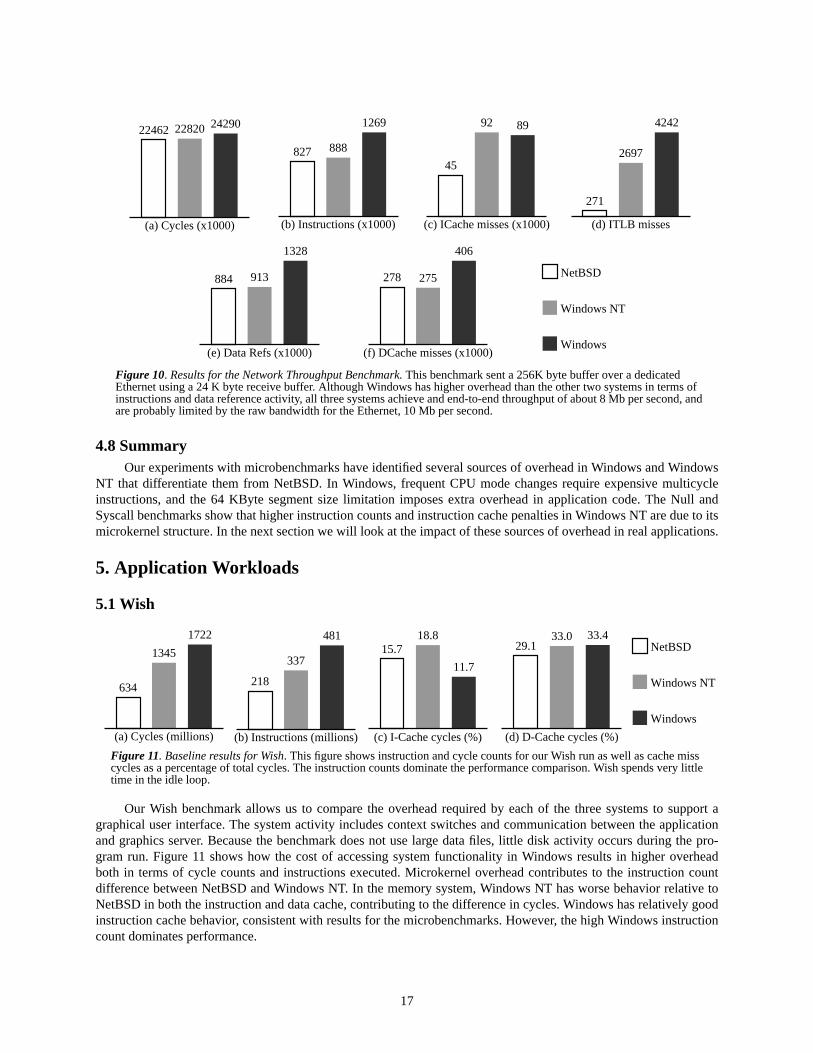
Our Wish benchmark allows us to compare the overhead required by each of the three systems to support agraphical user interface. The system activity includes context switches and communication between the applicationand graphics server. Because the benchmark does not use large data files, little disk activity occurs during the pro-gram run. Figure 11 shows how the cost of accessing system functionality in Windows results in higher overheadboth in terms of cycle counts and instructions executed. Microkernel overhead contributes to the instruction countdifference between NetBSD and Windows NT. In the memory system, Windows NT has worse behavior relative toNetBSD in both the instruction and data cache, contributing to the difference in cycles. Windows has relatively goodinstruction cache behavior, consistent with results for the microbenchmarks. However, the high Windows instructioncount dominates performance.
(a) Cycles (x1000)
22462 22820 24290
(b) Instructions (x1000)
827 888
1269
(c) ICache misses (x1000)
45
92 89
(d) ITLB misses
271
2697
4242
NetBSD
Windows NT
Windows
Figure 10. Results for the Network Throughput Benchmark. This benchmark sent a 256K byte buffer over a dedicatedEthernet using a 24 K byte receive buffer. Although Windows has higher overhead than the other two systems in terms ofinstructions and data reference activity, all three systems achieve and end-to-end throughput of about 8 Mb per second, andare probably limited by the raw bandwidth for the Ethernet, 10 Mb per second.
(e) Data Refs (x1000)
884 913
1328
(f) DCache misses (x1000)
278 275
406
(a) Cycles (millions)
634
1345
1722
(b) Instructions (millions)
218
337
481
Figure 11. Baseline results for Wish. This figure shows instruction and cycle counts for our Wish run as well as cache misscycles as a percentage of total cycles. The instruction counts dominate the performance comparison. Wish spends very littletime in the idle loop.
(c) I-Cache cycles (%)
15.718.8
11.7
(d) D-Cache cycles (%)
29.133.0 33.4
NetBSD
Windows NT
Windows
18
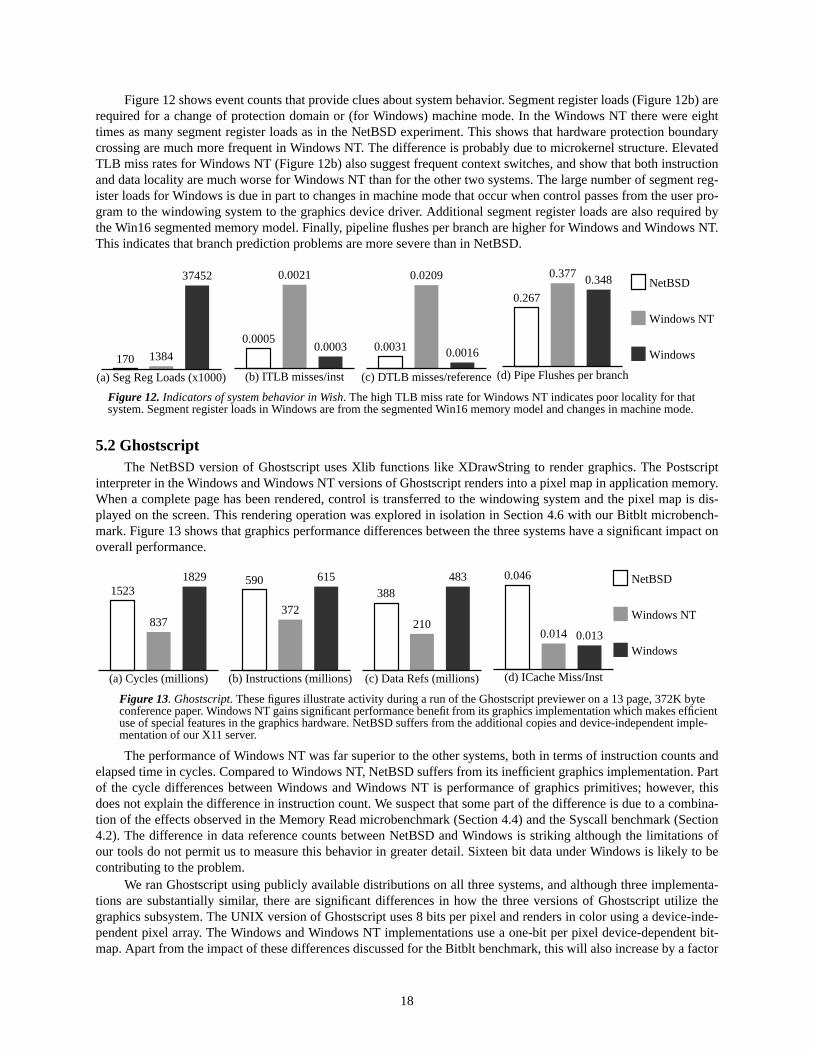
Figure 12 shows event counts that provide clues about system behavior. Segment register loads (Figure 12b) arerequired for a change of protection domain or (for Windows) machine mode. In the Windows NT there were eighttimes as many segment register loads as in the NetBSD experiment. This shows that hardware protection boundarycrossing are much more frequent in Windows NT. The difference is probably due to microkernel structure. ElevatedTLB miss rates for Windows NT (Figure 12b) also suggest frequent context switches, and show that both instructionand data locality are much worse for Windows NT than for the other two systems. The large number of segment reg-ister loads for Windows is due in part to changes in machine mode that occur when control passes from the user pro-gram to the windowing system to the graphics device driver. Additional segment register loads are also required bythe Win16 segmented memory model. Finally, pipeline flushes per branch are higher for Windows and Windows NT.This indicates that branch prediction problems are more severe than in NetBSD.
5.2 GhostscriptThe NetBSD version of Ghostscript uses Xlib functions like XDrawString to render graphics. The Postscript
interpreter in the Windows and Windows NT versions of Ghostscript renders into a pixel map in application memory.When a complete page has been rendered, control is transferred to the windowing system and the pixel map is dis-played on the screen. This rendering operation was explored in isolation in Section 4.6 with our Bitblt microbench-mark. Figure 13 shows that graphics performance differences between the three systems have a significant impact onoverall performance.
The performance of Windows NT was far superior to the other systems, both in terms of instruction counts andelapsed time in cycles. Compared to Windows NT, NetBSD suffers from its inefficient graphics implementation. Partof the cycle differences between Windows and Windows NT is performance of graphics primitives; however, thisdoes not explain the difference in instruction count. We suspect that some part of the difference is due to a combina-tion of the effects observed in the Memory Read microbenchmark (Section 4.4) and the Syscall benchmark (Section4.2). The difference in data reference counts between NetBSD and Windows is striking although the limitations ofour tools do not permit us to measure this behavior in greater detail. Sixteen bit data under Windows is likely to becontributing to the problem.
We ran Ghostscript using publicly available distributions on all three systems, and although three implementa-tions are substantially similar, there are significant differences in how the three versions of Ghostscript utilize thegraphics subsystem. The UNIX version of Ghostscript uses 8 bits per pixel and renders in color using a device-inde-pendent pixel array. The Windows and Windows NT implementations use a one-bit per pixel device-dependent bit-map. Apart from the impact of these differences discussed for the Bitblt benchmark, this will also increase by a factor
(b) ITLB misses/inst
0.0005
0.0021
0.0003
(a) Seg Reg Loads (x1000)
170 1384
37452
(d) Pipe Flushes per branch
0.267
0.377 0.348
(c) DTLB misses/reference
0.0031
0.0209
0.0016
Figure 12. Indicators of system behavior in Wish. The high TLB miss rate for Windows NT indicates poor locality for thatsystem. Segment register loads in Windows are from the segmented Win16 memory model and changes in machine mode.
NetBSD
Windows NT
Windows
(a) Cycles (millions)
1523
837
1829
(b) Instructions (millions)
590
372
615
(c) Data Refs (millions)
388
210
483
(d) ICache Miss/Inst
0.046
0.014 0.013
NetBSD
Windows NT
Windows
Figure 13. Ghostscript. These figures illustrate activity during a run of the Ghostscript previewer on a 13 page, 372K byteconference paper. Windows NT gains significant performance benefit from its graphics implementation which makes efficientuse of special features in the graphics hardware. NetBSD suffers from the additional copies and device-independent imple-mentation of our X11 server.

19
of eight the data references required each time the image is copied. This difference in functionality leads to a signifi-cant performance disadvantage for NetBSD. In an attempt to level the playing field, we are developing special ver-sions of our Ghostscript benchmark for Windows and Windows NT that use device independent pixelmaps with 8-bitcolor. This will increase the copy overhead for creating the image and transferring it from user to screen memory.
The results of these experiments will be reported in a future version of this paper.
5.3 Web ServerBaseline results for the Web server (Figure 14) show that all three systems achieve similar throughput (about
fourteen requests per second). Unlike the network throughput benchmark, the limited resource in this case was not thecapacity of the Ethernet, which was transferring data at less than 11% of its capacity (9.7 MB in 69 seconds for Win-dows NT), but rather the combined computational requirements of network activity and filesystem access.
All three systems suffer from very high memory system penalties. Figures 14 (f) and (g) show that a significantpercentage of execution time for this workload goes to stall cycles waiting for memory, from 36 to 40 percentdepending on the system. Our trace of 1024 Web server requests referenced 398 distinct files; there is some locality inthe trace, but the memory cache is not large enough to take advantage of it. This suggests that machines intended toprovide high performance Web service would benefit from optimizations to avoid cache latency.
Instruction cache miss rates are significantly higher for Windows NT than for the other two systems, and thissupports our overall conclusion that Windows NT has worse instruction locality than the other two systems. Althoughcache miss rates are highest for Windows NT, this does not result in higher overall memory read stall cycles. Givenour limited information about the Pentium counters and the complications introduced by Pentium dual instructionissue, we were not able to determine how memory penalties overlap to result in lower overall stall cycles for Win-dows NT.
Windows NT gives the best overall performance of the three systems. Its integrated buffer cache/free memorypool means that more requests can be serviced without going to disk, hence the overall higher throughput (Figure14a). The other two systems have smaller buffer caches, hence more disk activity and greater overall latency. Thereduced I/O requirements for Windows NT are reflected in a lower count of non-clock interrupts (Figure 14h). On theNetBSD system we were able to measure the number of idle-loop iterations during our Web benchmark. From this wecan estimate that about 600M cycles (10 percent) of execution time went to idle time, waiting for disk reads, in theNetBSD system. Because the size of the filesystem cache for both Windows and NetBSD is about the same (2 MB vs.3.2MB), we expect a comparable amount of idle time to occur in Windows.
(a) Cycles (millions)
6729 6214 7071
(b) Instructions (millions)
741 987
1562
(c) Data Refs (millions)
645 687
1578
(d) ICache Miss/Inst
0.071
0.124
0.037
NetBSD
Windows NT
Windows
Figure 14. Baseline results for the Web Server. Although the Web server has similar throughput on all three systems, the sys-tems spend the time differently. The larger file system cache available to Windows NT gives it better overall throughput. TheNetBSD instruction counts is non-idle instructions. Note that (a) Cycles includes idle-loop activity for NetBSD and WindowsNT, but (b) instructions does not.Windows NT does less disk requests and this reduces context switch activity. This differencein disk activity also means that Windows NT needs fewer hardware interrupts.
(e) DCache Read Miss/Inst
0.0460.051
0.026
(f) Read Stall cycles (%)
40.1 37.6 36.2
(g) Write Stall cycles (%)
18.4
13.6
22.5
(h) Non-clk Intrs
3141027786
43948

20
6. ConclusionsThe structure of personal computer operating systems has a tremendous impact on the cost of accessing system
functionality. Our experiments have served to quantify performance differences in the three systems and identifysome of their sources.
The structure of Windows has a significant negative impact on performance. Our microbenchmarks led us toidentify three specific mechanisms in Windows that have a negative impact on performance:
• changes of machine mode• overhead from system call hooks• overhead for support of segmented memory
Windows requires many segment registers loads and many changes of machine mode. Hardware designers who seekto improve performance for current versions of Windows and current Win16 applications should take this into consid-eration; they should also be aware that with the Win32 interface machine mode changes are less frequent. Overall, themechanisms used in Windows to support extensibility and backwards compatibility have a significant negative per-formance impact. By discouraging use of segmented memory and reducing machine-mode changes, Windows 95[King 94, Pietrek 94, Pietrek 95] could improve the situation.
Much of the cost of system functionality in Windows is due to the structure of the system rather than the APIrequired by Windows applications. The superior performance of Windows NT relative to Windows suggests that PC-style applications using the Windows API can be supported without the large negative performance impact thatoccurs in the current Windows implementation. Even so, the microkernel system structure used by Windows NT tosupport protected address spaces and multiple APIs leads to a significant increase in system overhead formicrobenchmarks relative to NetBSD in terms of dynamic instruction counts. Furthermore, our measurements consis-tently showed that Windows NT has worse instruction locality. Windows NT presents a higher load to TLBs andcaches than the other two systems. This may be due to the way objects are used for resource management in WindowsNT, although without better tools it is difficult to pinpoint the difference with any precision. Finally, advanced fea-tures (unified buffer cache, efficient graphics implementation) helped Windows NT achieve better overall perfor-mance than the other two systems for two of the three realistic benchmarks we used, in spite of the negativeperformance impact of Windows NT structure that was exposed by the microbenchmarks.
Our experiments with NetBSD demonstrate the performance advantages of its clean monolithic structure.Although in most cases the performance impact of protection and portability is not significant, it can lead to extracopies and poor use of hardware features, as shown by the graphics microbenchmark. We must note that the poor useof graphics hardware in NetBSD is due more to commercial as well as technical issues. It would be possible toimprove graphics performance for NetBSD/X11, but it is not at all clear that sufficient motivation to do this exists.
A major shortcoming of our workloads is that they are UNIX-centric. They fail to demonstrate the strong pointof Windows - the abundance of interactive application software available for that platform. Even so, they have per-mitted us to understand performance issues and identify crucial structural differences between the operating systemsthat dominate current computing.
Microbenchmarks are useful because they are easy to analyze. With realistic applications it is much more diffi-cult to get a complete understanding of software activity during a computation. Our experiments with applicationworkloads gave evidence that the behavior we isolated with our microbenchmarks has significant impact in realisticsituations. Performance counters provide clues about behavior, but often they cannot give conclusive evidence. Ameans of acquiring get complete and detailed measurements of the activity within the system is needed. This is thesubject of continuing work at Harvard.
Bibliography[Accetta et al. 86] Michael J. Accetta, Robert V. Baron, William Bolosky, David B. Golub, Richard F. Rashid,
Avadis Tevanian, Jr., and Michael W. Young, “Mach: A New Kernel Foundation for UnixDevelopment,”Proceedings of the Summer 1986 USENIX Conference”, pp 93-113, July 1986.
[Adie 94] Chris Adie,HTTP Server Manual, Version 0.96, European Microsoft Windows NT AcademicCentre, University of Edinburgh, Edinburgh, UK, November 1994.
[Adobe 95] Adobe Systems Incorporated,Postscript Reference Manual. Addison-Wesley, Reading, Mas-sachusetts, 1985.

21
[Bach 86] Maurice J. Bach,The Design of the UNIX Operating System, Prentice-Hall, Englewood Cliffs,New Jersey, 1986.
[Berners-Lee et al. 92]T. Berners-Lee, R. Cailliau, J-F. Groff, and B. Pollermann. World-wide web: The informationuniverse.Electronic Networking Research, Applications and Policy, Volume 2, Number 1,pages 52-58, 1992.
[Bershad et al. 94] Brian N. Bershad, J. Bradley Chen, Dennis Lee, and Theodore H. Romer. “Avoiding ConflictMisses Dynamically in Large Direct-Mapped Caches,”Proceedings of the Sixth InternationalConference on Architectural Support for Programming Languages and Operating System, pp158-170, October 1994.
[Chappell 94] Geoff Chappell,DOS Internals, Addison-Wesley, Reading, Massachusetts, 1994.
[Chen & Bershad 93]J. Bradley Chen and Brian N. Bershad, “The Impact of Operating System Structure on Mem-ory System Performance,”Proceedings of the 14th ACM Symposium on Operating SystemPrinciples, pp. 120-133, December 1993.
[Custer 94] Helen Custer,Inside Windows NT, Microsoft Press, Redmond, Washington, 1993.
[Duncan 86] Ray Duncan.Advanced MSDOS Programming. Microsoft Press, Redmond, Washington, 1986.
[Ezzell 93] Ben Ezzell, “The Power Under the Hood; Preview: Windows NT,”PC Magazine, Volume 12,Number 11, June 15, 1993, pp 219-263.
[Forin 95] Alessandro Forin, personal communication.
[Forin &Malin 94] Alessandro Forin and Gerald R. Malan, “An MS-DOS File System for UNIX”, Proceedings ofthe 1994 Winter USENIX Conference, pp 337-354, January 1994.
[Golub et al. 90] David B. Golub, Randall W. Dean, Alessandro Forin and Richard F. Rashid, “UNIX as anApplication Program,”Proceedings of the Summer 1990 USENIX Conference, pp 87-95, June1990.
[Gunnerson 93] Gary Gunnerson, “Network Operating Systems: Playing The Odds,”PC Magazine, Volume12, Number 18, October 26, 1993, pp 285-336.
[Gwennap 95] Linley Gwennap, “P6 Underscores Intel’s Lead,”Microprocessor Report, Volume 9, no. 2,February 1995.
[Intel 94] Intel Corporation,Pentium Family User’s Manual, Volume 3: Architecture and ProgrammingManual, Intel Corporation, 1994.
[King 94] Adrian King, “Windows, the Next Generation: An Advance Look at the Architecture of Chi-cago,” Microsoft Systems Journal, Volume 9, Number 1, pages 15-24, January 1994.
[Leffler et al. 89] Samuel J. Leffler, Marshall Kirk McKusick, Michael J. Karels, and John S. Quarterman, TheDesign and Implementation of the 4.3 BSD UNIX Operating System, Addison-Wesley, Read-ing, Massachusetts, 1989.
[Linthicum 94] David S. Linthicum, “Life After DOS,”PC Magazine, May 31, 1994, pages 203-237.
[Linthicum & Vaughan-Nichols 93]David S. Linthicum and Steven J. Vaughan-Nichols, “The Beast Turns Beauty; Unix on Intel,”PC Magazine, Volume 12, Number 11, June 15, 1993, pp 219-263.
[Mathisen 94] Terje Mathisen, “Pentium Secrets,”Byte, July 1994, pp 191-192.
[McVoy 94] Larry McVoy, lmbench: Portable Tools for Performance Analysis, Unpublished manuscript.
[Microsoft 90] Microsoft Corporation, Microsoft Windows Guide to Programming, Microsoft Press, Red-mond, Washington, 1990.
[Microsoft 93] Microsoft Corporation,Microsoft Windows NT Resource Kit. Microsoft Press, Redmond,Washington, 1993.

22
[NCR 94] Intel Corporation.PCI SCSI Adapters, PCISCSI Product Family Installation Guide (withSDMS 3.0 User’s Guide), Intel Corporation, Order number 619896-002, 1994.
[Ousterhout 94] John K. Ousterhout.Tcl and the Tk Toolkit. Addison-Wesley, Reading, Massachusetts, 1994.
[Pietrek 93] Matt Pietrek,Windows Internals, Addison-Wesley, Reading Massachusetts, 1993.
[Pietrek 94] Matt Pietrek, “Peering Inside the PE: A Tour of the Win32 Portable Executable File Format,”Microsoft Systems Journal, Volume 9, Number 3, pages 15-34, March 1994.
[Pietrek 95] Matt Pietrek, “Understanding Windows 95 Memory Management: Paging, Address Spaces,and Contexts,” Microsoft Systems Journal, Volume 10, Number 4, pages 19-34, April 1995.
[Rashid et al. 91] Richard Rashid, Gerald Malan, David Golub, and Robert Baron. “DOS as a Mach 3.0 Applica-tion,” Proceedings of the USENIX Mach Symposium, pages 27-40, November 1991.
[Sargent & Shoemaker 86]Murray Sargent III and Richard L. Shoemaker,The IBM PC, Addison-Wesley, Reading Massa-chusetts, 1986.
[Schulman et al. 92] Andrew Schulman, David Maxey, and Matt Pietrek, Undocumented Windows, Addison-Wes-ley, Reading Massachusetts, 1992.
[Shaw 94] Richard Hale Shaw, “An Introduction to The Win32 API,”PC Magazine, pp 291-297, April1994.
[Udell et al. 94] Jon Udell et al, “The Great OS Debate, Special Report on Advanced Operating Systems,”Byte,January 1994, pp. 117-168.
[Van Name and Catchings 94]Mark L. Van Name and Bill Catchings, “Reaching New Heights in Benchmark Testing”,PCMagazine, December 1994, pages 327-332.