the impact of make-a-ten strategy on student addition fact
TRANSCRIPT

Northwestern College, IowaNWCommons
Master's Theses & Capstone Projects Education
5-2017
The Impact of Make-a-Ten Strategy on StudentAddition Fact FluencyJennifer Van WykNorthwestern College - Orange City
Follow this and additional works at: https://nwcommons.nwciowa.edu/education_masters
Part of the Science and Mathematics Education Commons
This Article is brought to you for free and open access by the Education at NWCommons. It has been accepted for inclusion in Master's Theses &Capstone Projects by an authorized administrator of NWCommons. For more information, please contact [email protected].
Recommended CitationVan Wyk, J. (2017). The impact of Make-a-Ten strategy on student addition fact fluency (Master’s thesis, Northwestern College, OrangeCity, IA). Retrieved from http://nwcommons.nwciowa.edu/education_masters/45/
Running head: IMPACT OF MAKE-A-TEN STRATEGY 1
The Impact of Make-a-Ten Strategy on Student Addition Fact Fluency
Jennifer Van Wyk
Northwestern College Graduate Program

IMPACT OF MAKE-A-TEN STRATEGY 2
Abstract
The purpose of this action research project is to determine if the Make-a-Ten strategy has
a correlation to increased addition fact fluency. With small group interventions, which
included subitizing and number decomposition, students were exposed to various models
that showed how to make a ten with multiple numbers when adding them together. Data
was collected through pre and post assessments and measured quantitatively to compare
fluency scores. Student fluency interviews were also given to mark what level of fact
understanding they had. Analysis of the data collected suggests that making tens
increases student fluency and allows for more flexibility when adding numbers together.
Keywords: fluency, addition
IMPACT OF MAKE-A-TEN STRATEGY 3
The Impact of Make-a-Ten Strategy on Student Addition Fact Fluency
Math fact fluency plays an important role in how people function in society. The
ability to apply arithmetic skills such as counting, addition, and subtraction, has great
societal importance because of daily activities and employment that requires this kind of
knowledge (Mullis et al., 2001). Although it is an important skill, fact fluency can often
be difficult to define. Some believe that it can be defined as a combination of accuracy
and speed, which then characterizes competency when solving simple computation
problems in addition and subtraction (Binder, 1996; Poncy, Skinner, & O’Mara, 2006).
Others believe that it is “knowing how a number can be composed and decomposed and
using that information to be flexible and efficient with solving problems” (Parish, 2014,
p.159). The most comprehensive definition of fact fluency is when speed, accuracy, and
number flexibility aid in the computation of a basic math problem (Carpenter et al., 1999)
and therefore is the definition of fluency that is used throughout this research project.
Studies have found many benefits of math fact fluency. According to Binder
(1996), students who have good mathematical fluency find it easier to stay on task and
are not as easily distracted as their peers who have lower fluency. They are also able to
successfully apply their math skills to new mathematical content because of their number
flexibility. This is because different areas of the brain are utilized, which allows powerful
learning to take place (Park & Brannon, 2013).
Often people do not stop to think about the method used to acquire their math fact
fluency as a child, but there are various ways to develop this concept at an early age so
that fluency is obtained and retained. From drill and kill flashcards to number sense
exposure, educators utilize many strategies to improve fact fluency. Because of the
IMPACT OF MAKE-A-TEN STRATEGY 4
multiple strategies to increase fluency, many teachers have strong sentiments about what
is best for their students. Consequently, there has been recent debate over which
strategies are most effective, and therefore this debate poses the question of which
method works best when trying to increase fact fluency. The focus of this research is to
determine if the Make-a-Ten Strategy is an effective strategy for improving addition fact
fluency.
Literature Review
Various methods for increasing fact fluency have been studied and researched.
For a while, educators believed in the “passive storage view”, where children could store
the facts in their brain if they drilled and practiced them enough (Van de Walle et al.,
2006). Many schools felt that practice and repetition would increase addition and
subtraction fact fluency. This belief explains the development of timed tests, which were
very popular methods of assessing fact fluency.
However, recent studies have found two problems with timed tests. The first
problem is that they promote memorization instead of number sense. Studies have shown
that students who memorize facts lack the number sense to be able to manipulate
numbers, which makes them more prone to errors (Gray & Tall, 1994). The second
problem is that timed tests cause stress and anxiety. One study found that 1/3 of students
experience stress related to timed tests during the course of their academic career, and
some of these students were not even low achieving students (Boaler, 2015). Timed tests
not only stress students out, but that they block the working memory section of the brain,
hindering students from accessing what they already know in regards to math facts
(Beilock, 2011). This creates more anxiety because students question their math ability

IMPACT OF MAKE-A-TEN STRATEGY 5
and their mathematical confidence dwindles. Because of these recent findings, teachers
are looking to find strategies that replace drill and kill activities while still allowing
assessment to take place. This can be difficult when considering the speed element of fact
fluency.
Tondevold (2015) and Van de Walle (2006) suggest that students’ speed when
identifying math facts will increase if their number sense is broadened. Instead of giving
timed tests, it is suggested that teachers should focus on building a child’s number sense.
There are four relationships that build a child’s number sense—spatial relationships; one
and two more, one and two less; benchmarks of 5 and 10; and part-part-whole (Van de
Walle, 2006). Van de Walle stresses that the most important of these four is using
benchmarks of 5 and 10 because this allows children to build their knowledge of how to
utilize larger numbers.
One way to help students focus on making ten is to use a mathematical game
(Tondevold, 2015). In order for students to learn from games, the teacher must help the
student focus on number concepts and their relations so that they can make discoveries
about math. In a study completed to increase subtraction fact fluency in a single student,
Phillips (2003) utilized a warm-up game with dice, checked for automaticity, and utilized
numbers in context to help build number concepts by focusing on relations. These three
components were also included in this action research.
According to Phillips (2003), when students discuss what number concepts they
see during a game, they are able to clarify their thinking. This leads to increased
proficiency in number sense. By allowing students to experience a plethora of ways to

IMPACT OF MAKE-A-TEN STRATEGY 6
solve a problem and talk about their findings, students can figure out how numbers work,
which will help them gain understanding in computational fluency.
Another way to help students make tens is by breaking numbers apart, which
allows the child to use various ways to solve one problem (Isaacs & Carroll, 1999). It
helps them understand that a whole number can be broken into parts, which is the basic
concept of addition and subtraction. This especially helps with wholes of five and ten,
which are useful in addition and subtraction because many numbers can be related to
either five or ten. For example, seven is three less than ten, but it is two more than five.
Using the checkpoints of five and ten allow a child to make connections between
numbers, which can then transfer to other mathematical thinking.
As children begin their mathematical thinking, they utilize various computational
strategies. These strategies include direct modeling, counting, and relational thinking
(Carpenter et al., 1999). Direct modeling is when a child models the exact action of a
problem. This could include using fingers or a number line. If a child counts by ones, it is
likely that they do not know how to group numbers together, and therefore direct models
(Van de Walle, 2006). Direct modeling is the least sophisticated method of solving a
problem, and it typically suggests that the child needs additional support to move to the
next level of computational strategies.
Counting is when a child starts with a number and continues counting on. For
example, when solving 8 + 4, the child might think, “8…9, 10, 11, 12”. This process is
more complex than direct modeling because it requires the child to hold the place of a
number. However, it is still less sophisticated than relational thinking.

IMPACT OF MAKE-A-TEN STRATEGY 7
Relational thinking requires a solid grasp of number sense and is based on place
value. This is when a child learns number facts in relation to other numbers (Carpenter et
al., 1999). For example, when solving 8 + 5, the child might think that 5 is the same as 2
+ 3, add the 2 to the 8 to make 10, and have 3 leftover to equal 13. Information for this
kind of thinking is learned from connections that students make with various numbers.
This strategy is seen as the most sophisticated of the three, and the information gained by
using this strategy is stored in a different part of the brain than memorized facts (Levi &
Jaslow, 2015). Because of this, utilizing the Make-a-Ten Strategy (which is one form of
relational thinking) could be seen as a possible strategy to replace drill and kill activities,
which promote memorization.
Although research shows that making ten is a great strategy for establishing
number sense, the teacher researcher was unable to find research supporting the
development of increased computational fluency when utilizing the Make-a-Ten Strategy.
This led to the action research project, which focused on whether the Make-a-Ten
Strategy impacted fact fluency.
Method
Participants
This action research project was conducted in a second grade elementary
classroom with twenty-three students. A pretest was given to all of the students. Those
who scored 96% or greater on the pretest were then excluded from the study, as they
were already considered proficient and fluent in their addition math facts. Of the twenty-
three students in the class, five of them were proficient and therefore did not participate
IMPACT OF MAKE-A-TEN STRATEGY 8
in the study. The remaining eighteen students took part in the fluency intervention for
two weeks before taking the post assessment.
Of these eighteen students, eleven students are girls and seven are boys. One child
is on a math intervention plan within the classroom and receives additional help from a
paraprofessional during math time. Two students receive English language monitoring,
and one student is diagnosed with attention deficit hyperactivity disorder (ADHD). Three
students suffer from hearing loss and one student has impaired vision due to blindness in
one eye. The student demographics indicate an ethnically diverse classroom. Out of 18
students, eight students are Caucasian, six students are Hispanic, two students are
Hawaiian, one student is African American, and one student is Asian.
Procedure
The goal of this action research project was to determine if exposure to the Make-
a-Ten strategy could help improve addition fact fluency. Many methods were used to
collect data during the three-week study, including a pre-assessment, post-assessment,
and student interview.
To begin the research project, the teacher researcher administered the pre-
assessment to all 23 students in the second grade classroom. This pre-test consisted of
thirty basic addition facts that used numbers 0-11 (See Appendix A). These facts were
shown to students one by one on PowerPoint slides in a large group setting. As each fact
was displayed, the teacher researcher read the fact aloud to accommodate for the student
whose vision was impaired. An automatic timer was set for the PowerPoint slide to
change to the next problem after being displayed for three seconds on the board. This is
because the addition fact fluency proficiency rate in second grade is three seconds
IMPACT OF MAKE-A-TEN STRATEGY 9
(Carpenter et al., 1999). The students wrote their answer on a blank recording sheet,
which ensured that students could not look back at previous problems to solve.
After students completed the 30 addition facts, scores were totaled. Those who
scored 96% or greater were excluded from the study due to proficiency. The remaining
students then began a two-week intervention that focused on making tens and creating
number sense.
For five minutes each day, students began math time by pairing up to play a warm
up game. To play, they rolled a ten-sided die with numbers 0-9 and a second die with
sides marked +0, +1, and +2. Students took turns rolling the dice and adding the numbers
together. The student who said the answer first received one point. The first student to
reach ten points won the game.
After the five-minute warm up, students began small group intervention time
where the teacher researcher met with six students at a time for fifteen minutes each day.
This intervention lasted for twelve school days. During this time, students used various
manipulatives to practice making tens. For days one and two, the teacher researcher
utilized tens frames to focus on subitizing. The teacher researcher placed random chips
on a single tens frame and the students discussed what they saw and how they counted
the chips. After counting the chips, they analyzed and discussed what would need to be
added to get to the number ten. Students soon realized that they could count the empty
spaces much faster than the spaces with the chips on them.
For days three through five, students were given chips to place on their own
double tens frames in whatever order they wanted. They made observations about
patterns they saw within the tens frames without counting each individual piece.
IMPACT OF MAKE-A-TEN STRATEGY 10
Students moved chips around to show how to complete rows or make tens. Because
students used numbers through twenty, the number talks that took place were more
detailed than the first two days. Sample discussions included, “This top frame has 9
counters and the bottom has 6. If I move one of the counters from the bottom frame to the
top, it is 10 and 5. That’s a lot easier to count!” This activity introduced the concept of
making ten.
During days six through twelve, the teacher researcher focused on number
decomposition to make tens. This type of strategy allows students to build their number
sense instead of memorizing a fact (Tondevold, 2015). For example, when looking at the
problem 7 + 5, the number 5 could be broken into 3 + 2. Then the 3 could be added to the
7 to make 10. After that, students would add the 2 back on to get a sum of 12. The other
way to break 7 + 5 apart would be to separate the 7 into 5 + 2. Then add 5 + 5 to get 10
and add the 2 back on to equal 12. Each number sentence was broken apart in two
different ways to make tens. The students wrote down various ways that they saw to
break the numbers apart. They used number bonds when writing and explained the
process to peers within their group.
After the twelve intervention days, students took the post-assessment, which had
the same format, addition facts, and time requirements as the pre-assessment. At the end
of this post-assessment, the teacher researcher counted the number of correct facts
completed and compared the data to the pre-assessment.
The two days following the post-assessment were spent completing student
interviews. Students were asked to explain how they arrived at various answers for the
addition facts on the post-assessment. Their explanations were recorded on the Addition

IMPACT OF MAKE-A-TEN STRATEGY 11
Facts Assessment Teacher Note Taking Sheet (see Appendix B), and revealed whether
students were using direct modeling, counting, or relational thinking to answer the
addition facts (see Table 3).
Results
Data Analysis
There was a significant amount of researcher bias that took place while teaching
strategy lessons and implementing interventions during this research. Because of building
level goals, district professional development, and support from the district math
instructional coach, the researcher’s perception of the Make-a-Ten Strategy played a
significant role in the activities that were planned for small group intervention. The
researcher’s enthusiasm about this strategy could have potentially played a role in
increasing students’ enthusiasm toward the content, thus engaging them in various
activities and increasing their exposure to the strategy, making them feel more confident
while using it.
Although there was a high level of researcher bias during this action research
project, various data was collected to provide unbiased information, which would in turn
show an increase or decrease in student fact fluency. The combination of quantitative and
qualitative data made it possible to see if there was a correlation between the Make-a-Ten
Strategy and an increase in addition fact fluency.
Quantitative data analysis. The pre and posttests provided the quantitative data
needed for comparison of fact fluency at the end of the study. During both of these
assessments, students were given three seconds to answer an addition fact before the next
problem was revealed. They completed a total of 30 addition facts. At the end of this

IMPACT OF MAKE-A-TEN STRATEGY 12
assessment, students’ fluency percentage was tallied and compared to find a percentage
gain (see Table 1).
Table 1: Pre Test and Post Test Scores and Percentages that Show Growth
Student
Number
Pre Test
Score
Post Test
Score
Change in
Score
Pre Test
Percentage
Post Test
Percentage
Percentage
Gain
1 8 25 17 27% 83% 56%
2 12 28 16 40% 93% 53%
3 12 26 14 40% 87% 47%
4 14 22 8 47% 88% 41%
5 17 29 12 57% 97% 40%
6 18 28 10 60% 93% 33%
7 18 27 9 60% 90% 30%
8 20 29 9 67% 97% 30%
9 21 29 8 70% 97% 27%
10 18 25 7 60% 83% 23%
11 23 30 7 77% 100% 23%
12 25 29 4 83% 97% 14%
13 26 30 4 87% 100% 13%
14 26 30 4 87% 100% 13%
15 11 14 3 37% 46% 9%
16 27 29 2 90% 97% 7%
17 28 30 2 93% 100% 7%
18 28 29 1 93% 97% 4%
Mean: 19.55 27.16 7.61 65% 91% 26%
The Fact Fluency Pretest revealed that the class average score was 65%, which
was the equivalence of answering 19 out of 30 addition facts correctly within a three-
second time span for each question. This score indicates that students have had exposure
to basic addition facts, which could be the result of the action research starting half way
through the year in February. However, the class average score of 65% also indicates that
not all of the students in this research project were considered fluent at the time of the
pretest. This could be due to their fact speed, accuracy, flexibility, or a combination of
the three.

IMPACT OF MAKE-A-TEN STRATEGY 13
The fact fluency posttest shows that fluency growth occurred for each student,
indicating that the intervention helped improve fact fluency scores. The average
percentage of 65% in the pretest increased to 91% in the posttest, with a fact fluency gain
of 26%. It is important to note that six students had a score of twenty five points or
greater during the pretest, which means that these students could only improve by five or
less points before they had a perfect score on their posttest. This explains why these six
students appear to have made the least amount of growth when simply looking at
percentages. There was also one other student, Student 15, who only increased by three
points. The teacher researcher believes that this student is capable of greater growth.
However, his behavior hindered his posttest performance on the day that it was taken, and
results from this student fluctuate due to this student’s ADHD.
The results of this table show that nearly one third of the students tested in this
classroom improved their fluency score by at least ten points. It also shows that each
student’s fluency score was above 80% (with the exception of Student 15, for reasons
listed previously). This indicates that the Make-a-Tens Strategy is effective in helping
students improve their addition fact fluency.
Because the researcher wanted to find out more information, a deeper analysis of
each addition fact was conducted (see Table 2). This data provided insight into the facts
with which students were least and most fluent. It also enabled the teacher researcher to
focus on various facts that the Make-a-Ten Strategy could assist in answering, such as
problems with the numbers seven, eight, and nine. After the posttest was conducted, it
was evident that questions that leant themselves to the Make-a-Ten Strategy had
significantly improved.
IMPACT OF MAKE-A-TEN STRATEGY 14
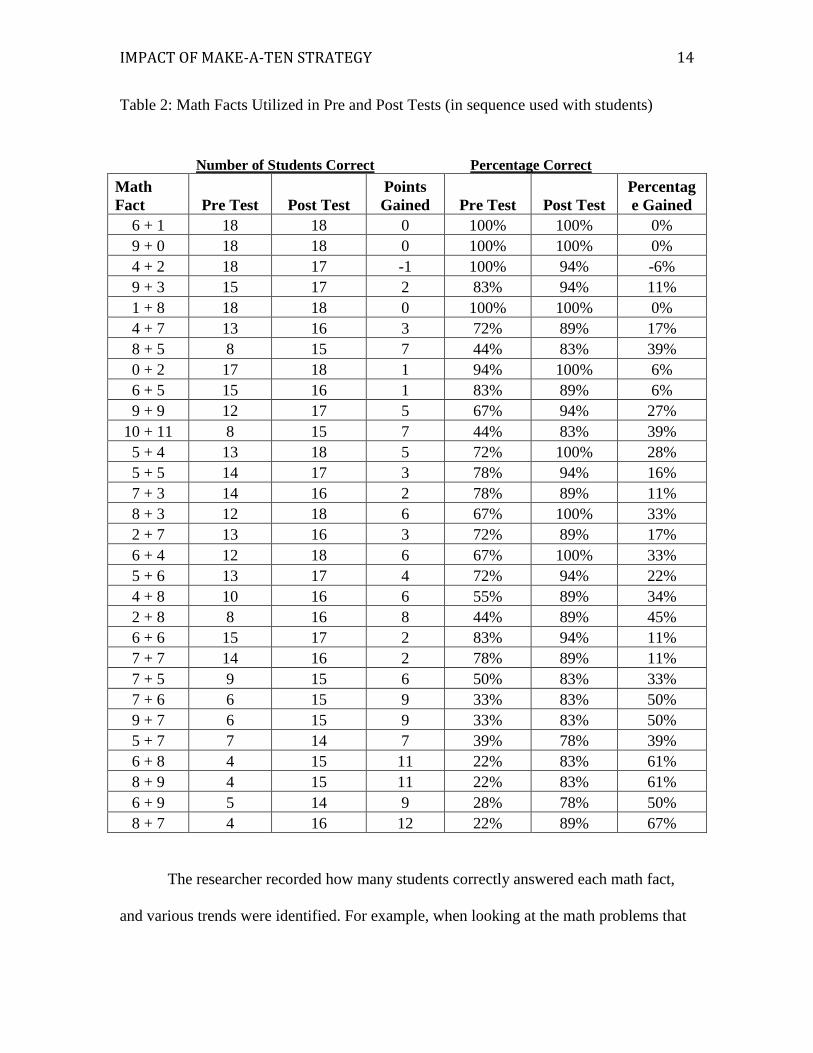
Table 2: Math Facts Utilized in Pre and Post Tests (in sequence used with students)
The researcher recorded how many students correctly answered each math fact,
and various trends were identified. For example, when looking at the math problems that
Number of Students Correct Percentage Correct
Math
Fact Pre Test Post Test
Points
Gained Pre Test Post Test
Percentag
e Gained
6 + 1 18 18 0 100% 100% 0%
9 + 0 18 18 0 100% 100% 0%
4 + 2 18 17 -1 100% 94% -6%
9 + 3 15 17 2 83% 94% 11%
1 + 8 18 18 0 100% 100% 0%
4 + 7 13 16 3 72% 89% 17%
8 + 5 8 15 7 44% 83% 39%
0 + 2 17 18 1 94% 100% 6%
6 + 5 15 16 1 83% 89% 6%
9 + 9 12 17 5 67% 94% 27%
10 + 11 8 15 7 44% 83% 39%
5 + 4 13 18 5 72% 100% 28%
5 + 5 14 17 3 78% 94% 16%
7 + 3 14 16 2 78% 89% 11%
8 + 3 12 18 6 67% 100% 33%
2 + 7 13 16 3 72% 89% 17%
6 + 4 12 18 6 67% 100% 33%
5 + 6 13 17 4 72% 94% 22%
4 + 8 10 16 6 55% 89% 34%
2 + 8 8 16 8 44% 89% 45%
6 + 6 15 17 2 83% 94% 11%
7 + 7 14 16 2 78% 89% 11%
7 + 5 9 15 6 50% 83% 33%
7 + 6 6 15 9 33% 83% 50%
9 + 7 6 15 9 33% 83% 50%
5 + 7 7 14 7 39% 78% 39%
6 + 8 4 15 11 22% 83% 61%
8 + 9 4 15 11 22% 83% 61%
6 + 9 5 14 9 28% 78% 50%
8 + 7 4 16 12 22% 89% 67%

IMPACT OF MAKE-A-TEN STRATEGY 15
had fifty percent of students or less correctly answered on the pretest, nine of the eleven
facts include the digit seven or eight in the number sentence. This indicates that math
facts with the numbers seven and eight are more challenging for students to complete
when they are paired with a higher number.
Another identified trend is that the percentage correct on the pretest is
significantly lower in the last six math facts than any of the other facts. This could be due
to various reasons such as numbers utilized within the math fact (all include a 7, 8, or 9)
or students’ frustration by the end of the assessment. The sequence of math facts was set
up to help students feel successful at the beginning of the assessment. The researcher
knew that with this particular group of students, success needed to be apparent from the
start so that students tried their best throughout the assessment. However, if this research
was conducted again, the teacher researcher acknowledges that it might be beneficial to
spread out the math facts so that higher numbers are scattered throughout the assessment.
Qualitative data analysis. A student interview was conducted after the posttest to
identify how students were solving the addition problems within the pre and post
assessment. The researcher stated the math fact and the student said the answer along
with an explanation of the answer. The researcher also recorded observations made
during this time (such as whether students used fingers to solve the problem or if they
counted aloud). Then the teacher researcher recorded how each student solved their
problem, identified what CGI computational strategy students used most, and placed the
student in that category according to their computational strategy. The three
computational strategies include direct modeling, counting, and relational thinking. If the
student used two computational strategies evenly, both were marked (see Table 3).
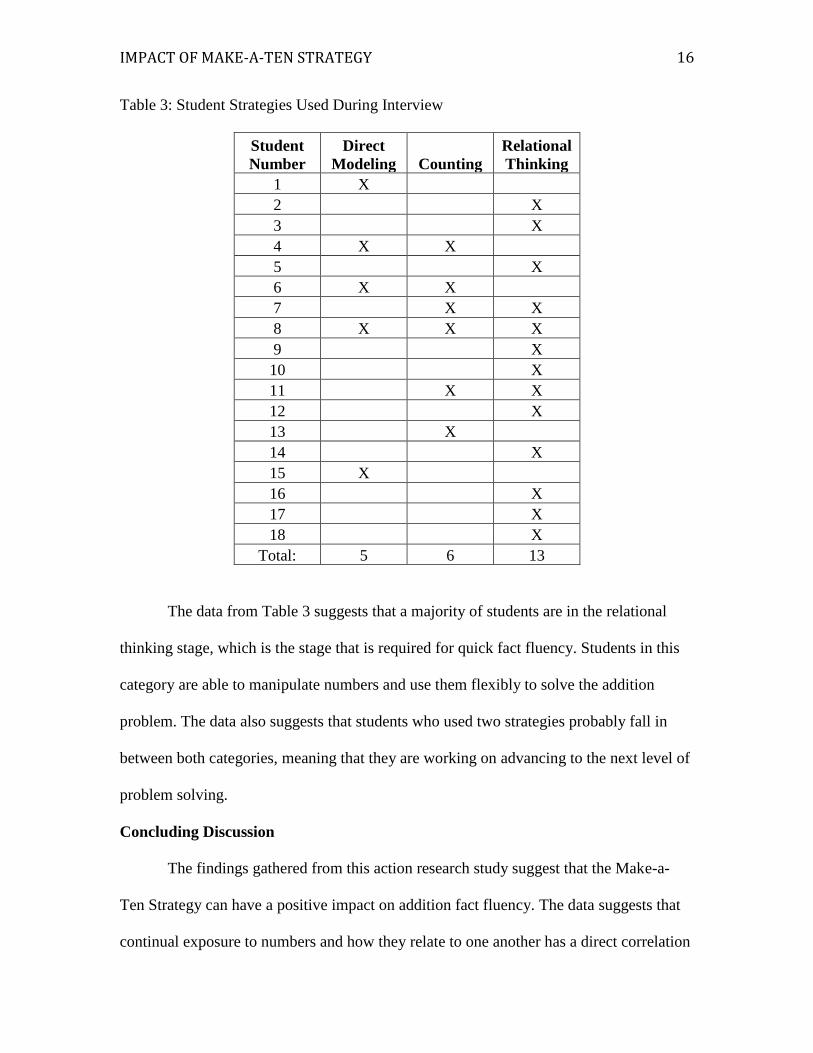
IMPACT OF MAKE-A-TEN STRATEGY 16
Table 3: Student Strategies Used During Interview
Student
Number
Direct
Modeling Counting
Relational
Thinking
1 X
2
X
3
X
4 X X
5
X
6 X X
7
X X
8 X X X
9
X
10
X
11
X X
12
X
13
X
14
X
15 X
16
X
17
X
18
X
Total: 5 6 13
The data from Table 3 suggests that a majority of students are in the relational
thinking stage, which is the stage that is required for quick fact fluency. Students in this
category are able to manipulate numbers and use them flexibly to solve the addition
problem. The data also suggests that students who used two strategies probably fall in
between both categories, meaning that they are working on advancing to the next level of
problem solving.
Concluding Discussion
The findings gathered from this action research study suggest that the Make-a-
Ten Strategy can have a positive impact on addition fact fluency. The data suggests that
continual exposure to numbers and how they relate to one another has a direct correlation
IMPACT OF MAKE-A-TEN STRATEGY 17
to students’ fact fluency. Both quantitative and qualitative data suggest that this is
especially true when working on making tens with students.
Because fluency incorporates not only speed, but accuracy and flexibility as well,
it is suggested that the Make-a-Ten Strategy helps to improve fact flexibility. When
students decompose numbers and put them back together in a different manner, they are
manipulating numbers in a way that helps them to quickly identify the sum of a basic
number problem. This flexibility allows them to build strong number sense so that the
facts are not simply memorized from drill and kill. Instead, the numbers have become
part of their knowledge base due to multiple exposures to number sense activities. This
includes the Make-a-Ten Strategy, which seems to increase addition fact fluency.
IMPACT OF MAKE-A-TEN STRATEGY 18
References
Beilock, S. (2011). Choke: What the secrets of the brain reveal about getting it
right when you have to. New York: Free Press.
Binder, C. (1996). Behavioral fluency: Evolution of a new paradigm. The Behavioral
Analyst, 19, 163–197.
Boaler, J. (2015). Mathematical mindsets: Unleashing students’ potential
through creative math, inspiring messages and innovative teaching. San
Francisco, CA: Jossey-Bass.
Carpenter, T.P., Fennema, E., Loef Franke, M., Levi, L., & Empson, S.B. (1999).
Children's mathematics: Cognitively guided instruction. Portsmouth,
NH: Heinemann.
Gray, E., & Tall, D. (1994). Duality, Ambiguity, and Flexibility: A “Proceptual” View of
Simple Arithmetic. Journal for Research in Mathematics Education, 25(2),
116-140.
Isaacs, A. C., & Carroll, W. M. (1999). Strategies for basic-facts instruction. Teaching
Children Mathematics, 5(9), 508. Retrieved from
https://ezproxy.nwciowa.edu/login?url=https://search.proquest.com/docvi
ew/214138663?accountid=28306
Levi & Jaslow. (2015). CGI Number facts strategy assessment
Mullis, I.V., Martin, M.O., Gonzalez, E.J., O’Connor, K.M., Chrostowski, S.J.,
Gregory, K.D.,…Smith, T.A. (2001). Mathematics benchmarking report. TIMSS
1999-Eight grade: Achievement for U.S. states and districts in an international

IMPACT OF MAKE-A-TEN STRATEGY 19
context. Chestnut Hill, MA: Boston College. Retrieved from
https://timss.bc.edu/timss1999b/pdf/TB99_Math_contents.pdf
Parish, S. (2014). Number talks: Helping children build mental math and
computation strategies, grades K-5, updated with common core
connections. Math Solutions.
Park, J., & Brannon, E. M. (2013). Training the approximate number system
improves math proficiency. Psychological Science, 0956797613482944
Phillips, L. J. (2003). When flash cards are not enough. Teaching Children
Mathematics, 9(6), 358-363. Retrieved from
https://ezproxy.nwciowa.edu/login?url=https://search.proquest.com/docvi
ew/214134171?accountid=28306
Poncy, B.C., Skinner, C.H., & O’Mara, T. (2006). Detect, practice, and repair: The
effects of a classwide intervention on elementary students’ math-fact fluency.
Journal of Evidence Based Practices for Schools, 7 (1), 47-68.
Tondevold, C. (2015). 4 Relationships that will increase your students’ number
sense. Orofino, ID: Mathematically Minded, LLC.
Van de Walle, J. A. (2006). Teaching student-centered mathematics: Developmentally
appropriate instruction for grades Pre-K-2. Boston, MA: Pearson Education
Inc.
IMPACT OF MAKE-A-TEN STRATEGY 20
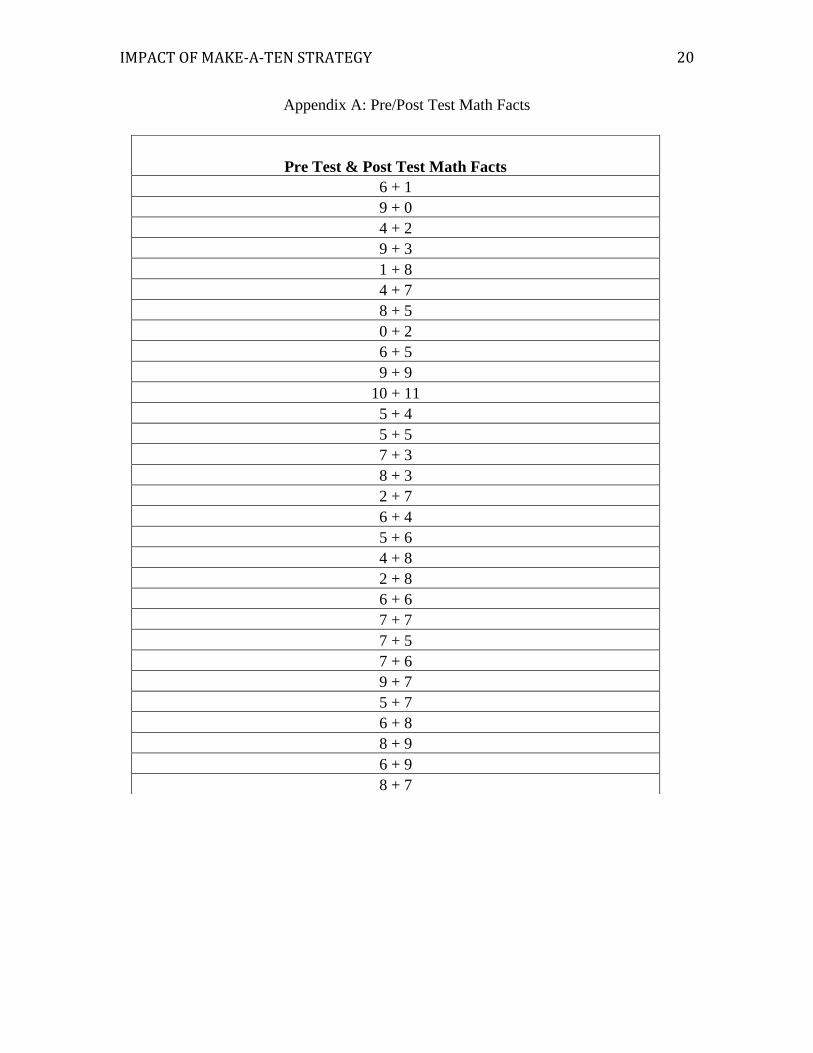
Appendix A: Pre/Post Test Math Facts
Pre Test & Post Test Math Facts
6 + 1
9 + 0
4 + 2
9 + 3
1 + 8
4 + 7
8 + 5
0 + 2
6 + 5
9 + 9
10 + 11
5 + 4
5 + 5
7 + 3
8 + 3
2 + 7
6 + 4
5 + 6
4 + 8
2 + 8
6 + 6
7 + 7
7 + 5
7 + 6
9 + 7
5 + 7
6 + 8
8 + 9
6 + 9
8 + 7
IMPACT OF MAKE-A-TEN STRATEGY 21
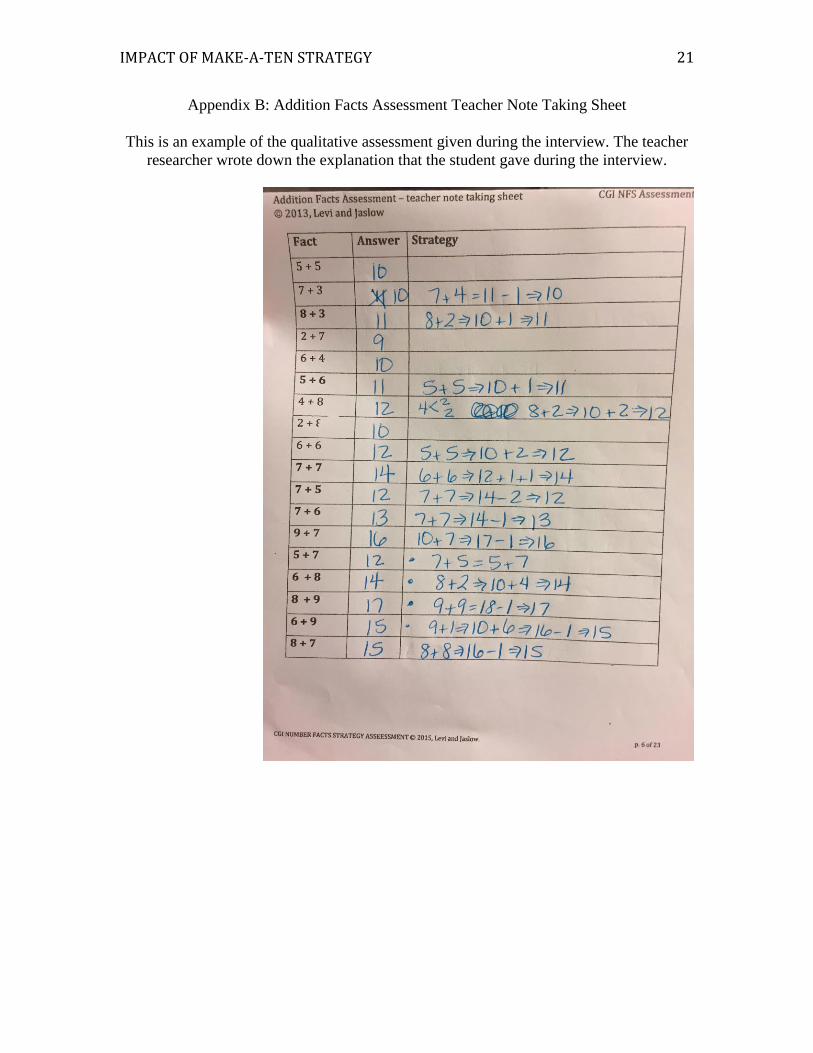
Appendix B: Addition Facts Assessment Teacher Note Taking Sheet
This is an example of the qualitative assessment given during the interview. The teacher
researcher wrote down the explanation that the student gave during the interview.