the impact of location on firm productivity in moroccan manufacturing fraser thompson (oxford...
TRANSCRIPT

THE IMPACT OF LOCATION ON FIRM PRODUCTIVITY IN
MOROCCAN MANUFACTURING
Fraser Thompson (Oxford University) and Taye Mengistae (World Bank)

THE BIG QUESTION
Explaining the regional variation in economic performance across the globe.

WHAT ARE THE ALTERNATIVE EXPLANATIONS?
1. Natural geography • Time-invariant effects of the local environment on firm performance
(e.g. a region’s proneness to drought, transport costs, etc)• McNeill (1991); Diamond (1997); Gallup Sachs & Mellinger (2000).
2. Agglomeration Externalities• The benefits that firms extract from the local industrial structure,
thought of in terms of the levels of competition, specialization and industrial diversity.
• Jacobs (1969)
3. Institutions • The accumulated effect of the local business environment on firm
performance, including regulation, infrastructure and the provision of key inputs (e.g. finance, skilled labour)
• North, Summerhill & Weingast (2000); Knack & Keefer (1995); Hall & Jones (1999)

WEAKNESSES WITH THE EXISTING EMPIRICAL EVIDENCE?
1. Measurement error in evaluating institutional quality• Overly qualitative• Overly broad (e.g. index of anti-diversion policies)• Lack of policy implications
2. Small sample size leading to non-robust results• Lack of sufficient countries to pool in sample leads to a small number
of observations and non-robust results.• Furthermore, country-level aggregation can obscure important firm-
level effects (Manski, 1995).
3. Lack of sub-national focus• Using national-level data assumes that these location factors are
constant within countries, which seems unlikely.

OUR FOCUS
Using Moroccan firm-level data, we identify and estimate the influences of geography, agglomeration externalities and institutions on firm productivity.

OUR CONTRIBUTION
1. More refined measures of institutions and agglomeration externalities
2. First simultaneous test of their respective influences on firm productivity
3. Policy-relevant evidence for a country at a critical juncture (e.g. Association Agreement with the EU and FTA with US)
4. Improvements to existing empirical methodology– Productivity Estimates– Location Endogeneity

TWO SOURCES OF DATA
1. Census of Manufacturers (1994-2001)– Contains the following data: sales, production, export,
investment, sector, number of permanent and temporary workers, year of establishment, legal status and location.
2. Investment Climate Assessment (2003)– Detailed business environment information for firms in six
locations: Grand Casablanca; Tanger-Tetouan; Rabat; Fes; Settat; and Nador.
– Only available for 2003, but we assume that the investment climate is fixed in the short-term (2001-2003).

AGGLOMERATION EXTERNALITIES

THREE THEORIES EXIST FOR HOW INDUSTRIAL STRUCTURE AFFECTS FIRM PERFORMANCE
MAR PORTER JACOBS
Specialisation + + -
Diversity - - +
Competition - + +

AGGLOMERATION EXTERNALITY VARIABLES
1. Total workers in location-sector (specialisation)
2. Total workers in location (diversity)
3. Diversity HHI using sector employment shares
4. Number of firms in the location-sector
5. Firm Market Share
6. Competition HHI
istn ist
nt
ist
Q
QC
2
2 1
ists it
ist
it
L
LD
2
1

GEOGRAPHY

GEOGRAPHY
Province-level dummy variables 66 provinces in entire country We have investment climate data for 21
provinces

INSTITUTIONS

4 CRITERIA FOR SELECTING INSTITUTIONAL VARIABLES
1. Important Constraints on Firm Performance
2. Exhibit Regional Variation
3. Not vague or imprecise
4. Capture all aspects of the investment climate
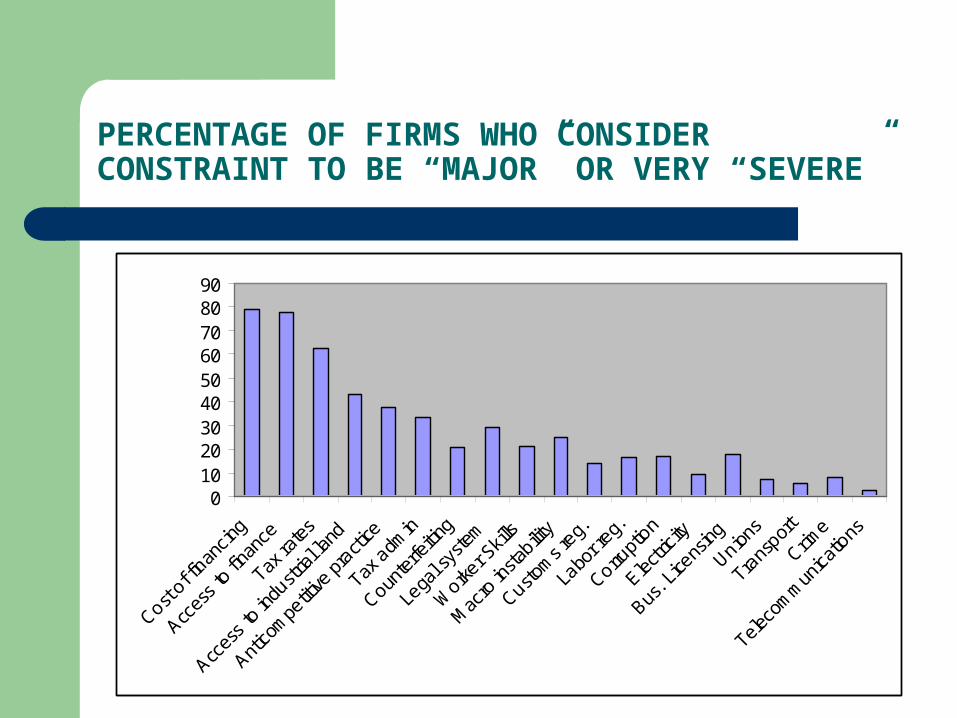
PERCENTAGE OF FIRMS WHO CONSIDER CONSTRAINT TO BE “MAJOR” OR VERY “SEVERE”
0102030405060708090
Cost of f
inancin
g
Acces
s to
finan
ce
Tax ra
tes
Acces
s to
industr
ial la
nd
Antico
mpe
titive
pra
ctice
Tax a
dmin
Counte
rfeitin
g
Lega
l sys
tem
Worke
r Skil
ls
Mac
ro in
stabilit
y
Custom
s reg.
Labo
r reg.
Corrupti
on
Electri
city
Bus. L
icens
ing
Unions
Trans
port
Crime
Teleco
mm
unica
tions

INSTITUTIONAL VARIABLES
“Perception” Measures
1. Electricity2. Telecommunications3. Transport4. Corruption5. Tax Administration6. Skill Shortages7. Legal System8. Access to Credit
“Quantitative” Measures
1. Financial Delay (months)2. Construction Permit Delay
(days)3. Time per week dealing with
bureaucracy (%)4. Generator (1 if yes)5. Discount on total sales from
transport delays (%)6. Delay in filling technical
vacancy (days)7. Workforce with less than
primary education (%)

REGIONAL VARIATION IN “PERCEPTION” INDICATORS
Region Electricity Telecomm-unications
Transport CorruptionTax
Administration Skill
Shortages Legal System
Access to Credit
Ben Slimane 1.75 2.03 1.67 1.21 1.27 1.55 1.21 3.03Berkane 1.00 1.00 1.00 3.00 1.00 1.00 1.00 5.00Casablanca 1.61 1.35 1.67 1.95 2.82 2.40 2.51 4.07Fes 2.05 1.31 1.81 2.95 2.59 2.58 2.88 3.96Jrada 1.00 1.00 4.00 3.00 1.00 1.00 2.00 1.00Khemisset 1.83 1.17 2.17 1.51 1.51 2.42 2.08 4.17Larache 1.00 1.00 1.00 1.00 1.48 2.68 1.00 3.68Mediouna 2.00 1.95 1.50 1.32 2.03 1.47 2.13 3.34Mohammedia 1.61 1.70 1.75 2.05 3.01 1.88 2.84 3.12Nador 2.16 1.00 2.28 1.72 2.80 1.89 1.77 3.47Nouaceur 1.88 1.30 1.88 1.48 2.09 2.09 2.73 3.64Oujda-Angad 1.34 1.24 2.57 2.74 3.01 2.56 3.76 3.14Rabat 1.28 1.05 1.19 2.09 3.28 2.43 3.56 3.14Sale 1.72 1.17 1.82 3.06 3.61 2.62 2.74 4.21Sefrou 1.00 1.00 1.00 2.00 1.00 1.00 1.00 4.00Settat 1.17 1.07 1.27 1.51 1.69 2.44 2.99 3.47Skhirate-Temara 2.46 1.95 1.50 1.49 3.26 2.45 2.72 4.21Tanger-Assilah 2.66 1.91 2.03 1.79 3.37 2.46 2.32 4.29Taourirt 4.00 1.00 4.00 2.00 4.00 1.00 5.00 5.00Tetouan 1.52 1.35 1.91 2.45 3.16 3.25 3.14 2.95Moulay Yacoub 1.00 1.00 2.00 3.00 3.00 1.00 5.00 1.00Source: Moroccan Investment Climate Assessment (World Bank). Perception Indices are constructed such that: 1 - no constraint; 2 - minorconstraint; 3 - medium constraint; 4 - major constraint; 5 - very severe constraint.

REGIONAL VARIATION IN “HARD” INDICATORS
RegionFinancial Delay
(months)
Construction Permit Delay
(days)
Time Per Week Dealing with
Bureaucracy (%)
Generator (dummy = 1 if
have generator)
Discount on Sales from
Transport Delays (%)
Delay in filling Technical
Vacancy (weeks)
Workforce with less than primary
educ. (%)
Ben Slimane 2 20.47 3.05% 0.00 0.00% 1.22 21.04%Berkane 2 90 10.00% 0.00 0.00% 53 73.00%Casablanca 1.8 38.59 7.28% 0.16 0.23% 3.27 26.04%Fes 2.38 51.94 35.57% 0.15 0.37% 4.93 52.35%Khemisset 3 16.19 8.53% 0.83 7.50% 4.67 40.42%Larache 3 25.72 1.00% 0.00 0.00% 6 73.17%Mediouna 1.29 51.7 6.88% 0.00 0.00% 2.31 24.95%Mohammedia 1.79 37.82 12.96% 0.27 0.08% 3.22 35.00%Nador 2.54 48.93 13.79% 0.35 0.03% 10.37 20.27%Nouaceur 1.35 30.38 0.70% 0.05 0.00% 5.41 17.96%Oujda-Angad 0.87 33.12 15.58% 0.26 0.53% 5.3 19.60%Rabat 1.49 37.6 16.13% 0.14 0.00% 1.89 50.12%Sale 2.93 35.8 26.65% 0.04 1.11% 2.28 59.71%Settat 1 24.88 0.80% 0.37 0.00% 7.11 22.93%Skhirate-Temara 2.91 33.13 16.63% 0.40 0.00% 3.26 22.57%Tanger-Assilah 2.75 43.3 3.75% 0.17 1.11% 5.94 75.35%Taourirt 3 30 30.00% 1.00 2.00% 5 10.00%Tetouan 1.1 30.59 0.89% 0.17 1.86% 2.16 49.64%Source: Moroccan Investment Climate Assessment (World Bank)
ENSURING CONSISTENT ESTIMATES FOR INVESTMENT CLIMATE VARIABLES
This analysis assumes that the investment climate indicators are exogenous determinants of firm performance.
However, the performance of firms may actually influence their investment climate constraints.
E.G. High-performing firms (possibly engaged in a leading technology field) are more likely to experience difficulties in finding suitably qualified employees.
Solution: use averages of the investment climate data across firms in a given location-sector.
This reverse-causality is likely to be mitigated to the extent that individual firm performance is unable to influence regional averages of these investment climate indicators.
Not only does this ease the endogeneity problem, it also substantially increases the sample size by including firms which do not have investment climate information, but which are located in the same location-sector for firms which we do have information available.
SECTOR TFP ESTIMATES
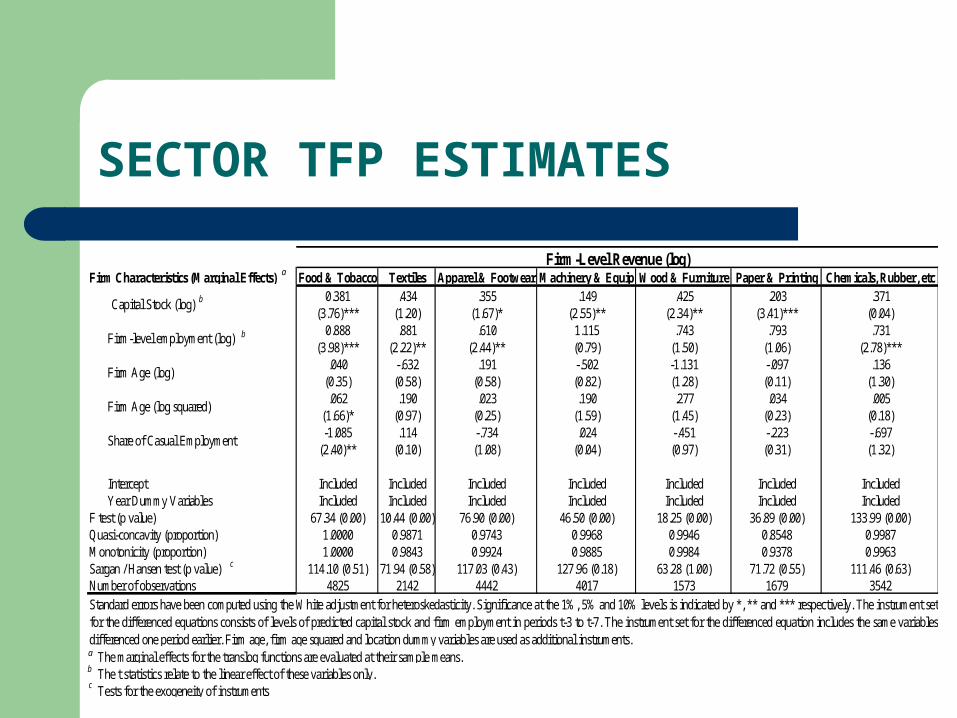
Firm Characteristics (Marginal Effects) Food & Tobacco Textiles Apparel & Footwear Machinery & Equip Wood & Furniture Paper & Printing Chemicals, Rubber, etc0.381 .434 .355 .149 .425 .203 .371
(3.76)*** (1.20) (1.67)* (2.55)** (2.34)** (3.41)*** (0.04)0.888 .881 .610 1.115 .743 .793 .731
(3.98)*** (2.22)** (2.44)** (0.79) (1.50) (1.06) (2.78)***.040 -.632 .191 -.502 -1.131 -.097 .136
(0.35) (0.58) (0.58) (0.82) (1.28) (0.11) (1.30).062 .190 .023 .190 .277 .034 .005
(1.66)* (0.97) (0.25) (1.59) (1.45) (0.23) (0.18)-1.085 .114 -.734 .024 -.451 -.223 -.697
(2.40)** (0.10) (1.08) (0.04) (0.97) (0.31) (1.32)
Intercept Included Included Included Included Included Included IncludedYear Dummy Variables Included Included Included Included Included Included Included
F test (p value) 67.34 (0.00) 10.44 (0.00) 76.90 (0.00) 46.50 (0.00) 18.25 (0.00) 36.89 (0.00) 133.99 (0.00)Quasi-concavity (proportion) 1.0000 0.9871 0.9743 0.9968 0.9946 0.8548 0.9987Monotonicity (proportion) 1.0000 0.9843 0.9924 0.9885 0.9984 0.9378 0.9963Sargan / Hansen test (p value) 114.10 (0.51) 71.94 (0.58) 117.03 (0.43) 127.96 (0.18) 63.28 (1.00) 71.72 (0.55) 111.46 (0.63)Number of observations 4825 2142 4442 4017 1573 1679 3542
Tests for the exogeneity of instruments
Firm-Level Revenue (log)
Capital Stock (log)
Firm-level employment (log)
Firm Age (log)
Firm Age (log squared)
Share of Casual Employment
Standard errors have been computed using the White adjustment for heteroskedasticity. Significance at the 1%, 5% and 10% levels is indicated by *, ** and *** respectively. The instrument setfor the differenced equations consists of levels of predicted capital stock and firm employment in periods t-3 to t-7. The instrument set for the differenced equation includes the same variablesdifferenced one period earlier. Firm age, firm age squared and location dummy variables are used as additional instruments. The marginal effects for the translog functions are evaluated at their sample means. The t statistics relate to the linear effect of these variables only.
a
a
b
b
b
c
c

SIGNIFICANT VARIABLES (“PERCEPTION” INDICATORS)
Location Fixed Effects: 1. Positive: Mohammedia; Nador; Nouaceur; Rabat; Settat;
Skhirate-Temara.2. Negative: Khemisset; Moulay Jacoub.
Agglomeration Externalities: 1. Positive: Market Share and Number of Firms in Location-Sector
Business Environment:1. Positive: Electricity (endogenous???)2. Negative: Telecommunications; Tax Administration; Legal
System; Access to Credit.

SIGNIFICANT VARIABLES (“QUANTITATIVE INDICATORS”)
Location Fixed Effects: 1. Positive: Fes; Mohammedia; Nador; Sale; Skhirate-Temara;
Tanger-Assilah.2. Negative: Ben Slimane;
Agglomeration Externalities: 1. Positive: Market Share and Number of Firms in Location-Sector
Business Environment:1. Negative: Financial Delay; Construction Permit; Time Per Week;
Discount on Sales from Transport Delays; Delay in filling technical vacancies; Workforce with less than primary education.

OTHER RESULTS
The location effects appear generally more cogent for limited liability firms than for corporations.
The effect of the local business environment also appears to be generally stronger for non-exporters compared to exporters. However technical skill vacancies appear particularly crippling for exporters, which is possibly reflective of the higher skill demands of exporters.

LOCATION EFFECTS ON TFP (FOOD, TOBACCO & BEVERAGES)
-40.00%
-30.00%
-20.00%
-10.00%
0.00%
10.00%
20.00%
Location
% o
f T
ota
l Re
gio
na
l TF
P E
xp
lain
ed
Agglomeration Externalities
Location Fixed Effect
Business Environment
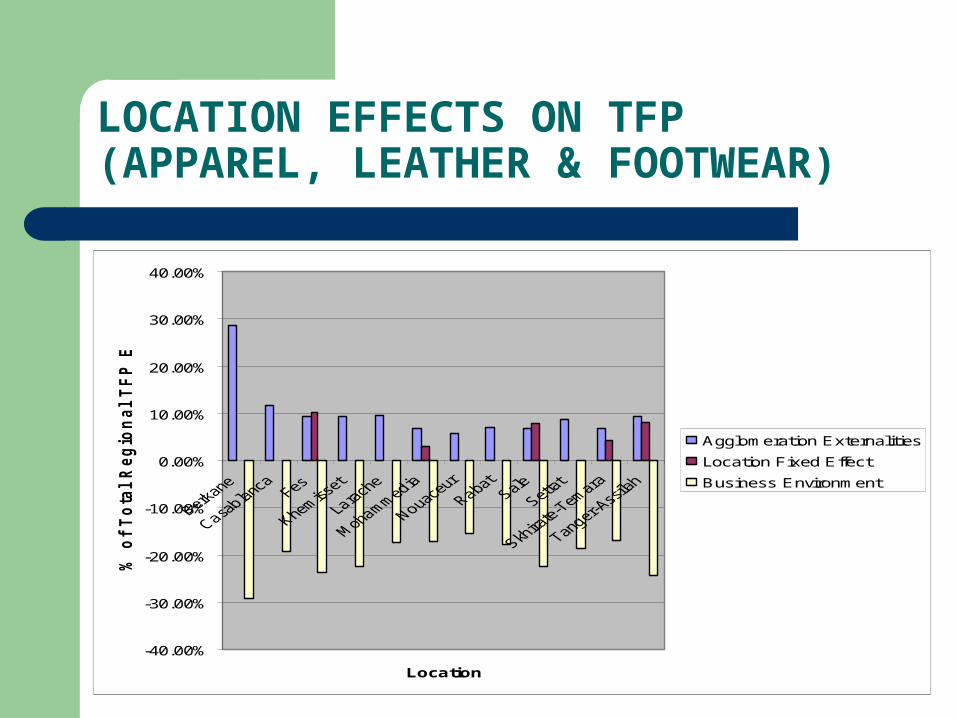
LOCATION EFFECTS ON TFP (APPAREL, LEATHER & FOOTWEAR)
-40.00%
-30.00%
-20.00%
-10.00%
0.00%
10.00%
20.00%
30.00%
40.00%
Location
% o
f T
ota
l R
eg
ion
al
TF
P E
xp
lain
ed
Agglomeration Externalities
Location Fixed Effect
Business Environment

LOCATION EFFECTS ON TFP (CHEMICALS, RUBBER & PLASTICS)
-35.00%
-30.00%
-25.00%
-20.00%
-15.00%
-10.00%
-5.00%
0.00%
5.00%
10.00%
15.00%
Location
% o
f T
ota
l R
eg
ion
al
TF
P E
xp
lain
ed
Agglomeration Externalities
Location Fixed Effect
Business Environment
CONCLUSION / POLICY IMPLICATIONS
The paper supports many previous arguments of the predominant importance of institutions and business environment constraints over other location effects in influencing firm performance.
If the location fixed effects can be considered the relative intransient impacts on firm productivity, then the small size of these effects compared to those arising from the business environment suggest that historical obstacles can be overcome through appropriate policy responses.