the impact of incentives for the recruitment · pdf filethe impact of incentives for the...
TRANSCRIPT

THE IMPACT OF INCENTIVES FOR THE RECRUITMENT
AND RETENTION OF QUALIFIED TEACHERS IN NAMIBIA’S
REMOTE SCHOOLS
10 September 2014

1
T h is r e p o r t s u m m a r i s e s t h e f in d in g s o f a s t u d y c o m m is s i o n e d b y t h e M in is t r y o f E d u c a t io n , A r t s a n d
Cu l t u r e in N a m ib ia in p a r t n e r s h ip w it h U N I CE F . T h e s t u d y w a s c a r r ie d o u t b y t h e U n i v e r s i t y o f
S t e l le n b o s c h a n d R e s e a r c h o n S o c i o - E c o n o m ic P o l i c y .

2
THE IMPACT OF INCENTIVES FOR THE
RECRUITMENT AND RETENTION OF QUALIFIED
TEACHERS IN NAMIBIA’S REMOTE SCHOOLS
CONTENTS
EXECUTIVE SUMMARY…………………………………………………………………………………………………………..2.
1 INTRODUCTION AND BACKGROUND…………………………………………………………………..6
2 INCENTIVES FOR RURAL TEACHERS IN OTHER AFRICAN COUNTRIES………………….9
3 QUANTITATIVE ANALYSIS………………………………………………………………………………….15
4 THE PERFORMANCE OF PUPILS ACROSS LOCATION TYPES………………………………..16
5 DISTRIBUTION AND QUALIFICATIONS OF TEACHERS…………………………………………30
6 QUALITATIVE ANALYSIS: EVIDENCE FROM THE FIELD……………………………………….33
7 CONCLUSIONS AND RECOMMENDATIONS……………………………………………………….40
REFERENCES……………………………………………………………………………………………………………………….45
Appendix 1: Quality of Namibian education data………………………………………………………………..45
Appendix 2: Classification criteria……………………………………………………………………………………….52
Appendix 3: Consent form………………………………………………………………………………………………….53
Appendix 4a: Questionnaire for teachers who teach in remote areas…………………………………55
Appendix 4b: Questionnaire for teachers who do not teach in remote areas……………………..58
Appendix 4c: Questionnaire for principals and officials………………………………………………………62

3
THE IMPACT OF INCENTIVES FOR THE
RECRUITMENT AND RETENTION OF QUALIFIED
TEACHERS IN NAMIBIA’S REMOTE SCHOOLS
EXECUTIVE SUMMARY
Background
Namibia is a large country with the world’s second lowest population density. Thus there are many remote schools. Literature from other African countries illustrates that it is difficult to attract qualified teachers to teach in remote schools
In 2009 the MoE introduced a financial incentive scheme aimed at attracting and retaining qualified teachers in remote schools. Such incentives are widely used in countries in the region.
The incentive entails monthly payments to qualified teachers (those with post-graduate teacher qualifications, i.e. either a post-graduate teacher degree or a post-graduate teacher diploma) in remote schools. Remote schools are classified into three categories: schools where teachers face the greatest hardship because of remoteness (category 1 schools), schools with moderate hardship (category 2 schools) and schools still considered remote but facing less hardship (category 3 schools). Non-remote schools, i.e. schools where the incentive does not apply, will be referred to as category 4 schools. Classification criteria relate largely to distance from main centres, quality of roads and transport, availability of amenities (shops, social/recreational facilities) and of electricity, water, health facilities, telecommunications and postal services.
The monthly incentive is N$1 750 (US$164) in category 1 schools, N$1 250 (US$117) in category 2 schools, and N$750 (US$70) in category 3 schools. Incentives range between about 5 and 12% of salaries of new appointees with the appropriate post-graduate teacher qualifications, who earn about N$170 000 (almost US$16 000) per year. Spending on teacher incentives is N$47 million (US$4.4 million), only about 0.9% of budgeted teacher personnel spending. Inflation has eroded the real value of incentives by about 30% since they were introduced in 2009.
Summary of findings
Most teachers, including those who do not benefit from incentives, and the teacher union NANTU, accept the principle of incentives for teachers in remote schools.
There is some dissatisfaction with the classification of remote schools into hardship categories.
School enrolment and promotion rates are not improving in either remote schools or in the Namibian education system as a whole.
Drop-out is extremely high from the junior secondary phase, especially in categories 1 and 2.
Examination performance in remote primary schools is extremely weak and not improving.
Remote schools do better in secondary examinations, as weaker students have dropped out.
A relatively high proportion of qualified teachers are employed in schools in remote areas, as was the case even before the incentive system was introduced in 2009.
In all location categories, pupil-teacher ratios have declined while the share of teachers with post-graduate teacher qualifications has been rising. Thus the main intention of the incentives (to recruit and retain qualified teachers in remote schools) has been achieved. The incentives were at least a contributing factor.

4
Despite more qualified teachers, remote schools have not improved earning outcomes, e.g. retaining children to higher grades and improving performance in school examinations.
Housing and living conditions, or the ‘lived experience’, of teachers in remote schools are greatly important to them, and they feel strongly that these conditions should be improved.
Limitations of the study
Little is still known about the filling of vacancies and the movement of teachers within the school system. Vacancy records are not consistent across regions or not always systematic. Data is largely kept in silos within the MoE. There is no consistent use of identification numbers of schools, examination centres, pay points and teachers, and no information to ease the linking of data. This needs immediate attention and could greatly strengthen the use of data for decision making.
Overall conclusions
Impact and effectiveness of incentives: The evidence cannot conclusively show that the incentives caused the improved distribution of qualified teachers, but it suggests they had an impact. However, there is little evidence learning in remote areas has improved. If effectiveness is measured with regard to teacher distribution, the incentives were probably effective, but if effectiveness is measured by learner outcomes, then they were not.
Efficiency of incentives: If incentives did indeed contribute to the improved distribution of qualified teachers across locational categories, they must have been quite efficient given their extraordinarily low cost – only 0.9% of teacher personnel spending.
Relevance of the incentives: The incentives are clearly relevant, as such incentives are widely used in African countries. On the other hand, the initial situation with regard to qualified teachers in remote schools was not as bad as in many other countries. A further indication of the relevance of the incentives is that they have given rural teachers recognition and acknowledged their contribution in a way that goes beyond simply offering financial rewards.
Sustainability of the incentives: The relatively small fiscal costs of the incentives make them quite affordable within budgetary constraints. Even a substantial increase in the incentive would be fiscally sustainable, given that its small size means that it can be diverted from general salary increases for teachers and other education personnel without having too large an effect.
Recommendations
Incentives
The system of financial incentives for qualified teachers in remote schools should be retained in its current format. Appointments through decentralised applications for particular vacancies should remain the mainstay of the recruitment system, rather than centralised deployment. When vacancies are advertised, the financial incentive level should be clearly indicated.
The criteria for classification of schools into incentive categories should be retained, with opportunity for regular updating. Schools or teachers should be able to appeal every two years if they feel aggrieved that strict application of these criteria does not acknowledge their hardship. A systematic appeals process would ensure that individual grievances are all treated equally and transparently. Every six years, the whole classification should be reviewed.
Incentive values should be increased substantially, considering the real hardship many remote teachers face, and as incentives are low compared to teacher salaries and have been eroded by inflation. Moreover, teachers in remote areas often forego the benefit of housing allowances or

5
subsidies, are not fully compensated through travel allowances for their much higher travelling costs, and cannot fully use their medical insurance benefits.
Incentives in category 1 schools should increase most, as acknowledgement of their extreme circumstances. It is recommended that incentive values be increased to N$3000 (US$282) per month in category 1 schools, N$2 000 (US$188) in category 2 schools and N$1 200 (US$113) in category 3 schools. This would raise the cost of incentive from N$47 to N$77 million (US$7.2 million). This places a small additional burden on the education budget, raising incentive costs to less than 1½ of teacher personnel costs. This may further improve teacher allocation, signal to teachers in remote schools their contribution is valued, and be a sign to parents in such areas that the education of their children is a concern for the government. Incentive values should also be adjusted annually with inflation.
Considering the MoE’s intention to grow mainly the qualified part of its teacher corps, it is not recommended that financial incentives be extended to non-qualified teachers.
Part of student loans to student teachers should be converted into a bursary if they commit to initially teaching in remote schools. By requiring them to apply for vacancies in remote schools, teacher choice would remain, yet this would allow the MoE to channel teachers to priority areas.
Teacher housing
Providing more and better housing for qualified teachers in remote schools should be prioritised within fiscal and practical constraints. The priority in housing spending should clearly be on housing qualified teachers willing to teach in remote schools. In the current budget, N$113 million is already set aside for teacher housing.
Assuming housing is needed for half of category 1 teachers at an average unit cost of N$0.5 million (the high cost is to provide water), the cost of providing would be only N$200 million (US$18.8 million). Thus it is possible to provide all category 1 teachers with housing within 5 years by spending about N$40 million (US$3.8 million) per year on their housing, not even half the money currently budgeted for teacher housing.
Once all qualified category 1 teachers have housing, category 2 and then category 3 schools should receive priority. As more qualified teachers start to teach in remote schools, more houses may be required. The most remote schools should always receive priority.
Even providing solar electricity would already be a great improvement for many teachers.
Pupil outcomes
The extremely weak performance in remote schools is a cause for great concern and requires far greater attention to education quality in such schools.
Children in remote areas should be encouraged to continue to higher grades by providing classes and teachers for such grades, offering financial support (bursaries and hostel accommodation) to those who need to move to other schools, and strengthening the feeder schools system.
Conditions in schools
The MoE should increase efforts at dealing with the extraordinarily poor conditions for pupils and teachers in remote schools by improving infrastructure and maintenance of facilities.
Better information on conditions of school facilities and maintenance should be systematically gathered and used in prioritisation. Questions on quality of facilities could be included in EMIS, but a School Register of Needs may also be needed where someone external to the school assesses conditions of facilities across schools.
More attention is also needed to quality of hostels, both in remote and in non-remote areas.

6
Data and human resource tracking
Data integration across data sources is essential to utilise available data better. This requires unique identifiers for schools and teachers, and links between such identifiers. A small MoE task team on data integration and use of data for decision making should be set up at the highest level to ensure coordination of such an effort across different divisions that produce data.
Consistently used unique identifiers would make it possible to track teachers across the system, allowing information on where qualified teachers teach, what grades and subjects they teach, and how many of them leave the system. This is essential for proper human resource planning.

7
1 INTRODUCTION AND BACKGROUND
Namibian educational quality
Educational quality in Namibia is still relatively weak. In the 2007 SACMEQ assessments, conducted in
15 countries of the South and Eastern African region at a Grade 6 level, Namibia performed better
than in 2001 yet still not very satisfactorily. Importantly, performance varied greatly across geographic
space, with schools self-identified as being located in isolated rural regions performing almost half a
standard deviation below the SACMEQ average1 in mathematics and almost as much in reading, which
converts into the equivalent of more than a full year’s learning backlog. Difference at a regional level
are even larger, e.g. when one compares Khomas, where the capital is located, and some northern
regions. Namibia is a very large country and the second least densely populated country in the world,
thus there are many remote schools far away from population centres.
Table 1: Mathematics and Reading scores in SACMEQ III, 2007
Mathematics score Reading score
Isolated/Rural areas 448 464 Small towns 492 524 Cities 521 572
TOTAL NAMIBIA 471 497
Caprivi 459 490
Erongo 524 579
Hardap 483 510
Karas 511 550
Kavango 456 482
Khomas 523 575
Kunene 479 503
Ohangwena 448 463
Omaheke 469 496
Omusati 450 462
Oshana 457 471
Otjozondjupa 489 527
Oshikotu 475 501
Source: Own calculations from SACMEQ data
Socio-economic status and home background factors clearly also play a role in the weak performance,
but it is likely that teacher quality is a critical factor. Historically in Namibia the majority of unqualified
teachers have been employed in rural schools, creating a learning deficit there which is further
compounded by high rates of teacher turnover. The scarcity of skilled teachers in rural schools is the
result of various factors, including Namibia’s geography, the limited pool of skilled teachers and
teacher preferences for an urban location. Internationally, qualified people usually prefer an urban
location and this is also the case in Namibia. In SACMEQ in 2007, 40% of grade 6 children in cities were
1 The SACMEQ means was set at 500 and the standard deviation at 100 for the 2001 test

8
taught by a language teacher with a degree, as against only about half as many (20%) in isolated rural
areas and 25% in small towns.
Namibia is a large and sparsely populated country. Schools are often geographically widely dispersed.
This influences the school type, distribution and location of schools and questions about boarding and
day schools. The low levels of educational attainment in rural areas are confirmed by constituency-
level maps of educational attainment of the age group 20-24.
The financial incentive scheme
In response to these challenges, the MoE introduced a financial incentive scheme aimed at attracting
and retaining qualified teachers in remote/rural schools and so improving learning outcomes. Such
incentives are widely used in countries in the region, as will be discussed later, and in neighbouring
Botswana rural teachers also receive housing benefits. The incentive was implemented since 2009 to
attract and retain qualified teachers in schools in such remote and rural areas. It was agreed at the
time of its introduction that after a few years the incentive a critical review should be carried out into
the effectiveness of the scheme and in particular the performance of pupils in those schools assisted
by such incentives.
The incentive entails monthly payments to qualified teachers (those with post-graduate teacher
qualifications, i.e. either a post-graduate teacher degree or a post-graduate teacher diploma) in
remote schools. Remote schools are classified into three categories: schools where teachers are
considered to face the greatest hardship because of remoteness (category 1 schools), schools with
moderate hardship (category 2 schools) and schools still considered remote but facing less hardship
(category 3 schools). Non-remote schools, i.e. schools where the incentive does not apply, will be
referred to in this report as category 4 schools. Appendix 2 contains details about the classification
criteria. These relate largely to issues such as the distances from main centres, quality of roads and
transport, availability of amenities (shops, social/recreational facilities) and of electricity, water,
health facilities, telecommunications and postal services./
The monthly incentive is set at N$1 750 (US$164) in category 1 schools, N$1 250 (US$117) in category
2 schools, and N$750 (US$70) in category 3 schools.2 As new appointees with the appropriate post-
graduate teacher qualifications earn about N$170 000 (almost US$16 000) per year, incentives thus
range between about 5 and 12% of such salaries. The total value of the incentives is not particularly
large, at about N$47 million (US$4.4 million) in 2012; it is only about 0.9% of the personnel budget for
teachers for 2014/5. The value of the incentive has been eroded by inflation, as it has not been raised
since its introduction in 2009, while consumer prices have risen by about 30% over the five years since
the incentive was introduced.
2 Calculated at the current rate, US$=N$10.65

9
This study
This report responds to the need for an assessment of the incentive system and was commissioned by
the Namibian Ministry of Education with UNICEF providing technical and financial support. The study
entailed a literature review of the available evidence on such incentives in other African countries
(Section 2), an analysis of EMIS and examination data to determine whether these has been
improvement in the availability of qualified teachers in remote areas of Namibia and in student
outcomes in such areas since the introduction of such incentives (Sections 3 to 5), and qualitative
fieldwork (mainly interviews and school visits) in six regions to get a better perspective of the views
of teachers on the incentive scheme (Section 6). Finally, the report ends with a summary of findings,
overall conclusions and recommendations (Section 7). In addition, an analysis was carried out of the
quality of the EMIS and related data used in this report. This is documented in Appendix 1 that also
contains some recommendations on how to make the excellent EMIS data more useful for
management decision making.
Limited time was available for this project, due amongst other things to the need to carry out the field
work before the end of the second term. This time frame also informed the scope of the work
undertaken. Within the available six weeks and given what data was likely to be available, a pragmatic
approach was adopted to answer the main research questions relating to the effectiveness of the
incentives, their efficiency, relevance, impact and sustainability.
The study would not have been possible without the enthusiastic support of officials in the Ministry
of Education. This applies particularly to members of the technical team of the Task Force tasked with
investigating the incentive scheme (some of whom joined the fieldworkers visiting the six regions), to
officials in the regional offices, and to many officials in the MoE national office who made available
data and information to the research team. The team’s thanks are also due to the teachers, principals
and officials who gave of their time and in many cases went to considerable trouble to make it possible
to conduct most of the interviews in the regional MoE headquarters. Moreover, the study team
received great support from UNICEF and its officials. The team also benefited from discussion with
leading members of NANTU, the Namibian National Teachers Union.

10
2 INCENTIVES FOR RURAL TEACHERS IN OTHER AFRICAN
COUNTRIES
Introduction
In order to evaluate the effectiveness of the incentive scheme, a literature review was conducted to
compare the Namibian incentive scheme to similar incentives in other education ministries of the
region. Unfortunately, only limited information on such schemes was documented outside of
government documents of the countries concerned that were not readily available, yet it was possible
to obtain a few studies of such schemes and earlier meta-analyses. These form the basis for this
section of the report.
Many sub-Saharan African (SSA) countries have seen large increases in spending on education over
recent decades with several (including Namibia) committing more than a fifth of their national budgets
to education expenditure3. Funding, though, is but one among myriad challenges facing education
systems in SSA countries and it is understood that higher spending does not necessarily guarantee
improved learning outcomes in a linear fashion (Glewwe et al., 2014). Ensuring that more spending
results in better scholastic outcomes requires an understanding of the particular mechanisms and
incentive structures that constrain learning. One area that plainly requires focused attention in SSA
countries is the resourcing and staffing of rural schools.
In SSA and South Asian countries, challenges to adequate quality education are particularly acute in
rural regions. Some of the challenges emanate from the demand side. Parents of rural children, for
instance, tend to have lower levels of education, and may place a lower valuation on the returns to
education than their urban counterparts. Consequently, primary school enrolment in rural regions is
typically lower than enrolment in the urban centres (Mulkeen and Chen, 2008: 10). Stark rural-urban
inequalities in the supply of education services are also evident, documented for instance by Bennel
and Akyeampong (2007) and Adedeji and Olaniyan (2011). This shows the various ways in which rural-
urban educational disparities manifest: teacher qualifications differ significantly between rural and
urban schools (Bennell and Akyeampong, 2007: 18); pupil/teacher ratios tend to be higher in rural
areas (Bennell, 2004: 5); and younger teachers tend to be posted in rural areas while older, more
experienced teachers tend to be concentrated in urban schools (Bennell and Akyeampong, 2007: 18).
These findings suggest a preference among teachers in developing countries for urban posts, a
phenomenon that exacerbates the challenge of delivering quality education to all children. Given that
most of the SSA population resides in rural areas4, policy interventions that incentivise teachers to
take up rural posts warrant consideration.
Despite its importance, research into the particular problem of teacher supply in rural areas remains
sparse. A few research projects document the state of rural education in SSA and suggest policies for
improving outcomes. This section summarises the available evidence on the poor distribution of
teachers in rural regions of SSA countries and the underlying incentives from which rural-urban
3 See the World Bank Data webpage: http://data.worldbank.org/indicator/SE.XPD.TOTL.GB.ZS. 4 Adedeji and Olaniyan (2011) suggest that in 2008, the rural population in SSA countries made up more than
65% of the the sub-continent’s total population.
11
imbalances result. Some of the more important findings emerging from the existing literature include
the need for stronger incentives to motivate teachers in rural areas
Rural-urban differences in teacher characteristics and education supply
Rural-urban differences in teacher characteristics are pervasive in many SSA countries. Simply
attracting qualified teachers to rural areas or retaining them there appears to be especially difficult
for most countries. Bennel (2004: 16) reports that in Namibia, for instance, only 40% of teachers in
rural schools are ‘suitably qualified’, in contrast to 92% of teachers based in Windhoek. Mulkeen and
Chen (2008) find that four of the five SSA countries considered in their study exhibit significant rural-
urban differences in teacher qualifications5. Urwick, Mapuru and Nkhoboti (2005: 53) report that in
2004 more than half of teachers posted in the rural mountainous areas of Lesotho were unqualified
whereas only 29% of urban based teachers were unqualified. Of the six SSA countries studied by
Bennell and Akyeampong (2007: 47), five have considerable proportions of unqualified primary school
teachers in rural districts6. In the most extreme case in their report, 89% of rural based teachers in
Zambia are unqualified while only 9% of urban based teachers are unqualified.
The age profile of teachers also differs across rural and urban schools with younger, less experienced
teachers being more likely to be employed in rural schools. Surveying a sample of Sierra Leone schools,
Harding and Mansaray (2006) find an average age of teachers in rural schools of 34 while the average
age in urban schools is 42. Similar teacher age profiles are reported elsewhere (Bennell and
Akyeampong, 2007: 18)7. In countries where teacher deployment is highly centralised, newly trained
teachers tend to be posted to rural areas.
A gender disparity across rural-urban schools is also evident in many SSA countries. Women less
commonly occupy rural teaching posts, and reveal a strong preference for urban postings. Malawi
exhibits this phenomenon starkly, as 82% of urban teachers were female in 2005 while women
occupied only 31% of rural teaching posts ((Mulkeen and Chen, 2008: 12). In Zambia, the ratio of
female to male teachers is reported to equal two in urban centres but only one-half in rural districts
((Bennell and Akyeampong, 2007: 48). Often the gender disparity emerges from social and cultural
norms that discourage single women especially from undertaking influential or authoritative roles in
society. Such cultural norms are typically enforced more strongly in rural areas, making female
teachers reluctant to accept rural postings. Moreover, in some remote areas safety too is an important
concern among single female teachers.
Finally, a rural-urban divergence in teacher motivation is also evident among SSA countries. From a
survey of teachers in Sierra Leone, Harding and Mansaray (2006: 9) find that “only 10 per cent of
5 Included in the study are Lesotho, Mozambique, Tanzania, Malawi and Uganda – Malawi is the outlier in this
instance (Mulkeen & Chen, 2008, p. 12) 6 Included in their report are Ghana, Lesotho, Malawi, Sierra Leone, Tanzania and Zambia – Malawi, again, is the
single country that has a very high proportion of unqualified teachers in both rural and urban areas (Bennell &
Akyeampong, 2007, p. 47). 7 Bennel and Akyeampong (2008) do, however, indicate that in Tanzania, younger teachers are concentrated in
urban areas as they tend to be more qualified.

12
teacher respondents agreed with the general statement that ‘teachers at this school are well
motivated’ compared to 85 per cent among urban teachers”. Their data also suggests that levels of
qualification and motivation are positively correlated among teachers in rural areas. Bennell and
Akyeampong (2007) find mixed results. Some countries surveyed in their study show that rural
teachers are more likely to be demotivated than urban teachers, while other countries reflect the
opposite pattern. These authors suggest that teachers who are posted in their places of origin are
more likely to report higher levels of job satisfaction as opposed to teachers who are employed there
as ‘outsiders’. They argue that an important factor explaining this is that locally born teachers will have
easier access to land and other support networks that may take a long time for non-locals to develop.
The factors above all indicate a clear preference among teachers for urban postings and is clearly
revealed by chronic vacancies in rural schools while qualified teachers living in urban areas are often
unemployed (Mulkeen and Chen, 2008: 11). As a result, children in rural schools often have teachers
who are on average less qualified and less experienced and display lower levels of motivation than
their urban counterparts. The rural aversion among teachers arises for many reasons. Remote areas
offer fewer amenities or opportunities for cultural activities and social engagement that are typically
desired by professionals. Poor infrastructure and housing, inadequate school resources and poor
public service provision often also make rural postings undesirable to qualified teachers (Mulkeen et
al., 2007). Teachers may also view such postings as inhibiting their professional development and
career advancement (Adedeji and Olaniyan, 2011: 58), as they may feel isolated from the larger
hierarchy of educational services structures and administrative bodies. Overcoming these and other
disincentives to a balanced distribution of teachers across urban and rural schools requires a strategy
that targets the specific issues making rural teacher posts undesirable.
Appointment strategies in SSA countries
Ensuring a supply of suitably qualified and motivated teachers to rural areas is a pressing concern for
SSA countries. Sometimes the problem lies in not having enough teachers to distribute across the
system, though often the greater problem lies with the distribution of teachers. Teacher preferences
for living and working in urban areas make teacher appointments complex. Countries typically have
either a highly centralised system of allocation, often referred to as ‘deployment’, or a relatively
decentralised (school and individual level) system. In some countries certain regions, especially urban
areas, produce more teachers than are locally required. This is the case in Mozambique, for instance,
where a disproportionate number of teachers are trained in Maputo (Mulkeen and Chen, 2008: 16).
Teachers there are allocated posts within a given province upon qualification, making it a centralised
deployment system. However, teachers do have the option of refusing the allocation should it not
meet their preferences and may choose to remain unemployed until an urban post becomes vacant,
instead of taking up a rural assignment.
In Malawi, where the rural-urban gender balance is particularly acute, teachers are typically deployed
according to the staffing needs of schools in various districts. Female teachers, however, have the
option of refusing a deployment – or requesting a transfer – based on marital status and location of
their husband. Many teachers are transferred from rural to urban schools where no vacancy is present
in order to accommodate the provision for co-location of married couples (Mulkeen and Chen 2008:
17). Other, sometimes illegitimate, means are also sometimes exercised by teachers wanting to

13
escape a rural deployment. These two examples highlight the fact the while centralised deployment
mechanisms may be designed to promote fairness and allocative efficiency, they are in practice easily
circumvented and do not necessarily yield the targeted outcomes. In extreme cases, gross
inefficiencies are evident in the administration process where outright corruption and the ‘sale’ of
posts become an option in countries where employment outside of government is scarce and anti-
corruption measures are weak.
Lesotho employs a different strategy to both Mozambique and Malawi. Vacancies are assigned to
schools by the education ministry based on a needs assessment. Schools then advertise the post and
select a teacher from among the applicants. This decentralised means of appointment implies that
schools are not assigned teachers who are potentially unwilling to be there but rather are able to
select from a pool of suitably qualified candidates who wish to teach there. There is, however, the
possibility that such appointment processes can then become open to abuse by powerful local
individuals or groups. Mulkeen and Chen (2008: 16) claim, for example, that instances have occurred
where applications by qualified teachers were rejected by a school because the community wanted
to hire a local (unqualified) person. Also, the localised process of teacher allocation sometimes results
in opportunistic volunteering at schools by unemployed people who have hopes of applying for a
vacant post when one eventually comes about. Urwick, Mapuru and Nkhoboti (2005: 60) claim that
the system has therefore exacerbated differences in rural-urban teacher qualifications. A further
implication of a decentralised ‘market’ allocation mechanism for teacher appointments is that the
more highly sought after posts, which are usually urban, will be occupied by the most qualified and
talented teachers.
One factor among SSA countries that potentially strengthens the case for decentralisation of
deployment (and other functions) is administrative incapacity at various levels of government.
Dysfunctional administration often demotivates rural teachers, as they are affected more severely by
administrative bottlenecks or outright neglect– than their urban counterparts. A decentralised system
may facilitate more swift action relating to local administrative matters such as promotions, payments,
transfers, disciplinary measures etc., as well as teacher complaints and concerns (Mulkeen et al., 2007:
20).
Motivating teachers to accept rural postings through incentives
It is increasingly recognised that the concerns relating to rural posts are substantive and need to be
mitigated through targeted incentives to meet the challenge of providing quality education to rural
children. These incentives could take the form of monetary compensation, an improved working
environment or other non-pecuniary incentives such as credible opportunities for career
development.
Monetary and other material incentives
It is commonly claimed that teachers occupy a lower professional status and lower remuneration than
similarly educated professionals. Monetary incentives are often seen as the primary instrument for
incentivising teachers to teach in rural areas, but can be expensive in developing countries, where
teacher salaries already make up a large share of official budgets. Several countries have undertaken

14
such incentives strategies. Lesotho introduced an incentive scheme that provides a ‘hardship
allowance’ equivalent to 10% of the average monthly salary per month for qualified teachers.
Mozambique offers a bonus equal to 100% of a month’s salary to teachers relocating to rural schools.
The incentive targets only qualified teachers, who make up a minority of primary school teachers, thus
most teachers are therefore immediately excluded from receipt of the incentive. Incentives must be
substantial to make an impact and that in both the above examples they are likely to have only a small
effect on rural employment of quality teachers (Mulkeen and Chen, 2008: 23). Further complications
arise in both instances above. In the case of Lesotho, the classification of remote schools relates to
the mountainous areas specifically, meaning low-lying remote areas do not benefit from the incentive
regardless of being in a rural region. Mozambique on the other hand also provides a bonus incentive
to teachers for teaching a double shift, a practice which is significantly more common in urban areas
than in rural areas. This latter bonus amounts to 60% of salaries and reduces the appeal of the rural
school incentive bonus (Mulkeen and Chen, 2008: 23).
Housing has been found to be a key consideration among teachers employed at rural schools. In
Malawi “a strong correlation between housing and the presence of female teachers” is observed
(Mulkeen and Chen, 2008: 21). In remote areas, traveling to and from schools is usually difficult and
time consuming. Given the generally poor infrastructure inherent to rural areas, finding suitable
housing may present a barrier to considering a rural teaching post. The provision of housing is,
however, a particularly costly intervention that is likely to be infeasible for many SSA countries, and
simply providing a housing subsidy may not suffice where housing infrastructure is absent.
Non-pecuniary measures
The conditions faced by teachers in rural school affects the quality of teaching they are able to deliver.
In addition to lacking basic school resources, they are also more likely to obtain fewer support services
than urban-based teachers. Rural school are less likely to be visited by external officials and are also
less inclined to come under pressure from local communities where parents do not value education
as much as urban professionals. The lack of monitoring in rural schools may also contribute to poor
teacher performance and absenteeism (Mulkeen and Chen, 2008: 23). Enhancing education
departments’ capacity for monitoring may therefore present an inexpensive means for improving
outcomes in rural schools.
Opportunities for further training too are often less for rural based teachers. Some have suggested
that special allowances be made for highly qualified teachers willing to work in rural areas for a fixed
period and that these monetary incentives further be complemented with career development
opportunities such as in-service training (Urwick, Mapuru and Nkhoboti, 2005: 63). A multipronged
strategy, combining monetary incentives with the prospect for career development, may be an
effective means of attracting and retaining qualified teachers but may be costly to implement.
The recruitment of locals to fill rural teacher vacancies is still another cost effective measure
considered in the literature. Adedeji and Olaniyan (2011) suggest the use of a target recruitment policy
as a means to attract motivated teachers to the rural schools. Underpinning this suggestion is the idea
that teachers practicing in their local communities will find it significantly easier to overcome some of
the issues that non-locals find difficult to endure. Principally, housing will be less problematic for a

15
teacher who is also a local resident. Family and kinship networks, furthermore, would already be
established and it would likely be easier to gain the respect and trust of the local community from
where a teacher originated. Naturally, teachers from all backgrounds are subject to the allure of urban
lifestyles and many may not be easily motivated to return to their rural beginnings if expectations of
upward social mobility were important in their choice of a teaching career. It is, however, usually
easier to incentivise someone with a rural background to teach in a rural school than would be the
case for an urban born teacher.

16
3 QUANTITATIVE ANALYSIS
Statistics about pupils, teachers, and examination results were crucial to obtain a systematic
understanding of the impact of the financial incentives. The initial fear was that such data may not be
of good enough quality to undertake the necessary analysis, as it was not certain what data would be
available and what its quality and mutual compatibility would be. Fortunately, this fear was
unfounded: The data obtained from EMIS was of an extremely high quality. Data quality is analysed in
Appendix 1, where some suggestions are also made about improving the linking and utilisation of this
good quality data for management decision making.
The excellent quality of the data made a difference-in-difference approach possible, whereby changes
in for instance the numbers of qualified teachers in remote and non-remote can be compared across
time to determine whether there has been an improvement since the financial incentives have been
introduced. Thus, the difference in remote schools between 2013 and 2009 will be compared with the
difference in other schools over the same period. If the difference in remote schools is larger, this will
indicate progress. Similar analyses can be done for progressions of learners to higher grades, or for
performance in examinations.
It is important to note, however, that an improvement in the geographic location of teachers does not
necessarily indicate that this is the result of the incentives; other factors could also have played a role.
Furthermore, an improvement in the distribution of teachers need not necessarily improve
educational performance.
In the quantitative analysis contained in the next two sections, data relating to enrolment and
examination results (i.e. pupil outcomes) is analysed in Section 4. Apart from providing a context to
evaluate the performance of the Namibian school system, it also helps to determine whether the gap
in performance in learner outcomes between remote and non-remote areas has been narrowing. This
will be followed by a similar analysis of the availability and qualifications of teachers relative to
enrolment (Section 5), to see whether this differed between those schools qualifying for the incentives
and those schools that did not. Beyond the quantitative analysis, an analysis of the information
obtained from interviews will make it possible to determine how the incentives are evaluated by
teachers themselves, and what factors may play a role in the effectiveness or ineffectiveness of this
instrument of education policy.

17
4 THE PERFORMANCE OF PUPILS ACROSS LOCATION TYPES
Introduction
An analysis of the Namibian EMIS data shows these to be of very good quality, in terms of
completeness and consistency. This data has not yet received the attention that it warrants, as this
could act as a very strong tool for decision making. The analysis here is confined to those parts of the
EMIS data supplemented by census data that could inform the issue investigated here, namely the
differences across the four school location categories identified for the incentives. The first part of the
analysis considers the overall patterns of enrolment, repetition and drop-out, without distinguishing
between different locational categories, which are considered in a subsequent sub-section. Only
thereafter does the analysis turn to examination results.
Patterns of enrolment, repetition and drop-out
The first part of the analysis considers the overall patterns of enrolment, repetition and drop-out,
without distinguishing between different locational categories. Figure 1 shows the pattern of
enrolment for 2012 and shows that there are more female pupils in the system up to Grade 5, but due
to different drop-out rates and repetition rates the situation changes after grade 5, with more male
pupils in the system. The figure clearly shows that there is very high drop-out after Grade 9. The
greater number of pupils in grade 5 and grade 8 than in the preceding grades is the result of a high
repeater rate in these grades, with many pupils from successive birth cohorts ending up here in the
same grades.
Figure 2 shows the same trends, but using enrolment from the five years, 2008 to 2012. This is useful
to confirm that the latest enrolment patterns are in fact part of a pattern that reflects past decisions
on school access and enrolment, pass rates, drop-out and repetition, and completion of Grade 12.
Patterns appear to be quite stable, implying that there is no great trend for enhanced enrolment at
higher grades.
Figure 1: Enrolment by grade and gender in 2012
18
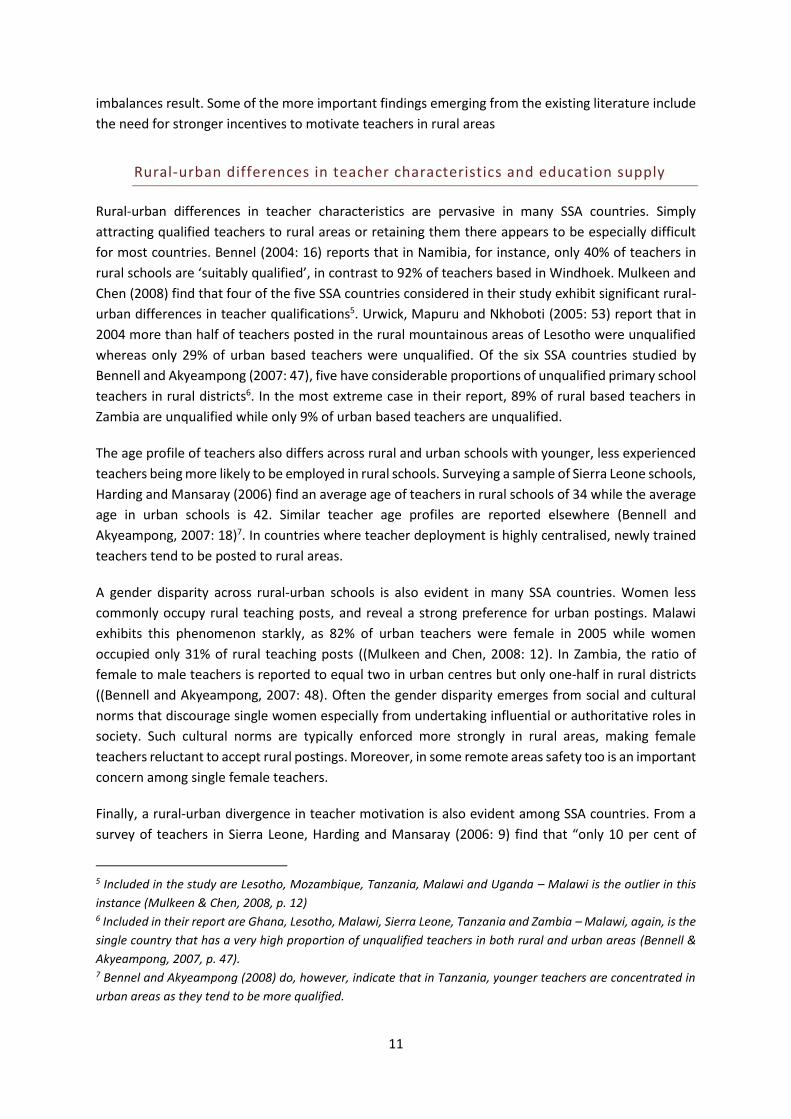
Figure 2: Enrolment patterns by grade and year
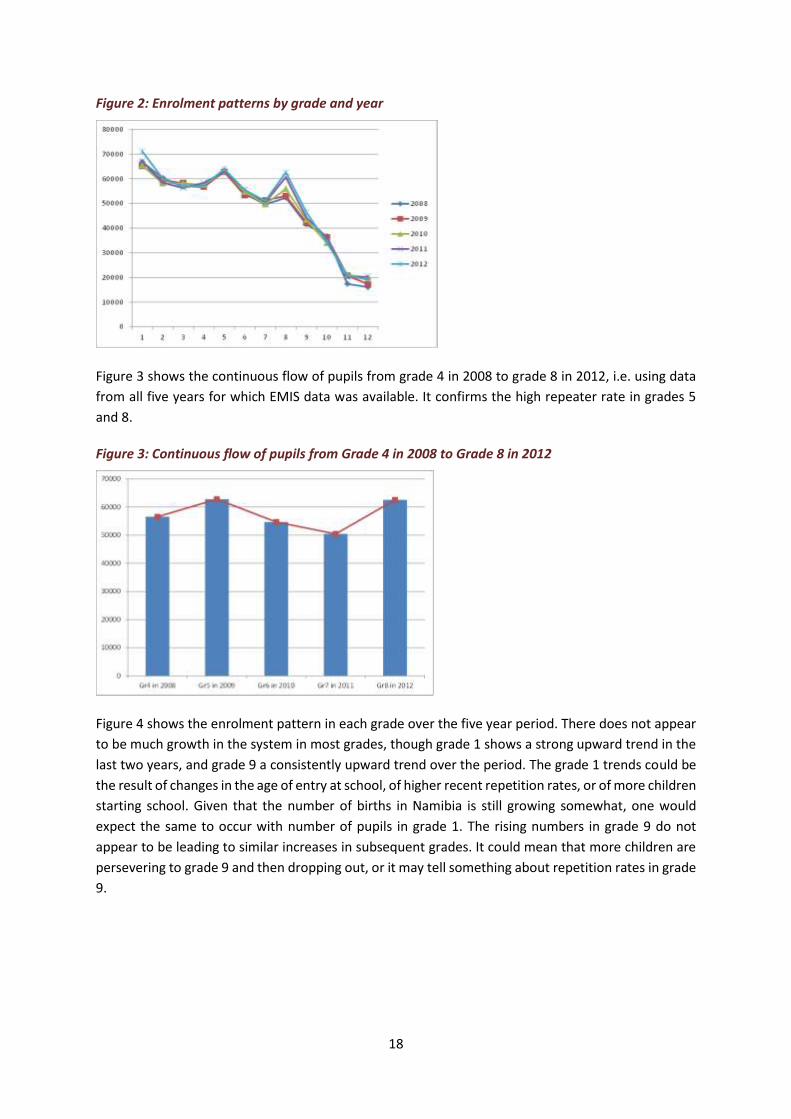
Figure 3 shows the continuous flow of pupils from grade 4 in 2008 to grade 8 in 2012, i.e. using data
from all five years for which EMIS data was available. It confirms the high repeater rate in grades 5
and 8.
Figure 3: Continuous flow of pupils from Grade 4 in 2008 to Grade 8 in 2012
Figure 4 shows the enrolment pattern in each grade over the five year period. There does not appear
to be much growth in the system in most grades, though grade 1 shows a strong upward trend in the
last two years, and grade 9 a consistently upward trend over the period. The grade 1 trends could be
the result of changes in the age of entry at school, of higher recent repetition rates, or of more children
starting school. Given that the number of births in Namibia is still growing somewhat, one would
expect the same to occur with number of pupils in grade 1. The rising numbers in grade 9 do not
appear to be leading to similar increases in subsequent grades. It could mean that more children are
persevering to grade 9 and then dropping out, or it may tell something about repetition rates in grade
9.

19
Figure 4: Enrolment patterns by year and grade
In lower grades, most pupils are in the grade appropriate for their age (Figure 5), but due to repetition
(and perhaps also drop-out and subsequent drop-in) there is by grade 8 a much wider age range,
indicating an overage (repeater) problem in these grades.
Figure 5: Enrolment patterns by age and grade in 2012
Figure 6 confirms that repetition leads to an increasingly heterogeneous age distribution at older ages.
This phenomenon reaches its peak by grade 9, where only 28% of children are not over-aged. Due to
greater drop-outs amongst the over-aged in higher grades, however, the over-aged proportion
decreases somewhat beyond grade 9.
0
5 000
10 000
15 000
20 000
25 000
30 000
35 000
40 000
45 000
05 06 07 08 09 10 11 12 13 14 15 16 17 18 19 20 21 22 23 24 25
Age
Grade1
Grade2
Grade3
Grade4
Grade5
Grade6
Grade7
Grade8
Grade9
Grdae10
Grade11
Grade12

20
Figure 6: % of pupils over-aged for their grade
Note: Over-aged here defined as older than 7 years in grade 1, 8 years in grade 2, etc.
Figure 7 shows the high repeater rate in grades 5 and 8. The gender gap in repetition between girls
and boys is particularly high in grade 5, with boys performing far worse. This may be one of the reasons
why the gender ratios change at higher grades: boys may have to spend more years at school to
achieve the same grade completed.
Figure 7: Repetition rate in 2011
Drop-out rates differ less by gender, but are inordinately high at about 30% in grade 10 (Figure 8),
perhaps reflecting the fact that for many children completion of grade 10 may be a ‘target’ that also
serves as an appropriate exit point.
Drop-out of pupils in Namibia is not collected in the EMIS data. The UNESCO model was used to
calculate drop-outs in each grade, by subtracting the sum of promotion rate and repetition rate from
100% in the given school year. The data required to compute drop-out is enrolment by grade of two
consecutive years and repeaters by grade of the second year. In these calculations, drop-outs refer to
the pupils dropping out of the Namibian public education system. However, they could have continued
their education in other education systems, such as private institutions, colleges or home schools,
moved to other countries, or even died. Such leakages from the system may not seriously affect the
calculated drop-out rates for the Namibian education system as a whole, but become more of an issue
29%
42%49%
54%
63% 63% 63%
71% 72%66%
56%51%
0%
10%
20%
30%
40%
50%
60%
70%
80%
1 2 3 4 5 6 7 8 9 10 11 12Grade

21
where one is considering smaller sub-parts of the system, such as particular regions or even school
incentive group categories as used in the analysis in the next sub-section of this report.
Figure 8: Drop-out rates between 2011 and 2012
Patterns of enrolment, repetition and drop-out by school incentive
category
The four panels of Figure 9 show the enrolment rates in each of the four school location incentive
categories. In category 1, where ‘hardship’ is the greatest, about 12 000 children start in grade 1 every
year, but the number reaching grade 12 is only about 100 (84 in 2012). The big drop-off occurs at the
beginning of the secondary grades.
The 12 780 in grade 1 in 2012 in category 1 schools compare with a grade 5 number of less than 9 000,
just over 5000 in grade 8, about 2 000 in grade 10, and only 184 in grade 12. That the enrolment for
2012 in schools in this category is not out of line with the patterns in other years is confirmed by the
stability of the numbers in each grade over the different years, indicating that there is little progress
over time.
The pattern for category 2 schools is very similar to that for category 1, though there is less drop-out
during the primary phase. Category 3 is also similar to category 2, although more children in this
category continue in school beyond grade 10. Category 4 is the only group in which a more desirable
pattern with lower drop-outs and less repetition occurs, with enrolment numbers not dropping as
precipitously as is the case in particularly category 1. Even for this group, however, the relatively flat
curve that one would see if there was little drop-out is not evident.

22
Figure 9: Enrolment by grade and year for each school category
Category 1 Category 3
Category 2 Category 4

23
Figure 10 shows the effect of these drop-out rates for the different categories of schools and for
selected grades. Compared to the number of children in grade 1 in that same year, the number drops
to as low as 49% by grade 5 in category 1 schools, and then to 17% of this level in grade 10 and only
1% in grade 12. In contrast, the least severe drop occurs in category 4 schools, where the numbers in
grade 12 are 58% of the grade 1 number. Note that the relatively good performance of category 3
schools in retaining children applies only up to grade 10.
Figure 10: ‘Survival rates’ by school category, 2012
Note: These are not really ‘survival rates’, as they show the number in each other grade relative to the number of grade 1 pupils in that school category in 2012. However, given the stability of the patterns over time, they give a good reflection of the patterns that actual survival rates would show.
Repetition patterns by grade and school category show that the major differential lies between
category 4 schools on the one hand and all three the groups of schools classified as remote schools on
the other (Figure 11). The high repetition rates in the system are confirmed by the fact that 43% of all
grade 6 pupils in SACMEQ had already repeated a grade at least once (Nakashole et al., 2011: 49).
These proportions are higher in the more rural regions.
Figure 11: Repetition rates by grade and school category in 2011
Drop-out rates by category are influenced by the way these are calculated, as discussed earlier:
Because individuals are not tracked, the drop-out from a group of schools in a grade calculated using
repeater and enrolment rates over two years. However, these are drop-outs from those school
categories and not necessarily from the school system as a whole, so it could be affected by
49%
17%
1%
70%
36%
5%
83%
60%
21%
84%
67%
58%
0%
20%
40%
60%
80%
100%
Grade 1 Grade 5 Grade 10 Grade 12
Category 1
Category 2
Category 3
Category 4
24
movements between school categories. Thus, for instance, if children from category 1 schools are sent
to boarding school in a category 4 school, drop-outs in category 1 schools would be over-estimated
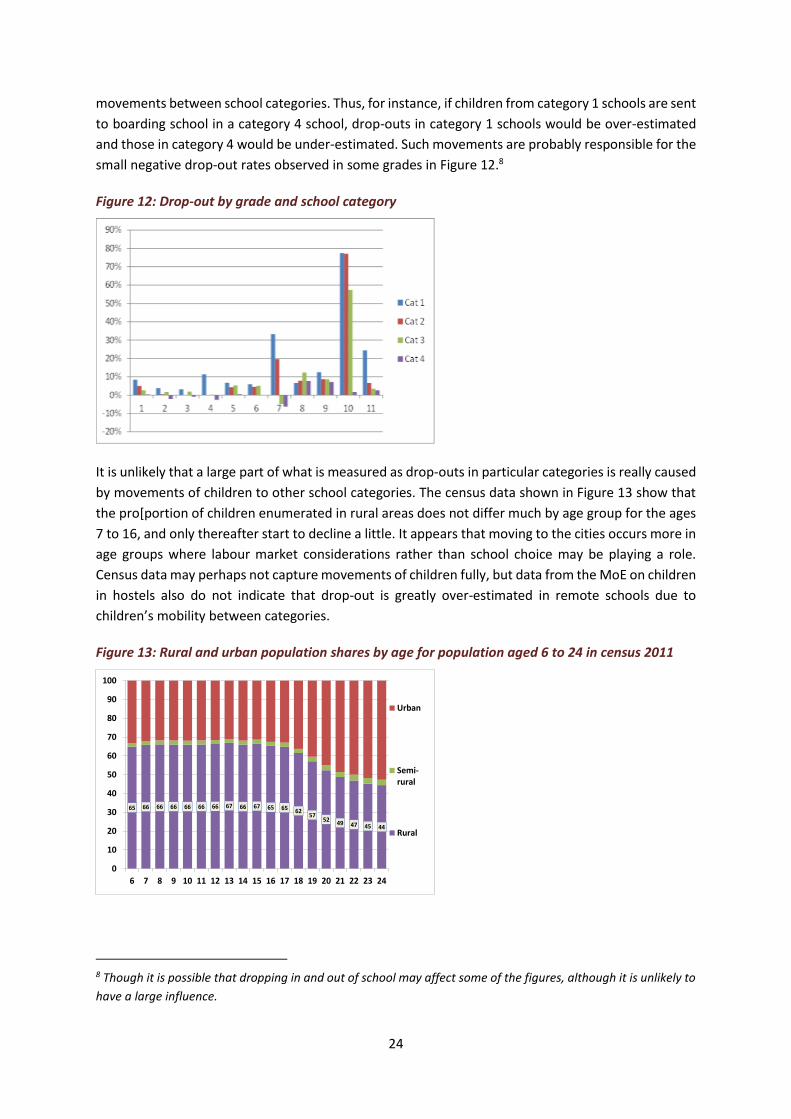
and those in category 4 would be under-estimated. Such movements are probably responsible for the
small negative drop-out rates observed in some grades in Figure 12.8
Figure 12: Drop-out by grade and school category
It is unlikely that a large part of what is measured as drop-outs in particular categories is really caused
by movements of children to other school categories. The census data shown in Figure 13 show that
the pro[portion of children enumerated in rural areas does not differ much by age group for the ages
7 to 16, and only thereafter start to decline a little. It appears that moving to the cities occurs more in
age groups where labour market considerations rather than school choice may be playing a role.
Census data may perhaps not capture movements of children fully, but data from the MoE on children
in hostels also do not indicate that drop-out is greatly over-estimated in remote schools due to
children’s mobility between categories.
Figure 13: Rural and urban population shares by age for population aged 6 to 24 in census 2011
8 Though it is possible that dropping in and out of school may affect some of the figures, although it is unlikely to
have a large influence.
65 66 66 66 66 66 66 67 66 67 65 65 6257
5249 47 45 44
0
10
20
30
40
50
60
70
80
90
100
6 7 8 9 10 11 12 13 14 15 16 17 18 19 20 21 22 23 24
Urban
Semi-rural
Rural

25
Examination performance
In this section, examination results for the four grades in which external examinations take place are
presented. For grades 5 and 7, such examinations are only held in alternate years. Unless the tests are
well calibrated to be of very similar difficulty across years, one should not read too much into small
changes in test results between years.
Grade 5:
The performance in grade 5 tests is much better in non-remote schools than in remote ones. This
applies whether one looks at average scores (converted to percentages) in English and Mathematics,
or at the proportion of children who score at least 50% in these examinations. Regarding the latter,
there is a very large difference between the 49% of the children who achieved this threshold in English
and 42% in Mathematics in non-remote schools in 2013, and the 13% and 27% respectively who
achieved this in remote schools. Category 1 schools also lag even further behind the other remote
schools.
Table 2: Grade 5 examination performance in English and Mathematics by school location category
Category 1 Category 2 Category 3 Category 4 Total
Categories 1-3
Number writing by subject and year
English:
2009 8 357 11 058 17 776 22 623 59 814 37 191
2011 8 530 10 900 16 834 23 077 59 341 36 264
2013 8 794 10 853 16 824 23 083 59 554 36 471
Mathematics:
2009 8 391 11 075 17 757 22 593 59 816 37 223
2011 8 533 10 944 16 897 23 233 59 607 36 374
2013 8 777 10 855 16 816 23 049 59 497 36 448
% scores by subject and year
English:
2009 33.5 35.9 36.7 52.6 42.1 34.9
2011 32.0 33.5 34.8 49.2 39.8 32.8
2013 33.4 35.2 35.9 50.5 41.1 34.4
Mathematics:
2009 37.0 38.9 40.0 49.5 43.0 38.1
2011 37.1 38.5 39.6 49.2 42.8 37.9
2013 35.9 36.8 38.7 47.3 41.3 36.4

26
Number achieving subject pass mark (50%) by subject and year
English:
2009 949 1 733 3 081 11 717 17 480 5 763
2011 830 1 327 2 451 11 110 15 718 4 608
2013 889 1 567 2 484 11 370 16 310 4 940
Mathematics:
2009 1 456 2 399 4 258 10 553 18 666 8 113
2011 1 603 2 417 4 143 11 275 19 438 8 163
2013 1 441 1 984 3 610 9 660 16 695 7 035
% achieving subject pass mark (50%) by subject and year
English:
2009 11% 16% 17% 52% 29% 14%
2011 10% 12% 15% 48% 26% 11%
2013 10% 14% 15% 49% 27% 13%
Maths:
2009 17% 22% 24% 47% 31% 20%
2011 19% 22% 25% 49% 33% 21%
2013 16% 18% 21% 42% 28% 17%
Grade 7:
The pattern of performance seen in grade 5 is repeated in grade 7. The deficiency in the remote
schools is severe: in 2012 18% and 16% respectively of children in these schools achieved the threshold
of 50% in English and mathematics, as against 57% and 34% in non-remote schools. Performance in
these subjects is so weak in all three categories of remote schools that there is not really much
difference between the categories. Performance in Science appears to be somewhat better in all
categories, but this may simply reflect lower demands.
Table 3: Grade 7 examination performance in English, Mathematics and Science by school location category
Category 1 Category 2 Category 3 Category 4 Total Categories 1-3
Number writing by subject and year
English:
2010 5 971 7 998 14 218 18 739 46 926 28 187
2012 6 131 7 785 13 443 17 761 45 120 27 359
Maths:
2010 5 998 7 985 14 138 18 755 46 876 28 121
2012 6 124 7 805 13 600 17 718 45 247 27 529
Science:
2010 6 091 8 067 14 211 18 781 47 150 28 369
2012 6 187 7 829 13 716 18 554 46 286 27 732

27
% scores by subject and year
English:
2010 37.4 38.6 39.4 54.4 45.0 38.1
2012 37.2 38.8 39.4 54.4 44.9 38.1
Maths:
2010 37.9 38.3 39.4 47.1 42.1 38.2
2012 37.3 37.8 38.4 44.8 40.7 37.6
Science:
2010 46.4 46.9 47.5 57.1 51.1 46.7
2012 47.1 47.2 47.2 55.6 50.6 47.1
Number achieving subject pass mark (50%) by subject and year
English:
2010 914 1 478 2 824 10 727 15 943 5 216
2012 981 1 469 2 726 10 076 15 252 5 176
Maths:
2010 1 043 1 498 2 963 7 451 12 955 5 504
2012 933 1 273 2 347 6 038 10 591 4 553
Science:
2010 2 443 3 340 6 029 12 308 24 120 11 812
2012 2 559 3 325 5 672 11 800 23 356 11 556
% achieving subject pass mark (50%) by subject and year
English:
2010 15% 18% 20% 57% 34% 17%
2012 16% 19% 20% 57% 34% 18%
Maths:
2010 17% 19% 21% 40% 28% 18%
2012 15% 16% 17% 34% 23% 16%
Science:
2010 40% 41% 42% 66% 51% 41%
2012 41% 42% 41% 64% 50% 42%
Grade 10:
Grade 10 results are very different from the patterns observed in the two primary grade examinations.
The numbers of children passing the grade 10 examination depend on both subject-specific criteria
and achieving an aggregate of 23 points. The data available for the analysis did not allow for
considering the subject-specific criteria, thus these numbers slightly exaggerate the numbers that
pass. What is clear though is that the number of ‘passes’ in grade 10 in the three categories of remote
schools is very similar to the number in the non-remote schools, with the exception of 2010 and 2013
(Table 4). The ‘pass rates’ for these two groupings are also very similar. As these examinations are
written every year, growth in the performance could be calculated for the period 2008 to 2013
(despite fluctuations, only these two years are considered in calculating growth over the period).
Based on these growth rates, the difference-in-difference method can be applied. It simply focuses on
the difference in growth between remote and non-remote areas. For the mean score, the mean score

28
grew by 11.2% in remote schools (see last column), compared to only 1.0% in non-remote (category
4) schools. The difference clearly favours the remote schools, i.e. they made relative progress. For the
pass rate, the differences in growth experience were 24.2% against -0.8% favouring remote schools,
and in terms of the pass number (those achieving at least 23 marks), the remote schools progressed
8.6% as against the decline of 1.3% in non-remote schools. Thus the difference in difference analysis
does show some gains for the remote schools relative to the non-remote ones.
Table 4: Performance in grade 10 examination by school location category
Category 1 Category 2 Category 3 Category 4 Total Categories
1-3
Number wrote:
2008 2 097 4 920 12 587 16 953 36 557 19 604
2009 2 339 5 142 11 690 16 871 36 042 19 171
2010 2 417 6 027 11 232 17 157 36 833 19 676
2011 2 520 4 928 10 931 17 312 35 691 18 379
2012 2 271 3 609 8 878 15 501 30 259 14 758
2013 2 799 4 584 9 760 16 873 34 016 17 143
Growth 10.2% 12.7% 1.0% 6.2% 11.2% 7.5%
Mean score (highest score 42):
2008 21.5 21.7 21.5 22.9 22.2 21.6
2009 21.4 21.6 22.1 23.1 22.5 21.9
2010 21.9 22.4 23.2 23.3 23.0 22.8
2011 22.1 22.1 22.9 23.2 22.9 22.6
2012 22.6 23.2 23.7 22.9 23.2 23.4
2013 23.2 23.9 24.2 23.2 23.6 24.0
Growth 7.5% 10.2% 12.7% 1.0% 6.2% 11.2%
"Pass" number (at least mark of 23)
2008 958 2 353 5 732 8 889 17 932 9 043
2009 1 054 2 414 5 687 9 000 18 155 9 155
2010 1 142 3 027 5 955 9 116 19 240 10 124
2011 1 208 2 442 5 662 9 113 18 425 9 312
2012 1 130 1 982 4 905 7 959 15 976 8 017
2013 1 511 2 626 5 688 8 777 18 602 9 825
Growth 57.7% 11.6% -0.8% -1.3% 3.7% 8.6%
"Pass" rate (at least mark of 23):
2008 46% 48% 46% 52% 49% 46%
2009 45% 47% 49% 53% 50% 48%
2010 47% 50% 53% 53% 52% 51%
2011 48% 50% 52% 53% 52% 51%
2012 50% 55% 55% 51% 53% 54%
2013 54% 57% 58% 52% 55% 57%
Growth 18.2% 19.8% 28.0% -0.8% 11.5% 24.2%

29
Figure 14: Grade 10 ‘passes’ by school location
Note: The numbers here are not actual pass rates, as subject requirements were not considered. The numbers simply show those who achieved 23 or above in the grade 10 examination.
Grade 12
As is the case for grade 10, the non-remote areas did not perform much better in grade 12 than the
remote areas.9 The difference-in-difference analysis on the percentage achieving university entry
performance levels (25 points in the five best subjects) also does not show a greater improvement in
remote areas than in non-remote areas, though the average number of marks achieved did grow
slightly more in remote than in non-remote schools. The real difference is in the number of those who
achieved the university entrance threshold: This number had increased by 31.4% between 2008 and
2012 in remote schools and by only 15.4% in non-remote schools. This is indeed remarkable, and
provides some evidence of an improving performance in terms of pupil outcomes.
Table 5: Performance in grade 12 examination by school location category
Category 1 Category 2 Category 3 Category 4 Total Categories 1-3
Number who wrote at least 5 subjects:
2008 294 360 2 826 12 830 16 310 3 480
2009 315 405 2 898 13 532 17 150 3 618
2010 313 643 3 539 15 281 19 776 4 495
2011 393 549 3 605 15 620 20 167 4 547
2012 295 559 3 536 14 257 18 647 4 390
Growth 0.3% 55.3% 25.1% 11.1% 14.3% 26.1%
9 The numbers in category 1 that wrote the examination are not quite compatible with the EMIS numbers, but
the small number of candidates here makes these discrepancies of lesser importance.
0
5 000
10 000
15 000
20 000
2008 2009 2010 2011 2012 2013
Category 4
Category 3
Category 2
Category 1

30
Final marks (average) for 5 best subjects (maximum 10 per subject)
2008 24.9 20.8 22.8 24.3 24.0 22.7
2009 25.9 21.3 23.1 24.4 24.2 23.2
2010 26.5 20.8 23.1 24.2 23.9 23.0
2011 26.9 21.3 23.6 24.5 24.3 23.6
2012 26.6 21.6 23.5 24.6 24.3 23.4
Growth 7.1% 4.2% 3.0% 1.1% 1.4% 3.1%
Passed with possible university exemption (final mark at least 25 for 5 best subjects)
2008 162 90 1 090 5 727 7 069 1 342
2009 195 114 1 149 6 216 7 674 1 458
2010 196 163 1 357 6 789 8 505 1 716
2011 264 137 1 491 7 232 9 124 1 892
2012 194 149 1 422 6 610 8 375 1 765
Growth 19.8% 65.6% 30.5% 15.4% 18.5% 31.5%
% passed with possible university exemption (25 marks. i.e. 50% of possible maximum)
2008 55% 25% 39% 45% 43% 39%
2009 62% 28% 40% 46% 45% 40%
2010 63% 25% 38% 44% 43% 38%
2011 67% 25% 41% 46% 45% 42%
2012 66% 27% 40% 46% 45% 40%
Growth 19.3% 6.6% 4.3% 3.9% 3.6% 4.3%

31
5 DISTRIBUTION AND QUALIFICATIONS OF TEACHERS
Filling of posts: Data from regions
Obtaining data on the filling of posts from the regional offices was a daunting task, mainly because of
the way such data is stored. In some cases, for instances, records of applicants were kept for each
particular vacancy; in other cases, records were stored under the name of each applicant, so one
applicant may have five records as he or she may have applied for five different positions in that
region. Some offices had the data in electronic format, while others had the full records but only in
the form of hard copies of the original applications. The hard copies of applications could not be
analysed by the field workers in the time available. It is recommended that even if such data is kept in
regional offices, there should be a national prescription as to how data are recorded, captured and
stored.
In Hardap in 2013, details were available from minutes for 94 vacancies in grades 1 to 12. There were
about 5 applicants per vacancy on average. Nineteen teachers who were qualified were recorded as
having been appointed, or at least recommended, and 39 teachers who were not qualified. The other
cases were not recorded. Six teachers who were unqualified were appointed to positions for which
qualified teachers also applied. Two of them had already been employed at the school as relief
teachers. It is not clear whether the qualified teachers who had applied had pursued their applications
to the end and had been unsuccessful, or whether they withdrew, something that is said to occur
regularly amongst teachers who apply in remote schools. About 70% of the applicants were women.
An analysis of vacancies and qualification numbers in Hardap did not show any significant differences
in applications per vacancy between remote and non-remote schools, and only a very small difference
in the number of qualified applicants applying to remote and non-remote schools.
For 2009, records for Hardap were are only available for 37 vacancies that were filled. Three-quarters
of applicants were said to be qualified, as against the 19% in 2013. This can clearly not be true and
probably relates to different criteria for being regarded as ‘qualified’ that were used in 2009. Also, the
20 applications received per vacancy as against only 5 in 2013 again seem to indicate that these data
are not comparable. It may be that the vacancies for which data are available in Hardap for 2009 are
not representative of the broader situation.
For Omusati, details are available for 80 vacancies that were filled in 2013. There were about 6
applicants per vacancy, with 13% of them being qualified. Interestingly, women constituted 86% of all
applicants.
Teacher data from EMIS
From 2008 to 2012, the proportion of teachers with post-graduate qualifications (either a post-
graduate degree in education or, more often, a degree with a post-graduate teaching diploma)
increased strongly from 23.5% to 27.3%, or from 4 908 teachers to 6 722, and increase of 1 814 in 4
years. Although the proportion of such teachers (hereafter referred to as ‘qualified teachers’) in
remote schools (location categories 1 to 3) is still lower than in non-remote schools (category 4), the

32
gap has narrowed: in category 1 schools it grew from 20.8% to 25.1%, as against 28.2% to 30.0%. Two
things can be noted from this: Firstly, that the gap has narrowed, and secondly, that even in 2008 the
gap was surprisingly small.
On the face of it, then, it appears as if Namibia has been successful in growing the number of qualified
teachers (taken to be those with post-graduate teaching qualifications) in remote schools. However,
it is also necessary to compare this to the need for qualified teachers and how this has grown, as
judged by the number of children in schools. One way in which the availability of all teachers can be
considered relative to enrolment is by investigating the pupil-teacher ratio, which has declined from
27.7 to 25.1 in this period, a very low rate in the African context. This ratio does not differ much
between schools categories. It is in fact the lowest in category 1 schools at 24.2 and the highest in
category 4 schools at 25.5. The low pupil-teacher ratio in remote schools partly reflects the fact that
many of these schools are small.
A more useful way of considering availability of qualified teachers is to express the number of such
teachers per 1000 enrolled children in each of the school categories.10 It can be thought of as the
number of such teachers in a school of 1000 (though few schools are typically of this size). In 2012, this
number stood at 10.9 for all Namibian schools, with the number in category 4 schools at 11.7 not
greatly exceeding the 10.2 in remote (category 1 to 3) schools (Table 6). Note that the lowest rate is
in category 3 schools, and that this category was even worse off compared to other school location
categories in 2008, but it did reduce this gap since. The number improved in all categories over the
period, reflecting the fact that the rise in qualified teacher numbers exceeds the rise in enrolment.
Moreover, the growth in the remote schools was faster than in other schools. In terms of the
difference-in-difference approach, the growth of 36% in remote schools (see last column) in qualified
teachers per 1000 enrolled far exceeded the growth of 19% in category 4 (non-remote) schools. Note
that category 3 schools were most successful in improving their position.
Table 6: Teachers with and without post-graduate teaching qualifications per 1000 enrolled by school category
Category
1
Category
2
Category
3
Category
4
Total Categories
1 to 3
All teachers with post-graduate teacher qualifications
2008 7.9 8.0 7.0 9.9 8.5 7.5
2009 9.1 8.4 7.6 10.1 9.0 8.1
2010 9.5 9.4 8.3 10.5 9.6 8.9
2011 9.7 9.9 8.8 11.2 10.1 9.3
2012 10.3 10.6 9.9 11.7 10.9 10.2
Growth 2008 to 2012 29% 32% 42% 19% 28% 36%
10 It is simply 1000 times the inverse of the pupil-teacher ratio.

33
All teachers without post-graduate teacher qualifications
2008 29.6 27.9 28.5 26.6 27.7 28.6
2009 28.8 27.9 29.0 27.0 27.9 28.7
2010 28.4 27.7 29.0 26.7 27.7 28.5
2011 29.0 28.2 29.3 26.7 27.9 28.9
2012 31.0 29.7 30.4 27.4 29.0 30.3
Growth 2008 to 2012 5% 7% 7% 3% 5% 6%
Total
2008 37.5 35.9 35.5 36.5 36.2 36.0
2009 37.9 36.3 36.6 37.0 36.9 36.8
2010 37.9 37.1 37.3 37.3 37.3 37.4
2011 38.6 38.1 38.0 37.9 38.0 38.2
2012 41.2 40.3 40.3 39.2 39.9 40.5
Growth 2008 to 2012 10% 12% 14% 7% 10% 12%
The number of teachers without post-graduate teacher qualifications per 1000 enrolled did also
increase modestly over the period in all categories, showing that the number of non-qualified teachers
is still rising and that this rise exceeds the rise in enrolment. It can be expected, though, that with the
increase in qualified teachers, this number will soon be declining, particularly as older teachers who
are generally less qualified retire.
34
6 QUALITATIVE ANALYSIS: EVIDENCE FROM THE FIELD
Fieldwork and interviews
In terms of the fieldwork, six regions were selected (Hardap, Kavango, Khomas, Kunene, Ohangwena
and Omusati) in discussion with the Moe where interviews were to be conducted. The six regions were
selected to give a good spread of region types across all of Namibia.
Three fieldworkers spent a week each in two regions to conduct the interviews with teachers,
principals and officials, to collect records of recruitment, transfers and resignations of qualified
teachers in rural and urban schools from 2009 to 2013, and to visit some remote schools in each of
the regions to gain an impression of the conditions that teachers were working and living under. The
MoE’s assistance was essential in ensuring that respondents were present at regional offices for
interviews at the agreed upon times (essentially, the Tuesday and Wednesday of the two weeks of
fieldwork). Fieldworkers were in some cases accompanied by representatives of UNICEF and the MoE;
because of ethical considerations, these MoE and UNICEF representatives could not attend the
interviews. Each of the three fieldworkers spent a week in each of the two regions allocated to them.
Within each region, the following individuals were selected to be interviewed:
Two primary school teachers receiving the incentive (referred to as T1 and T2).
One combined school teachers receiving the incentive (referred to as T3).
One secondary school teacher receiving the incentive (referred to as T4).
One primary school teacher who is a qualified teacher but not receiving the incentive (referred to as T5).
One combined school or secondary school teacher who is a qualified teacher but not receiving the incentive (referred to as T6).
One principal of a school receiving the incentive (referred to as P1).
One official in the regional office of the MoE.
Schools from which respondents were to be drawn were selected using a random number generator,
after also considering the need to have a selection that was as far as possible distributed across
different circuits within a region. From this respondents T1 to T6 and P1 were to be drawn, as well as
replacement schools for each of the selected schools (T1a, T2a, etc. as well as P1a) in case practical
considerations required other schools to be selected. The selection of the teacher to be interviewed
within each of the schools was to be done in the following way to ensure randomness: For the selected
schools, names of teachers were arranged alphabetically. The first letter of the name of the school
(for example an E if the school name is Emanya) determined where to start the selection process
within the alphabetical list. The first teacher down this list that was qualified (i.e. that had at least a
post-graduate teacher qualification) was then selected for the interview, or if not available, the next
one down that list. Once the end of the list was reached, it started again at the top of the list. So, in
this way a teacher was selected in a fashion that ensures randomness within each school.
This sampling approach should have ensured sufficient coverage in the six regions selected. A total of
48 interviews were to be conducted to collect the primary data for analysis. In addition, discussions

35
with teachers and principals in remote schools also took place during school visits on the fourth day
of each week of field work, which added to the richness of the information obtained.
All respondents signed a Respondent Consent Form (see Appendix 3) after it was explained to them
and they have read it. This form deals with the ethical issues of explaining what the study is about,
asking respondents for their cooperation, giving them the option not to take part or to withdraw at
any stage, and assuring them that all information obtained from them will only be used as part of the
aggregated information and will not be divulged to anyone, including their employer. Three
instruments were used for these semi-structured interviews, and they are attached as Appendices 4a
to 4c. These questionnaires allowed the information obtained from respondents to be organised
around areas (themes) of particular interest to address the research aims.
With the assistance of the MoE, the achieved sample of 60 eventually slightly exceeded the original
envisaged sample of 48, as some teachers from the replacement sample were also asked requested
to be present at the regional headquarters due to a misunderstanding, and they were then also
interviewed. In some cases the strict sampling instructions were not quite followed, thus there may
have been some non-randomness in the achieved sample, but as the qualitative rather than
quantitative aspects of these interviews were their dominant contribution, it was not felt that this bias
would skew the results. If the quality of the information so obtained is good, inferences could still be
made for the whole country. Moreover, as the financial incentive operates at national level, inferences
at national level were sought and not regional representivity.
The interviews focused on factors such as reasons for participating in the financial incentive or not,
the weight of financial as against other considerations, the opinions of all teachers and officials
regarding the perceived attractiveness of the incentive, and issues in implementing the incentive.
Views of teachers, principals and officials regarding incentives for teachers
in remote schools
Teachers who did get the incentive responded as follows to the questions in the questionnaire:
Question Strongly disagree:
6 I would not have taken this job in a remote school if there was not an incentive for teaching in a remote school, or I would have asked to be transferred to another school
12 Even if the incentive for teaching in a remote area was N$3 000 per month more, I would still prefer not to teach in a remote area
36 It is not realistic to offer secondary education in remote areas because not enough pupils are interested and not enough qualified specialist teachers are willing to teach there
18 I am very satisfied with the working conditions at the school where I teach (school grounds, classrooms, furniture, toilets, staff room, housing)
General disagree:
10 I do not really like living in a remote area
11 Even if the incentive for teaching in a remote area was N$1 000 per month more, I would still prefer not to teach in a remote area
24 I am not really qualified to do much of the teaching I am expected to do
43 I think it is fair that only qualified teachers in remote areas receive the incentive

36
Divided:
14 Most teachers complain too much about their jobs
37 It should be compulsory for all new teachers to first teach in remote schools
8 I would prefer to teach in a school that is not in a remote area
16 Teacher salaries are generally adequate (even without the incentive)
19 It is difficult to make friends in a remote rural area
28 It is best that teachers who teach in remote areas originally come from the same area
31 I would advise teachers to come to rural areas because of the incentive
39 The housing available to me is of a good enough quality
Generally agree:
27 Promotion possibilities are much better for teachers who do not teach in remote areas
2 I would prefer to teach and live in a city or a bigger town
4 There are too few opportunities for continuing professional development or improving one’s qualifications for teachers in remote areas
17 Teacher salaries are not adequate for people who live in remote areas, even with the incentive
22 Teachers in this area (where I teach) are generally highly competent
32 It is difficult to teach in remote areas because there are so many multi-grade classes
40 The home I live in has electricity, running water and a flush toilet
42 The cost of living in a remote area is quite high
21 I am more satisfied with teaching in a remote area since the government has introduced the incentive scheme
29 Teachers in remote areas get too little assistance from regional and district offices
Strongly agree:
1 It is very difficult to teach and live in a remote area
3 I have the competence to do my job as a teacher well
5 Remote areas are too far from medical facilities
7 A shortage of decent jobs for the spouses or household members of teachers in remote areas is a big problem
9 Remote areas are too far from shopping facilities/ entertainment/restaurants
13 I am very satisfied with my job as a teacher
15 I am very satisfied with the school where I teach
20 I am happy that my work is well managed and supervised
23 It is not easy to get qualified teachers to teach in remote areas
25 It is difficult to find teachers with certain specialised skills to teach in remote areas
26 Pupils in remote rural areas are generally more difficult to teach
30 Social life for the spouses and children of teachers in remote areas is very difficult
33 I have had adequate training for my job
34 Parents of pupils in remote areas have little interest in education
35 Unless we compensate teachers in remote areas well, Namibia’s education would remain weak
38 It is not the conditions in schools but the living conditions that make it unattractive to teach in remote areas
41 If I did not teach in a remote school I would have had better housing facilities
44 There would be more good teachers if teachers were better compensated
45 To attract teachers to remote areas, housing conditions would have to be improved
46 Cheap and good housing is a better incentive to offer to teachers in remote areas than more pay

37
Strong agreement and strong disagreement offer a perspective on views that are common amongst
teachers who receive the incentive. Generally, they highly value the incentive (Questions 6 & Question
12), are dissatisfied with conditions in the schools they teach in, and they think secondary education
can be offered in remote areas. They express strong satisfaction with their jobs as teachers, the
schools that they teach in, and how their work is managed and supervised (Q13, Q15 and Q20), and
they feel they have had adequate training and are competent to do their job well (Q 33 & Q3). But
they do feel that it is very difficult to teach and live in a remote area (Q1). Factors contributing to this
may be that they find pupils in remote areas generally more difficult to teach and parents in such areas
to have little interest in education (Q26 & Q34). However, other factors also detract from the
attractiveness of remote areas, such as poor living conditions (Q38), distance from medical facilities
and shopping facilities/entertainment/restaurants (Q5 & Q9), lack of jobs for other household
members (Q7) and the difficulty of social life for such other members (Q30). They feel strongly that
better housing conditions are necessary to attract teachers to remote areas, and that cheap and good
housing is a better incentive to teach in remote areas than more pay (Q45 & Q46; also Q41). These
teachers do feel that incentives matter, in that there would be more good teachers if teachers were
better compensated (Q44) and that Namibia’s education would remain weak unless teachers in
remote areas were compensated well (Q35).
Interesting responses relate to whether it should be compulsory for all new teachers to first teach in
remote areas; they are quite divided on this. Similarly, there does not appear to be consensus about
the adequacy of teacher salaries; about as many feel that they are adequate (especially after recent
increases), about as many feel the opposite (Q16). Opinions are also divided about how difficult it is
to make friends in a remote rural area (Q19) or whether is best that teachers who teach in remote
areas originally come from the same area (Q28).
Some teachers expressed reservations about some of the teaching they have to do by necessity even
though they do not feel qualified to do so (Q24). They also generally complain about the cost of living
in remote areas (Q42), and about too little assistance from regional and district offices (Q29).
Teachers not living in remote areas consider it quite appropriate that teachers in such areas should
receive incentives. Those who do receive the incentive are not unanimous that only qualified teachers
should receive it: A good proportion of them have sympathy for less qualified teachers who do not get
such incentives. Some of them expressed strong solidarity with the lesser qualified teachers, whom
they consider to be facing similar hardship and deserving credit for the good job they are doing.
It is noticeable that the level of incentives does matter in the eyes of respondents. When possible
higher incentives are considered (N$1000 or NS3000 per month more than currently), enthusiasm for
considering living in rural areas increases amongst both those currently living in remote areas and
receiving the incentives and those not living in remote areas.
The questions asked of teachers who have the necessary qualifications but do not receive the
incentive because they do not teach in a remote school were very similar. Although the smaller
numbers of such teachers interviewed limit strong generalisations, it is interesting to note that there
is much disagreement in their responses with the teachers who do receive the qualifications. This
includes a view that it is fair that such teachers receive such compensation. Clearly, there is general
consensus about the fairness of the incentive for rural teachers with post-graduate teacher

38
qualifications. Interestingly, also, while teachers who do receive incentives tend to feel that non-
qualified teachers should also be eligible for it, this view was even stronger amongst teachers who do
not teach in remote schools.
A large proportion (though not all) of teachers not teaching in remote schools indicated that,
irrespective of the incentive, they would never even consider taking a job in a remote school. Yet when
they are offered the possibility of enhanced incentives, this stark view changes: There was general
disagreement with the statement that they would still prefer not to teach in a remote area if the
incentive per month was raised by N$1000 (about US94) per month; if it was raised by N$3000 (about
US$282) per month, there was strong disagreement with this statement amongst these teachers
currently not in remote schools.
Teachers in non-remote schools are divided about their level of satisfaction or dissatisfaction with
working conditions at the schools they teach in, compared to teachers in remote areas who expressed
strong dissatisfaction on this matter.
Teachers in non-remote schools were strongly against the view that all teachers should initially be
compelled to teach in remote areas. They were also less certain than teachers in remote areas that it
is realistic to offer secondary education in remote areas.
Further insights from interviews with teachers
Medical insurance and other allowances for teachers
As part of remuneration teachers also have medical insurance and can receive transport allowances
and a housing allowance or subsidy. Access to health services at mobile or permanent clinics is
included in the criteria for classifying schools. Teachers indicated that they regarded distance to
private health care services (mostly medical doctors) as a major disadvantage of living in remote area.
This prevented them from regularly using such health services which their medical insurance would
normally cover. They thus utilise medical insurance much less than their non-remote colleagues. They
therefore felt that they were ‘losing out’ on this employee benefit and they place less value on the
criterion of distance from public health clinic for defining the degree of hardship faced in different
areas.
The travel allowance is not linked to the remote teacher incentive but forms part of the employee
benefits for which all teachers qualify. However, teachers in remote areas regard mobility and the cost
and availability of transport as key indicator in their personal experience of hardship and do not feel
that the travel allowance sufficiently compensate them for that cost. Even where they are able to buy
cars and where roads are available, their cost of travel is substantially more than those of teachers in
urban areas due to the poor condition of roads.
In interviews, teachers stressed the importance of lack of decent housing as a measure of their own
personal hardship. Though teachers can get a housing allowance or subsidy, in remote areas they are
often unable to access these. The housing subsidy and associated private sector financing is only paid
if they have a bank approved bond in areas declared urban (city, towns, settlements, etc.), as those
are the only areas in which banks will approve bonds. The housing allowance, on the other hand, can

39
only be used where there is housing rental stock, which is mostly absent in remote areas. So these
two alternative benefits can also not be used by most teachers in remote schools.
Classification of schools into categories according to location
The system of categorisation of schools into ‘hardship’ categories is based on factors such as the
schools’ distance from population centres, access to electricity and water, proximity of clinics, shops,
etc. (These criteria are set out in Appendix 2). These are important factors determining the
attractiveness of these locations to teachers, as are the value of the incentives. But conditions in many
schools may be very similar, and the focus of spending by the MoE is often to reduce disparities
between schools in aspects such as access to water, etc. Interviews with teachers indicated that they
often give much weight to the lived experience of themselves and their families, e.g. factors that
directly affect their living conditions – electricity, potable water and sanitation – and particularly
housing, which is at the top of most teachers’ list of things to consider. For most teachers, attractive
living conditions may have more of an influence on location preferences than financial incentives.
Distance vs. mobility
Transport (mobility) is often a critical factor affecting quality of living. Physical distance to specific
amenities on which the categorisation is based may be less important than time, effort and cost
associated with the travel. Being closer to amenities in terms of distance has very little meaning If the
only means of getting there is travelling for hours on foot. For instance, even if clinics are only a short
distance away, lack of transport, difficult road conditions and physical health make actual distance
almost immaterial, especially in a crisis when people need to access those facilities quickly. Or if
teachers have to first travel through the bush before reaching even a rudimentary road, then lack of
access to motorised transport is a much bigger obstacle than just the sheer distance.
Viable and reliable means of transport are crucial for teachers to access even basic amenities and also
important for pursuing further studies. Road conditions that often require a 4x4 vehicle or at least a
bakkie makes transport difficult and extremely expensive. Cars just do not last in many areas. In the
rainy season, cars are impractical in some districts, especially where housing is not available close to
good (tarred or major gravel roads).
The distance criterion alone may thus be too rigid for reflecting the access aspect of ‘hardship’.
Consideration should be given to allow for an appeal system with a committee that could assess the
validity of claims that distance is in a particular case a poor proxy for the access aspect of remoteness.
Housing
Availability of good housing alone may be a stronger incentive for attracting teachers to remote areas
than monetary incentives, especially for younger teachers. Many teachers have to deal with a ‘double
life’, in having to balance the housing demands related to where they work and those of where they
may want to live ultimately. Given that teachers often do not wish to settle permanently in areas
where they find employment but may want to settle ultimately in the areas they come from or where
they wish to retire to, it is a difficult decision for them to decide how to obtain housing near their work
and how much to invest in such housing. Older teachers who come from the areas where they teach
are more inclined to build houses even without subsidy, given their ties to such areas and the
likelihood that they would wish to retire there. They were less concerned about accessing government
support such as the housing subsidy.

40
Teachers who wish to build in rural areas (outside of officially designated areas such as towns, villages,
settlements) do not receive any government support for such housing. This makes it extremely difficult
and expensive to provide housing for them. They either have to use very basic materials (wood, mud,
zink sheets) or have to travel far to where housing is available.
School sanitation
In a water scarce and extremely large country like Namibia, providing satisfactory levels of sanitation
is a major challenge. Some schools in category 3 suffer from poor sanitation comparable or even worse
than schools in greater hardship categories, which greatly affects the school experience of learners
and teachers.
Lack of role models
As teachers, nurses and other professionals in remote areas are not seen to be better off than the
local population, this does not act to make such professional roles attractive to children. Sharing the
same type of housing, poor access to water and sanitation, lack of mobility and transport, etc. may be
good for relationships with the local community, but it does not demonstrate upward mobility through
education.
Drop-out
The fact that many remote schools do not offer education to the highest grades leads to many children
dropping out from school rather than changing schools. Often, grade 11 and 12 education is only
available in more urban and distant locations. Some reasons for high drop-out at secondary levels
mentioned during interviews included the fee-based secondary school system and the need to for
children to have to leave the remote schools for secondary schools in more urban areas. The costs of
hostels or other accommodation associated with living away from home and the general costs of
upkeep such as personal hygiene, pocket money, additional educational costs such as assignments,
(changed) uniforms, etc. are often beyond the means of many parents in remote areas. Feeder schools
mitigate the difficulty of transitioning to secondary and senior secondary levels by offering one clear
path for learners to gain access, find systems of social and economic support and build on existing
social capital (a few friendly faces) in changing schools. If most remote schools were to at least offer
education to grade 10 this may also reduce earlier drop-out as it would only require leaving the home
area at a later age and stage.

41
7 CONCLUSIONS AND RECOMMENDATIONS
Summary of main findings
Spending on teacher incentives was only about N$47 million (US$4.4 million) in 2012, and due to inflation the real value of the incentives has declined by about 30% since they were introduced in 2009. The spending on incentives constitutes only about 0.9% of budgeted personnel spending on teachers in 2014/15.
Almost all teachers, whether they benefit from it or not, and the teacher union NANTU, accept the principle of incentives for teachers in remote schools. Many teachers feel that the incentive should also be extended to teachers who do not have post-graduate qualifications, but both the union and some recipients of incentives have reservations that this may discourage teachers from striving to improve their qualifications.
There is some dissatisfaction with the classification of remote schools into the three different hardship categories.
There is no indication that school enrolment and promotion rates are improving in either remote schools or in the Namibian education system as a whole.
Drop-out from Namibian schools is extremely high from the junior secondary phase, especially in remote schools in category 1 and 2. Boarding schools and children moving to other schools from ‘feeder schools’ cannot explain the large differences in drop-out rates between especially category 1 and 2 schools and other schools.
Examination performance in remote primary schools is extremely weak. There are also no signs of a general improvement in performance.
Remote schools do surprisingly well in examinations at secondary level, not significantly different from non-remote schools. Considering the differences in primary performance, there can be only one explanation for this: More of the weaker candidates drop out in remote schools, thus they retain a higher proportion of better-performing students.
A relatively high proportion of qualified teachers are employed in schools in remote areas. This was the case even before the incentive system was introduced in 2009, though the situation has improved even further since then.
This is the case even relative to the growth of enrolment: In all categories of Namibian schools, pupil-teacher ratios have declined while the proportion of those teachers that are qualified with post-graduate teacher qualifications has been rising. This confirms that the main intention of the incentives (the recruitment and retention of qualified teachers in remote schools) has been achieved. It is impossible to tell whether the incentives were the main reason behind this improvement the presence of qualified teachers in remote schools. It is likely, however, that they were at least a contributing factor.
While the incentives may have contributed to attracting or retaining more qualified teachers in remote schools, such schools have not improved their ability to produce improved learning outcomes, e.g. to retain children to higher grades and to improve their performance in school examinations except to some extent the small number who do get to the higher grades.
Housing and living conditions, or the ‘lived experience’, of teachers in remote schools are greatly important to them, and in this respect particularly many feel that the conditions they experience should be improved.
Limitations of the study
Given the timeframe in which this study had to be undertaken, the team achieved considerable
success because of the good support of officials of the MoE and because of the excellent quality of the

42
EMIS data. The major limitation is that little is still known about the filling of vacancies in schools and
the movement of teachers within the school system. Regarding vacancies, although regions kept
records, these were not consistent across regions or were not always systematically kept. The tracking
of teachers, on the other hand, requires that unique identification numbers should be maintained for
teachers and captured in all data, so that they could be tracked across schools, regions and time. This
is something the MoE should strive to introduce.
Something that made some of the data work more difficult than it needs to have been relates to the
way that data is largely kept in silos within the MoE. There is no consistent use of identification
numbers of schools, examination centres, pay points and teachers, and no information to ease the
linking of data. This is something that needs immediate attention and that could greatly strengthen
the ability of the MoE to use the data within the system for management information and decision
making.
Overall conclusions
The central question that this study set out to answer relates to the effectiveness, efficiency, relevance,
impact and sustainability of the incentives.
Impact and effectiveness of the incentives: The available evidence cannot conclusively show that the
incentives have been the cause of the improved distribution of qualified teachers, but it certainly
suggests that they have had an impact. However, there is little evidence that the desired outcomes,
improved learning by learners in rural areas, has improved. If effectiveness is measured with regard
to teacher distribution, the incentives were probably effective, but if effectiveness is measured by
learner outcomes, then they were not, at least not in primary schools and in a reduction in drop-out
and repetition in primary and junior secondary schools.
Efficiency of the incentives: In terms of the efficiency of the incentives, if they did indeed contribute
to the improved distribution of qualified teachers across locational categories, they must have been
quite efficient given their very low cost – only 0.9% of teacher personnel spending. This is an
extraordinarily low proportion, considering the ambitious goal of fundamentally changing the spatial
distribution of qualified teachers.
Relevance of the incentives: The incentives are clearly relevant, in the sense that similar incentives are
widely used in African countries to encourage teachers to take positions in remote schools. On the
other hand, the situation with regard to qualified teachers in remote schools was not as bad as in
many other countries when the incentives were introduced. But if one also considers the sense of
greater fairness that the incentives have led to then a case can be made for their relevance: They have
given rural teachers recognition and acknowledged their contribution in a way that goes beyond
simply offering financial rewards.
Sustainability of the incentives: The relatively small fiscal costs of the incentives make them quite
affordable within budgetary constraints. Even a substantial increase in the incentive would be fiscally
sustainable, given that its small size means that it can be diverted from general salary increases for
teachers and other education personnel without having too large an effect.

43
Recommendations
Based on the foregoing and the analysis presented earlier in this report, the following
recommendations are made:
Incentives
1. The system of financial incentives for qualified teachers teaching in remote schools should be retained in its current format. Appointments through decentralised applications for particular vacancies should remain the mainstay of the recruitment system, rather than centralised deployment of teachers to where there may be a need for them. When vacancies are advertised, the financial incentive level should be clearly indicated if it is to act as a real incentive.
2. The criteria for classification of schools into incentive categories should be retained, but there should be opportunity for regular updating of classifications. Schools or teachers should be able to appeal every two years to an impartial and transparent committee if they feel aggrieved that the strict application of these criteria does not fully recognise their hardship. A systematic appeals process of this sort would ensure that individual grievances are all treated equally and transparently. Every six years, the whole classification should again be reviewed so as to consider the effects of events, such as clinics that close, new shops that are built, roads that have been constructed, etc. Also, as infrastructure improves, the relative importance of different criteria may change in determining perceived hardship.
3. Incentive values should be increased substantially, considering the real hardship teachers in many remote schools face, and considering that incentives are relative low compared to current teacher salaries and that they have been eroded by inflation. Moreover, teachers in remote areas often forego the benefit of housing allowances or subsidies, are not fully compensated through travel allowances for their much higher travelling costs, and cannot fully use their medical insurance benefits.
4. Incentives for teachers in category 1 schools should increase more than for other categories, as greater acknowledgement of their extremely difficult circumstances. It is recommended that incentive values be increased to N$3000 (US$282) per month in category 1 schools, N$2 000 (US188) in category 2 schools and N$1 200 (US$113) in category 3 schools. Based on 2012 EMIS teacher numbers, this would raise the cost of the incentive from the current N$47 to N$77 million (US$7.2 million), i.e. by N$30 million (US$2.8 million). Considering the N$5.0 billion (US$469 million) spent on teacher (personnel) costs in 2014/5, and annual inflation-adjustments for education personnel alone of well over N$300 million (US$28.2 million), this places a relatively small additional burden on the education budget, raising it to less than 1½ of teacher personnel costs, but it serves two important purposes: It may assist in further improving teacher allocation between remote and non-remote schools, and it signals to teachers in remote schools that their contribution is valued. The latter can also serve as a sign to parents in such areas that the education of their children is a matter of concern for the government. The value of the incentives should also be adjusted annually in future, at least in line with inflation.
5. Considering the MoE’s intention to grow mainly the qualified part of its teacher corps, it is not recommended that the financial incentives be extended to non-qualified teachers, despite the valuable contribution many of them make to education in rural schools.
6. To further encourage qualified teachers to take up positions in rural schools, it is recommended that part of the student loans that student teachers receive from the government to undertake their training should be converted into a bursary if they commit to initially teaching in remote schools. By requiring them to apply for specific posts, i.e. those in remote schools, the choice currently given to teachers would remain, yet this would allow the MoE to channel teachers to priority areas. This is a form of merging choice and deployment strategies and exposing more young teachers to the educational need in remote areas.

44
Teacher housing:
7. The provision of more and better housing for qualified teachers in remote schools should be prioritised within fiscal and practical constraints. The priority in teacher housing spending should clearly be on housing qualified teachers willing to teach in remote schools. Currently, there is already a considerable amount (N$113 million) set aside for teacher housing within the MoE budget.
8. Assuming that half the teachers in category 1 schools would require housing, at an average unit cost of N$0.5 million (the high cost is largely because of the cost of water provision), the cost of providing such housing to teachers experiencing greatest hardship would be only N$200 million (US$18.8 million). Thus it is possible to provide all category 1 teachers with housing within 5 years by spending about N$40 million (US$3.8 million) per year on their housing, not even half the money currently set aside in the budget for teacher housing.
9. Once housing has been provided to all qualified category 1 teachers who require such housing, category 2 and then category 3 schools should then receive priority. As more qualified teachers become available and willing to teach in remote schools, more houses may be required. The most remote schools should always receive priority.
10. Even the provision of solar electricity systems would already be a considerable improvement for many teachers.
Pupil outcomes
11. The extremely weak performance of children in remote areas in primary school is a cause for great concern and requires far greater attention to the quality of education in such schools. Though qualified teachers may be a step in this direction, additional attention to this problem is clearly necessary.
12. Children in remote areas should be encouraged to continue to higher grades by providing classes and teachers for such grades in remote areas, by offering more financial support (bursaries or subsidised hostel accommodation) to children in such schools who need to move to other areas, and by strengthening the system of feeder schools.
Conditions in schools
13. The MoE should increase its efforts at dealing with the extraordinarily poor conditions for pupils and teachers in remote schools by improving infrastructure and maintenance of facilities.
14. In order to do so, better information on the conditions of school facilities and their maintenance is required. This should be systematically gathered and used in prioritising the upgrade of facilities. This could be done in part by including relevant questions on the quality of facilities through EMIS, but further information may require a School Register of Needs where someone external to the school assesses conditions of facilities across schools.
15. Similarly, more attention should be given to the quality of the accommodation offered in school hostels, both in remote areas and in non-remote areas, in order to make them more attractive for students from remote areas.
Data and human resource tracking
16. Data integration across data sources is essential to utilise the available data better. This requires unique identifiers to be used for schools and teachers, and links between such identifiers (EMIS numbers) and examination numbers and pay point numbers. (The research team has already undertaken some such linking work that it can provide for the MoE.) A small task team on data integration and the use of data to inform decision making should be set up at the highest level within the MoE. This task team should ensure the required coordination of such an effort across the different divisions within the MoE that produce data, including the finance, EMIS, personnel and examinations sections.

45
17. Consistently used unique identifiers would make it possible to track the movement of teachers across the system, allowing information to be readily retrieved on where qualified teachers teach, what grades and subjects they teach, and how many of them leave the education system. Such information is essential for proper human resource planning.

46
8 REFERENCES
Adedeji, S. O., & Olaniyan, O. (2011). Improving the conditions of teachers and teaching in rural schools
across African countries. Addis Ababa: UNESCO.
Bennell, P. (2004). Teacher motivation and incentives in Sub-Saharan Africa and Asia. Department for
International Development. Brighton.
Bennell, P., & Akyeampong, K. (2007). Teacher motivation in sub-Saharan Africa and Asia. Department
for International Development, Researching the Issues, No. 71. Essex: Depart-ment for
International Development, Educational Papers.
Glewwe, P., Hanushek, E. A., Humpage, S., & Ravina, R. (2014). School resources and educational
outcomes in developing countries: A review of the literature from 1990 to 2010. In P. Glewwe
(Ed.), Education Policy in Developing Countries. Chicago: University of Chicago Press.
Harding, J. B., & Mansaray, A. T. (2006). Teacher motivation and incentives in Sierra Leone. Mimeo.
Iipinge, Sakaria M. & Likando, Gilbert N. (2012). The educational assessment reforms in post-
independence Namibia: A critical analysis. South African Education Journal 9(2), Sept.
Mulkeen, A., & Chen, D. (Eds.). (2008). Teachers for rural schools: Experiences in Lesotho, Malawi,
Mozambique, Tanzania and Uganda. Washington D.C.: World Bank.
Mulkeen, A., Chapman, D. W., DeJaeghere, J. G., & Leu, E. (2007). Recruiting, retaining and retraining
secondary teachers and principals in sub-Saharan Africa. World Bank Working Paper No. 99.
Washington D. C.: World Bank.
Nakashone, L., Dengeinge, R., Miranda, H. & Shikongo, S. (2011). The SACMEQ III project in Namibia:
A study of the conditions of schooling and the quality of primary education in Namibia.
Windhoek: SACMEQ & Ministry of Education.
Urwick, J., Mapuru, P., & Nkhoboti, M. (2005). Teacher motivation and incentives in Lesotho. London:
Department for International Development.

47
Appendix 1: Quality of Namibian education data
AN ASSESSMENT OF THE QUALITY OF NAMIBIAN
EDUCATION DATA FOR ANALYTICAL PURPOSES
MANAGEMENT of THE DATA
The available data used in this study is based on data predominantly from the Education Management
Information System (EMIS) obtained from the Ministry of Education (MoE). The dataset generated by the
annual school survey in EMIS in most countries in the world is often one of the most under-utilised data
sources. The objective of an education management information system (EMIS) is not only to collect, store
and process information but also to help in education policy-making, by providing relevant and accessible
information for research projects such as required by this terms of reference.
The EMIS datasets on their own are not comprehensive enough for the analysis required for this project.
There is also not one information system in the MoE containing all the relevant information to do the
analysis. Therefore the relevant information had to be extracted from different information systems
before it was compiled into a single master file. This illustrates the necessity and value of integrating
different data sources to the decision- and policy-making process.
All these separate datasets from the different information systems were integrated through a unique
school identifier to create a single master dataset. Salient characteristics of these data sources include the
following:
Unique school identifier
In all these databases the school unique number is a core data element that makes it possible to link these
datasets from different information systems into one. Not all the datasets received from the MoE
contained a unique identifier. For example, the format of the school identifier (examination number) in
the examination data differs between secondary and primary schools. This makes it difficult to carry out
comparisons if identifiers, whether school id or exam numbers, are not constructed consistently, especially
in combined schools. The examination school identifier is also different from the school identifier used in
EMIS. A database table with a unique school identifier between examination and EMIS was created. This
table was used to link all EMIS and examination datasets and will be made available for future use in the
MoE.
Key data elements
Core data elements in the EMIS such as the school category, teacher qualification, enrolment, grade and
teacher qualification codes enable a more detailed analysis.
Data integration
Data integration is an important EMIS development strategy. It means that data from multiple sources
(EMIS, EXAMINATION, HR, etc.) can be linked, integrated, or merged through the use of a common field
across a collection of data sources. Data integration is intended to add value to the data that is already
collected and available in various systems. All the datasets mentioned will remain fragmented islands of
data and will exist in isolation from other data if it is not linked. This limits its potential use for informing
management decision making.

48
DATASETS
The following datasets were used in this research project:
Education Management Information System (EMIS): The essence of EMIS is that MoE annually collects
data from all schools through a comprehensive survey. The data collected through the annual survey of
schools includes enrolment, repeaters, pupils by age, language, teachers and physical infrastructure. The
EMIS data in Namibia appears to be well organised and stored in one database in different tables over
time. This data could be used in the research project on the assessment of incentives of qualified teachers
in Namibia’s remote rural areas. The specific datasets obtained from EMIS at school-level were the
following:
Enrolment of pupils by year, gender and grade for 2008-2012 Enrolment of pupils by year, age, gender and grade for 2008-2012 Repeaters by year, gender and grade for 2008-2012 School facilities by year for 2008-2012 Basic services by year for 2008-2012 List of schools by year for 2008-2013, including data elements such as school type, sector, region,
circuit, etc. Teacher information: EMIS annually collects data from every teacher on gender, age, experience,
academic qualification and professional (teacher) qualification. This data is stored in a database and was
provided by the EMIS section at teacher-level for 2008-2012.
Census 2011: Census, a national survey for the entire population, is a useful dataset to compare enrolment
with population data.
Examinations: The Directorate of National Examinations and Assessment (DNEA) provided the research
team with the following examination datasets:
The Junior Secondary Certificate (JSC) examination data at pupil-level for 2008-2013 The Namibia Senior Secondary Certificate Ordinary Level (NSSCO) examination data at pupil-level
for 2008-2013 The Namibia Senior Secondary Certificate Higher Level (NSSCH) examination data at pupil-level for
2008-2013 The semi-external end of primary (Grade 7) examination data at pupil-level The grade 5 examination data at pupil-level
School Incentive data: The HR section provided the team with a list of schools that received the teacher
incentive for remote rural area according to the three categories of incentive classification.
The team combined all the above mentioned data sources into one dataset at the school-level using the
school-code as the unique identifier to link the different datasets. This dataset formed the basis for the
analysis for this research project.
DATA QUALITY ASSESSMENT
How good is the quality of the EMIS data in Namibia? The aim is to measure the completeness and accuracy
of the EMIS data using custom tools and to identify possible causes for EMIS data quality problems. Some
practical suggestions for improving the quality of EMIS data collection in Namibia are presented.
This section deals with the steps in assessing the quality of data and provides general guidance to the EMIS
section in Namibia on assessing data quality of the EMIS data. The focus of the assessment is not on the
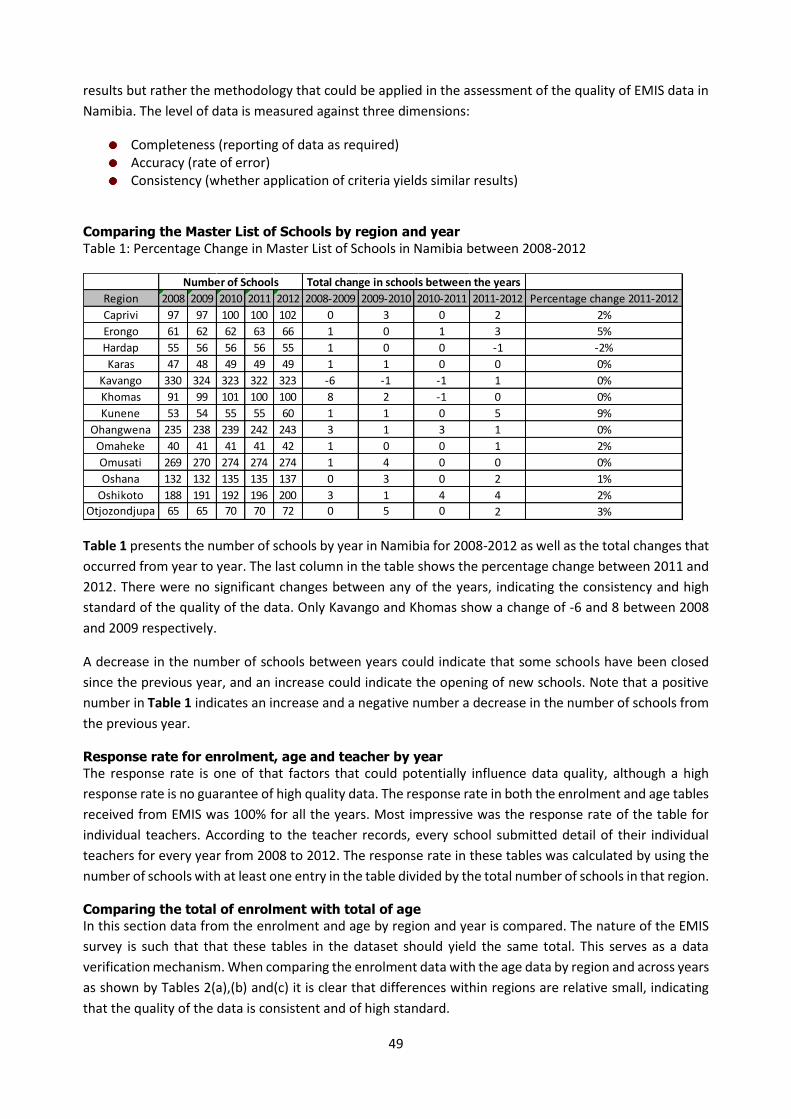
49
results but rather the methodology that could be applied in the assessment of the quality of EMIS data in
Namibia. The level of data is measured against three dimensions:
Completeness (reporting of data as required) Accuracy (rate of error) Consistency (whether application of criteria yields similar results)
Comparing the Master List of Schools by region and year
Table 1: Percentage Change in Master List of Schools in Namibia between 2008-2012
Table 1 presents the number of schools by year in Namibia for 2008-2012 as well as the total changes that
occurred from year to year. The last column in the table shows the percentage change between 2011 and
2012. There were no significant changes between any of the years, indicating the consistency and high
standard of the quality of the data. Only Kavango and Khomas show a change of -6 and 8 between 2008
and 2009 respectively.
A decrease in the number of schools between years could indicate that some schools have been closed
since the previous year, and an increase could indicate the opening of new schools. Note that a positive
number in Table 1 indicates an increase and a negative number a decrease in the number of schools from
the previous year.
Response rate for enrolment, age and teacher by year
The response rate is one of that factors that could potentially influence data quality, although a high
response rate is no guarantee of high quality data. The response rate in both the enrolment and age tables
received from EMIS was 100% for all the years. Most impressive was the response rate of the table for
individual teachers. According to the teacher records, every school submitted detail of their individual
teachers for every year from 2008 to 2012. The response rate in these tables was calculated by using the
number of schools with at least one entry in the table divided by the total number of schools in that region.
Comparing the total of enrolment with total of age
In this section data from the enrolment and age by region and year is compared. The nature of the EMIS
survey is such that that these tables in the dataset should yield the same total. This serves as a data
verification mechanism. When comparing the enrolment data with the age data by region and across years
as shown by Tables 2(a),(b) and(c) it is clear that differences within regions are relative small, indicating
that the quality of the data is consistent and of high standard.
Region 2008 2009 2010 2011 2012 2008-2009 2009-2010 2010-2011 2011-2012 Percentage change 2011-2012
Caprivi 97 97 100 100 102 0 3 0 2 2%
Erongo 61 62 62 63 66 1 0 1 3 5%
Hardap 55 56 56 56 55 1 0 0 -1 -2%
Karas 47 48 49 49 49 1 1 0 0 0%
Kavango 330 324 323 322 323 -6 -1 -1 1 0%
Khomas 91 99 101 100 100 8 2 -1 0 0%
Kunene 53 54 55 55 60 1 1 0 5 9%
Ohangwena 235 238 239 242 243 3 1 3 1 0%
Omaheke 40 41 41 41 42 1 0 0 1 2%
Omusati 269 270 274 274 274 1 4 0 0 0%
Oshana 132 132 135 135 137 0 3 0 2 1%
Oshikoto 188 191 192 196 200 3 1 4 4 2%
Otjozondjupa 65 65 70 70 72 0 5 0 2 3%
Number of Schools Total change in schools between the years
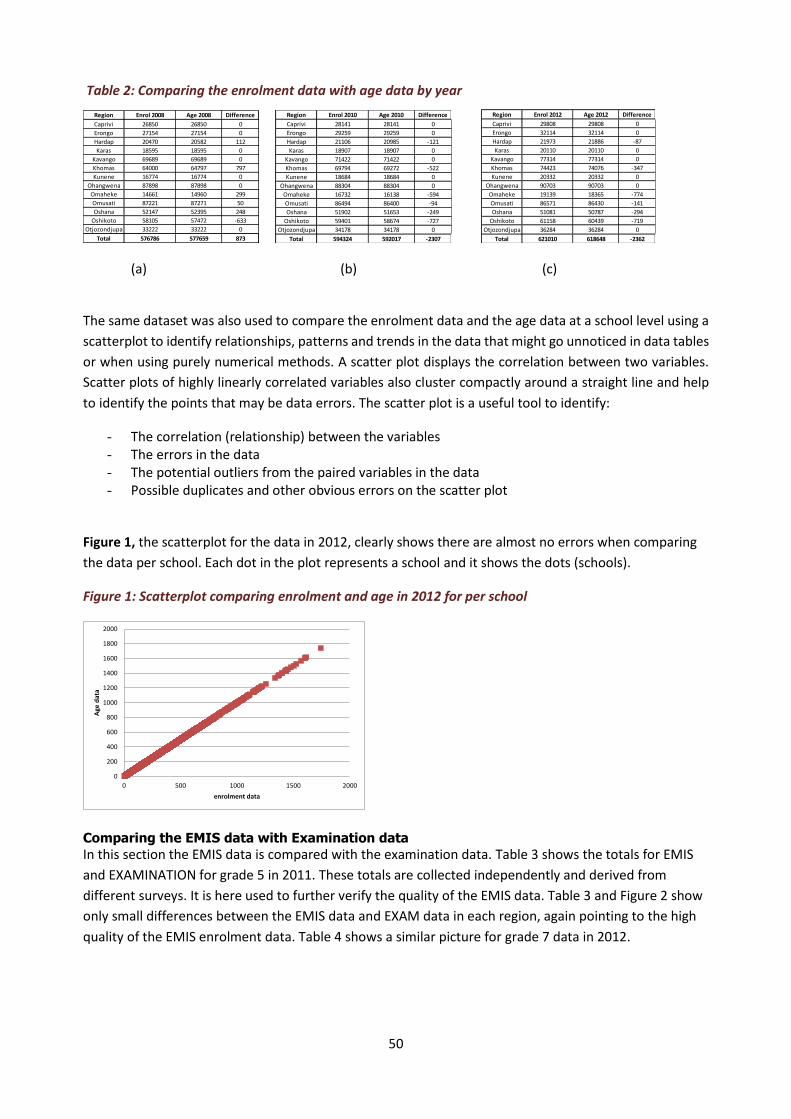
50
Table 2: Comparing the enrolment data with age data by year
(a) (b) (c)
The same dataset was also used to compare the enrolment data and the age data at a school level using a
scatterplot to identify relationships, patterns and trends in the data that might go unnoticed in data tables
or when using purely numerical methods. A scatter plot displays the correlation between two variables.
Scatter plots of highly linearly correlated variables also cluster compactly around a straight line and help
to identify the points that may be data errors. The scatter plot is a useful tool to identify:
- The correlation (relationship) between the variables - The errors in the data - The potential outliers from the paired variables in the data - Possible duplicates and other obvious errors on the scatter plot
Figure 1, the scatterplot for the data in 2012, clearly shows there are almost no errors when comparing
the data per school. Each dot in the plot represents a school and it shows the dots (schools).
Figure 1: Scatterplot comparing enrolment and age in 2012 for per school
Comparing the EMIS data with Examination data
In this section the EMIS data is compared with the examination data. Table 3 shows the totals for EMIS
and EXAMINATION for grade 5 in 2011. These totals are collected independently and derived from
different surveys. It is here used to further verify the quality of the EMIS data. Table 3 and Figure 2 show
only small differences between the EMIS data and EXAM data in each region, again pointing to the high
quality of the EMIS enrolment data. Table 4 shows a similar picture for grade 7 data in 2012.
Region Enrol 2008 Age 2008 Difference
Caprivi 26850 26850 0
Erongo 27154 27154 0
Hardap 20470 20582 112
Karas 18595 18595 0
Kavango 69689 69689 0
Khomas 64000 64797 797
Kunene 16774 16774 0
Ohangwena 87898 87898 0
Omaheke 14661 14960 299
Omusati 87221 87271 50
Oshana 52147 52395 248
Oshikoto 58105 57472 -633
Otjozondjupa 33222 33222 0
Total 576786 577659 873
Region Enrol 2010 Age 2010 Difference
Caprivi 28141 28141 0
Erongo 29259 29259 0
Hardap 21106 20985 -121
Karas 18907 18907 0
Kavango 71422 71422 0
Khomas 69794 69272 -522
Kunene 18684 18684 0
Ohangwena 88304 88304 0
Omaheke 16732 16138 -594
Omusati 86494 86400 -94
Oshana 51902 51653 -249
Oshikoto 59401 58674 -727
Otjozondjupa 34178 34178 0
Total 594324 592017 -2307
Region Enrol 2012 Age 2012 Difference
Caprivi 29808 29808 0
Erongo 32114 32114 0
Hardap 21973 21886 -87
Karas 20110 20110 0
Kavango 77314 77314 0
Khomas 74423 74076 -347
Kunene 20332 20332 0
Ohangwena 90703 90703 0
Omaheke 19139 18365 -774
Omusati 86571 86430 -141
Oshana 51081 50787 -294
Oshikoto 61158 60439 -719
Otjozondjupa 36284 36284 0
Total 621010 618648 -2362
0
200
400
600
800
1000
1200
1400
1600
1800
2000
0 500 1000 1500 2000
Age
dat
a
enrolment data

51
Table 3: Comparing EMIS and EXAM totals for grade 5 in 2011 by region
Figure 2: Comparison of EMIS and EXAM totals for grade 5 in 2011 per province
Table 4: Comparing EMIS and EXAM totals for grade 7 in 2012 by Region
Enrolment patterns by age and year
Table 5 below presents enrolment by specific age in Namibia from 2008 to2012, as well as the percentage
changes from year to year. Children in a particular age group (specifically lower ages) would normally be
expected to be enrolled again the following year. Figure 3, which was created from the data in Table 5, is
a representation of the actual flow of the same cohort of pupils from 2008 to 2012. If there was full
enrolment and no drop out and no repeaters then the enrolment lines in Figure 3 should have been about
the same gradient for all the years. The 7 year olds in 2008 are the 8 year olds in 2009 and should therefore
be almost the same number, a principle that should apply for all the ages in Table 5. The percentage change
was calculated by dividing the total of a year by the total from the previous year for a specific age group.
An analysis of the data in Table 5 and the graph, Figure 3, can therefore be used as a data quality
assessment tool to verify enrolment totals by age. It also indicates at which age groups dropouts are the
highest. It is clear that the greatest change is between the ages 13 and 18 years.
year Grade Region EMIS EXAM Difference
2011 5 Caprivi 3017 2895 122
2011 5 Erongo 3004 2954 50
2011 5 Hardap 2281 2182 99
2011 5 Karas 1962 1950 12
2011 5 Kavango 7448 7090 358
2011 5 Khomas 6135 5711 424
2011 5 Kunene 1827 1818 9
2011 5 Ohangwena 9534 9133 401
2011 5 Omaheke 1857 1798 59
2011 5 Omusati 8286 8177 109
2011 5 Oshana 4643 4561 82
2011 5 Oshikoto 6383 6241 142
2011 5 Otjozondjupa 3090 2973 117
0
2000
4000
6000
8000
10000
12000
Cap
rivi
Ero
ngo
Har
dap
Kar
as
Kav
ango
Kh
om
as
Ku
nen
e
Oh
angw
en
a
Om
ahe
ke
Om
usa
ti
Osh
ana
Osh
iko
to
Otj
ozo
nd
jup
a
EMIS
EXAM
yr grade Region EMIS EXAM Diff
2012 7 Caprivi 2340 2175 165
2012 7 Erongo 2403 2143 260
2012 7 Hardap 1598 1182 416
2012 7 Karas 1698 1712 -14
2012 7 Kavango 5646 5384 262
2012 7 Khomas 5356 4088 1268
2012 7 Kunene 1374 1387 -13
2012 7 Ohangwena 7838 7404 434
2012 7 Omaheke 974 897 77
2012 7 Omusati 7050 6987 63
2012 7 Oshana 4014 3956 58
2012 7 Oshikoto 4656 4612 44
2012 7 Otjozondjupa 2224 1975 249

52
Table 5: Enrolment patterns by age and year (2008 – 2012)
Figure 3: Enrolment patterns by age and year (2008 – 2012)
CONCLUSION
The data quality measures were applied on the EMIS datasets for 2008 - 2012. The data collection and the
data capturing processes used by MoE in Namibia seemed to work well based on the relatively high
acceptable standard and the quality of the data. The EMIS data in Namibia appears to be well organised
and stored in one database in different tables over time. Historical data for examinations is also well
organised and stored for different years. However, the format of the examination dataset is not user
friendly enough and sometimes difficult to change into a format where it can be used in a statistical
software package. As a guiding principles and a recommendation it is recommended that EMIS data be
integrated with other datasets in the rest of the MoE using a common unique school identifier. Information
is of far greater value when it is integrated, thereby allowing the provision of more comprehensive datasets
that can be used for management decision making and policy formulation purposes.
Change 2008-2009 Change 2009-2010 Change 2010-2011 Change 2011-2012
7 years 40939 8 years 45560 111% 9 years 47070 103% 10 years 48331 103% 11years 48021 99%
8 years 47317 9 years 49638 105% 10 years 50686 102% 11years 50664 100% 12 years 51320 101%
9 years 48886 10 years 49823 102% 11years 49149 99% 12 years 49351 100% 13 years 49982 101%
10 years 48849 11years 48336 99% 12 years 48891 101% 13 years 49421 101% 14 years 49027 99%
11years 46478 12 years 46581 100% 13 years 47195 101% 14 years 46472 98% 15 years 45423 98%
12 years 48141 13 years 48408 101% 14 years 47619 98% 15 years 46532 98% 16 years 44447 96%
13 years 47612 14 years 47177 99% 15 years 45784 97% 16 years 43269 95% 17 years 39795 92%
14 years 48462 15 years 47063 97% 16 years 44732 95% 17 years 41215 92% 18 years 33363 81%
2008 2009 2010 2011 2012
0
10000
20000
30000
40000
50000
60000
7-1
1ye
ars
8-1
2 y
ears
9-1
3 y
ears
10
-14
ye
ars
11
-15
ye
ars
12
-16
ye
ars
13
-17
ye
ars
14
-18
ye
ars
7-14years
8-15years
9-16years
10-17years
11-18years

53
Appendix 2: Classification criteria
Category 1
Worst Hardship
Parameter Available Explain Unavailable
Roads X harsh road
Transport X unreliable
shops (fresh food, fruit and vegetables) X
social/recreational facilities X
Electricity X
Water X Difficult to access
health facility X
Telecommunications X
postal services X
distance from main centre over 100 km
Category 2
Moderate Hardship
Parameter Available Explain Unavailable
Roads X gravel/tarred
Transport X unreliable
shops (fresh food, fruit and vegetables) X Only for basic food commodities
social/recreational facilities X
Electricity X generator or alternative power supply
Water X available
health facility X mobile clinic
Telecommunications X Landlines/mobile
postal services X
distance from main centre 50 - 99 km
Category 3
Least Hardship
Parameter Available Explain Unavailable
Roads X gravel/tarred
Transport X reliable
shops (fresh food, fruit and vegetables) X For basic food commodities
social/recreational facilities X
Electricity X reliable
Water X available
health facility X available
Telecommunications X available
postal services X
distance from main centre 11 - 49 km

54
Appendix 3: Consent form
PERMISSION TO BE INTERVIEWED AND TAKE PART IN STUDY
Assessment of the impact of incentives for the recruitment and retention of qualified teachers in remote rural schools in Namibia
We want to ask you a few questions.
Why we invited you to be interviewed and take part in our study:
You have been chosen to be interviewed to help us understand how well incentives to teachers in remote rural areas work in attracting qualified teachers to such areas
We ask such questions to a selected group of teachers and officials, including some who get the incentives and some who do not.
What is requested of you?
We ask that you the answer questions honestly and as best as you can. Please let us know if you do not understand any of these questions. It should take you about an hour and a half to answer these questions.
Your rights:
Please ask the interviewer any questions about any part of this project that you do not fully understand. It is very important that you are happy to be interviewed and that you clearly understand your role in this research study.
It is your choice to take part in this research and you can stop the interview at any time. If you say no, the interviewer will accept this. You can stop the interview at any point, even if you initially said that you wanted to take part in the interview.
The information that you provide will be used for the study, but no-one else will know what your specific answers have been.
We will never give anyone your name. Our university has a code that stipulates that we cannot ever share your name when reporting the conclusions of our research.
You can trust us with the answers that you provide to these questions. We will not share this with anyone else, including your principal or supervisor, or the Ministry of Education.
If you have questions regarding your rights as a participant, contact Prof. Servaas van der Berg [[email protected]; +27 21 808 2239] at the University of Stellenbosch.

55
You will help us understand how government incentives can contribute to improving the quality
of education for children in remote rural areas of Namibia.
What is this research study about?
These questions are part of research that UNICEF is funding to help the Namibian government to find out how well the incentives to attract teachers to teach in remote schools have worked.
We will look at what has happened to the availability of qualified teachers in remote schools after these incentives were introduced, but also want to understand how teachers and officials experience this policy and what are the factors that may make remote schools more attractive or less attractive.
SIGNATURE OF PARTICIPANT
The participant was given the opportunity to ask questions and these questions were
answered to his/her satisfaction.
I hereby consent voluntarily to participate in this study. I have been given a copy of this form. I
agree that…
I have read this information and consent form or it has been read to me.
I have had a chance to ask questions and all my questions have been answered.
I understand that it is my choice to answer these questions and take part in this study. I may choose to stop the interview at any time and not be part of the study.
Signed at (place) ......................…........…………….. on (date) …………....……….. .
________________________________________
Signature of participant
SIGNATURE OF INVESTIGATOR
I declare that I have explained the information given in this document to this participant in the
study. He/she was encouraged and given ample time to ask questions.
________________________________________ ______________
Signature of Investigator Date

56
Appendix 4a: Questionnaire for teachers who
teach in remote areas
INTERVIEW QUESTIONNAIRE FOR TEACHERS WHO TEACH IN REMOTE AREAS Read the respondent the Consent Form and ask him/her to sign it. Stress in particular that
though we take everything that the respondent answers very seriously and will report on it, his/her response is completely anonymous and confidential.
The study is part of a research project on teacher incentives for teaching in remote areas.
BACKGROUND QUESTIONS Name and surname of the respondent: ....................................................................................
School of the respondent: . ………………………….………..................................................................
Place of residence (town, area): .……………………………………………………………………………………………
Region of residence: .................……………………………………………………………………………………………..
Position: …………………………………………………………………………………………………………………………...…..
Gender 1=male; 2=female
Age
Marital status: 1=married; 2=single; 3=divorced; 4=widow(er)
Living with spouse (if any): 1=yes; 2=no; 3=N/A
Teaching qualifications: 1=Less than Grade 12; 2= Grade 12; 3= 1 or 2 years tertiary; 4= at least 3 years
tertiary
Years teaching
Years in current school
Number of schools at which you have taught
Number of direct dependants in your household
Is current school in the same location as place of permanent residence? : 1=yes; 2=no 9=n/a
Is current school in the district you originally come from (place of origin)? 1=yes; 2=no 9=n/a
Is current school in the region you originally come from (place of origin)? 1=yes; 2=no 9=n/a
How long do you travel to school? (minutes)
Do you teach in a school in a remote area? 1=yes; 2=no 9=n/a
Do you receive an incentive for teaching in a remote areas? 1=yes; 2=no 9=n/a (If no and answer to previous question was yes, enquire why)
Do you receive any non-monetary benefits (such as free or subsidised housing)? 1=yes; 2=no
If yes, are these benefits because you teach in a remote area? 1=yes; 2=no
Do you have any other work/job from which you earn money outside your normal teaching job? (If yes, please specify/explain and indicate the approximate average monthly income in N$) 1=yes; 2=no; 9=n/a
…………………………………………………………………………………………………………………………………………………............................
What is your workload? (hours teaching per week)

57
What is the size of your own class (average class)?
FOR TEACHERS WHO TEACH IN REMOTE AREAS: How much do you agree with the following statements:
Fieldworker note: Please enter the number of interviewee’s choice in the box next to the question: 1=Strongly disagree; 2=Disagree; 3= Neither agree nor disagree; 4=Agree; 5= Strongly agree; 9= Not applicable or No After each question, enquire about the reasons for the answer chosen. Please refer to the similarly numbered questions in the part of the questionnaire that is provided for prompts and notes.
1. It is very difficult to teach and live in a remote area
2. I would prefer to teach and live in a city or a bigger town
3. I have the competence to do my job as a teacher well
4. There are too few opportunities for continuing professional development or improving one’s qualifications for teachers in remote areas
5. Remote areas are too far from medical facilities
6. I would not have taken this job in a remote school if there was not an incentive for teaching in a remote school, or I would have asked to be transferred to another school
7. A shortage of decent jobs for the spouses or household members of teachers in remote areas is a big problem
8. I would prefer to teach in a school that is not in a remote area (If yes, where do you hope to go? (location and/or school))
9. Remote areas are too far from shopping facilities/ entertainment/restaurants
10. I do not really like living in a remote area
11. Even if the incentive for teaching in a remote area was N$1 000 per month more, I would still prefer not to teach in a remote area
12. Even if the incentive for teaching in a remote area was N$3 000 per month more, I would still prefer not to teach in a remote area
13. I am very satisfied with my job as a teacher
14. Most teachers complain too much about their jobs
15. I am very satisfied with the school where I teach
16. Teacher salaries are generally adequate (even without the incentive)
17. Teacher salaries are not adequate for people who live in remote areas, even with the incentive
18. I am very satisfied with the working conditions at the school where I teach (school grounds, classrooms, furniture, toilets, staff room, housing)
19. It is difficult to make friends in a remote rural area
20. I am happy that my work is well managed and supervised
21. I am more satisfied with teaching in a remote area since the government has introduced the incentive scheme

58
22. Teachers in this area (where I teach) are generally highly competent
23. It is not easy to get qualified teachers to teach in remote areas
24. I am not really qualified to do much of the teaching I am expected to do
25. It is difficult to find teachers with certain specialised skills to teach in remote areas
26. Pupils in remote rural areas are generally more difficult to teach
27. Promotion possibilities are much better for teachers who do not teach in remote areas
28. It is best that teachers who teach in remote areas originally come from the same area
29. Teachers in remote areas get too little assistance from regional and district offices
30. Social life for the spouses and children of teachers in remote areas is very difficult
31. I would advise teachers to come to rural areas because of the incentive
32. It is difficult to teach in remote areas because there are so many multi-grade classes
33. I have had adequate training for my job
34. Parents of pupils in remote areas have little interest in education
35. Unless we compensate teachers in remote areas well, Namibia’s education would remain weak
36. It is not realistic to offer secondary education in remote areas because not enough pupils are interested and not enough qualified specialist teachers are willing to teach there
37. It should be compulsory for all new teachers to first teach in remote schools
38. It is not the conditions in schools but the living conditions that make it unattractive to teach in remote areas
39. The housing available to me is of a good enough quality
40. The home I live in has electricity, running water and a flush toilet
41. If I did not teach in a remote school I would have had better housing facilities
42. The cost of living in a remote area is quite high
43. I think it is fair that only qualified teachers in remote areas receive the incentive
44. There would be more good teachers if teachers were better compensated
45. To attract teachers to remote areas, housing conditions would have to be improved
46. Cheap and good housing is a better incentive to offer to teachers in remote areas than more pay

59
Appendix 4b: Questionnaire for teachers who do
not teach in remote areas
INTERVIEW QUESTIONNAIRE FOR TEACHERS WHO DO NOT TEACH IN REMOTE AREAS
Read the respondent the Consent Form and ask him/her to sign it. Stress in particular that though we take everything that the respondent answers very seriously and will report on it, his/her response is completely anonymous and confidential.
The study is part of a research project on teacher incentives for teaching in remote areas.
BACKGROUND QUESTIONS: Name and surname of the respondent: ………………………………………………………………………………
School of the respondent: …………….…………………………………………………………………………………….
Place of residence (town, area): ………………………………………………………………………………………….
Region of residence: ……………………………………………………………………………………………………………
Position: ………………………………………………………………………………………………………………………………
Gender 1=male; 2=female
Age
Marital status: 1=married; 2=single; 3=divorced; 4=widow(er)
Living with spouse (if any): 1=yes; 2=no; 3=N/A
Teaching qualifications: 1=Less than Grade 12; 2= Grade 12; 3= 1 or 2 years tertiary; 4= at least 3 years
tertiary
Years teaching
Years in current school
Number of schools at which you have taught
Number of direct dependants in your household
Is current school in the same location as place of permanent residence? : 1=yes; 2=no 9=n/a
Is current school in the district you originally come from (place of origin)? 1=yes; 2=no 9=n/a
Is current school in the region you originally come from (place of origin)? 1=yes; 2=no 9=n/a
How long do you travel to school? (minutes)
Do you teach in a school in a remote area? 1=yes; 2=no 9=n/a
Do you receive an incentive for teaching in a remote areas? 1=yes; 2=no 9=n/a (If no and answer to previous question was yes, enquire why)
Do you receive any non-monetary benefits (such as free or subsidised housing)? 1=yes; 2=no
9=n/a
Do you have any other work/job from which you earn money outside your normal teaching job? (If yes, please specify/explain and indicate the approximate average monthly income in N$) ? 1=yes; 2=no 9=n/a ……………………………………………………………………………………………………………………………………………………………………………
What is your workload? (hours teaching per week)
What is the size of your own class (or average class)?

60
BACKGROUND QUESTIONS (TO BE ANSWERED BY ALL): FOR TEACHERS WHO DO NOT TEACH IN REMOTE AREAS: How much do you agree with the following statements:
Fieldworker note: Please enter the number of respondent’s choice in the box next to the question: 1=Strongly disagree; 2=Disagree; 3= Neither agree nor disagree; 4=Agree; 5= Strongly agree; 9= Not applicable or No After each question, enquire about the reasons for the answer chosen. Please refer to the similarly numbered questions in the part of the questionnaire that is provided for prompts and notes
1. It is very difficult to teach and live in a remote area
2. I would prefer to teach and live in a city or a bigger town rather than in a small town or remote area
3. The incentives paid to teachers in remote rural areas make working in such schools more attractive to me
4. I have the competence to do my job as a teacher well
5. Irrespective of the incentive, I would never even consider a job in a remote school
6. There are too few opportunities for continuing professional development or improving one’s qualifications for teachers in remote areas
7. Remote areas are too far from medical facilities
8. A shortage of decent jobs for the spouses or household members of teachers in remote areas is a big problem
9. Even if the incentive for teaching in a remote area was N$1 000 per month more, I would still prefer not to teach in a remote area
10. Even if the incentive for teaching in a remote area was N$3 000 per month more, I would still prefer not to teach in a remote area
11. I am very satisfied with my job as a teacher
12. Most teachers complain too much about their jobs
13. I am very satisfied with the school where I teach
14. Teacher salaries are generally adequate
15. Teacher salaries are not adequate for people who live in remote areas, even with the incentive
16. I am very satisfied with the working conditions at the school where I teach (school grounds, classrooms, furniture, toilets, staff room, housing)
17. I am happy that my work is well managed and supervised
18. Teachers in the area where I teach are generally highly competent
19. It is not easy to get qualified teachers to teach in remote areas
20. I am not really qualified to do much of the teaching I am expected to do
21. It is difficult to find teachers with certain specialised skills to teach in remote areas
22. It is best that teachers who teach in remote areas originally come from the same area
23. It is very difficult to attract teachers who work in cities to remote areas

61
24. Social life for the spouses and children of teachers in remote areas is very difficult
25. Unless we compensate teachers in remote areas well, Namibia’s education would remain weak
26. It is not realistic to offer secondary education in remote areas because not enough pupils are interested and not enough qualified specialist teachers are willing to teach there
27. It should be compulsory for all new teachers to first teach in remote schools
28. It is not the conditions in schools but the living conditions that make it unattractive to teach in remote areas
29. The housing available to me is of a good enough quality
30. The home I live in has electricity, running water and a flush toilet
31. The cost of living in a remote area is quite high
32. I think it is fair that teachers in remote areas receive incentives for teaching there
33. I think it is fair that only qualified teachers in remote areas receive the incentive
34. There would be more good teachers if teachers were better compensated
35. To attract teachers to remote areas, housing conditions would have to be improved
36. Cheap and good housing is a better incentive to offer to attract teachers to remote areas than more pay

62
FOR TEACHERS WHO DO NOT TEACH IN REMOTE AREAS: Which of the following reasons
are important considerations in your decision NOT to work in a remote area:
Fieldworker note: Please enter the number of respondent’s choice in the box next to the question: 1=Yes, important; 2=No, not important; 3= Neither important nor unimportant If respondents volunteer an answer on any of these questions, please note this down next to the similarly numbered questions in the part of the questionnaire provided for notes
1. I have not got the necessary qualifications to receive the incentive
2. I do not know what it would be like to teach in a remote area
3. Remote areas have a lack of medical facilities
4. Housing conditions are bad in remote areas
5. School working conditions are bad in remote areas
6. I do not want to teach multi-grade classes
7. My spouse/partner would not be able to find a decent job in a remote area
8. The lack of social life in remote areas
9. I do not like living in a remote area
10. My spouse would not like living in a remote area
11. Other members of my family would not like living in a remote area
12. Remote areas are too far from shopping facilities/ entertainment/restaurants
13. The incentive to teach in remote areas is not enough
14. It is more difficult to teach pupils in remote rural areas
15. There is a lower chance of promotion in remote areas
16. I prefer to teach in my region of origin (I am teaching in my region of origin at the moment)
17. My home language is not widely spoken in many of the remote areas
18. There is a lack of opportunities for continuing professional development in remote areas

63
Appendix 4c: Questionnaire for principals and
officials
INTERVIEW QUESTIONNAIRE FOR PRINCIPALS AND OFFICIALS
Read the respondent the Consent Form and ask him/her to sign it. Stress in particular that though we take everything that the respondent answers very seriously and will report on it, his/her response is completely anonymous and confidential.
The study is part of a research project on teacher incentives for teaching in remote areas.
BACKGROUND QUESTIONS Name and surname of the respondent: ……………………………………………………………………………...
School of the respondent: …………….…………………………………………………………………………………….
Place of residence (town, area): ………………………………………………………………………………………….
Region of residence: …………………………………………………………………………………………………………...
Position: ……………………………………………………………………………………………………………………………..
Gender 1=male; 2=female
Age
Marital status: 1=married; 2=single; 3=divorced; 4=widow(er)
Living with spouse (if any): 1=yes; 2=no; 3=N/A
Teaching qualifications: 1=Less than Grade 12; 2= Grade 12 or 1-2 years’ tertiary; 3= more than 2 years’
tertiary
Years teaching
Years in current school/position
Number of schools at which you have taught
Number of direct dependants in your household
Is current school/workplace in the same location as your place of permanent residence? : 1=yes; 2=no 9=n/a
Is current school/workplace in the district you originally come from (place of origin)? 1=yes;
2=no 9=n/a
Is current school/workplace in the region you originally come from (place of origin)? 1=yes;
2=no 9=n/a
How long do you travel to work? (minutes)
(For principal) Do you teach in a school in a remote area? 1=yes; 2=no 9=n/a
(For principal) Do you receive an incentive for teaching in a remote areas? 1=yes; 2=no 9=n/a (If no and answer to previous question was yes, enquire why)
(For principal) Do you receive any non-monetary benefits (such as free or subsidised housing)? 1=yes; 2=no 9=n/a
(For principal) Do you have any other work/job from which you earn money outside your normal teaching job? (If yes, please specify/explain and indicate the approximate average monthly income in N$) ? 1=yes; 2=no 9=n/a ……………………………………………………………………………………………………………………………………………………………………………
(For principal) What is the size of the average class in your school?
(For principal) Do you have multi-grade classes in your school? 1=yes; 2=no 9=n/a
(For official) Do you have remote schools in your jurisdiction? 1=yes; 2=no 9=n/a

64
If yes, approximately what proportion of the schools in your jurisdiction: 1=most; 2=many; 3=quite a lot; 4= few; 9=n/a (
FOR PRINCIPAL / OFFICIAL: How much do you agree with the following statements:
Fieldworker note: Please enter the number of interviewee’s choice in the box next to the question: 1=Strongly disagree; 2=Disagree; 3= Neither agree nor disagree; 4=Agree; 5= Strongly agree; 9= Not applicable or No After each question, enquire about the reasons for the answer chosen. Please refer to the similarly numbered questions in the part of the questionnaire that is provided for prompts and notes
1. It is very difficult for teachers to teach and live in a remote area.
2. Most teachers prefer to teach and live in a city or bigger town
3. Most teachers in this region would prefer to teach and live in another region.
4. The incentives paid to teachers in remote rural areas make working in such schools more attractive for teachers
5. Most teachers in my jurisdiction have the competence to do their jobs as teachers well
6. It is difficult for teachers to improve their qualifications if they live in a remote area
7. Teachers in remote areas complain that it is too far from medical facilities
8. Most teachers in remote schools would not have taken those positions if there was not an incentive for teaching in a remote school
9. Most teachers who teach in remote areas are there because they could not get positions in other schools
10. A shortage of decent jobs for the spouses or household members of teachers in remote areas is a big problem
11. Most teachers in remote areas would prefer to be transferred to a school that is not in a remote area
12. Teachers in remote areas complain it is too far from shopping facilities/ entertainment/restaurants
13. Most teachers do not really like living in a remote area
14. The spouses and family members of teachers in remote schools often do not like living in remote areas
15. Even if the incentive for teaching in a remote area was N$1 000 per month more, most teachers would still prefer not to teach in a remote area
16. Even if the incentive for teaching in a remote area was N$3 000 per month more, most teachers would still prefer not to teach in a remote area
17. Teacher salaries are generally adequate (even without the incentive)
18. Most teachers in remote schools are satisfied with working conditions at the schools where they teach (school grounds, classrooms, furniture, toilets, staff room, housing)
19. It is difficult for teachers who come from elsewhere to make friends in a remote rural area
20. Teachers in remote schools are more satisfied with teaching in those schools since the government introduced the incentive scheme
21. It is not easy to get qualified teachers to teach in remote areas

65
22. Teachers in remote areas are generally not really qualified to do much of the teaching they are expected to do
23. It is difficult to find teachers with certain specialised skills to teach in remote areas
24. Working conditions inside schools and classrooms in remote areas are generally much more difficult than in schools that are not remote
25. Promotion possibilities are much better for teachers who do not teach in remote areas
26. It is best that teachers who teach in remote areas originally come from the same area
27. Teachers in remote areas get too little assistance from regional and district offices
28. Pupils in remote areas have fewer textbooks than other pupils
29. Social life for the spouses and children of teachers in remote areas is very difficult
30. I would advise teachers to come to remote areas because of the incentive
31. It is difficult to teach in remote areas because there are so many multi-grade classes
32. There are too few opportunities for continuing professional development for teachers in remote areas
33. It is generally more difficult to teach pupils in remote areas
34. Parents of pupils in remote areas have little interest in education
35. Unless we compensate teachers in remote areas well, Namibia’s education would remain weak
36. It is not realistic to offer secondary education in remote areas because not enough pupils are interested and not enough qualified specialist teachers are willing to teach there
37. It should be compulsory that all new teachers should first teach in remote schools
38. It is not the conditions in schools but the living conditions that make it unattractive to teach in remote areas
39. The housing available to teachers in remote areas is of a good enough quality
40. Teachers who do not work in remote schools generally have better housing facilities
41. The cost of living in a remote area is quite high
42. If the incentive was abolished, many teachers would immediately ask for a transfer to a school that is not in a remote area
43. I think it is fair that only qualified teachers in remote areas receive the incentive
44. There would be more good teachers if teachers were better compensated
45. Cheap and good housing is a better incentive to offer to teachers in remote areas than more pay