the impact of hydrogen bonding on amide 1h chemical shift ... · the impact of hydrogen bonding on...
TRANSCRIPT
The Impact of Hydrogen Bonding on Amide 1H Chemical ShiftAnisotropy Studied by Cross-Correlated Relaxation and
Liquid Crystal NMR Spectroscopy
Lishan Yao,†,‡ Alexander Grishaev,‡ Gabriel Cornilescu,§ and Ad Bax*,‡
Qingdao Institute of Bioenergy and Bioprocess Technology, Chinese Academy of Sciences,Qingdao 266061, China, Laboratory of Chemical Physics, NIDDK, National Institutes of Health,Building 5, Room 126 NIH, Bethesda, Maryland 20892-0520, and National Magnetic Resonance
Facility, Madison, Wisconsin 53706
Received April 28, 2010; E-mail: [email protected]
Abstract: Site-specific 1H chemical shift anisotropy (CSA) tensors have been derived for the well-orderedbackbone amide moieties in the B3 domain of protein G (GB3). Experimental input data include residualchemical shift anisotropy (RCSA), measured in six mutants that align differently relative to the static magneticfield when dissolved in a liquid crystalline Pf1 suspension, and cross-correlated relaxation rates betweenthe 1HN CSA tensor and either the 1H-15N, the 1H-13C′, or the 1H-13CR dipolar interactions. Analyses withthe assumption that the 1HN CSA tensor is symmetric with respect to the peptide plane (three-parameterfit) or without this premise (five-parameter fit) yield very similar results, confirming the robustness of theexperimental input data, and that, to a good approximation, one of the principal components orientsorthogonal to the peptide plane. 1HN CSA tensors are found to deviate strongly from axial symmetry, withthe most shielded tensor component roughly parallel to the N-H vector, and the least shielded componentorthogonal to the peptide plane. DFT calculations on pairs of N-methyl acetamide and acetamide in H-bondedgeometries taken from the GB3 X-ray structure correlate with experimental data and indicate that H-bondingeffects dominate variations in the 1HN CSA. Using experimentally derived 1HN CSA tensors, the optimalrelaxation interference effect needed for narrowest 1HN TROSY line widths is found at ∼1200 MHz.
Introduction
Isotropic chemical shifts are key parameters in NMR spec-troscopy, enabling signals from different nuclei of any giventype in a molecule to be distinguished. Chemical shift valuesoften can be determined at very high precision, up to 6 ordersof magnitude higher than the range of chemical shift valuesobserved. Although chemical shifts clearly are exquisitelysensitive to molecular structure, our understanding of the relationbetween structure and chemical shift remains relatively rudi-mentary in all but the simplest model systems.1 However, thepotential richness of information contained in chemical shiftshas stimulated efforts to develop a better quantitative under-standing of the relationship between these parameters andmolecular structure, particularly in proteins.2-10 Magnetic
shielding of a nucleus by its surrounding electrons is a processthat lends itself well to quantum chemical calculations. Forpeptides and proteins, such quantum calculations now make itpossible to rapidly predict chemical shift values of 15N, 13C,and 1H nuclei on the basis of the molecule’s experimentallydetermined structure.11,12 Perhaps surprisingly, predictions ofisotropic chemical shifts based on simple empirical databaseanalysis yield values that agree somewhat better with experi-mentally observed shifts.13-15 These latter types of analysis,however, do not provide much insight in the individual factorscontributing to chemical shielding. For that purpose, it isnecessary to take a step back and evaluate the impact ofstructural factors on chemical shielding anisotropy (CSA). Forexample, for backbone 13C′ nuclei in small proteins, accurateCSA values have been obtained by both solution and solid stateNMR.16,17 These results clearly confirmed prior results18-20
† Qingdao Institute of Bioenergy and Bioprocess Technology, ChineseAcademy of Sciences.
‡ Laboratory of Chemical Physics, NIDDK, National Institutes of Health.§ National Magnetic Resonance Facility.
(1) Jameson, C. J. Annu. ReV. Phys. Chem. 1996, 47, 135–169.(2) McConnell, H. M. J. Chem. Phys. 1957, 27, 226–229.(3) de Dios, A. C.; Pearson, J. G.; Oldfield, E. Science 1993, 260, 1491–
1496.(4) Osapay, K.; Case, D. A. J. Am. Chem. Soc. 1991, 113, 9436–9444.(5) Williamson, M. P.; Asakura, T. J. Magn. Reson. B 1993, 101, 63–71.(6) Ando, I.; Kameda, T.; Asakawa, N.; Kuroki, S.; Kurosu, H. J. Mol.
Struct. 1998, 441, 213–230.(7) Saito, H. Magn. Reson. Chem. 1986, 24, 835–852.(8) Barfield, M. J. Am. Chem. Soc. 2002, 124, 4158–4168.(9) Case, D. A. Curr. Opin. Struct. Biol. 1998, 8, 624–630.
(10) Moon, S.; Case, D. A. J. Biomol. NMR 2007, 38, 139–150.
(11) Xu, X. P.; Case, D. A. J. Biomol. NMR 2001, 21, 321–333.(12) Vila, J. A.; Arnautova, Y. A.; Martin, O. A.; Scheraga, H. A. Proc.
Natl. Acad. Sci. U.S.A. 2009, 106, 16972–16977.(13) Shen, Y.; Bax, A. J. Biomol. NMR 2007, 38, 289–302.(14) Neal, S.; Nip, A. M.; Zhang, H. Y.; Wishart, D. S. J. Biomol. NMR
2003, 26, 215–240.(15) Kohlhoff, K. J.; Robustelli, P.; Cavalli, A.; Salvatella, X.; Vendruscolo,
M. J. Am. Chem. Soc. 2009, 131, 13894–13895.(16) Loth, K.; Pelupessy, P.; Bodenhausen, G. J. Am. Chem. Soc. 2005,
127, 6062–6068.(17) Wylie, B. J.; Sperling, L. J.; Frericks, H. L.; Shah, G. J.; Franks, W. T.;
Rienstra, C. M. J. Am. Chem. Soc. 2007, 129, 5318–5319.(18) Teng, Q.; Iqbal, M.; Cross, T. A. J. Am. Chem. Soc. 1992, 114, 5312–
5321.
Published on Web 07/16/2010
10.1021/ja103629e 2010 American Chemical Society10866 9 J. AM. CHEM. SOC. 2010, 132, 10866–10875

which indicate that variation in isotropic 13C′ chemical shiftscan be attributed almost entirely to differences in the σYY
component of the shielding tensor.21-23 The latter is a steepfunction of both backbone torsion angles and hydrogen bondstrength.22-24 For backbone amide 15N, the range of isotropicshifts observed in proteins is large, spanning more than 20 ppmfor residues of any given type, but both computational and empiricalefforts to correlate chemical shift changes to structural parametershave been challenging. Much effort has been devoted to measuringthe 15N CSA tensor in proteins,16,25-28 both by solution and solid-state NMR methods, but only recently has a consensus started toemerge.17,29 As indicated by DFT calculations, amide 15N CSA isimpacted by many variables, including backbone and side chaintorsion angles, hydrogen bonding, and residue type.30-32 We haverecently shown29 that 15N CSA magnitudes of the third Igg bindingdomain of protein G (GB3, dissolved in a medium containing liquidcrystalline Pf1) correlate well with those obtained from spinningsideband analysis of slow magic angle spinning (MAS) solid-stateNMR measurements17 on a closely homologous domain. Asym-metry of the CSA tensor was found to be dominated by thebackbone torsion angles.
The solution NMR experiments used for characterizing the15N CSA tensor also contain information on the backbonecarbonyl and amide proton CSA. These measurements werecarried out on six conservative GB3 mutants that adopt differentaverage orientations relative to the director of a liquid crystallinePf1 suspension.33 Small differences between isotropic 15Nchemical shifts and those measured under the six differentorientations in the liquid crystalline matrix result from incom-plete averaging of the 15N CSA tensor, giving rise to residualchemical shift anisotropy (RCSA). These RCSA values aremeasured from three-dimensional (3D) HNCO triple resonancespectra, which contain 13C′ and 1HN RCSA in the other twodimensions of the spectrum. Simultaneously, by recording theHNCO spectrum in the 1H-coupled mode, 15N-1H residualdipolar couplings (RDCs) are obtained that define the alignmenttensor (Saupe matrix) of the mutant proteins relative to themagnetic field. For 13C′, we find that the RCSA values agree towithin experimental error with 13C′ CSA values extracted fromslow MAS solid state NMR experiments.17 For this reason,
analysis of this RCSA data is not further pursued as it wouldnot improve on the solid state NMR results (13C′ RCSA valuesin GB3 are included as Supporting Information). Instead, wefocus here on the 1HN CSA. 1H CSA values, expressed in ppm,are much smaller than for 13C and 15N, but experimentalknowledge of these tensors is important to gain further insightson the parameters that govern variations in 1HN isotropicchemical shifts. Moreover, 1HN CSA is key to resolutionenhancement of amide groups in multidimensional TROSYexperiments34,35 which, besides utilizing relaxation interferencebetween 15N-1HN dipolar and 15N CSA interactions for enhanc-ing 15N resolution, rely on relaxation interference between the1H-15N dipolar and 1HN CSA for increasing resolution in the1H dimension.
It has long been known that increasing hydrogen bondstrength causes a downfield 1H chemical shift, accompanied byan increase in 1H CSA.36 However, relative to 13C′ and 15N, theCSA of amide protons in peptide bonds has been studied rathersparsely.37-39 Cross-correlated relaxation rates between 1H-15Ndipolar and 1HN CSA mechanisms have been interpreted in termsof a “reduced CSA”, which does not separate the magnitude ofthe CSA tensor and its asymmetry from its orientation relativeto the amide group.40 Nevertheless, these early measurementsindicated much larger site-to-site variation in the 1HN CSA thanfor backbone 15N and 13C′. 1HN CSA values measured forubiquitin, assuming that these tensors are uniform withinR-helices and within �-sheet, indicated that the CSA tensorsare nearly fully rhombic, with the magnitude of the CSA about35% larger in �-sheet compared to R-helix.41 A more recentstudy by Loth et al. determined site-specific 1HN CSA valuesin ubiquitin from measurement of three different relaxationinterference mechanisms.16 Their study confirms that shieldingis highest in the direction parallel to the N-H bond, and lowestin the direction orthogonal to the peptide plane. Variations inisotropic chemical shifts were attributed almost entirely tovariations in this latter component. With the isotropic amide1H chemical shifts correlating closely with trans-hydrogen-bondh3JNC′ couplings,8,42 and the latter closely correlating withhydrogen bond strength and geometry,8,43 this provides anindirect link between 1HN CSA and hydrogen bonding.
With only three cross-correlated relaxation rates available todetermine the three independent parameters of the 1HN CSAtensor, when assumed to be symmetric relative to the peptideplane, Loth et al. report the precision of their 1HN CSA valuesto be considerably lower than for 13C′ and 15N.16 The presentstudy aims to get highly accurate site-specific 1HN CSA valuesby using a larger number of experimental observables (six RCSAvalues and four cross-correlated relaxation rates). Moreover, wecarry out our RCSA measurements on perdeuterated GB3, withthe backbone amides back-exchanged to become protonated.
(19) Lumsden, M. D.; Wasylishen, R. E.; Eichele, K.; Schindler, M.; Penner,G. H.; Power, W. P.; Curtis, R. D. J. Am. Chem. Soc. 1994, 116,1403–1413.
(20) Wei, Y. F.; Lee, D. K.; Ramamoorthy, A. J. Am. Chem. Soc. 2001,123, 6118–6126.
(21) Oas, T. G.; Hartzell, C. J.; McMahon, T. J.; Drobny, G. P.; Dahlquist,F. W. J. Am. Chem. Soc. 1987, 109, 5956–5962.
(22) Asakawa, N.; Kuroki, S.; Kurosu, H.; Ando, I.; Shoji, A.; Ozaki, T.J. Am. Chem. Soc. 1992, 114, 3261–3265.
(23) Markwick, P. R. L.; Sattler, M. J. Am. Chem. Soc. 2004, 126, 11424–11425.
(24) Burton, R. A.; Tjandra, N. J. Am. Chem. Soc. 2007, 129, 1321–1326.(25) Fushman, D.; Tjandra, N.; Cowburn, D. J. Am. Chem. Soc. 1998, 120,
10947–10952.(26) Damberg, P.; Jarvet, J.; Graslund, A. J. Am. Chem. Soc. 2005, 127,
1995–2005.(27) Kroenke, C. D.; Rance, M.; Palmer, A. G. J. Am. Chem. Soc. 1999,
121, 10119–10125.(28) Wylie, B. J.; Franks, W. T.; Rienstra, C. M. J. Phys. Chem. B 2006,
110, 10926–10936.(29) Yao, L.; Grishaev, A.; Cornilescu, G.; Bax, A. J. Am. Chem. Soc.
2010, 132, 4295–4309.(30) Walling, A. E.; Pargas, R. E.; deDios, A. C. J. Phys. Chem. A 1997,
101, 7299–7303.(31) Bader, R. J. Phys. Chem. B 2009, 113, 347–358.(32) Benda, L.; Bour, P.; Muller, N.; Sychrovsky, V. J. Phys. Chem. B
2009, 113, 5273–5281.(33) Yao, L. S.; Bax, A. J. Am. Chem. Soc. 2007, 129, 11326–11327.
(34) Pervushin, K.; Riek, R.; Wider, G.; Wuthrich, K. Proc. Natl. Acad.Sci. U.S.A. 1997, 94, 12366–12371.
(35) Salzmann, M.; Wider, G.; Pervushin, K.; Senn, H.; Wuthrich, K. J. Am.Chem. Soc. 1999, 121, 844–848.
(36) Berglund, B.; Vaughan, R. W. J. Chem. Phys. 1980, 73, 2037–2043.(37) Reimer, J. A.; Vaughan, R. W. J. Magn. Reson. 1980, 41, 483–491.(38) Wu, C. H.; Ramamoorthy, A.; Gierasch, L. M.; Opella, S. J. J. Am.
Chem. Soc. 1995, 117, 6148–6149.(39) Gerald, R.; Bernhard, T.; Haeberlen, U.; Rendell, J.; Opella, S. J. Am.
Chem. Soc. 1993, 115, 777–782.(40) Tjandra, N.; Bax, A. J. Am. Chem. Soc. 1997, 119, 8076–8082.(41) Cornilescu, G.; Bax, A. J. Am. Chem. Soc. 2000, 122, 10143–10154.(42) Cordier, F.; Grzesiek, S. J. Am. Chem. Soc. 1999, 121, 1601–1602.(43) Cornilescu, G.; Ramirez, B. E.; Frank, M. K.; Clore, G. M.;
Gronenborn, A. M.; Bax, A. J. Am. Chem. Soc. 1999, 121, 6275–6279.
J. AM. CHEM. SOC. 9 VOL. 132, NO. 31, 2010 10867
Amide 1H Chemical Shift Anisotropy in a Small Protein A R T I C L E S
The use of deuteration removes the impact from remote protonsthat can otherwise interfere with the precise measurement ofRCSAs. Our experimental data are of a quality that is sufficientto permit fitting of the individual 1HN CSA tensors in GB3without the assumption of symmetry with respect to the peptideplane, i.e., using five adjustable parameters. Correlationsbetween our experimentally determined 1HN CSA values andthe local structure in GB3, together with DFT calculations onN-methyl acetamide (NMA) H-bonded to acetamide, are thenused to gain a more quantitative understanding of the relationbetween hydrogen-bond geometry and 1HN CSA.
Materials and Methods
NMR Spectroscopy. The experimental data used for determining1HN CSA values consisted of RCSA measurements on six GB3mutants that align differently relative to the magnetic field in aliquid crystalline Pf1 suspension, complemented by four cross-correlated relaxation experiments. The 1HN RCSA values wereextracted from the same 3D spectra previously used for 15N RCSAmeasurement, and experimental details regarding the collection andanalysis of this data have been described previously.29 In brief,the 1HN chemical shifts were measured in the 1H dimension of a3D HNCO experiment, carried out for each mutant in a liquidcrystalline Pf1 suspension, once under static conditions and onceunder slow magic angle spinning (∼600 Hz). The latter destroysany average order of the liquid crystal relative to the magnetic fieldand thereby removes any net RDC and RCSA contributions causedby interaction between the Pf1 and GB3, without complicationscaused by small chemical shift changes that could potentially resultfrom changes in the sample and buffer composition. The impactof small differences in temperature on the 1H chemical shiftsbetween the static and MAS HNCO spectra was accounted for, aposteriori, by evaluating the correlation between observed chemicalshift changes and the measured temperature coefficients of 1HN,15N, and 13C′.29
A sample containing 4 mM of the GB3 mutant T11K K19AV42E, uniformly enriched in 15N,13C, and 2H, and dissolved in 25mM sodium phosphate buffer, pH 6.5, 50 mM NaCl, 0.05% w/vNaN3, was used to measure the cross-correlated relaxation ratesbetween 1HN CSA and 1H-15N as well as 1H-13C′ and 1H-13CR
dipolar interactions. NMR experiments were carried out on Brukerspectrometers operating at 500 and 600 MHz and equipped withz-axis gradient, triple resonance, cryogenic probeheads.
1HN transverse cross-correlated relaxation rates were measuredfor perdeuterated GB3 mutant T11K K19A V42E (but with a smallamount of residual protonation resulting from the use of protonatedglucose in the 99% D2O growth medium) for the followinginteractions: 1HN CSA/HN-N dipole-dipole (ΓCSA,HN); 1HN
i CSA/HN
i-C′i-1 (where the subscript refers to the residue number onwhich the atom resides) dipole-dipole (ΓCSA,HC′); 1HN
i CSA/HN
i-CRi dipole-dipole (intraresidue ΓCSA,HCRi); 1HN
i CSA/HN
i-CRi-1 dipole-dipole (sequential ΓCSA,HCRi-1). Experiments used
to measure these rates are all based on the 1H-detected 1H-15NHSQC pulse sequence,44 and mostly employ pulse schemes similarto those described by Loth et al.16 For measurement of ΓCSA,HN, atransverse relaxation delay of duration T was inserted between 90°(1H,15N) pulses that transfer magnetization back from 15N to 1Hand the start of the 1H acquisition, in the absence of 15N decouplingduring T and the subsequent 1H acquisition period (SupportingInformation (SI), Figure S1). The two 1HN-{15N} doublet com-ponents, separated by 1JHN, relax at rates governed by the sum andthe difference of the 1HN CSA and 15N-1HN dipolar interaction.Durations of T were: 10, 30, 50, 70, 90, 110, 130, and 150 ms.Acquisition times were 150 (15N) and 160 ms (1H), with datamatrices consisting of 200* × 1536* points, where N* refers to Ncomplex data points.
Measurement of ΓCSA,HC′ is carried out using the pulse schemeof Figure S2 (SI), which relies on the E.COSY effect to separatethe 1HN-[13C′i-1] doublet components. If HxC′zNz terms were todevelop during the spin-echo relaxation delay (i.e., if no 15Ndecoupling were used), longitudinal cross-correlated relaxationbetween the 15N CSA and the 15N-13C′ dipolar interaction wouldcontribute to the decay rate of the detected 1HN magnetization. Toremove the effects from this longitudinal 15N CSA/15N-13C′i-1relaxation interference, composite pulse 15N decoupling was appliedduring the relaxation delay, T. Durations of T were 2, 30, 50, 70,90, 110, 130, and 150 ms; acquisition times and data matrices werethe same as for the ΓCSA,NH measurements, above.
Measurement of intraresidue ΓCSA,HCRi and sequential ΓCSA,HCRi-1
rates was carried out with the pulse sequence of Figure S3 (SI),briefly discussed in the Results and Discussion section. Durationsof the relaxation delays T were: 2, 30, 50, 70, 90, 110, 130, and150 ms. Acquisition times were 300 (15N) and 125 (1H) ms, withdata matrices consisting of 400* × 1200* points.
All spectra were processed and analyzed using the softwarepackage NMRPipe.45 Peak positions and intensities were determinedby parabolic interpolation. Apparent relaxation rates were deter-mined from two-parameter exponential fits of peak intensities. Thecross-correlated relaxation rates ΓCSA,HN (ΓCSA,HC′) were calculatedfrom the apparent relaxation rate difference when the 15N (13C′),involved in the dipolar coupling term, is in the |R⟩ or |�⟩ spin state.The ΓCSA,HCRi and ΓCSA,HCRi-1 were calculated using the followingequations
where the first and the second superscript denotes the respectivespin state of the preceding and intraresidue 13CR nucleus, and R2 isthe relaxation rate determined from the exponential fit.
Quantum Chemical Calculations. Two alanine dipeptide frag-ments (HCO(NHCHCH3CO)2H) were built with backbone torsionangles corresponding to those of E24-T25 and L5-V6 in the NMR-refined X-ray structure (PDB entry 2OED),46 where the first pairis taken from GB3′s R-helix, and the second pair has typical �-sheetbackbone torsion angles. Calculations on these fragments were usedto evaluate the impact of backbone torsion angles on 1HN CSA inthe absence of hydrogen bonding.
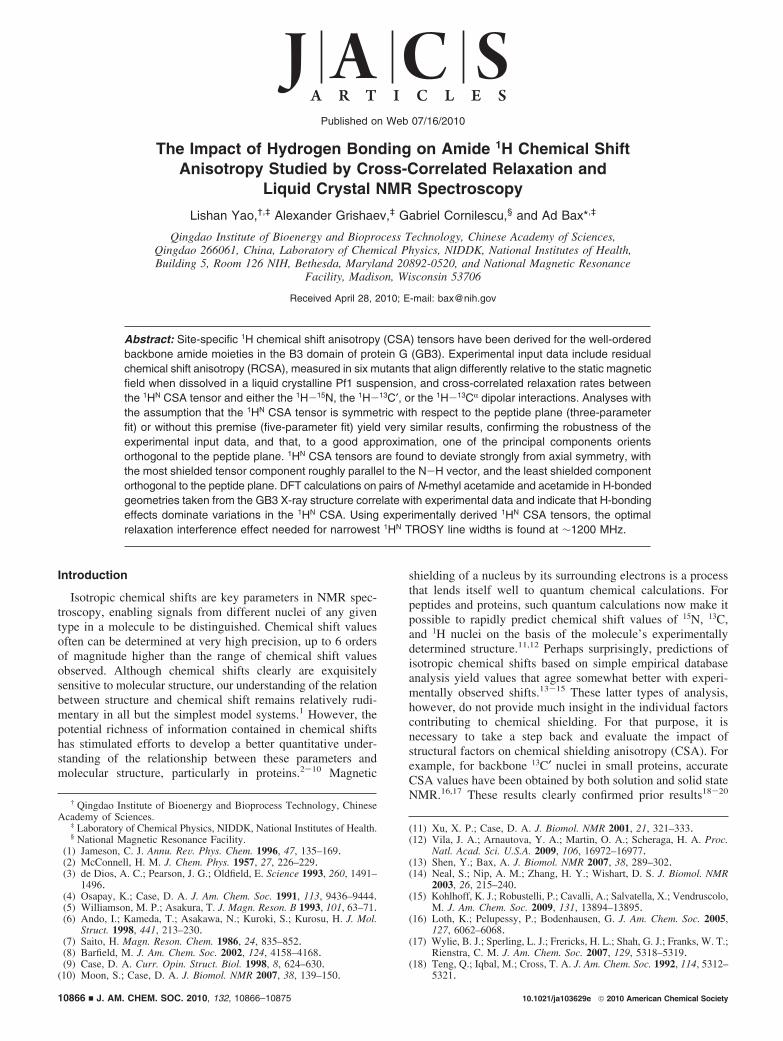
N-Methyl acetamide (NMA) H-bonded to acetamide was usedto systematically study the effect of hydrogen bonding on the amide1HN CSA. Six geometrical parameters (dOH, R1, R2, R3, θ1, θ2) definethe position of acetamide relative to NMA (Figure 1). To explorethe impact of dOH on 1HN CSA, the distance was stepped from 1.8
(44) Bodenhausen, G.; Ruben, D. J. Chem. Phys. Lett. 1980, 69, 185–189.
(45) Delaglio, F.; Grzesiek, S.; Vuister, G. W.; Zhu, G.; Pfeifer, J.; Bax,A. J. Biomol. NMR 1995, 6, 277–293.
(46) Ulmer, T. S.; Ramirez, B. E.; Delaglio, F.; Bax, A. J. Am. Chem.Soc. 2003, 125, 9179–9191.
Figure 1. Diagram of N-methyl acetamide hydrogen bonded to acetamide,depicting the geometric parameters used in this study. dOH denotes thedistance between H and O atoms, (θ1, θ2) denote the angles ∠N-H-Oand ∠H-O-C, (R1, R2, R3) are the dihedral angles C-N-H-O,N-H-O-C, H-O-C-CH3.
ΓCSA,HCRi-1 ) (R2RR - R2
�R + R2R� - R2
��)/4 (1a)
ΓCSA,HCRi ) (R2RR - R2
R� + R2�R - R2
��)/4 (1b)
10868 J. AM. CHEM. SOC. 9 VOL. 132, NO. 31, 2010
A R T I C L E S Yao et al.
to 2.6 Å (1.8, 1.9, 2.0, 2.1, 2.2, 2.4 and 2.6), with the other 5 degreesof freedom constrained by (θ1, θ2) at 180° and (R1, R2, R3) at 0°.
The 1H CSA of 34 NMA-acetamide model systems was alsocalculated, with H-bond geometrical parameters corresponding tothose of the 34 backbone-backbone H-bonds in the experimentalGB3 structure. All models were geometry optimized at the B3LYP/6-311+G** level47 while constraining (dOH, R1, R2, R3, θ1, θ2) tothe experimental values of the 2OED PDB entry46 and the distancebetween the H-bond-donating N and H-bond-accepting O atomfixed. Chemical shielding tensors were calculated using the GIAOmethod48,49 at the B3LYP/aug-cc-pvtz level.50 The chemical shifttensor, which includes the isotropic contribution, δisotropic, wascomputed as δii ) δisotropic - σii (i ) X, Y, Z), where δisotropic is32.775 ppm,51 the absolute chemical shift of TMS at 298 K, andσii are the calculated CSA tensor principal components.
Results and Discussion
RDC and RCSA. In order to derive the residue-specific 1HN
CSA tensors from RCSA data recorded for the previouslystudied six GB3 mutants, which align differently relative to themagnetic field, the corresponding protein alignment tensors weredetermined by best fitting RDCs to the known experimentalstructure.52 For this purpose, one-bond 1H-15N RDCs, 1DNH,were extracted from HNCO experiments, recorded in theabsence of 1H decoupling during 15N evolution. For 52 out ofa total of 56 residues, 1DNH couplings could be measured athigh accuracy for all six mutants. With the exception of thehighly mobile residue G41, SECONDA analysis53 of the RDCsshowed the data to be highly self-consistent (Figure S4 (SI)).This result indicates that the backbone structure and dynamicsof the six mutants, as reflected in their 1DNH couplings, do notdiffer substantially between the different mutants. Singular valuedecomposition (SVD) was used to evaluate the degree ofindependence of the six sets of RDCs, excluding G41. Consistentwith our earlier findings,33,54 the six GB3 mutants aligned in
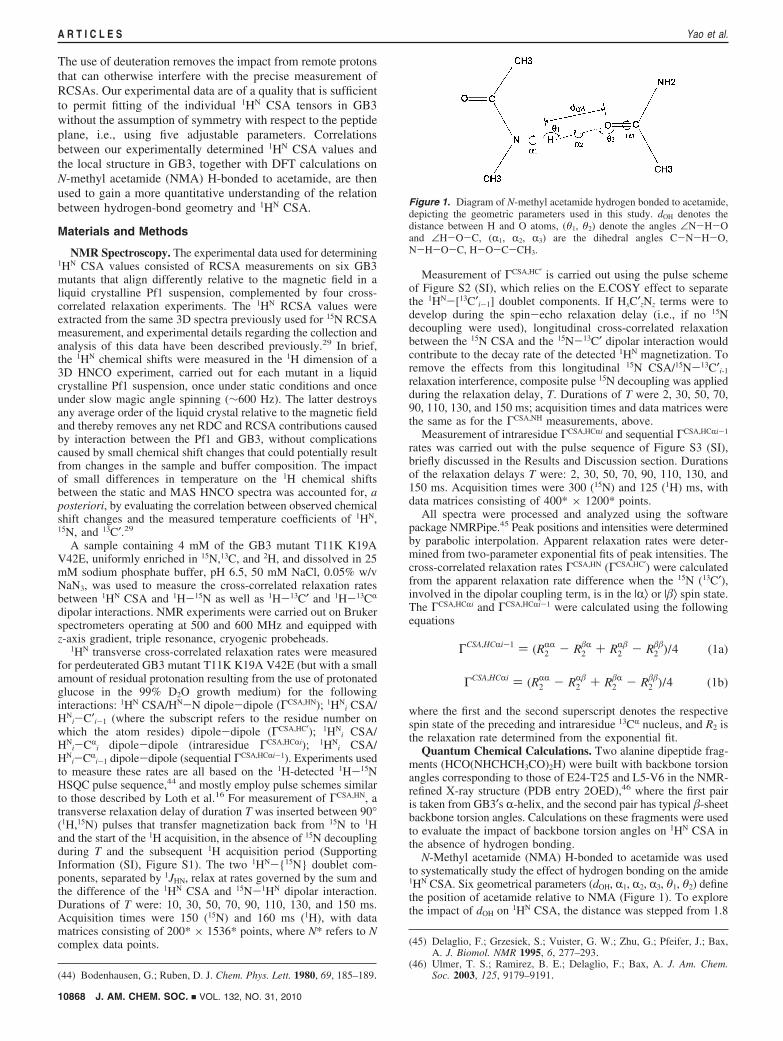
Pf1 span the entire five-dimensional (5D) alignment space(Figure 2A) with a ratio between the fifth and sixth singularvalue of 7.4, where the last mode is primarily noise frommeasurement error.
With molecular orientations covering the entire 5D alignmentspace, in principle the five components of each 1HN CSA tensorcan be derived directly from the RCSA values measured forthe six mutants. However, the relative accuracy of 1HN RCSAis considerably lower than for 1DNH couplings, and a SVDanalysis of the six sets of RCSAs (Figure 2B) shows a ratiobetween the fifth and sixth component of only 2.3, suggestingthat for the fifth alignment (after decomposing alignments inthe orthogonal 5D alignment space), RCSA values are not muchabove the measurement noise represented by the sixth SVDvalue. Addition of random, Gaussian distributed noise to GB3amides RCSA values predicted for each of the six alignments,using 1HN CSA tensor parameters taken from our earlier study,41
yields a similar ratio between the fifth and sixth SVD valuewhen the noise amplitude is adjusted to 1.0 ppb. This 1.0 ppbvalue therefore corresponds to the estimated error for ourexperimental 1HN RCSA values. With typical experimentalRCSA values falling in the (10 ppb range (Table S1 (SI)), therelative large RCSA measurement error propagates to substantialrandom error in the extracted 1HN CSA tensors, which isindistinguishable from the intrinsic residue-by-residue variabilitywe aim to study. To improve the 1HN CSA accuracy, additionalCSA-dependent parameters therefore need to be measured andincluded in the CSA fitting procedure.
Transverse 1H CSA Dipolar Cross-Correlated RelaxationRates. Transverse cross-correlated relaxation rates between the1HN CSA and four different dipolar couplings involving 1HN
were measured, including 1H-15N (ΓCSA,HN), intraresidue1HN-13CR (ΓCSA,HCRi), as well as dipolar couplings to 13C′(ΓCSA,HC′) and 13CR (ΓCSA,HCRi-1) on the preceding residue. Thesecross-correlated relaxation rates were derived from the differencein relaxation rates of the transverse 1H spin operator when theX nucleus is in the |R⟩ and |�⟩ spin states. For the ΓCSA,HN
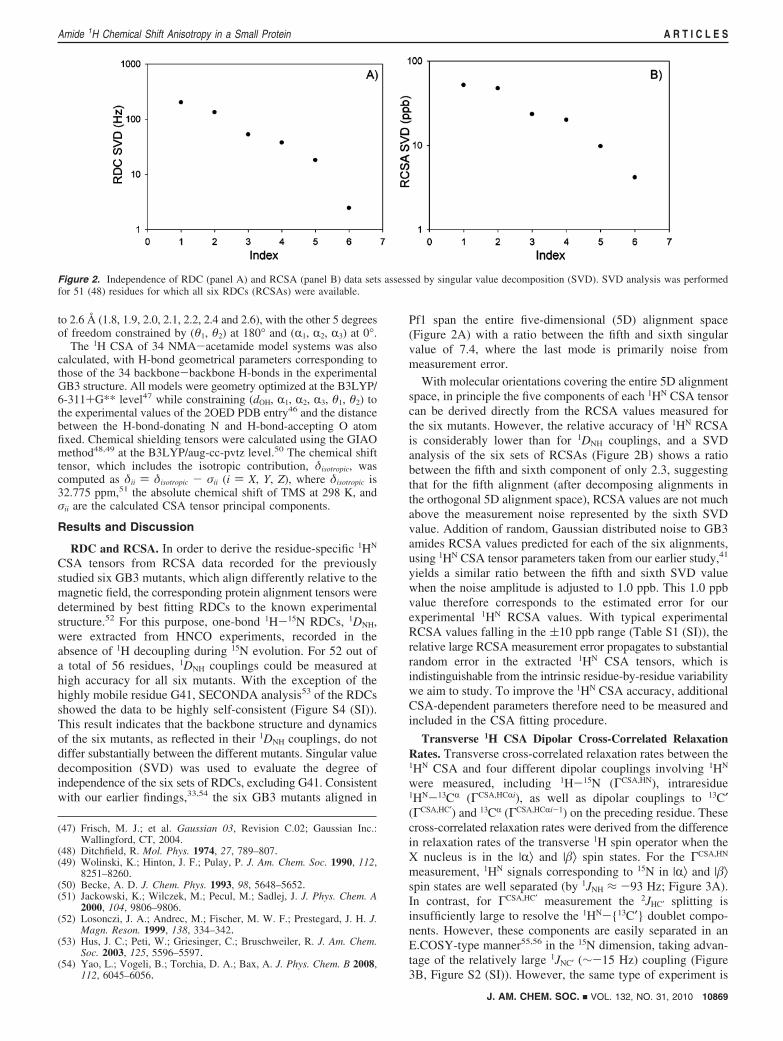
measurement, 1HN signals corresponding to 15N in |R⟩ and |�⟩spin states are well separated (by 1JNH ≈ -93 Hz; Figure 3A).In contrast, for ΓCSA,HC′ measurement the 2JHC′ splitting isinsufficiently large to resolve the 1HN-{13C′} doublet compo-nents. However, these components are easily separated in anE.COSY-type manner55,56 in the 15N dimension, taking advan-tage of the relatively large 1JNC′ (∼-15 Hz) coupling (Figure3B, Figure S2 (SI)). However, the same type of experiment is
(47) Frisch, M. J.; et al. Gaussian 03, Revision C.02; Gaussian Inc.:Wallingford, CT, 2004.
(48) Ditchfield, R. Mol. Phys. 1974, 27, 789–807.(49) Wolinski, K.; Hinton, J. F.; Pulay, P. J. Am. Chem. Soc. 1990, 112,
8251–8260.(50) Becke, A. D. J. Chem. Phys. 1993, 98, 5648–5652.(51) Jackowski, K.; Wilczek, M.; Pecul, M.; Sadlej, J. J. Phys. Chem. A
2000, 104, 9806–9806.(52) Losonczi, J. A.; Andrec, M.; Fischer, M. W. F.; Prestegard, J. H. J.
Magn. Reson. 1999, 138, 334–342.(53) Hus, J. C.; Peti, W.; Griesinger, C.; Bruschweiler, R. J. Am. Chem.
Soc. 2003, 125, 5596–5597.(54) Yao, L.; Vogeli, B.; Torchia, D. A.; Bax, A. J. Phys. Chem. B 2008,
112, 6045–6056.
Figure 2. Independence of RDC (panel A) and RCSA (panel B) data sets assessed by singular value decomposition (SVD). SVD analysis was performedfor 51 (48) residues for which all six RDCs (RCSAs) were available.
J. AM. CHEM. SOC. 9 VOL. 132, NO. 31, 2010 10869
Amide 1H Chemical Shift Anisotropy in a Small Protein A R T I C L E S
insufficient for ΓCSA,HCRi and ΓCSA,HCRi-1 measurement becausethe smaller 1JNCR and 2JNCR couplings result in generallyunresolvable doublet-of-doublet signals for each 13CR-coupled1H-15N correlation (Figure 3C). Instead, we developed aninterleaved in-phase and anti-phase (with respect to CR
i-1) 2D-HN(CO) type experiment, recorded with and without 13CR
decoupling during a (2JCRC′)-1 fraction of the pulse sequence(Figure S3 (SI)). This procedure generates doublets of doubletsthat are in-phase with respect to both 13CR
i-1 and 13CRi, or anti-
phase with respect to 13CRi-1 but in-phase with respect to 13CR
i
(Figure 3C). By taking the sum or the difference of the in-phaseand anti-phase spectra, clean separation into two separatedoublets is obtained (Figure 3C), permitting measurement ofthe ΓCSA,HCRi and ΓCSA,HCRi-1 relaxation rates.
The cross-correlated relaxation rates are plotted in Figure 4.After excluding the residues found to have the lowest-orderparameters in the earlier relaxation study by Hall and Fushman,57
including Q2, K10-E15, A20, D40-G41, and A48, and tworesidues (T25; E27) due to partial resonance overlap, the averageΓCSA,HN is 1.58 ( 0.40 s-1. The average ΓCSA,HC′ is smaller inmagnitude, -0.30 ( 0.09 s-1, the latter being comparable to⟨ΓCSA,HCRi⟩ ) -0.39 ( 0.10 s-1; near-zero values are measuredfor ΓCSA,HCRi-1 (⟨ΓCSA,HCRi-1⟩ ) 0.02 ( 0.04 s-1). In part, thedifferences in average magnitude are caused by the difference indipolar coupling for the four types of cross-correlation effects, buteven after taking this into account the averages of the four typesof cross-correlation rates remain quite different in average mag-nitude (Figure 4), reflecting the orientation of the correspondingdipolar vector in the frame of the 1HN CSA tensor. For all fourtypes of cross-correlation rates, the variation seen in Γ values is(55) Griesinger, C.; Sørensen, O. W.; Ernst, R. R. J. Magn. Reson. 1987,
75, 474–492.(56) Delaglio, F.; Torchia, D. A.; Bax, A. J. Biomol. NMR 1991, 1, 439–
446. (57) Hall, J. B.; Fushman, D. J. Biomol. NMR 2003, 27, 261–275.
Figure 3. Small regions extracted from transverse 1HN CSA/1HN-X dipolar cross-correlated relaxation rate measurements, recorded at 600 MHz 1H frequency.(A) ΓCSA,HN (1HN CSA/1HN-15N dipole), (B) ΓCSA,HC′ (1HN CSA/1HN-13C′ dipole), (C) ΓCSA,HCRi (1HN CSA/1HN-intra 13CR dipole), ΓCSA,HCRi-1 (1HN CSA/1HN-preceding 13CR dipole). In (A), cyan and black contours represent the positive and negative intensities, corresponding to 15N in |R⟩ and |�⟩ spin states.In (B), the E.COSY mechanism separates 1HN signals with 13C′ in |R⟩ and |�⟩ spin states. In (C), two interleaved experiments corresponding to spectra thatare in-phase and anti-phase with respect to the preceding 13CR
i-1 were used to separate the doublet of doublets caused by intra 2JHCR (1JNCR) and sequential3JHCR (2JNCR) couplings. The spectra corresponding to blue and red contours are obtained by adding and subtracting the anti-phase spectrum to/fromthe in-phase spectrum, respectively, as illustrated in the inset for V39. Relaxation rates were measured with the pulse schemes of Figures S1, S2, andS3 (SI).
10870 J. AM. CHEM. SOC. 9 VOL. 132, NO. 31, 2010
A R T I C L E S Yao et al.
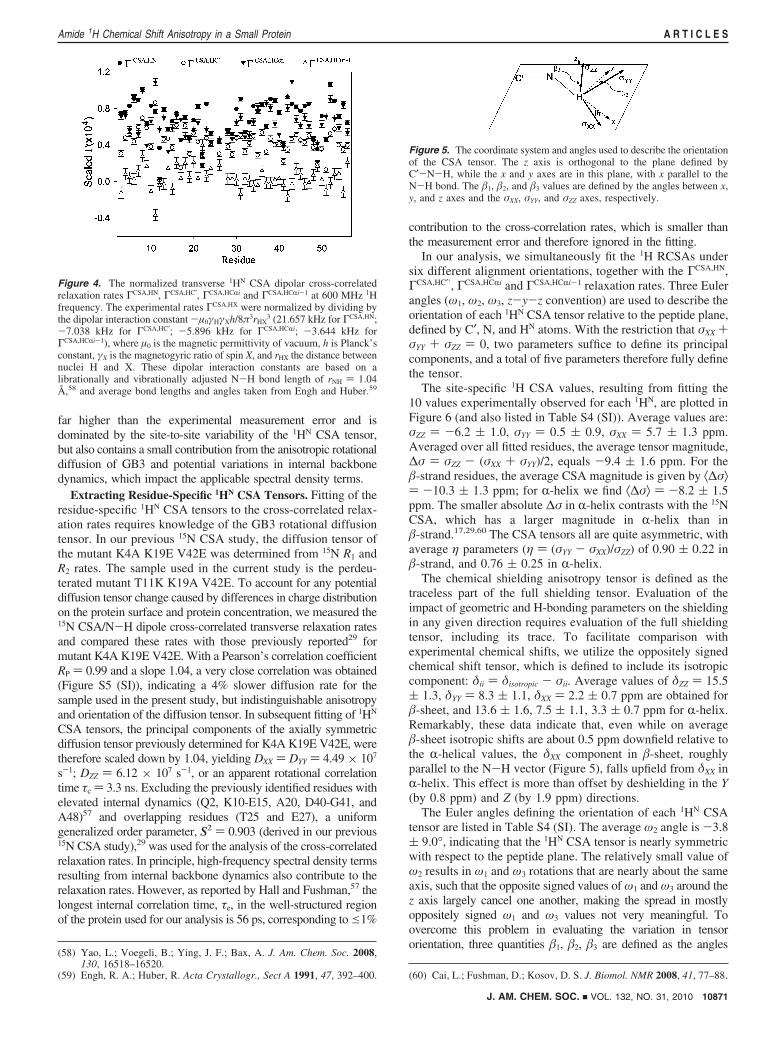
far higher than the experimental measurement error and isdominated by the site-to-site variability of the 1HN CSA tensor,but also contains a small contribution from the anisotropic rotationaldiffusion of GB3 and potential variations in internal backbonedynamics, which impact the applicable spectral density terms.
Extracting Residue-Specific 1HN CSA Tensors. Fitting of theresidue-specific 1HN CSA tensors to the cross-correlated relax-ation rates requires knowledge of the GB3 rotational diffusiontensor. In our previous 15N CSA study, the diffusion tensor ofthe mutant K4A K19E V42E was determined from 15N R1 andR2 rates. The sample used in the current study is the perdeu-terated mutant T11K K19A V42E. To account for any potentialdiffusion tensor change caused by differences in charge distributionon the protein surface and protein concentration, we measured the15N CSA/N-H dipole cross-correlated transverse relaxation ratesand compared these rates with those previously reported29 formutant K4A K19E V42E. With a Pearson’s correlation coefficientRP ) 0.99 and a slope 1.04, a very close correlation was obtained(Figure S5 (SI)), indicating a 4% slower diffusion rate for thesample used in the present study, but indistinguishable anisotropyand orientation of the diffusion tensor. In subsequent fitting of 1HN
CSA tensors, the principal components of the axially symmetricdiffusion tensor previously determined for K4A K19E V42E, weretherefore scaled down by 1.04, yielding DXX ) DYY ) 4.49 × 10⁷
s-1; DZZ ) 6.12 × 10⁷ s-1, or an apparent rotational correlationtime τc ) 3.3 ns. Excluding the previously identified residues withelevated internal dynamics (Q2, K10-E15, A20, D40-G41, andA48)57 and overlapping residues (T25 and E27), a uniformgeneralized order parameter, S2 ) 0.903 (derived in our previous15N CSA study),29 was used for the analysis of the cross-correlatedrelaxation rates. In principle, high-frequency spectral density termsresulting from internal backbone dynamics also contribute to therelaxation rates. However, as reported by Hall and Fushman,57 thelongest internal correlation time, τe, in the well-structured regionof the protein used for our analysis is 56 ps, corresponding toe1%
contribution to the cross-correlation rates, which is smaller thanthe measurement error and therefore ignored in the fitting.
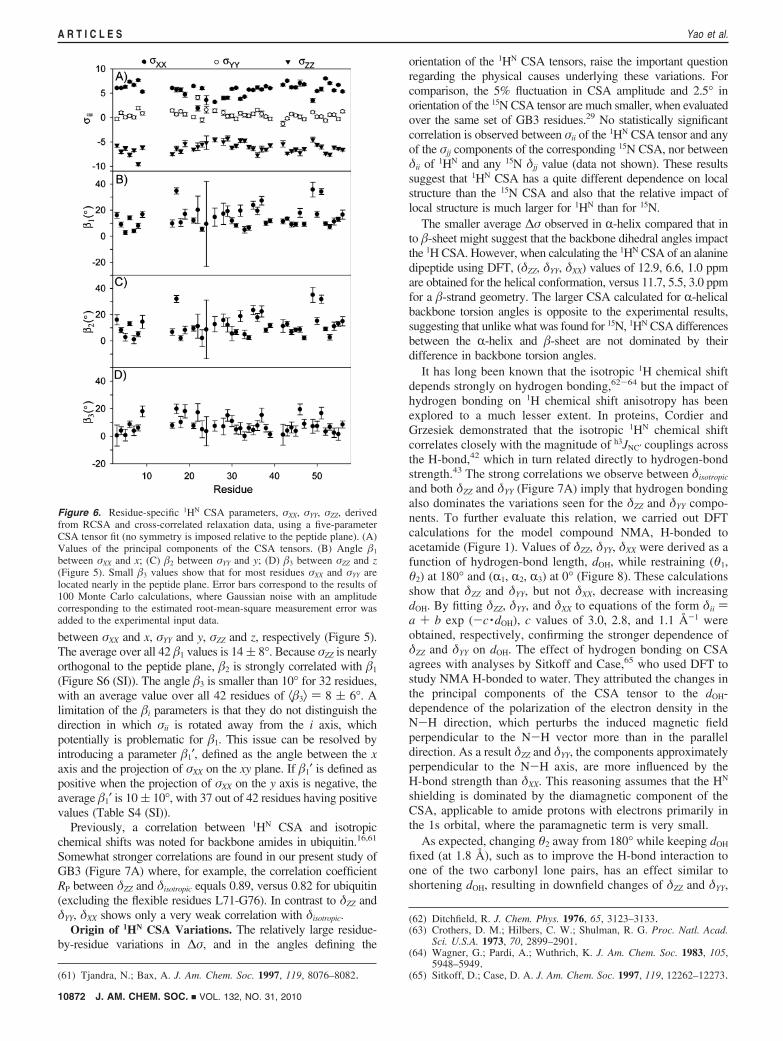
In our analysis, we simultaneously fit the 1H RCSAs undersix different alignment orientations, together with the ΓCSA,HN,ΓCSA,HC′’, ΓCSA,HCRi and ΓCSA,HCRi-1 relaxation rates. Three Eulerangles (ω1, ω2, ω3, z-y-z convention) are used to describe theorientation of each 1HN CSA tensor relative to the peptide plane,defined by C′, N, and HN atoms. With the restriction that σXX +σYY + σZZ ) 0, two parameters suffice to define its principalcomponents, and a total of five parameters therefore fully definethe tensor.
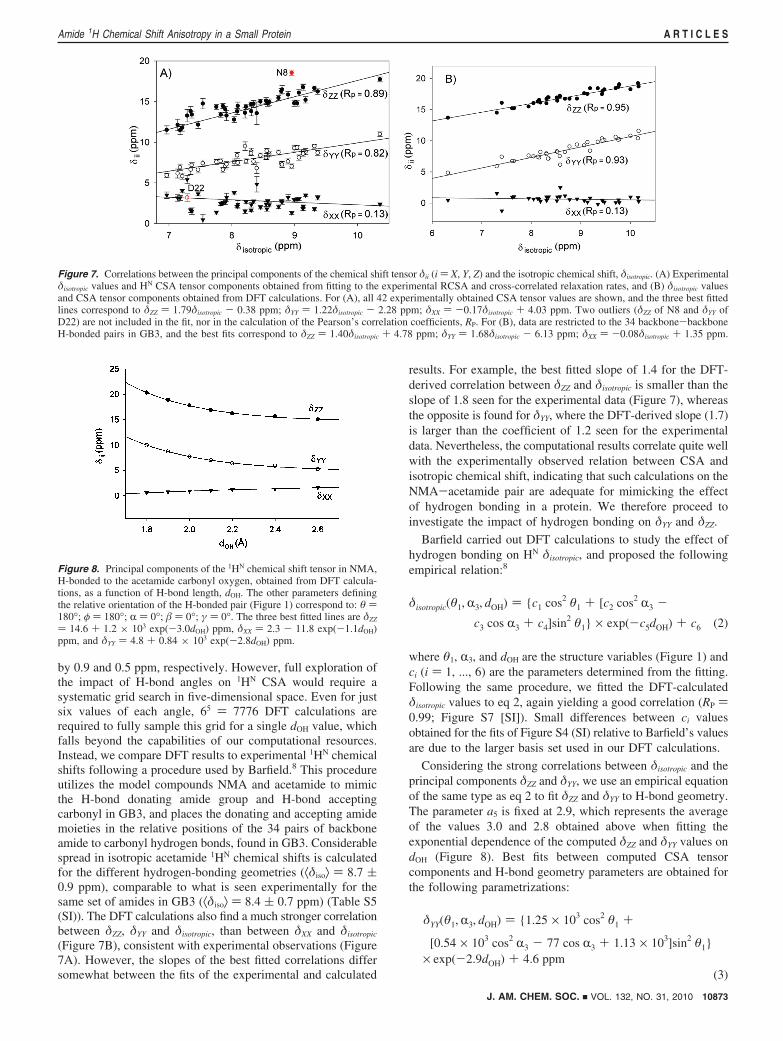
The site-specific 1H CSA values, resulting from fitting the10 values experimentally observed for each 1HN, are plotted inFigure 6 (and also listed in Table S4 (SI)). Average values are:σZZ ) -6.2 ( 1.0, σYY ) 0.5 ( 0.9, σXX ) 5.7 ( 1.3 ppm.Averaged over all fitted residues, the average tensor magnitude,∆σ ) σZZ - (σXX + σYY)/2, equals -9.4 ( 1.6 ppm. For the�-strand residues, the average CSA magnitude is given by ⟨∆σ⟩) -10.3 ( 1.3 ppm; for R-helix we find ⟨∆σ⟩ ) -8.2 ( 1.5ppm. The smaller absolute ∆σ in R-helix contrasts with the 15NCSA, which has a larger magnitude in R-helix than in�-strand.17,29,60 The CSA tensors all are quite asymmetric, withaverage η parameters (η ) (σYY - σXX)/σZZ) of 0.90 ( 0.22 in�-strand, and 0.76 ( 0.25 in R-helix.
The chemical shielding anisotropy tensor is defined as thetraceless part of the full shielding tensor. Evaluation of theimpact of geometric and H-bonding parameters on the shieldingin any given direction requires evaluation of the full shieldingtensor, including its trace. To facilitate comparison withexperimental chemical shifts, we utilize the oppositely signedchemical shift tensor, which is defined to include its isotropiccomponent: δii ) δisotropic - σii. Average values of δZZ ) 15.5( 1.3, δYY ) 8.3 ( 1.1, δXX ) 2.2 ( 0.7 ppm are obtained for�-sheet, and 13.6 ( 1.6, 7.5 ( 1.1, 3.3 ( 0.7 ppm for R-helix.Remarkably, these data indicate that, even while on average�-sheet isotropic shifts are about 0.5 ppm downfield relative tothe R-helical values, the δXX component in �-sheet, roughlyparallel to the N-H vector (Figure 5), falls upfield from δXX inR-helix. This effect is more than offset by deshielding in the Y(by 0.8 ppm) and Z (by 1.9 ppm) directions.
The Euler angles defining the orientation of each 1HN CSAtensor are listed in Table S4 (SI). The average ω2 angle is -3.8( 9.0°, indicating that the 1HN CSA tensor is nearly symmetricwith respect to the peptide plane. The relatively small value ofω2 results in ω1 and ω3 rotations that are nearly about the sameaxis, such that the opposite signed values of ω1 and ω3 around thez axis largely cancel one another, making the spread in mostlyoppositely signed ω1 and ω3 values not very meaningful. Toovercome this problem in evaluating the variation in tensororientation, three quantities �1, �2, �3 are defined as the angles
(58) Yao, L.; Voegeli, B.; Ying, J. F.; Bax, A. J. Am. Chem. Soc. 2008,130, 16518–16520.
(59) Engh, R. A.; Huber, R. Acta Crystallogr., Sect A 1991, 47, 392–400. (60) Cai, L.; Fushman, D.; Kosov, D. S. J. Biomol. NMR 2008, 41, 77–88.
Figure 4. The normalized transverse 1HN CSA dipolar cross-correlatedrelaxation rates ΓCSA,HN, ΓCSA,HC′, ΓCSA,HCRi and ΓCSA,HCRi-1 at 600 MHz 1Hfrequency. The experimental rates ΓCSA,HX were normalized by dividing bythe dipolar interaction constant -µ0γHγXh/8π3rHX
3 (21.657 kHz for ΓCSA,HN;-7.038 kHz for ΓCSA,HC′; -5.896 kHz for ΓCSA,HCRi; -3.644 kHz forΓCSA,HCRi-1), where µ0 is the magnetic permittivity of vacuum, h is Planck’sconstant, γX is the magnetogyric ratio of spin X, and rHX the distance betweennuclei H and X. These dipolar interaction constants are based on alibrationally and vibrationally adjusted N-H bond length of rNH ) 1.04Å,58 and average bond lengths and angles taken from Engh and Huber.59
Figure 5. The coordinate system and angles used to describe the orientationof the CSA tensor. The z axis is orthogonal to the plane defined byC′-N-H, while the x and y axes are in this plane, with x parallel to theN-H bond. The �1, �2, and �3 values are defined by the angles between x,y, and z axes and the σXX, σYY, and σZZ axes, respectively.
J. AM. CHEM. SOC. 9 VOL. 132, NO. 31, 2010 10871
Amide 1H Chemical Shift Anisotropy in a Small Protein A R T I C L E S
between σXX and x, σYY and y, σZZ and z, respectively (Figure 5).The average over all 42 �1 values is 14 ( 8°. Because σZZ is nearlyorthogonal to the peptide plane, �2 is strongly correlated with �1
(Figure S6 (SI)). The angle �3 is smaller than 10° for 32 residues,with an average value over all 42 residues of ⟨�3⟩ ) 8 ( 6°. Alimitation of the �i parameters is that they do not distinguish thedirection in which σii is rotated away from the i axis, whichpotentially is problematic for �1. This issue can be resolved byintroducing a parameter �1′, defined as the angle between the xaxis and the projection of σXX on the xy plane. If �1′ is defined aspositive when the projection of σXX on the y axis is negative, theaverage �1′ is 10 ( 10°, with 37 out of 42 residues having positivevalues (Table S4 (SI)).
Previously, a correlation between 1HN CSA and isotropicchemical shifts was noted for backbone amides in ubiquitin.16,61
Somewhat stronger correlations are found in our present study ofGB3 (Figure 7A) where, for example, the correlation coefficientRP between δZZ and δisotropic equals 0.89, versus 0.82 for ubiquitin(excluding the flexible residues L71-G76). In contrast to δZZ andδYY, δXX shows only a very weak correlation with δisotropic.
Origin of 1HN CSA Variations. The relatively large residue-by-residue variations in ∆σ, and in the angles defining the
orientation of the 1HN CSA tensors, raise the important questionregarding the physical causes underlying these variations. Forcomparison, the 5% fluctuation in CSA amplitude and 2.5° inorientation of the 15N CSA tensor are much smaller, when evaluatedover the same set of GB3 residues.29 No statistically significantcorrelation is observed between σii of the 1HN CSA tensor and anyof the σjj components of the corresponding 15N CSA, nor betweenδii of 1HN and any 15N δjj value (data not shown). These resultssuggest that 1HN CSA has a quite different dependence on localstructure than the 15N CSA and also that the relative impact oflocal structure is much larger for 1HN than for 15N.
The smaller average ∆σ observed in R-helix compared that into �-sheet might suggest that the backbone dihedral angles impactthe 1H CSA. However, when calculating the 1HN CSA of an alaninedipeptide using DFT, (δZZ, δYY, δXX) values of 12.9, 6.6, 1.0 ppmare obtained for the helical conformation, versus 11.7, 5.5, 3.0 ppmfor a �-strand geometry. The larger CSA calculated for R-helicalbackbone torsion angles is opposite to the experimental results,suggesting that unlike what was found for 15N, 1HN CSA differencesbetween the R-helix and �-sheet are not dominated by theirdifference in backbone torsion angles.
It has long been known that the isotropic 1H chemical shiftdepends strongly on hydrogen bonding,62-64 but the impact ofhydrogen bonding on 1H chemical shift anisotropy has beenexplored to a much lesser extent. In proteins, Cordier andGrzesiek demonstrated that the isotropic 1HN chemical shiftcorrelates closely with the magnitude of h3JNC′ couplings acrossthe H-bond,42 which in turn related directly to hydrogen-bondstrength.43 The strong correlations we observe between δisotropic
and both δZZ and δYY (Figure 7A) imply that hydrogen bondingalso dominates the variations seen for the δZZ and δYY compo-nents. To further evaluate this relation, we carried out DFTcalculations for the model compound NMA, H-bonded toacetamide (Figure 1). Values of δZZ, δYY, δXX were derived as afunction of hydrogen-bond length, dOH, while restraining (θ1,θ2) at 180° and (R1, R2, R3) at 0° (Figure 8). These calculationsshow that δZZ and δYY, but not δXX, decrease with increasingdOH. By fitting δZZ, δYY, and δXX to equations of the form δii )a + b exp (-c ·dOH), c values of 3.0, 2.8, and 1.1 Å-1 wereobtained, respectively, confirming the stronger dependence ofδZZ and δYY on dOH. The effect of hydrogen bonding on CSAagrees with analyses by Sitkoff and Case,65 who used DFT tostudy NMA H-bonded to water. They attributed the changes inthe principal components of the CSA tensor to the dOH-dependence of the polarization of the electron density in theN-H direction, which perturbs the induced magnetic fieldperpendicular to the N-H vector more than in the paralleldirection. As a result δZZ and δYY, the components approximatelyperpendicular to the N-H axis, are more influenced by theH-bond strength than δXX. This reasoning assumes that the HN
shielding is dominated by the diamagnetic component of theCSA, applicable to amide protons with electrons primarily inthe 1s orbital, where the paramagnetic term is very small.
As expected, changing θ2 away from 180° while keeping dOH
fixed (at 1.8 Å), such as to improve the H-bond interaction toone of the two carbonyl lone pairs, has an effect similar toshortening dOH, resulting in downfield changes of δZZ and δYY,
(61) Tjandra, N.; Bax, A. J. Am. Chem. Soc. 1997, 119, 8076–8082.
(62) Ditchfield, R. J. Chem. Phys. 1976, 65, 3123–3133.(63) Crothers, D. M.; Hilbers, C. W.; Shulman, R. G. Proc. Natl. Acad.
Sci. U.S.A. 1973, 70, 2899–2901.(64) Wagner, G.; Pardi, A.; Wuthrich, K. J. Am. Chem. Soc. 1983, 105,
5948–5949.(65) Sitkoff, D.; Case, D. A. J. Am. Chem. Soc. 1997, 119, 12262–12273.
Figure 6. Residue-specific 1HN CSA parameters, σXX, σYY, σZZ, derivedfrom RCSA and cross-correlated relaxation data, using a five-parameterCSA tensor fit (no symmetry is imposed relative to the peptide plane). (A)Values of the principal components of the CSA tensors. (B) Angle �1
between σXX and x; (C) �2 between σYY and y; (D) �3 between σZZ and z(Figure 5). Small �3 values show that for most residues σXX and σYY arelocated nearly in the peptide plane. Error bars correspond to the results of100 Monte Carlo calculations, where Gaussian noise with an amplitudecorresponding to the estimated root-mean-square measurement error wasadded to the experimental input data.
10872 J. AM. CHEM. SOC. 9 VOL. 132, NO. 31, 2010
A R T I C L E S Yao et al.
by 0.9 and 0.5 ppm, respectively. However, full exploration ofthe impact of H-bond angles on 1HN CSA would require asystematic grid search in five-dimensional space. Even for justsix values of each angle, 65 ) 7776 DFT calculations arerequired to fully sample this grid for a single dOH value, whichfalls beyond the capabilities of our computational resources.Instead, we compare DFT results to experimental 1HN chemicalshifts following a procedure used by Barfield.8 This procedureutilizes the model compounds NMA and acetamide to mimicthe H-bond donating amide group and H-bond acceptingcarbonyl in GB3, and places the donating and accepting amidemoieties in the relative positions of the 34 pairs of backboneamide to carbonyl hydrogen bonds, found in GB3. Considerablespread in isotropic acetamide 1HN chemical shifts is calculatedfor the different hydrogen-bonding geometries (⟨δiso⟩ ) 8.7 (0.9 ppm), comparable to what is seen experimentally for thesame set of amides in GB3 (⟨δiso⟩ ) 8.4 ( 0.7 ppm) (Table S5(SI)). The DFT calculations also find a much stronger correlationbetween δZZ, δYY and δisotropic, than between δXX and δisotropic
(Figure 7B), consistent with experimental observations (Figure7A). However, the slopes of the best fitted correlations differsomewhat between the fits of the experimental and calculated
results. For example, the best fitted slope of 1.4 for the DFT-derived correlation between δZZ and δisotropic is smaller than theslope of 1.8 seen for the experimental data (Figure 7), whereasthe opposite is found for δYY, where the DFT-derived slope (1.7)is larger than the coefficient of 1.2 seen for the experimentaldata. Nevertheless, the computational results correlate quite wellwith the experimentally observed relation between CSA andisotropic chemical shift, indicating that such calculations on theNMA-acetamide pair are adequate for mimicking the effectof hydrogen bonding in a protein. We therefore proceed toinvestigate the impact of hydrogen bonding on δYY and δZZ.
Barfield carried out DFT calculations to study the effect ofhydrogen bonding on HN δisotropic, and proposed the followingempirical relation:8
where θ1, R3, and dOH are the structure variables (Figure 1) andci (i ) 1, ..., 6) are the parameters determined from the fitting.Following the same procedure, we fitted the DFT-calculatedδisotropic values to eq 2, again yielding a good correlation (RP )0.99; Figure S7 [SI]). Small differences between ci valuesobtained for the fits of Figure S4 (SI) relative to Barfield’s valuesare due to the larger basis set used in our DFT calculations.
Considering the strong correlations between δisotropic and theprincipal components δZZ and δYY, we use an empirical equationof the same type as eq 2 to fit δZZ and δYY to H-bond geometry.The parameter a5 is fixed at 2.9, which represents the averageof the values 3.0 and 2.8 obtained above when fitting theexponential dependence of the computed δZZ and δYY values ondOH (Figure 8). Best fits between computed CSA tensorcomponents and H-bond geometry parameters are obtained forthe following parametrizations:
Figure 7. Correlations between the principal components of the chemical shift tensor δii (i ) X, Y, Z) and the isotropic chemical shift, δisotropic. (A) Experimentalδisotropic values and HN CSA tensor components obtained from fitting to the experimental RCSA and cross-correlated relaxation rates, and (B) δisotropic valuesand CSA tensor components obtained from DFT calculations. For (A), all 42 experimentally obtained CSA tensor values are shown, and the three best fittedlines correspond to δZZ ) 1.79δisotropic - 0.38 ppm; δYY ) 1.22δisotropic - 2.28 ppm; δXX ) -0.17δisotropic + 4.03 ppm. Two outliers (δZZ of N8 and δYY ofD22) are not included in the fit, nor in the calculation of the Pearson’s correlation coefficients, RP. For (B), data are restricted to the 34 backbone-backboneH-bonded pairs in GB3, and the best fits correspond to δZZ ) 1.40δisotropic + 4.78 ppm; δYY ) 1.68δisotropic - 6.13 ppm; δXX ) -0.08δisotropic + 1.35 ppm.
Figure 8. Principal components of the 1HN chemical shift tensor in NMA,H-bonded to the acetamide carbonyl oxygen, obtained from DFT calcula-tions, as a function of H-bond length, dOH. The other parameters definingthe relative orientation of the H-bonded pair (Figure 1) correspond to: θ )180°; φ ) 180°; R ) 0°; � ) 0°; γ ) 0°. The three best fitted lines are δZZ
) 14.6 + 1.2 × 10³ exp(-3.0dOH) ppm, δXX ) 2.3 - 11.8 exp(-1.1dOH)ppm, and δYY ) 4.8 + 0.84 × 10³ exp(-2.8dOH) ppm.
δisotropic(θ1,R3, dOH) ) {c1 cos2 θ1 + [c2 cos2 R3 -
c3 cos R3 + c4]sin2 θ1} × exp(-c5dOH) + c6 (2)
δYY(θ1,R3, dOH) ) {1.25 × 10³ cos2 θ1 +
[0.54 × 10³ cos2 R3 - 77 cos R3 + 1.13 × 10³]sin2 θ1}× exp(-2.9dOH) + 4.6 ppm
(3)
J. AM. CHEM. SOC. 9 VOL. 132, NO. 31, 2010 10873
Amide 1H Chemical Shift Anisotropy in a Small Protein A R T I C L E S

With correlation coefficients RP of 0.97 and 0.93 for δYY andδZZ, respectively, values predicted by these empirical equationsagree well with the DFT results (Figure S8 (SI)). Next, usingthe parametrizations of eqs 3 and 4 derived from the DFTresults, we use these equations to predict the principal compo-nents of the CSA tensor for HN atoms in GB3 that are engagedin backbone-backbone H-bonds, taking the H-bond geometriesfrom the high-resolution X-ray structures of GB3 (PDB entry2IGD)66 and its close homologue, GB1 (entry 1PGB).67 Theamide protons were added to these X-ray structures using theprogram REDUCE.68 The parameters (θ1, R3, dOH) weresubsequently calculated and averaged over the two structures.
The correlations between experimental and predicted values forδYY and δZZ (Figure 9) suggest that, on average, the lower δYY andδZZ values observed for R-helical residues as compared to �-strandsare caused by the weaker H-bonds in the R-helix, which outweighsthe slight increase predicted by our above DFT results on the basisof the backbone torsion angles. DFT calculations predict an increasein δXX with increasing dOH (Figure 8), which likely contributes tothe average δXX value in R-helix falling downfield from that in�-sheet (⟨δXX⟩helix ) 3.3 ( 0.71 ppm; ⟨δXX⟩sheet ) 2.2 ( 0.70 ppm).The weaker H-bond interaction in R-helix is corroborated bysmaller average h3JNC′ values (⟨h3JNC′⟩helix ) -0.37 ( 0.22;⟨h3JNC′⟩sheet ) -0.48 ( 0.15 for residues for which both experi-mental 1HN CSA and h3JNC′ are available).43
Although the correlations between H-bond parameters derivedfrom the X-ray structures and experimental δYY and δZZ valuesare statistically significant (p ) 10-6; RP ) 0.75; Figure 9),considerable scatter remains. It appears that much of this scatterrelates to the uncertainty in the H-bond parameters. For example,when using eqs 3,4 to predict the δYY and δZZ values on thebasis of the coordinates of each of the individual 2IGD and1PGB PDB entries (pairwise backbone rmsd of 0.28 Å), thescatter between the two sets of predicted δYY and δZZ values(RP of 0.79 and 0.75; Figure S9 [SI]) is nearly as high as thosebetween predicted and experimental values.
Effects from local structural parameters, including backbonedihedral angles, side-chain type and orientation, long-range mag-
netic susceptibility, electrostatic interactions, or solvent effects, werenot included in the DFT calculations used to derive eqs 3 and 4,which likely also contributes to the spread in the correlation plotsof Figure 9. Furthermore, computationally more demandingmethods, such as Møller-Plesset (MP) perturbation theory withcomplete basis set extrapolation, may improve the agreementbetween computed and experimentally determined chemical shifttensors.10 Nevertheless, it is remarkable that even the relativelysimple calculations used in the present study allow us to identifythe importance of hydrogen bonding on the principal componentsof the 1HN CSA tensor in a semiquantitative manner.
Unlike the impact of hydrogen bonding on the principalcomponents of the CSA tensor, its effect on the CSA orientation(� angles) is less clear-cut. Experimental results suggest that,with shorter H-bond length, the angles cluster more closely totheir canonical orientations (Figure S10A [SI]), a findingconfirmed by our DFT calculations (Figure S10B [SI]).
A fit of the experimental data using a CSA tensor that is forcedto be symmetric with respect to the peptide plane, and whichtherefore has only three instead of five adjustable parameters, wasalso carried out (Table S6 [SI]). The principal components andorientations of the resulting 1HN CSA tensors fall close to those ofthe fully unrestricted fit, used above (Figure S11 [SI]). Thecorrelations between isotropic shift and the principal componentsδZZ and δYY obtained with this three-parameter model (RP ) 0.92for δZZ; RP ) 0.81 for δYY) are very similar to those obtained withthe five-parameter fit, indicating that use of the fully unrestrictedtensor analysis has not resulted in overfitting of the data. Theaverage 1HN CSA values obtained with the three-parameter fit areσZZ ) -6.0 ( 1.1, σYY ) 0.5 ( 0.9, σXX ) 5.5 ( 1.4, to becompared with σZZ ) -6.2 ( 1.0, σYY ) 0.5 ( 0.9, σXX ) 5.7 (1.3 from the five-parameter fitting.
Impact on TROSY 1H Line Width. The transverse relaxationoptimized spectroscopy (TROSY) 1H-15N HSQC experiment34
relies on partial cancellation of 1HN (15N) CSA and 1H-15N dipolarrelaxation mechanisms to enhance spectral resolution in the 1HN
(15N) dimensions of the 2D NMR spectrum. The degree ofcancellation strongly depends on the size and orientation of theCSA tensor relative to the dipolar interaction.69 Our previousanalysis of the impact of 15N CSA variations on 15N line widthshowed variations by more than 2-fold in the attainable 15N linewidth at high magnetic field strength (21 T), with optimal
δZZ(θ1,R3, dOH) ) {0.99 × 10³ cos2 θ1 +
[1.19 × 10³ cos2 R3 + 31 cos R3 + 0.70 × 10³]sin2 θ1}× exp(-2.9dOH) + 13.8 ppm
(4)
Figure 9. Correlations between principal components of the 1HN CSA tensor for H-bonded amides in GB3 predicted by DFT-derived empirical equations(eqs 3,4) and experimental values for (A) δYY, and (B) δZZ. For the DFT calculations, the structure parameters (θ1, R3, dOH) were averaged over those seenin PDB entries 2IGD66 and 1PGB,67 with the amide protons added to these as described in the text. The red filled circles correspond to residues in R-helix;black filled circles are in �-sheet; open circles are H-bonded but neither in helix nor sheet. The best fitted lines correspond to δYY(pred) ) 0.89δYY(exp)+1.02 ppm, and δZZ(pred) ) 0.46δZZ(exp) + 9.83 ppm. The RMSDs to the shown best-fitted lines are 0.55 ppm (A) and 0.71 ppm (B).
10874 J. AM. CHEM. SOC. 9 VOL. 132, NO. 31, 2010
A R T I C L E S Yao et al.
cancellation of the 15N CSA and 1H-15N dipolar relaxationmechanisms occurring at quite different field strengths for differentresidues.
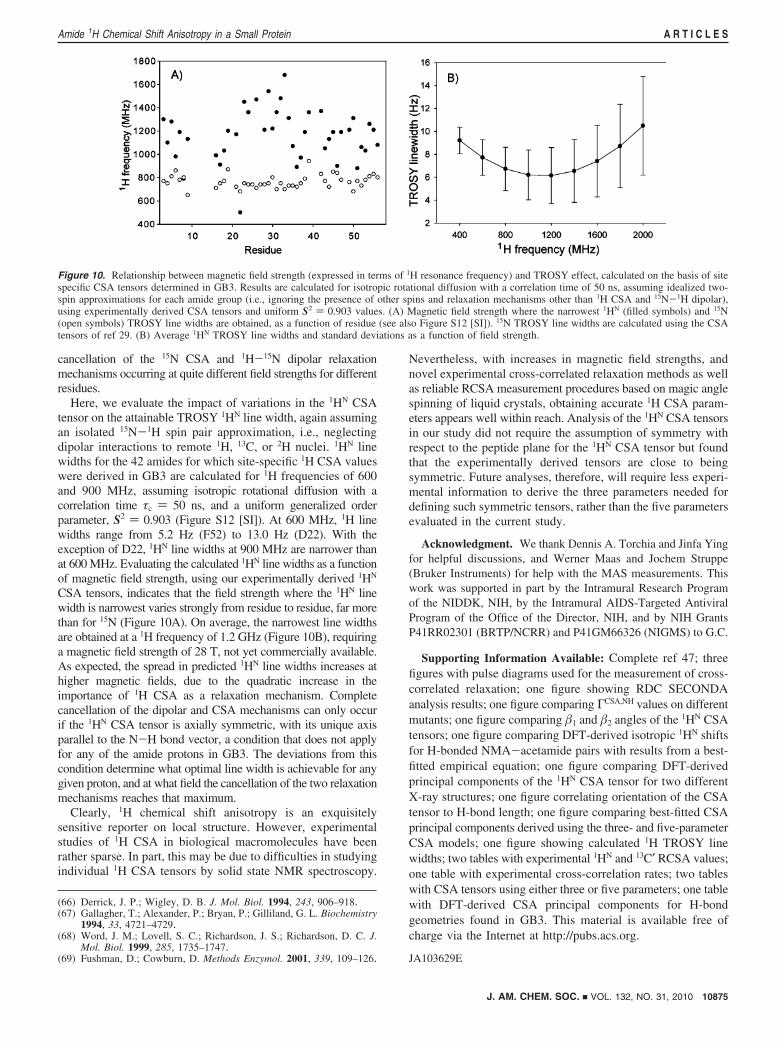
Here, we evaluate the impact of variations in the 1HN CSAtensor on the attainable TROSY 1HN line width, again assumingan isolated 15N-1H spin pair approximation, i.e., neglectingdipolar interactions to remote 1H, 13C, or 2H nuclei. 1HN linewidths for the 42 amides for which site-specific 1H CSA valueswere derived in GB3 are calculated for 1H frequencies of 600and 900 MHz, assuming isotropic rotational diffusion with acorrelation time τc ) 50 ns, and a uniform generalized orderparameter, S2 ) 0.903 (Figure S12 [SI]). At 600 MHz, 1H linewidths range from 5.2 Hz (F52) to 13.0 Hz (D22). With theexception of D22, 1HN line widths at 900 MHz are narrower thanat 600 MHz. Evaluating the calculated 1HN line widths as a functionof magnetic field strength, using our experimentally derived 1HN
CSA tensors, indicates that the field strength where the 1HN linewidth is narrowest varies strongly from residue to residue, far morethan for 15N (Figure 10A). On average, the narrowest line widthsare obtained at a 1H frequency of 1.2 GHz (Figure 10B), requiringa magnetic field strength of 28 T, not yet commercially available.As expected, the spread in predicted 1HN line widths increases athigher magnetic fields, due to the quadratic increase in theimportance of 1H CSA as a relaxation mechanism. Completecancellation of the dipolar and CSA mechanisms can only occurif the 1HN CSA tensor is axially symmetric, with its unique axisparallel to the N-H bond vector, a condition that does not applyfor any of the amide protons in GB3. The deviations from thiscondition determine what optimal line width is achievable for anygiven proton, and at what field the cancellation of the two relaxationmechanisms reaches that maximum.
Clearly, 1H chemical shift anisotropy is an exquisitelysensitive reporter on local structure. However, experimentalstudies of 1H CSA in biological macromolecules have beenrather sparse. In part, this may be due to difficulties in studyingindividual 1H CSA tensors by solid state NMR spectroscopy.
Nevertheless, with increases in magnetic field strengths, andnovel experimental cross-correlated relaxation methods as wellas reliable RCSA measurement procedures based on magic anglespinning of liquid crystals, obtaining accurate 1H CSA param-eters appears well within reach. Analysis of the 1HN CSA tensorsin our study did not require the assumption of symmetry withrespect to the peptide plane for the 1HN CSA tensor but foundthat the experimentally derived tensors are close to beingsymmetric. Future analyses, therefore, will require less experi-mental information to derive the three parameters needed fordefining such symmetric tensors, rather than the five parametersevaluated in the current study.
Acknowledgment. We thank Dennis A. Torchia and Jinfa Yingfor helpful discussions, and Werner Maas and Jochem Struppe(Bruker Instruments) for help with the MAS measurements. Thiswork was supported in part by the Intramural Research Programof the NIDDK, NIH, by the Intramural AIDS-Targeted AntiviralProgram of the Office of the Director, NIH, and by NIH GrantsP41RR02301 (BRTP/NCRR) and P41GM66326 (NIGMS) to G.C.
Supporting Information Available: Complete ref 47; threefigures with pulse diagrams used for the measurement of cross-correlated relaxation; one figure showing RDC SECONDAanalysis results; one figure comparing ΓCSA,NH values on differentmutants; one figure comparing �1 and �2 angles of the 1HN CSAtensors; one figure comparing DFT-derived isotropic 1HN shiftsfor H-bonded NMA-acetamide pairs with results from a best-fitted empirical equation; one figure comparing DFT-derivedprincipal components of the 1HN CSA tensor for two differentX-ray structures; one figure correlating orientation of the CSAtensor to H-bond length; one figure comparing best-fitted CSAprincipal components derived using the three- and five-parameterCSA models; one figure showing calculated 1H TROSY linewidths; two tables with experimental 1HN and 13C′ RCSA values;one table with experimental cross-correlation rates; two tableswith CSA tensors using either three or five parameters; one tablewith DFT-derived CSA principal components for H-bondgeometries found in GB3. This material is available free ofcharge via the Internet at http://pubs.acs.org.
JA103629E
(66) Derrick, J. P.; Wigley, D. B. J. Mol. Biol. 1994, 243, 906–918.(67) Gallagher, T.; Alexander, P.; Bryan, P.; Gilliland, G. L. Biochemistry
1994, 33, 4721–4729.(68) Word, J. M.; Lovell, S. C.; Richardson, J. S.; Richardson, D. C. J.
Mol. Biol. 1999, 285, 1735–1747.(69) Fushman, D.; Cowburn, D. Methods Enzymol. 2001, 339, 109–126.
Figure 10. Relationship between magnetic field strength (expressed in terms of 1H resonance frequency) and TROSY effect, calculated on the basis of sitespecific CSA tensors determined in GB3. Results are calculated for isotropic rotational diffusion with a correlation time of 50 ns, assuming idealized two-spin approximations for each amide group (i.e., ignoring the presence of other spins and relaxation mechanisms other than 1H CSA and 15N-1H dipolar),using experimentally derived CSA tensors and uniform S2 ) 0.903 values. (A) Magnetic field strength where the narrowest 1HN (filled symbols) and 15N(open symbols) TROSY line widths are obtained, as a function of residue (see also Figure S12 [SI]). 15N TROSY line widths are calculated using the CSAtensors of ref 29. (B) Average 1HN TROSY line widths and standard deviations as a function of field strength.
J. AM. CHEM. SOC. 9 VOL. 132, NO. 31, 2010 10875
Amide 1H Chemical Shift Anisotropy in a Small Protein A R T I C L E S