the impact of human factors on lopa (and other risk ...€¦ · 1 the impact of human factors on...
TRANSCRIPT

The Impact of Human Factors on LOPA
(and other risk assessment methods)
William G. Bridges, President
Process Improvement Institute, Inc. (PII)
1321 Waterside Lane
Knoxville, TN 37922
Phone: (865) 675-3458
Fax: (865) 671-4944
e-mail: [email protected]
2013 © Copyright reserved by Process Improvement Institute, Inc.
Prepared for Presentation at
9th
Global Congress on Process Safety
San Antonio, TX
April 28-May 1, 2013
AIChE shall not be responsible for statements or opinions contained
in papers or printed in its publications

1
The Impact of Human Factors on LOPA
(and other risk assessment methods)
William G. Bridges, President
Process Improvement Institute, Inc. (PII)
1321 Waterside Lane
Knoxville, TN 37922
Phone: (865) 675-3458
Fax: (865) 671-4944
e-mail: [email protected]
Keywords: Systematic Error, human error, human factors, layer of
protection analysis, LOPA, independent protection layer, IPL, initiating
event
Abstract
All initiating events (IEs) and independent protection layers (IPLs) are
inherently tied to human error. Human factors limit the risk reduction
valves and must be taken into account to ensure true independence of
IPLs and to ensure the probability of failure on demand (PFD) of the IPL
is achievable in actual implementation. The paper explains the
relationship between human factors and the resultant IE frequency and
PFD and provides an overview of how to validate theses risk reduction
values at a site. The paper also covers the more involved topic of
dependent human errors in IPLs, such as high integrity SIS and other
high reliability IPLs such as relief systems. Actual examples are
provided to illustrate key learnings.
Humans can be the cause of an accident scenario (the Initiating Event [IE]) or humans
can serve or participate as an independent protection layer (IPL). Humans can also
contribute indirectly to raise the frequency of non-human IEs and to raise the PFD of
non-human IPLs. Although textbooks1,2
address human factors issues, this paper updates
the current understanding of human factors, particularly from the perspective of IPLs and
IEs.
Identifying and sustaining independent protection layers (IPLs) is the heart of LOPA.
Each IPL must be:
Independent of the initiating event (IE) and the other IPLs (including
consideration of the complete system boundary for that subsystem, such as
upstream and downstream block valves).

2
Capable (big enough, fast enough, strong enough, etc., including consideration of
the complete system boundary for that subsystem, such as upstream and
downstream block valves).
Maintained or kept in practice/service.
Validated/proven to provide the probability of failure on demand (PFD) chosen.
And all of the above must be documented and audited periodically to ensure compliance
with these definitions.
1. Human Error Fundamentals
Human errors are sometimes mistakenly called procedural errors. This is not any truer
than saying all equipment errors are due to design errors. Throughout the past five
decades of research and observation in the workplace on human error, we have come to
know that human error probability depends on many factors. These factors are described
in more detail elsewhere3, and they include:
Procedure accuracy and procedure clarity (the most-cited root cause of
accidents):
A procedure typically needs to be 95% or more accurate to help reduce human
error; humans tend to compensate for the remaining 5% of errors in a written
procedure.
A procedure must clearly convey the information, and the procedure must be
convenient to use.
Checklist features — Checklists should be used and enforced either in the
procedure or in a supplemental document.
For human response IPLs, a checklist is not always practical; in fact, a
troubleshooting guide (rather than a prescriptive, linear procedure) is usually
required, since we do not always know what condition a process will be in
before a serious problem begins that requires humans to respond (as a human-
based IPL). Note that best practice is to have troubleshooting guides indexed
by parameter or alarm; the most effective implementation has been to make
these easily available from the BPCS screen (such as by selecting an option to
display the troubleshooting guide when an alarm is triggered).
Training, knowledge, and skills
Employees must be selected with the necessary skills before being hired or
assigned to a department.
Initial training — There must be effective, demonstration based training for
each proactive task and each reactive (e.g., response to alarm) task.
Ongoing validation of human action is required and must be repeated. For
human IPLs, the action must be demonstrated to be “fast enough” as well. For
the Site-Specific Data approach, validation can be done in actual performance
(measuring errors in responses to actual alarms) or in drills/practice.
Alternatively, the human performance can be validated by expert judgment,
generic data, or by prediction. Examples of methods for validating human
IPLs (and estimating human IEFs) are provided later in this paper.

3
Documentation — The actual performance of the humans or alternative
validation approaches must be documented and retained to demonstrate the
error rates chosen are valid.
Fitness for duty — Includes control of many sub-factors such as fatigue, stress,
illness and medications, and substance abuse.
Workload management — Too little workload and the mind becomes bored and
looks for distraction; too many tasks per hour can increase human error as well.
Communication — Miscommunication of an instruction or set of instructions or
of the status of a process is one of the most common causes of human error in the
workplace. There are proven management systems for controlling
communication errors.
Work environment — Factors to optimize include lighting, noise, temperature,
humidity, ventilation, and distractions.
Human system interface — Factors to control include layout of equipment,
displays, controls and their integration to displays, alarm nature and control of
alarm overload, labeling, color-coding, fool-proofing measures, etc.
Task complexity — Complexity of a task or job is proportional to the (1) number
of choices available for making a wrong selection of similar items (such as
number of similar switches, number of similar valves, number of similar size and
shaped cans), (2) number of parallel tasks that may distract the worker from the
task at hand (leading to either an initiating event or failure of a protection layer),
(3) number of individuals involved in the task, and (4) judgment or
calculation/interpolation, if required. For most chemical process environments,
the complexity of the task is relatively low (one action per step), but for response
actions (human IPLs) there are almost always other tasks underway when the out-
of-bounds reading occurs or the alarm is activated, and as mentioned earlier, we
cannot predict what state the rest of the process will be in when the alarm comes
on.
In addition to the human factors listed, other considerations for use of a human as an
IPL include (1) time available to perform the action and (2) physical capability to
perform the action.
When considering human IEs and IPLs, the site must ensure that the factors above are
consistently controlled over the long-term and that they are controlled to the same degree
during the mode of operation that the LOPA covers. For instance, if the workers are
fatigued following many extra hours of work in a two-week period (say 14 days straight
days of 12 hours of work each day) leading up to restart of a process, then the human
error rates can increase by 10 (or more) times during the subsequent startup4,5,6,7
.
Revealed versus Unrevealed Errors for Human. As with equipment failures, human
errors can lead to a revealed fault in the system (e.g., the flow does not start) or to an
unrevealed fault, such as the block valve downstream of a control valve is left closed, but
the failure is not revealed until the control valve is used. If the error is revealed, then the
error can be corrected or compensated for. If the restoration/correction time is
sufficiently short, then the probability of being in the failed state is much less for a

4
revealed failure than for an unrevealed failure, which is only discovered upon testing or
inspection.
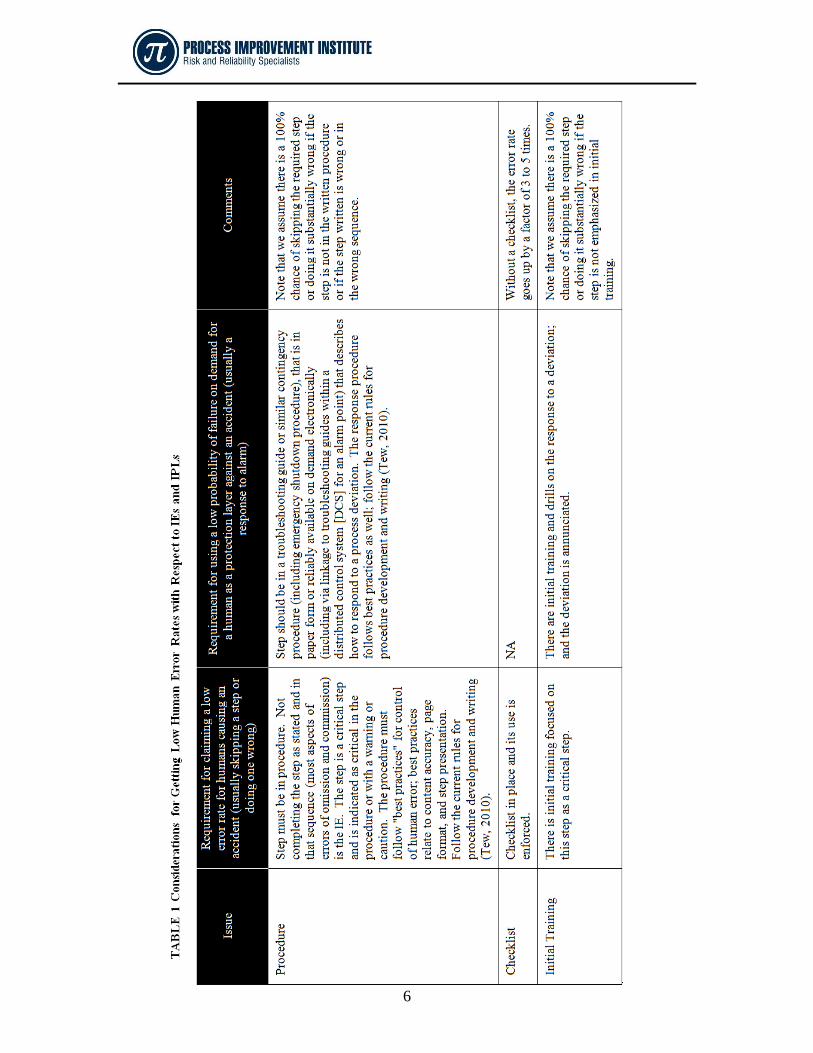
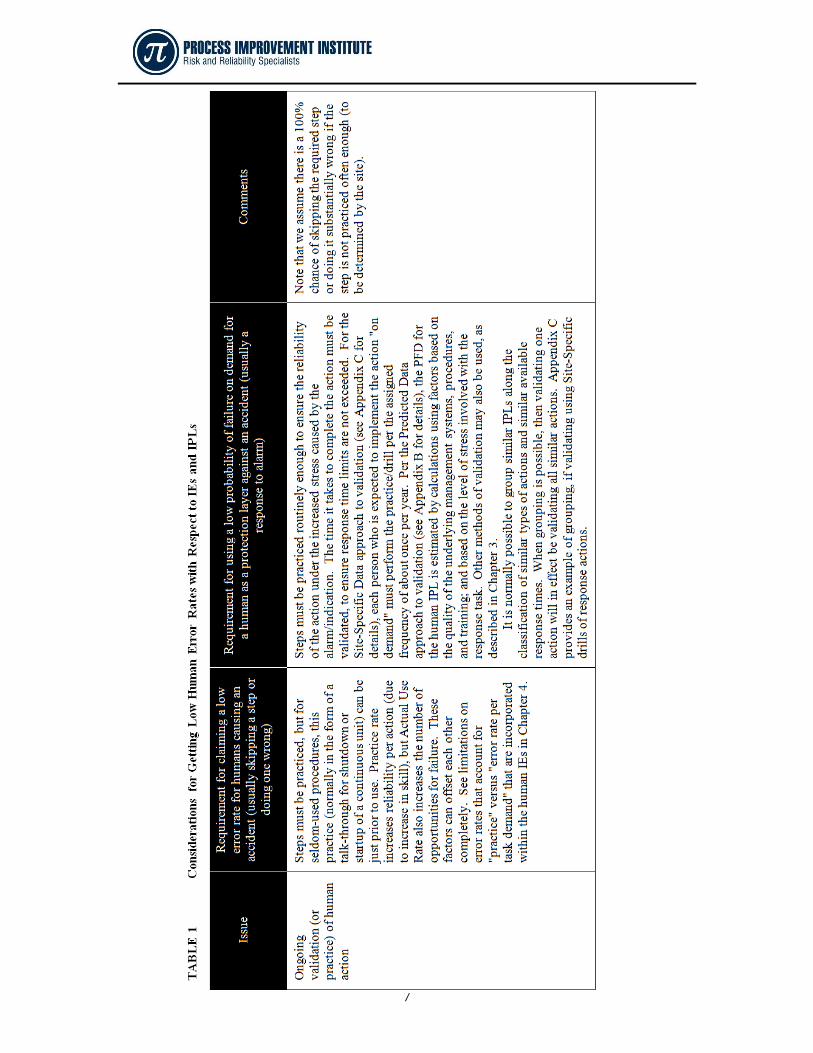
2. General Relationship of Human Factors to LOPA
Every risk assessment must consider the likelihood and effect of human factors. For
LOPA, poor human factors can lead to higher human error rates that increase IE
frequencies and that increase the PFD of a human IPL (and of other IPLs indirectly).
Table 1 (adapted from an earlier paper8) on the next several pages summarizes the human
factor issues that relate directly to LOPA. The table contrasts the impact of good and
poor human factors on initiating event frequency (IEF) and on the PFD of human-based
independent protection layers (IPLs).
If all of the factors were optimized, one would expect about 0.01 per task as an IEF and
about 0.05 PFD (which would normally be rounded up to 0.1) for response to alarms or
call for actions (human IPLs), but such an analysis must be made on a case-by-case basis,
especially for the PFD of IPLs.

5
6
7

8

9

10

11
___________________________________________________________________________________
12
3. Types of Human Errors of Importance in LOPA
Human error comes in many forms, but the primary ones of interest in LOPA are:
Human errors that directly relate to human IEs and human IPLs
Errors in following proactive procedures, such as startup of a unit, that results in an
initiating event of a LOPA accident scenario
Errors in responding to a call for action; if performed correctly such actions would
interrupt the scenario and prevent the consequence
Human errors that indirectly relate to LOPA component-based IEs and IPLs
Errors when following management systems that lead to higher failure rates of
components; although indirect, such errors can have impacts on risk that are orders of
magnitude
The examples below illustrate both types of human error that directly affect LOPA. At the end
of this paper are more details on human errors that indirectly related to IEs and IPLs, along with
a Case Study
3.1 IE Caused by Human Error
Human errors that result in IEs of major process incidents are usually occur during startup; one
definitive study (Rasmussen, 1989)9 and a survey of the major accidents in the past 20 years
10
show that roughly 65% of major process accidents in chemical-related process plants occur
during startup and on-line maintenance. Further, errors during normal shutdown or emergency
shutdown together represent about 10% of the IEs caused by human errors. (Other studies show
that most minor releases, such as packing leaks, occur during normal operation.) Human errors
during normal operation result in less than 25% of the and include such issues as performing a
step wrong during operation in manual mode, such as when a process controller is bypassed or
by external impact (one major accident during normal operation occurred when a fork-truck hit
and broke off a drain valve).
The two primary ways to find accident scenarios caused by human error (before the accident
occurs) are:
Prediction of the accident scenario in PHA of all modes of operation, especially startup
and shut down procedures. Most PHA/HAZOPs world-wide are weak on finding
accident scenarios during non-routine modes of operation. Overcoming this weakness is
critical and related methods are explained in Chapter 9.1 of the Guidelines for Hazard
Evaluation Procedures, 3rd
Edition 11
and in an updated paper on the same topic10
.
Getting a lot of near misses reported and investigated; usually having at least 15 times the
number of near misses reported as accidents occurring is needed to have a 90% chance or
higher of preventing the major accidents12,13
. The ratio of near misses report to accidents
occurring is relatively low at most companies world-wide, so this is low hanging fruit for
many companies.

13
3.2 Human Errors as Related to Human Response IPLs
There are many types of IPLs, and some are more trustworthy than others, hence the
difference in the PFD of IPLs. One possible type of IPL is a human IPL. These include
preventive steps that may stop a scenario from progressing once it is initiated, but more typically
the human IPLs are responses to alerts or alarms or troubling readings and sample results.
A 10-1
PFD value for a human response IPL indicates that the correct response occurs at least
9 out of 10 times (or no more than 1 wrong response for every 10 attempts). Most organizations
will have identified many human responses involving a number of personnel as part of their
LOPA studies. Some organizations believe that if they have “a procedure and a training
program” in place, they can claim the PFD value of 0.1 for a human IPL. This is no truer for a
human IPL than it is for an active component IPL. So, having a procedure and training are not
the only requirements for a human IPL. As required for all IPLs, a human IPL must be
validated. The preferred approach to validation is Site-specific data where the site directly
measures or tests the human response (under controlled conditions or drills). But other methods
of validation include Expert Judgment, using data from other comparable settings (Generic Data
approach), and the Predicted Data approach where estimation of the PFD of human IPLs is by a
human error mathematical modeling, described later in this paper.
4. Approaches for Validating an IEF or PFD for a Human IE or Human IPL
For LOPA, the ways to estimate and validate human IEFs and validate PFDs of human IPLs
include expert opinion, using industry values, calculation from human reliability factors, or
direct measurement at the site.
4.1 Validating Human IEFs
To help minimize human errors that could be IEs, many companies will review a normal
shutdown or normal startup just before its next use. This has proven one effective way to reduce
human error in chemical-related industries. Nuclear power plants also perform such “just-in-
time (JIT)” refresher training on normal shutdowns and normal startup procedures. If a site
records the errors that are made during such tasks, then the company can validate the average
IEF for that task and so the site will have a better estimate of the error probability. Further, if the
measured rate is too high, they can take proactive steps to lower the error rate. Errors can be
measured either in actual practice in the field or via simulators. They can also be roughly
estimated by analysis of near misses reported (if the number of near misses reported is at least 15
times higher than the number of loss events or accident12, 13
).
Below is an example of data from one site that was collected to estimate the IEF for mistakes
made during normal startup:
EXAMPLE - Initiating event frequency data collection and use: In one company, the
operating group was able to provide the data on the following page for errors made
during startup of various units. Based on this data, the average probability of human

14
error was 0.0071 and the number of errors per year that could lead to a known accident
sequence was 0.17 (but note that if all errors are counted, the average error rate would
be 0.29/yr). For basic LOPA, this value is rounded up to an IEF of 1/yr, for initiating
events arising from these and similar procedures at the site. See Table 2 below.14
15
Chemical-related process plants should collect such data to understand and validate the initiating
event frequency caused by human error. This data would then be used to validate the values for
IEF used in LOPA and other risk assessments.
4.2 Validating the PFD of Human-Based IPLs
The probability of a human response being done wrong, not being done, or taking too long can
be estimated different ways, as described in Figure 1 on the next page. Using site-specific data is
preferred, as this is usually easier to defend. Note that CPQRA in Figure 1 refers to Guidelines
for Chemical Process Quantitative Risk Analysis.15
All the human factors below were assumed to be nominal and were omitted in this simplified
approach (including being set to a value of 1 for the predicted data portion of this example). IF
for a given human IPL (or site) these are NOT nominal, THEN a full HRA is required, and this
simplified estimation method cannot be used:
1. Interface Factors: The example approach assumes a suitable human-system interface
exists such that information is presented in an easily assimilated form, alarms are
prioritized and the number of simultaneous alarms is controlled to prevent channel
capacity overload and to allow the human to easily perceive the alarm.
2. Task Execution Factors: The approach assumes that a procedure or troubleshooting guide
exists for the alarm action that meets all of the requirements for such procedures or
guidelines. The approach also assumes that the alarm will be considered a high priority
demand by the human and will receive attention as quickly as can be practically
achieved.
3. Task Complexity Factors: Task complexity is partly based on the number of steps and the
level of cognitive processing required, and partly based on the number of different people
involved and number of different interfaces involved to accomplish the task. Task
complexity can also increase if the person is required to multitask, but this issue is
addressed in item 5 below, Workload Factors. For this example, it is assumed that the
people performing the task have the required knowledge, skill, and physical capability to
complete it successfully, and that no more than two people have to communicate, and that
the conditions of items 1 and 5 in this list of assumptions are satisfied.
4. Training, Experience, and Familiarity Factors: The approach assumes people performing
the task are not allowed to work unsupervised until they have met the level, training, and
experience requirement for the activity. Consequently, these training and experience
levels are assumed within the HRA calculation. The approach also assumes the person
performing the task is aware of any potential hazards, since such awareness should have
been imparted during initial and follow-on training for the activity.
5. Workload Factors: The approach assumes the workload will not impact the ability of the
human to respond adequately to the alarm since the prioritization of the alarm should
override any other work in progress.

16
Figure 1. Example Decision Path for Validating Human Response IPL

17
To assure the simplifying assumptions are valid, a positive response to ALL of the following
screening questions is needed to qualify use of this approach for validation of a human IPL:
TABLE 3 Determining the Calculation Approach to Be Used
Item Criteria Yes No
A Is this a human response to an alarm or call for action?
B Is the response action clearly documented in the related
procedure or troubleshooting guide? (And does the
documentation include enough guidance for making appropriate
decisions?)
C Does the response procedure or troubleshooting guide follow
best industry practice for content development and presentation?
(See checklist of procedure writing rules in Tew, 2010, and
other sources such as Bridges, 2007.)
D Is the procedure or troubleshooting guide kept up-to-date and
accurate?
E Does the operator process and skills training include initial and
refresher training on this specific response action?
F Is the alarm annunciated audibly and identified as an IPL?
G Can this procedure be done by < 2 operators?
H Does the plant align to overtime practices and startup staffing
expectations?
I Are supervisors required to screen workers for fitness-for-duty
each day (looking for fatigue, mental stress, substance issues,
and physical impairments)?
J Is the human response IPL completely independent of the
initiating event and any other IPLs in the scenarios in which the
human response IPL is credited?
K Is the annunciation system always active and constantly
monitored (98%+ of time) by operator(s) trained in the response
procedure and guideline? Is it confirmed that annunciation
systems are Not turned off from time to time?
L Is the annunciation clear and distinct?
M Are the alarm and any instrumentation used in the response
tested routinely enough?
If ALL are
Yes, then
Predicted
Data method
can be used
for validation
of the PFD
If ANY are
No, use
other
methods for
validation of
the PFD of
the human
IPL
Again: IF the answers to A-M are not All Yes for a given human response IPL, THEN
potentially a full HRA or actual drills are required to validate a human response IPL, and the
simplified estimation approach for validation described in this appendix cannot be used.

18
Determine if Validation by "Expert Judgment Only" Is Allowed
The questions in Table 4 are used in the initial screening process. If ALL are False, then a PFD
of 0.1 is valid without further calculation. If ANY of the statements in Table 4 are true, then the
validation calculation approach that follows must be applied to verify that the required reliability
is achieved.
TABLE 4 Determine (Using Expert Judgment) if Validation by Predicted Data Is
Required # Criteria True False 1 Based on consensus of expert opinion, the operator
has less than 15 minutes to successfully detect,
diagnose, and perform the required action
2 Operator response is required without explicit criteria
and response instructions
3 Critical or emergency responses involve multiple
people
4 Response actions provide no feedback that they are
effective
If any are true, go
through Predicted
Data method for
validation of the
PFD
If all are false, use
PFD = 0.1 (stop: no
further calculation
needed; Expert
Judgment is sufficient
for validation)
If Expert Judgment is not allowed as the sole method for validation, then the validation by
simplified calculation (estimation) is required, as described in the next section; the example
approach in the next section uses a combination of Generic Data and Predicted Data methods for
validation. If the simplified calculation approach shown in the next section proves invalid or if a
PFD greater than 0.1 is obtained, then other methods such as full HRA or direct error
measurement at the site (Site-Specific Data approach to validation, as described later in this
paper) may be used to validate the PFD of the human IPL.
Determine if the Expert Judgment Estimate of the Baseline Human IPL Time Is Less than the
Maximum Allowable Response Time (MART)
The time available is critical to the reliability of any response activity. A shortage of time leads
to hurrying and increased stress. In addition, under these conditions, any errors that occur may
not be correctable. Ultimately, the action must be accomplished within the MART.
For a human response IPL, MART is the time from when the sensed parameter reaches the
set point (and then perhaps a few moments later the alarm sounds, if alarmed) to the point of no
return where the corrective action can no longer prevent the incident. This value is determined

19
from process dynamics independent of any hoped-for human response. It includes any time
delay in alarm activation and any time for automated actions (initiated by the operator) to occur.
This example of validation by predicted data requires three different time elements versus
MART (maximum time available to stop the event):
A. Detection time. Time from when the parameter of interest exceeds the "safety" limit until
the deviation is noticed by the human.
Detection and annunciation could be via a sensor and alarm, followed by sensory
perception of the annunciation by the operator.
Detection could be by the operator taking a sample to the lab and then subsequent
analysis and reporting of results by the lab technician. The detection time in this
case includes time between sampling (at least one cycle) plus the time to take the
sample plus the time to wait for analysis and perform analysis, plus the time to
report the results to the appropriate operating staff.
Detection could be the operator noticing a problem during routine operator rounds,
in which case the time since the previous rounds is the major portion of the time
consideration. So, for rounds every four hours, the detection time is greater than or
equal to four hours; but note that it is best to rotate operators every round to enhance
vigilance.
Use Expert Judgment for to estimate detection time.
B. Decision time (time to decide what action to take; also called diagnosis time in HRA).
The decision time was identified as a source of variability when people assessed the
reliability of these activities. Consequently, the decision time is fixed within this
validation method based upon the activity type. For purposes of alarms that a site would
allow for LOPA, the decision time is normally less than one minute. But some HRA data
developed for diagnosis time in control rooms (Swain, 1983) suggests that there is 90%
chance the diagnosis will be correct if the worker in a nuclear power plant control room
has at least 10 minutes to diagnose, and a 99% chance of correct diagnosis if they have 40
minutes. Because of these traditional values, the decision time is typically set at 10
minutes. However, for actions that require no or very little diagnosis or in simple process
units, this value can reasonably be set to five minutes. Use Table 5.

20
TABLE 5 The Decision-Time Factor Assigned to the Different Activity Types
Activity Type Decision Time
(minutes)
Unambiguous cue in a continuously staffed control room or similar staffing
near an alarm annunciation location, with simple process and little or no
diagnosis (with a decision tool, such as a troubleshooting guide).
5
Unambiguous cue in a continuously staffed control room or similar staffing
near an alarm annunciation location, with complex process unit that
requires diagnosis to deduce the failure cause and the proper action to take
(with a decision tool, such as a troubleshooting guide).
10
Requires diagnosis of a novel fault situation (cannot be used for IPL in
LOPA).
Beyond LOPA
C. Response time (time to complete all the alarm response activities). This is the time
required to complete the tasks that will prevent the undesired event, as detailed in the
alarm response procedure (e.g., after the procedure has been chosen as the correct course
of action). Use Expert Judgment for this estimate. (For comparison, this is the time that
is measured directly by testing/drills in validation using Site-specific data, as discussed
later in this paper)
Estimate the task response time: Using solicitation of expert opinion (including at least
two senior operators from the unit and one senior process engineer or equivalent),
develop an Expert Judgment estimate of the time to complete the response activities,
given that the diagnosis is performed correctly.
IF: Detection Time (including any delays in a related instrument system) + Decision
time + Task response time > MART
THEN: The human response IPL is not valid.
If the total human IPL time is too great, then the site may:
Decide to use other methods such as full CPQRA or full HRA to estimate the response
time and also to validate the human response IPL.
Decide to redesign the human response IPL so that it can be done in less than the MART.
Decide to redesign the system to eliminate or reduce the risk.
Decide to install or upgrade other types of IPLs (such as IPS, which are faster to respond)
in lieu of the human response IPL not being available (because it is currently invalid).
IF: Detection Time + Decision time + Task response time < MART
THEN: Proceed to the steps in the next section.
Validating Human Response IPLs by Prediction Data method

21
Another papers16
have provided examples of how to validate the PFD of an IPL by Predicted
Data using human reliability factors. Please refer to the referenced paper or to relative training
courses (such as the LOPA course by Process Improvement Institute, Inc. [PII]) for further
information on how this is done. Table 6 is an example of such a calculation using the approach
taught within PII. The approach is not provided here.

22
Table 6 Example Calculation of Human Response IPL for High Temperature Alarm in
Monomer Tank

23
Validating Human Response IPLs from Site-Specific Data
An approach for gather site-specific data from drills of responses to triggers of action has been
described in previous papers8, 14
. They incorporate collection of raw data on the response to
triggers of a human IPL during drills. Data is collected on drill cards such as those shown below
in Figure 2:
Figure 2 Example of card used to administer validation of a single human IPL
The results of such data collection is provided in Table 7 on the next page.
The previous papers8,14
(presented in past GCPS) illustrate how this approach works and provides
details on how to implement this approach and how to streamline the approach using a sampling
of the alarms (grouped by similar response activities).

24

25
5. Human Errors as Related to Impact on Non-Human IEs and IPLs (such as
SIS and Relief Systems)
In addition to having a direct impact as an IE or as failure of a human IPL, human error can,
of course, impact all other IEs and IPLs as well. This is because ALL process equipment are
ultimately controlled and maintained by humans. Typically, a baseline human error rate of 1
error in 50 steps is reasonable, or for excellent control of human factors, a baseline error rate of 1
error in 100 steps may be achieved. This baseline error rate then can increase if the control of
human factors slips. Fortunately, not all errors lead to negative or serious consequences. Below
are some examples of how human factors control the reliability of all IPLs and IEs:
Example related to IE — Wrong materials of construction received: If the humans fail to
control or detect errors during selection and use of materials of construction, then perhaps the
wrong grade of steel or other material will be used in a highly corrosive environment and
then the IEF will be many times higher than expected. Industry data from the 1990s
indicated that the materials delivered are different than what we specify about 3% to 7% of
the time (internal audit data from Process Improvement Institute, Inc. [PII] and from Swiss
Reinsurance). Positive material identification (PMI) can detect and correct such failures to a
large extent. Recent improvements in the quality assurance throughout the supply chain of
alloys (especially with the advent of less expensive, handheld PMI devices) coupled with
100% PMI by the facility owners at receiving (and sometimes coupled with 100% PMI on
as-welded in the plant) appears to lower the composite error rate to 0.1% to 0.5% (from PII
data from several processes installed since 2005). This error reduction still leaves a large
number of components that may be of the wrong materials and it is likely not possible for
human-based detection to find the remaining deviations in materials of construction.
Example related to IPL — High integrity SIFs: Safety Instrumented Functions (SIFs) can be
designed to provide risk reductions of 1, 2, or 3 orders of magnitude. However, even the best
designed SIF can be negated if (1) the root valves for the sensors are left closed or (2) a
bypass valve around an emergency isolation valve is left open (other errors are also possible,
of course). In addition, the humans may be capable of revaluing trip points, etc., in the
safety-rated PLC, given enough time to learn these shortcuts and given enough spurious trips
to make them want to use such a shortcut. Although an SIL 4 SIF is allowed by IEC 61511,
with a PFD of <10-4
to ≥10-5
, it is very unlikely for a process industry site to control human
errors low enough to install or maintain an SIL 4 SIF. Similarly, SIFs with SIL of 2 and 3
require more rigorous design and maintenance practices to offset the chance of human
intervention that can otherwise increase the composite PFD. A case study related to this
example is provided at the end of this section.
Example related to IPL — Pressure relief systems: Many relief system IPLs can have a PFD
of 0.01 or better, assuming the rest of the process does not interfere with or restrict the flow.
However, closing a block valve upstream or downstream of a relief device will negate the
entire value of the relief system. Excellent sustained control of human factors is necessary
to maintain a PFD of 0.01 or better for a relief system because of the relatively high
probability that a human will leave a block valve closed upstream or downstream of a relief

26
valve. Common industry data for human error rates indicate that the error of leaving such a
block valve closed will likely be the dominating failure mode for the relief system, so
including a block valve upstream or downstream of a relief device (though allowed by
ASME with administrative controls) will need to be evaluated by a site before assigning a
PFD for the combination system (comprised of the relief system and block valves). The
conservative PFD of 0.1 is therefore used as the default value for relief devices that have
blocks valves upstream or downstream of relief devices, unless a human error analysis for the
plant proves otherwise.
5.1 CASE STUDY: Human Error and the PFD of an SIF (based on a previous detailed
paper17
)
The SIS standards of the mid-1990 through today recognized that systematic human errors have
a deleterious impact on the PFD of an SIF. This effect can be either errors that exist at Time
Zero or systematic errors while operating. The IEC standards qualitatively covered at length the
need to control such errors. In ISA-TR84.00.02-200219
, Equation 1a was provided which
includes a system dangerous (D) failure (F)/error term. The equation is shown below:
2
SiiT
xPFDPFDPFDPFDPFD D
FPSiLiAiSIF [Eq. 1a]
where PFDSIF is the average PFD for a SIF. The first term in the equation is the contribution of
the sensors, the second term is the contribution of the final elements, the third term is the
contribution of the logic solvers, the fourth term is the contribution of the power supply, and the
last term is the contribution of the dangerous system failures. But as stated in ISA-TR84.00.0219
,
for this equation:
“…the systematic failure is modeled as an error that occurred during the specification,
design, implementation, commissioning, or maintenance that resulted in the SIF
component being susceptible to a random failure. Some systematic failures do not
manifest themselves randomly, but exist at time 0 and remain failed throughout the
mission time of the SIF. For example, if the valve actuator is specified improperly,
leading to the inability to close the valve under the process pressure that occurs during
the hazardous event, then the average value as shown in the above equation is not
applicable. In this event, the systematic failure would be modeled using λ*Ti. When
modeling systematic failures, the reader must determine which model is more appropriate
for the type of failure being assessed.” 19
This statement is accurate, but does not provide any practical guidance as to what systematic
errors are most significant. In practice, most of the systematic error term results from human
errors. These can include:
Manufacturer contribution for certified equipment (Believed to be negligible relative to
end user systematic errors)
End user systematic errors:
o Design and installation errors

27
o Probability of being failed following proof test
o Bypass during operation
Of these end user systematic errors, the dominating contribution is generally human errors that
leave the protection failed at Time 0. These errors can occur during re-commissioning of an SIF
following routine maintenance interventions such as:
Leaving a root valve on an instrument closed
Leaving a SIF in bypass, i.e.:
o Bypassing the function due to a spurious trip and failing to remove bypass.
o Bypassing the function for startup because the system dynamics require this,
however, the designers missed this need during startup mode of the process
resulting in an operational bypass that requires human intervention to remove the
bypass rather than an automated design that removes the bypass.
o Bypassing the final element and failing to remove bypass when the test or repair
is complete
Therefore, a simple equation including the systematic error terms can replace Eq. No. 1a from
ISA-TR84.00.02. The resulting improved equation is:
SYS-HUMiSYS-PROCiPSiLiAiSIF PPFDPFDPFDPFDPFDPFD Si [Eq. A]
Further, the overall systematic human error term can be expanded and written as:
PSYS-HUM = Pdesign error + Pinstallation + Pproof test error + Pbypassed [Eq. B]
Of the four terms in this equation, the first two can be detected and corrected during initial
commissioning steps for the SIF. Experience has shown that the last two terms, Pproof test error and
Pbypassed are likely to dominate the PSYS-HUM, though more industry data is needed to support this
observation. Making the assumption that PSYS-HUM is dominated by Pproof test error and Pbypassed,
Equation D can be further simplified to:
PSYS-HUM ≈ Pproof test error + Pbypassed [Eq. C]
Experienced gained from many accident investigations and also from calculations, support the
contention that for high SIL designs, the human errors during interventions Pproof test error +
Pbypassed, dominate the calculated PFDSIF. Unfortunately, most of the SIL verification calculations
today use the truncated Eq. No. 1 (instead of 1a) from ISA-TR84.00.02: 19
PSiLiAiSIF PFDPFDPFDPFDPFD Si [EQ. 1]
As a result, most SIL Verification calculations today ignore systematic errors when quantifying
their risk reduction capability. This is equivalent to saying the system boundary for an SIF only
includes the instrumented components (a subsystem), or Boundary A in Figure 3, instead of
including the entire independent protection layer (IPL) system, shown as Boundary B in Figure
3. In LOPA and other quantitative risk assessments, the entire IPL system must be considered.

28
Figure 3: Boundary for SIF
For example, as mentioned earlier in this paper, if the IPL is a PSV, then the IPL system
must include upstream and downstream features, such as isolation valves. Therefore, the
probability of leaving an isolation valve closed should be included as a contribution to the
overall PFD of the PSV IPL system.
Analyst performing LOPA should understand how to view and analyze the appropriate boundary
for an IPL, including a SIF.
For the remainder of this Case Study, we will concentrate on the effect of including the
systematic human errors for calculation of PFDSYS, and the effect this has on the resulting SIL.
For convenience, this paper arbitrarily sets SYS-PROCPFD ≈ zero. This is being done so the
reader can better focus on the human error aspect of systematic errors. PFDSYS-PROC is worthy of
its own paper as its significance is generally dependent on the process fluid properties and/or
ambient conditions.
The next two sections of this paper provide a basis for (1) the baseline error rate for human error
during interventions and (2) the error rates given coupling of activities, such as occur with
redundant systems. Following that, simple examples are provided to help show the relative
impact of including systematic human error terms in the calculation of PFDSYS.
Human Error Probability for a Single Execution of a Rule-Based Task
To calculate PSYS-HUMi, the type of tasks must be defined and the baseline error rate for such a
task needs to be established. Note that with excellent control of all of the human factors, a

29
company can begin to approach the lower limits that have been observed for human error.
Excellent control of all human factors means a robust design and implementation of management
systems for each human factor are achieved with a high level of operational discipline. The first
well-researched publication detailing potential lower limits of human error probability was by
Alan Swain and H Guttmann (NUREG-1278, 1983)18
and by others. However, many times, the
limits they referenced get used out of context. The lower limits in the NUREG-1278 assume
excellent human factors, but such excellent control is rarely, if ever achieved. Additionally,
some human errors listed by Swain and others were for a single error under highly controlled
conditions, or on a “best day” instead of average error probability or rate over an average year of
tasks. In general, Process Improvement Institute (PII) has found it best to use the average error
probabilities as discussed in the following section.
Error Probability for Rule-Based Actions that are Not Time Dependent:
Actions that do not have to be accomplished in a specific time frame to be effective are not time
dependent. It should be obvious then that these do not include response to alarms, or similar
actions with time limits. Values listed below represent the lower limits for human error rates,
assuming excellent control of human factors; these are expressed as the probability of making a
mistake on any step:
1/100 - process industry; routine tasks performed 1/week to 1/day. This rate assumes
excellent control of all human factors. Most places PII visits, the workers and managers and
engineers believe this is achievable, but not yet achieved.
1/200 - pilots in the airline industry; routine tasks performed multiple times a day with
excellent control of human factors. This average has been measured by a few clients in the
airline industry, but for obvious reasons they do not like to report this statistic.
1/1000 - for a reflex (hard-wired) action, such as either proactive or minor corrective actions
while driving a car, or very selective actions each day where your job depends on getting it
right each time and where there are error recovery paths (such as clear visual cues) to correct
the mistake. This is about the rate of running a stop sign or stop light, given no one is in
front of you at the intersection; the trouble is measuring this error rate, since you would have
to recognize (after the fact) that you made the mistake.
See earlier papers3,20
for more details on this topic.
Adjusting the lower limit rates to estimate a baseline rate at a site
As mentioned earlier, the lower limit rates assume excellent control of human factors in the
industry mentioned. Note that airline pilots have a lower error rate than what PII has measured
in the process industry. This is due, in part, to the much tighter control by the airlines and
regulators on factors such as fitness-for-duty (control of fatigue, control of substance abuse, etc.).
Excellent control of human factors is not achieved in many organizations; therefore the human
error rates will be higher than the lower limit, perhaps much as much as 20 times higher. Table 8
provides adjustment factors for each human factor. These factors can be used to adjust the lower
limit of error rate upward or downward as applicable, but the factors should not be applied
independently.

30
Human Factor
CategoryHuman Factor Issue/Level
Multiplier for
Cognitive &
Diagnosis Errors
Available Time Inadequate time P(failure)=100%
Barely adequate time (≈2/3 x nominal) 10
Nominal time (1x what is expected) 1
Extra time (at least 2x nominal and >20 min) 0.1
Expansive time (> 4 x nominal and > 20 min) 0.01
Stress/Stressors Extreme (threat stress) 5
High (time pressures such as during a maintenance
outage; issues at home, etc.)2
Nominal 1
Highly complex 5
Moderately complex (requires more than one staff) 2
Nominal 1
Obvious diagnosis 0.2
Low 10
Nominal 1
High 0.5
Not available in the field as a reference, but should be 20
Incomplete; missing this task or these steps 8
Available and >90% accurate, but does not follow format
rules (normal value for process industry)3
Good, 95% accurate, follows >90% of format rules 1Diagnostic/symptom oriented 1
Missing/Misleading (violates populational stereotype;
including round valve handle is facing away from worker)20
Poor or hard to find the right device; in the head calc 10
Some unclear labels or displays 2
Good 1
Unfit (high fatigue level (>80 hrs/wk or >20 hr/day, no day
off in 7-day period; or illness, etc.) 20
Highly degraded fitness (high fatigue such as >15
hr/day, illness, injury, etc.)10
Degraded Fitness (>12 hr day and >72 hr/wk) 5
Slight fatigue (>8 hr per day; normal value for process
industry )2
Nominal 1
Poor 2
Nominal 1
Good 0.8
Extreme 5
Good 1
No communication or system interference/damage 10
CommuncationNo standard for verbal communication rules (normal
value for process industry)3
Well implemented and practiced standard 1
(includes staffing
Issues) – for
responses only
(includes staffing
issues)
Work Environment
Complexity & Task
Design
Experience/Training
Procedures
Human-Machine
Interface (includes
tools)
Fitness for Duty
Work Processes &
Supervision
Table 8. SUMMARY TABLE of 10 HUMAN FACTOR CATEGORIES
Based in part on Gertman, D.; et. al., The SPAR-H Human Reliability Analysis Method, NUREG/CR-6883, U.S.
Nuclear Regulatory Commission, Office of Nuclear Regulatory Research, Washington, DC, August 2005.6 PII has
modified the list slightly to account for general industry data and terminology and to incorporate PII internal data.

31
For instance, even in the worst situations, we have not seen an error rate for an initiating event or
initial maintenance error higher than 1/5, although subsequent steps, given an initial error can
have an error rate approaching 1 due to coupling or dependency.
1/5 - highest error rates with poor control of human factors; this high rate is typically due to
high fatigue or some other physiological or psychological stress (or combination). This is the
upper limit of error rates observed with poor human factors and within the process industry.
The error rates in the Isomerization Unit the day of the accident at BP Texas City Refinery
(CSB, 2007)21
were about this rate. The operators, maintenance staff and supervisors had
been working about 30 days straight (no day off) of 12 hour shifts.
For the examples provided later in this paper will use a baseline error rate of 0.02 errors per
step, which is about average at the sites PII visited in the past 10 years. This could be justified
based on the fact that most chemical process sites do not control overtime during turnarounds
and/or do not have a system for controlling verbal communication of radios and phones. In
addition, for critical steps such as re-opening and car-sealing the block valves under a relief
valve after the relief valve is returned from maintenance is about 0.01 to 0.0422
; plus, the average
probability of making an unsafe error during maintenance of a relief is 0.0223,24,25
. Both of these
tasks have multiple checks and have rigorously enforced procedures (similar to what is done
when servicing a SIF and when using bypasses for an SIF) and yet the human error probability
remains about 0.02.
Human Error Probability for Multiple Executions of a Rule-Based Task
Coupled (dependent) Error Rates: Coupling represents the probability of repeating an error (or
repeating success) on a second identical task, given that an error was made on the first task. The
increased probability of failure on subsequent tasks given that an error has already been made is
known as dependence. The list below provides some starting point guidance on values to use:
1/20 to1/90 - if the same tasks are separated in time and if visual cues are not present to re-
enforce the mistake path. This error rate assumes a baseline error rate of 1/100 with
excellent human factors. If the baseline error is higher, then this rate will increase as well.
1/2 - if same two tasks performed back-to-back and strong visual cue is present, and if a
mistake is made on the first step of the two. This error rate assumes a baseline error of
1/100 with excellent human factors. If there the baseline error is higher, then this rate will
increase as well.
8/10 - if same three tasks performed back-to-back and strong visual cue is present, and if a
mistake is made on the first two steps of the three.
Two or more people become the same as one person (with respect to counting of errors from
the group), if people are working together for more than three days; this is due to the trust
that can rapidly build.
These factors are based on the relationships provided in NUREG-127818
and the related
definitions of weak and strong coupling provided in the training course by Swain (1993)26
on the
same topic. The following relationship is for errors of omission, such as failing to reopen a root
valve or failing to return an SIF to operation, after bypassing the SIF. The values in Table 9 are
based SPAR-H, 20056.

32
Table 9 Guideline for Assessing Dependence for a within-SIF Set of Identical Tasks (based
partially on SPAR-H, 20056, and partially on field observations by PII)
Level of
Dependence Same Person
Actions Close in
Time
Same Visual
Frame of
Reference (can
see end point of
prior task)
Worker
Required to
Write Something
for Each
Component
Zero (ZD)
No; the similar tasks
are performed by
different person/group
Either yes or no Either yes or no Either yes or no
Zero (ZD) Yes No; separated by
several days Either yes or no Either yes or no
Low (LD) Yes Low; the similar tasks
are performed on
sequential days
No Yes
Moderate
(MD) Yes
Moderate; the similar
tasks are performed
more than 4 hours apart
No No
High (HD) Yes Yes; the similar tasks are
performed within 2
hours
No No
Complete
(CD) Yes
Yes; the similar tasks are
performed within 2
hours
Yes Either yes or no
One can readily conclude that staggering of maintenance tasks for different channels of the same
SIF or for related SIFs will greatly reduce the level of dependent errors. Unfortunately, most
sites PII visits do not stagger the inspection, test, or calibration of redundant channels of the
same SIF or of similar SIF; the reason they cite is the cost of staggering the staff. While there is
a perceived short-term higher cost, the answer may be different when lifecycle costs are
analyzed.
Once the level of dependence is known, the probability of either repeat success or repeating
errors on identical tasks can be estimated. For these probabilities, we use Table 10, which is a
re-typing of Table 20-17 from NUREG-127818
and the similar table in SPAR-H6.

33
Table 10 Equations for Conditional Probabilities of Human Success or Failure on Task N, given
probability of Success (x) or Failure (X) on Task N-1, for Different Levels of Dependence
Level of Dependence
Repeating Success Equations
(but shown as error
probability)
Repeating Failure
Equations
Zero (ZD) PSucces@N = x PFailure@N = X
Low (LD) PSucces@N = (1+19x)/20 PFailure@N = (1+19X)/20
Moderate (MD) PSucces@N = (1+6x)/7 PFailure@N = (1+6X)/7
High (HD) PSucces@N = (1+x)/2 PFailure@N = (1+X)/2
Complete (CD) PSucces@N = 1.0 PFailure@N = 1.0
To illustrate the impact (sensitivity) on PFDSIF, we will look at a simple case and will not
provide the details on the calculation of the component aspects of PFDSIF, but instead will
provide the results of PFDCOMP to be the value obtained by using Equation A, but without the
systematic error terms (the same as using Eq. No. 1 from ISA-TR84.00.02). Then we will show
a simple way to estimate the system human error term (PFDSYS-HUM) and show the resulting
impact on PFDSIF. Figure 4 shows a candidate SIL 2 SIF.
Figure 4. Example of SIL 2 SIF (high level trip of compressor motor)

34
For the SIL 2 SIF described in Figure 4, the component PFDs were estimated using standard,
simplified equations for each, and using data available for component. For the case where the
sensors are voted 2oo3, the PFD of the SIF without consideration of discrete systematic error
yielded PFDCOMP = 0.008 (of which the 2oo3 voted sensor portion is 0.0025 and the 2oo3 voted
logic solver is 0.003).
For this example, the term SYS-HUMP is next estimated by summing the:
Probability of leaving the level sensor/transmitters 2oo3 root valves closed, causing an
unsafe failure. (This calculation is shown later.
Probability of miscalibration of the level transmitter/switch. This calculation is shown
later, but for this to be significant probability, all two of the three sensors/transmitters
must be miscalibrated, unless there is comparison checking, then it would require
miscalibration of all three transmitters.
Probability of leaving the entire SIF in BYPASS after maintenance or after some other
human intervention such as an inadvertent error or a necessity during startup; as before,
we will use the base error probability of 0.02 as a starting point.
Probability of leaving the relay bypass closed. As before, we will use the base error
probability of 0.02 as a starting point.
To aid in the calculation of the probability of leaving 2oo3 root valves closed, we use an event
tree to show the conditional probabilities for leaving Valve B closed, given Valve A is open or
closed, and similarly, the conditional probability of leaving Valve C closed, given Valve A or B
are closed or both Valve A and B are closed. Figure 5 shows the results of this calculation. For
the branch probabilities, the equations for high dependency of the human actions were used (See
Table 10); this reflects the more prevalent case of the maintenance of redundant channels being
maintained on the same day, by the person, and that level valves are within the visual field of the
worker. From Figure 5 the result for the probability of human error of leaving 2oo3 or 3oo3 of
the root valves closed is 0.0129. But, the comparison checking between sensors/transmitters will
alert the workers that a root valve is closed, so the only valid path is the 3oo3 path; the 3oo3
error case is the bottom row of the event tree in Figure 5. The probability of leaving all three
root valves closed is 0.0077.
From the same figure, we can also extract the conditional probability of leaving 3oo3
sensors/transmitters bypassed; assuming comparison checking is in place to note deviations and
correct the problem, only the case of 3oo3 errors is credible. This represents a strong recovery
path for the previous errors. The 3oo3 error case is the bottom row of the event tree in Figure 5.
The probability of miscalibrating all three sensors/transmitters is 0.0077.

35
Start Action A Action B Action C
2oo3 Vote
Dangerous
Correct 0.995
Correct 0.990
Incorrect 0.005
Correct 0.98
Correct 0.495
Incorrect 0.010
Incorrect 0.505 0.00495
Correct 0.745
Correct 0.490
Incorrect 0.255 0.00025
Incorrect 0.02
Correct 0.245 * 0.00025
Incorrect 0.510
Incorrect 0.755 0.00770
TOTAL= 0.01315
Figure 5. Calculation of Conditional Probability of Opening Root Valves; with the Last
Column Showing the Probability of Leaving Two or Three Valves Closed (using High
Dependence Equations)
SYS-HUMP = 0.0077 + 0.0077 + 0.02 + 0.02 = 0.055
This would then give an overall failure probability for the SIF of:
PFDSIF = PFDCOMP + PSYS-HUM = 0.008 + 0.055 = 0.063
Since the PFD is greater than 0.01, the instrumented system for high level protection in this
example does not qualify as a SIL 2 SIF when accounting for human error probabilities related to
interventions with the SIF.
Other variations are provided in an earlier paper, and are summarized below. 17
One means to improve the reliability and independence of the instrumented system is to use a
smart sensor/transmitter for the LSH which will detect null movement of the sensor reading,

36
indicating the valve is closed on the tap is plugged. Another possibility is to implement a limit
switch (or captive key system) on the root valve. There is a probability that these safeguards
against human error will also fail or be bypassed by the staff, but assuming the probability of that
failure is the same as other human errors for this example, 0.02, then the systemic human error
drops to about zero as the probability of leaving the root valve closed is now ANDed with the
probability of smart sensor/transmitter or limit switch failing,
SYS-HUMP = 0.0000 + 0.0077 + 0.02 +0.02 = 0.048
In this case the revised PFD of the instrument system becomes:
PFDSIF = PFDCOMP + PSYS-HUM = 0.008 + 0.048 = 0.056
Since the PFD is still greater than 0.01, the instrumented system for high level protection still
does not qualify as a SIL 2 SIF when accounting for human error probabilities related to
interventions with the SIF. But, we have reduced the errors related to dependent failures during
checking of the sensors/transmitters as much as possible.
As another alternative (instead of using smart sensors/transmitters or instead of installing limit
switches on the root valves) we can reduce potential dependent human error by staggering
maintenance activities across different shifts. This would drop the dependence to Low. The
result for the probability of human error of leaving 3oo3 of the root valves closed in 0.00016
(assuming that comparison of sensor readings alerts the workers that one root valve is closed).17
We can also calculate the conditional probability of leaving 3oo3 sensors/transmitters. As before,
only the case of 3oo3 errors is considered credible, since it was assumed that sensor comparison
checking was implemented where any transmitter not miscalibrated will provide the workers an
opportunity to note the deviation and take corrective action to fix the problem; this represents a
strong recovery path for the previous errors. The probability of miscalibrating all three
sensors/transmitters is 0.00016. 17
SYS-HUMP = 0.00016 + 0.00016 + 0.02 + 0.02 = 0.040
This would then give an overall failure probability for the SIF of:
PFDSIF = PFDCOMP + PSYS-HUM = 0.008 + 0.042 = 0.050

37
Since the PFD is still greater than 0.01, the instrumented system for high level protection still
does not qualify as a SIL 2 SIF when accounting for human error probabilities related to
interventions with the SIF. The weak link in this design is again the human error probability of
leaving either the relay bypass closed or the probability of leaving the entire SIF bypassed. This
is a common concern on all SIF that have system bypasses. The most effective way to drop
these error rates is to eliminate the capability for bypassing the relay and to eliminate the
capability for bypassing the entire SIF. Or; we can install a parallel relay with a selector switch
so that one relay (and only one) is aligned in the circuit to the motor of the compressor. This will
likely drop the relay systemic human error probability from 0.02 down to 0.0004 or lower. The
toughest bypass to eliminate is the one for the entire SIF. This is usually only feasible on batch
systems or on continuous operations that can be shut down completely for each test interval. 17
Sensitivity to Baseline Human Error Rate: Obviously, if the baseline human error probability
increases to 0.04 due to extra fatigue or extra stress due to schedule constraints, the PFD of the
systematic human error will increase substantially and the SIL 2 target becomes even less
attainable. Likewise, if suitable operational discipline is adopted to reduce the baseline human
error with independent performance measurement to validate the results, the human error rate
will be reduced (though it is likely not possible to reduce the baseline human error probability
enough to achieve a SIL 2 target, if a SIF bypass is present).
6. Acronyms Used
1oo2 One out of two voting architecture
1oo3 One out of three voting architecture
2oo3 Two out of three voting architecture
3oo3 Three out of three voting architecture
λ Failure Rate
A Final element
CD Complete Dependence
COMP Random hardware failure contributions to overall PFD
D Dangerous
F Failure/error term
HD High Dependence
HRA Human Reliability Analysis
IE Initiating Event
IEF Initiating Event Frequency
IPL Independent Protection Layer
LD Low Dependence
L Logic Solver
LOPA Layer of Protection Analysis
MOC Management of Change
P Probability
PES Programmable Electronic System
PFD Probability of Failure (dangerous) on Demand

38
PII Process Improvement Institute, Inc.
PS Power supply
PSV Pressure Safety Valve
S Sensor
SIF Safety Instrumented Function
SIL Safety Integrity Level
SIS Safety Instrumented System
SYS Systematic failure contributions to overall PFD
SYS-HUM Systematic errors and failures generated by human error
SYS-PROC Systematic errors and failures generated randomly by the process
TI Proof Test Interval
ZD Zero Dependence
7. Conclusion
As can be seen from the quantitative examples, systematic errors have the potential to
significantly impact a SIF in a negative manner. In addition, SIL verifications performed today
often do not account for this contribution to probability of failure. In such cases, it becomes
increasingly likely that the risk reduction assumed by analysts (who rely upon a SIL 2 to have a
PFD of 0.01 or lower) is not sufficient to satisfy corporate risk criteria when the actual risk
reduction estimated for the IPL is being counted on, such as an SIF replacing a relief valve, as
opposed to analyses that are simply performed on a comparative basis where consistency is more
important than the actual numbers.
The paper points to the need for companies to begin:
Accounting for systematic (and especially human systematic error probability) in SIL
Verifications; otherwise the risk reduction factor from this IPL will be unrealistically
optimistic.
Taking a more in-depth look at the management systems and work process in place for
operations and maintenance and their associated training and revalidation of
performance.
Utilizing the mathematics presented, companies can gain insight as to the relative effectiveness
of their practices and find areas where improvements can be made without adding any real cost.
Just as improved human factors improve safety, this is one of those cases where improved
performance if done properly with true operational discipline, should also improve reliability and
plant availability.
8. References
1. Guidelines for Preventing Human Error in Process Safety, CCPS/AIChE, 1994.
2. Human Factor Methods for Improving Performance in the Process Industries, CCPS
Concept Book, John Wiley, 2007.
3. Tew, R. and Bridges, W., Human Factors Missing from PSM, LPS/GCPS (AIChE), 2010.

39
4. University of South Australia (UniSA), Adelaide Centre for Sleep Research, SDA Fact
Sheet - AT03, 2006.
5. U.S. NRC, Fitness for Duty Programs, Preamble, 10 CFR 26, Revised 2005.
6. Gertman, D.; Blackman, H.; Marble, J.; Byers, J. and Smith, C., The SPAR-H Human
Reliability Analysis Method, NUREG/CR-6883, U.S. Nuclear Regulatory Commission,
Office of Nuclear Regulatory Research, 2005.
7. Della Rocco, P.S., et al., The Effects of Napping on Night Shift Performance, Federal
Aviation Administration, U.S. Department of Transportation, 2000.
8. Bridges, W., LOPA and Human Reliability, PPSS/GCPS (AIChE), 2010.
9. Rasmussen, J., Chemical Process Hazards Identification, Reliability Engineering and
Safety Systems 24, Elsevier Science Publishers Ltd., UK, 1989.
10. Bridges, W., and Clark, T., How to Efficiently Perform the Hazard Evaluation (PHA)
Required for Non-Routine Modes of Operation (Startup, Shutdown, Online Maintenance),
AIChE, 2011.
11. Guidelines for Hazard Evaluation Procedures, 3rd
Edition, 2008, CCPS/AIChE.
12. Guidelines for Investigating Chemical Process Incidents, 2nd
Edition, CCPS/AICHE,
2003.
13. Bridges, W., Gains in Getting Near Misses Reported (Updated), 8th
GCPS, AIChE, 2012.
14. Bridges, W., and Clark, T., LOPA and Human Reliability – Human Errors and Human
IPLs (Updated), 7th GCPS, Chicago, AIChE, 2011.
15. Guidelines for Chemical Process Quantitative Risk Analysis (CPQRA), 2nd
Ed,
CCPS/AIChE, 2000.
16. Stack, R., and Delanoy, P., Evaluating Human Response to An Alarm for LOPA or Safety
Studies, LPS/GCPS, 2010.
17. Bridges, W., and Thomas, H., Accounting for Human Error Probability in SIL
Verification Calculations, 8th GCPS, AIChE, 2012.
18. Swain, A., and Guttmann, H., Handbook of Human Reliability Analysis with Emphasis on
Nuclear Power Plant Applications, Sandia National Laboratories, 1983 [this document
became NUREG/CR-1278– The Human Reliability Handbook, guidelines from the US
NRC on Human Reliability Analysis].
19. ANSI/ISA 84.00.01-2004 (IEC61511-1 Mod), Functional Safety: Safety Instrumented
Systems for the Process Industry Sector - Part 1: Framework, Definitions, System,
Hardware and Software Requirements, 2004.
20. Bridges, W., and Collazo-Ramos, G., Human Factors and their Optimization, 8th GCPS,
AIChE, 2012.
21. U.S. Chemical Safety and Hazard Investigation Board, Investigation Report, Refinery
Explosion and Fire, Report No. 2005-04-I-TX, March 2007.

40
22. Guidelines for Initiating Events and Independent Protection Layers, 2013 (pending),
CCPS/AIChE.
23. Bukowski, Julia V. and Goble, William M., Villanova University, Analysis of Pressure
Relief Valve Proof Test Data, Process Safety Progress, AICHE, March 2009.
24. Bukowski, Julia V. and Goble, William M., Villanova University, Analysis of Pressure
Relief Valve Proof Test Data: Findings and Implications, 10th
Plant Process Safety
Symposium, AICHE, 2008.
25. Bukowski, Julia V., Results of Statistical Analysis of Pressure Relief Valve Proof Test
Data Designed to Validate a Mechanical Parts Failure Database, Technical Report,
September, exida, Sellersville, PA, 2007.
26. Swain, A., Human Reliability Analysis, Training Course, ABS Consulting (formerly JBF
Associates), 1993.