the impact of healthcare-associated infections in ... health care cost containment council february...
TRANSCRIPT

Pennsylvania Health Care Cost Containment CouncilFebruary 2011
The Impact of Healthcare-associated
Infections in Pennsylvania2009

Table of ContentsKey Findings .........................................................................1
Introduction .........................................................................2
Hospital Stays with HAIs ..................................................4
Readmissions .......................................................................8
Medicare Payments ........................................................11
HAIs by Facility Type .......................................................14
HAIs and Patient Demographics ................................15
HAIs by Payer ....................................................................18
About PHC4The Pennsylvania Health Care Cost Containment Council (PHC4)
is an independent state agency established by Pennsylvania law
(Act 89 of 1986, as amended). PHC4 is charged with collecting,
analyzing and reporting information that can be used to improve
the quality and restrain the cost of health care in Pennsylvania.

1
Key Findings
• ThemortalityrateforpatientswhoacquiredanHAIduringtheirhospitalizationwas9.4percent.Themortalityratewas1.8percentforpatientswithoutanHAI.
• Theaveragelengthofstayamongpatientswhoacquiredaninfectionduringtheirhospitalstaywas21.6days.Theaveragelengthofstayforpatientswhodidnotacquireaninfectionwas4.9days.
• OfMedicarebeneficiariesage65andoldertreatedinPennsylvaniageneralacutecarehospitals,10,721(1.5percent)contractedanHAIduringtheirhospitalstay.TheestimatedMedicarepaymentforthesehospital-izationsaveraged$20,471.TheestimatedaverageMedicarepaymentforhospitalizationswithoutanHAIwas$6,615.
Readmissions• Ofthepatientswhoacquiredaninfectionduringtheirhospitalstay,29.8
percentwerereadmittedwithin30daysforaninfectionorcomplication.OfthepatientswithoutanHAI,6.2percentwerereadmittedwithin30daysforaninfectionorcomplication.
• Patientswhoacquiredsurgicalsiteinfectionshadthehighestreadmis-sionratewithin30daysforaninfectionorcomplicationat53.6percent.
• OftheMedicarepatientsage65andolderwhoacquiredaninfectionduringtheirhospitalstay,29.5percentwerereadmittedwithin30daysforaninfectionorcomplication.TheestimatedtotalMedicarepaymentforthesereadmissionswasmorethan$24.6million.OftheMedicarepatientsage65andolderwithoutanHAI,8.7percentwerereadmittedforaninfectionorcomplication.
Why Patients Were Hospitalized
It is important to note that the outcomes reported for patients with an HAI may not have been related to the infection. Some of the differences in outcomes between patients with and without an HAI may have been influ-enced by other factors, including the complex medical needs of the patient that necessitated hospitalization. See page 7 of this report for two scenarios which demonstrate that not all HAIs equally impact patient outcomes.
Reducing hospital readmis-sions presents opportunities to improve patient care and reduce health care costs; but even with optimal care, not all readmis-sions are avoidable. While there is ongoing debate about the best way to identify preventable readmissions, a reasonable place to focus attention might be on patients who are readmitted for infection or complication.
Top Reasons for Admission for Patients with an HAIPrimary cancerInpatient rehabilitation careSepticemiaRespiratory failure (adult)Complication of internal device, implant, or graft
Top Procedures for Patients with a Surgical Site InfectionColon and rectal surgeryCesarean section (C-section)Knee replacement surgeryCardiac surgerySpinal fusion/refusion
• Ofthe1,939,111patientsadmittedtoPennsylvaniahospitalsin2009,23,287(1.2percent)contractedatleastonehealthcare-associatedinfection(HAI)duringtheirstay.
Urinary Tract 22.2%
Pneumonia 9.6%
Bloodstream10.2%
Surgical Site 24.8%
Gastrointestinal17.8%
Other Infections*
7.7%
MultipleInfections
7.7%
Distribution of HAIs Across Infection Types
* Other infections include: bone and joint; central nervous system; cardiovascular system; eye, ear, nose, throat or mouth, including upper respira-tory; lower respiratory system (other than pneumonia); reproductive system; skin and soft tissue; and systemic infections.

2
Healthcare-associatedinfectionsareoneofthenation’smostimportantpublichealthchallenges.TheCentersforDiseaseControlandPrevention(CDC)estimatesthat1.7millionpatientscontracthealthcare-associatedinfections,alsoknownasHAIs,everyyearandnearly99,000ofthemdie.1The
annualdirectmedicalcostsofHAIstoU.S.hospitalsrangefrom$28.4to$33.8billion.2
ThePennsylvaniaHealthCareCostContainmentCouncil(PHC4)beganreportingonHAIsin2005.WiththeenactmentofAct52of2007,hospitalsbeganreportingHAIdatausingtheCDC’sNationalHealthcareSafetyNetwork(NHSN),whichisaweb-basedsurveillancesystemforcapturingfacility-widedataontheoccurrenceofreportableHAIs.ThisdataisthenmadeavailabletoPHC4,thePennsylvaniaDepartmentofHealth(DOH),andthePennsylvaniaPatientSafetyAuthority.ParticipationinNHSNisastate-mandatedrequirementforhealthcarefacilitiesinanincreasingnumberofstates.
AspartofAct52requirements,DOHpubliclyreportshospital-specificHAIrates.Initsmostrecentreport,DOHnoteda12.5percentdeclineinHAIsstatewidefrom2008to2009.3HospitalsacrossPennsylvaniaaremakinggreatstridestopreventHAIsthroughstrictadherencetoevidence-basedpracticesandadoptionofnewertechnologies.Infectionpreventionists—alongwithhospitalleadership,medicalprofessionalsandad-ministrativestaff—areworkingcollaborativelytotrackHAIsandtofocusonproventechniquesthatimproveinfectioncontrol.
Usingitshospitaldischargedata,PHC4isinauniquepositiontoexaminetheimpactHAIshaveonthepatientswhoacquirethem.Thisreportincludesdatafrom2009andexaminesmortalityrates,readmissionrates,lengthsofhospitalstay,hospitalcharges,paymentinformation,andotherdataasitrelatestopatientswhocontractHAIs.
Understanding the Report
Data Thedatainthisreportcamefromthreesources.UsingtheCDC’sNHSN,hospitalsreportedinfections
theyidentifiedasHAIs,whichweresubjectedtovalidationandcorrectionprocessesbyDOH.InformationoninpatientdischargesfromJanuary1,2009toDecember31,2009wassubmittedbyhospitalsdirectlytoPHC4andwassubjectedtoPHC4validationandcorrectionprocesses.TheMedicarepaymentdatawasprovidedbytheCentersforMedicareandMedicaidServices.
Cases Included in the ReportThisreportincludesinformationon1,939,111patientstreatedinPennsylvaniahospitalsduringcalendar
year2009.Thesepatientsweretreatedinseveraltypesofinpatientfacilities:1)generalacutecarehospitals,includingacutecarehospitalswhosecareislimitedtospecialpopulationsormedicalconditions;2)long-term
1. Klevens, R., Edwards, J. R., Richards, C. L., Horan, T. C., Gaynes, R. P., Pollock, D. A., & Cardo, D. M. (2007). Estimating health care-associated infec-tions and deaths in U.S. hospitals, 2002. Public Health Reports, 122, 160-166.
2. Scott, R. D. (2009). The direct medical costs of healthcare-associated infections in U.S. hospitals and the benefits of prevention, 2009. Division of Healthcare Quality Promotion, National Center for Preparedness, Detection, and Control of Infectious Diseases, Coordinating Center for Infec-tious Diseases, Centers for Disease Control and Prevention.
3. The Pennsylvania Department of Health. (2010). Healthcare-associated infections (HAI) in Pennsylvania hospitals – 2009 (technical report).
Introduction

3
Introduction
acutecarehospitals,whichtreatpatientswithacuteconditionsthatneedlongertermcarethanprovidedinageneralacutecarehospital;3)inpatientrehabilitationhospitals;4)inpatientpsychiatrichospitals;and5)otherinpatientfacilitytypessuchasthosefordrugandalcoholtreatment.
Measures Reported
Number and Percent of Cases–Thenumberandpercentofcaseswithinfectionsrepresentthenumber/percentofhospitalizationsinwhichthepatientcontractedahealthcare-associatedinfectionasidentifiedandreportedbythehospital.Thenumberandpercentofcaseswithoutinfectionsarealsoreported.
Percent of Mortality–Thepercentofmortalityrepresentsthepercentofpatientswhodiedduringthehospital-ization.Itisimportanttonotethatthecauseofdeathmaynothavebeenrelatedtothehealthcare-associatedinfection.
Number and Percent of Readmissions for Any Reason–Thesefiguresrepresentthenumber/percentofpatientswhowerereadmittedforanyreasoninanyPennsylvaniahospital,wheretheadmitdatewaswithin30daysofthedischargedateoftheoriginalhospitalization. Whilesomere-hospitalizationscanbeexpected,high-qualitycaremaylessentheneedforsubsequenthospitalizations.
Percent of Readmissions for Infection or Complication–Unlikethepreviousmeasurewhichtakesintoconsiderationallsubsequenthospitalizationswithin30daysofdischargeoftheoriginalhospitalization,thepercentofread-missionsforinfectionorcomplicationrepresentsthepercentofpatientswhowerereadmittedwithaprincipaldiagnosisofaninfectionorcomplication.
Average Length of Stay –Theaverage(mean)lengthofstayrepresentsthenumberofdays,onaverage,apatientstayedinthehospital.Howlongapatientstaysinthehospitalmayreflectuponthesuccessofthetreatment.
Average Hospital Charge –Theaverage(mean)chargeistheamountahospitalbillsforapatient’scare.Averagehospitalchargesincludethefacilityfee,butdonotincludeprofessionalfees(e.g.,physicianfees)anddonotreflecttheamountthatahospitalisactuallyreimbursed.Generally,hospitalsdonotreceivefullreimburse-mentofchargesbecauseinsurancecompaniesandotherlargepurchasersofhealthcareusuallynegotiatelargediscounts.Theaveragechargereportedisfortheentirelengthofstay,andnotjustforthetreatmentrelatedtotheinfection.
Estimated Average Medicare Payment –Thisistheestimatedaverage(mean)amountgeneralacutecarehospitalswerepaidforcareofMedicarepatientsinthefee-for-servicesystem.Patientliabilities(e.g.,coinsuranceanddeductibledollaramounts)werenotincluded.PaymentsfromMedicareAdvantageplans(MedicareHMOs)werenotincluded.Theamountpaidisdifferentfromahospitalcharge.Theaveragepaymentreportedisfortheentirelengthofstay,andnotjustforthetreatmentrelatedtotheinfection.OnlyMedicarepatientsage65andolderwereincludedinthisanalysis;Medicarebeneficiariesunderage65werenotincluded. TheaverageMedicarepaymentswereestimatedfor2009hospitalizationsusing2008Medicarepaymentdatasince2008datawasthemostrecentdataavailabletoPHC4.

4
Urinary Tract 22.2%
Pneumonia 9.6%
Bloodstream10.2%
Surgical Site 24.8%
Gastrointestinal17.8%
Other Infections*
7.7%
MultipleInfections
7.7%
Distribution of HAIs Across Infection Types
Thissectionprovidesfindingsonalltypesofhealthcare-associatedinfections(HAIs)inPennsylvaniaincludingthemostcommonprincipaldiagnosesforstayswithHAIsandpatientoutcomesforhospi-talizationswithHAIs. In2009,therewere1,939,111patientsadmittedtoPennsylvaniahospitals;
23,287(1.2percent)ofthesepatientscontractedatleastoneHAIduringtheirstay.ThelargestpercentoftheseHAIsweresurgicalsiteinfections(24.8percent),followedbyurinarytractinfections(22.2percent)andgastrointestinalinfections(17.8percent).
Hospital Stays with HAIs
23,287 Patients with an HAI - 1.2% of 2009 Hospitalizations
* Other infections include: bone and joint; central nervous system; cardiovascular system; eye, ear, nose, throat or mouth, including upper respira-tory; lower respiratory system (other than pneumonia); reproductive system; skin and soft tissue; and systemic infections.

5
Common Principal DiagnosesThetablebelowdisplaysthetop25principalreasonsthatpatientswhocontractedanHAIwereoriginally
admittedtoahospitalin2009.Inadditiontotheprincipalreasonsforadmission,PHC4dataprovidesinfor-mationregardingpatients’hospitalexperiencesincludingmortalityrates,averagelengthofstayandreadmis-sionrates.Historically,comparisonofpatientswithandwithoutHAIshasdemonstratednotableincreasesinmortalityandlengthofstayforthehospitalizationsinwhichanHAIoccurred.Thetablebelowdemonstratesthissamepatternformortalityand30-dayreadmissionsforeachoftheconditionsreported:mortalityandreadmissionpercentagesarehigherforcaseswithinfectionsthanforthosewithoutaninfection.
Top 25 Reasons for Admission for Patients with an HAI
Hospital Stays with HAIs
Principal Reason for Admission*
Patients with an HAI Patients without an HAI
Numberof Cases
Percent of All Cases with HAI
Mortality Percent
Percent of Patients
Readmitted for Any Reason
Numberof Cases
Percent of All Cases without HAI
Mortality Percent
Percent of Patients
Readmitted for Any Reason
Total Cases† 23,287 100.0% 9.4% 40.7% 1,915,824 100.0% 1.8% 16.3%
Primary cancer 1,657 7.1% 9.4% 44.6% 48,544 2.5% 3.1% 18.3%Inpatient rehabilitation care 1,077 4.6% 0.4% 29.2% 40,852 2.1% 0.2% 19.9%Septicemia 1,027 4.4% 22.9% 36.3% 36,289 1.9% 15.4% 23.5%Respiratory failure (adult) 1,022 4.4% 19.4% 38.4% 18,738 1.0% 15.7% 26.9%Complication of internal device, implant, or graft 876 3.8% 10.5% 51.5% 35,925 1.9% 1.6% 22.3%Stroke 752 3.2% 9.2% 31.6% 28,791 1.5% 7.9% 17.9%Intestinal inflammation 742 3.2% 6.3% 40.1% 40,272 2.1% 0.8% 16.2%Fracture of hip, leg, or foot 724 3.1% 5.5% 38.6% 27,864 1.5% 1.4% 13.2%Complication of surgical procedure or medical care 665 2.9% 6.5% 36.0% 26,942 1.4% 1.1% 19.9%
Arthritis and joint disorders 617 2.6% 0.8% 48.0% 55,328 2.9% 0.1% 6.0%Pregnancy and related conditions 558 2.4% 0.4% 38.8% 152,433 8.0% <0.1% 4.0%Heart failure 553 2.4% 13.0% 41.5% 57,018 3.0% 3.0% 26.8%Fetal and newborn conditions and complications 551 2.4% 6.0% 31.6% 145,294 7.6% 0.4% 5.1%Spinal cord injury and head trauma 517 2.2% 9.7% 30.0% 15,674 0.8% 5.4% 14.1%Heart attack 513 2.2% 13.5% 35.4% 31,929 1.7% 5.6% 18.6%Intestinal obstruction 490 2.1% 8.6% 34.1% 16,697 0.9% 1.9% 18.6%Coronary (heart) artery disease and chest pain 472 2.0% 4.2% 45.8% 77,018 4.0% 0.2% 14.2%Osteoporosis and back disorders 462 2.0% 1.9% 66.7% 35,934 1.9% 0.1% 8.9%Mental health disorders 435 1.9% 0.2% 21.8% 120,471 6.3% 0.1% 18.1%Peripheral vascular disease (PVD) 421 1.8% 11.6% 53.9% 20,291 1.1% 2.6% 19.2%Abdominal hernia 411 1.8% 5.1% 46.8% 10,263 0.5% 1.1% 11.1%Secondary cancer 380 1.6% 14.7% 40.4% 16,174 0.8% 5.7% 27.8%Pneumonia 367 1.6% 16.1% 43.2% 50,440 2.6% 3.6% 17.2%Acute kidney failure 350 1.5% 15.7% 34.3% 21,407 1.1% 4.6% 24.2%Leukemia and lymphomas 339 1.5% 18.6% 54.1% 4,501 0.2% 7.9% 40.9%
* Principal reasons for admission are based on the Agency for Healthcare Research and Quality’s Clinical Classifications Software (CCS).† Calculations for Total Cases include all cases, not just the cases included in the top 25 reasons for admission.

6
Number of Cases
Percent of All Cases with HAI
Mortality Percent
AverageLength of Stay
(in Days)
Percent of Patients
Readmitted for Any Reason
AverageCharge*
Estimated Average
Medicare Payment
Total Cases 1,939,111 NA 1.9% 5.1 16.5% $40,869 $6,839
Cases with Infections 23,287 1.20% 9.4% 21.6 40.7% $306,943 $20,471
Urinary Tract 5,175 0.27% 5.5% 19.6 27.8% $177,963 $15,055
Pneumonia 2,238 0.12% 24.3% 23.8 30.9% $312,055 $27,664
Bloodstream 2,365 0.12% 18.0% 31.1 38.2% $370,738 $24,908
Surgical Site† 5,772 0.60% 1.3% 10.0 60.1% $124,599 $15,331
Gastrointestinal 4,144 0.21% 8.9% 18.6 37.8% $175,153 $14,932
Other Infections‡ 1,799 0.09% 7.2% 26.5 29.7% $271,768 $26,817
Multiple Infections 1,794 0.09% 20.4% 52.2 39.8% $1,514,894 $47,837
Cases without Infections 1,915,824 NA 1.8% 4.9 16.3% $37,635 $6,615
Patient OutcomesTounderstandtheimpactofHAIsonindividualpatientsandhealthcareresources,PHC4evaluatedmor-
tality,lengthofstay,averagehospitalchargeand,forthefirsttime,readmissions.Inadditiontothe30-dayreadmissionfigurespresentedinthetablebelow,moredetailedinformationabouttheimpactofreadmissionsispresentedinthenextsection.TofurtherquantifythefinancialimpactofHAIs,asectiononMedicarepay-mentsisalsoincludedinthisreport.
* In almost all cases, hospitals do not receive full reimbursement of charges. On an average basis, across all statewide inpatient cases (not just cases with infections), hospitals were paid approximately 26 percent of established charges in fiscal year 2009, based on financial data hospitals submitted to PHC4.
† Calculations for percent of surgical site infections only include those patients who underwent a surgical procedure.‡ Other infections include: bone and joint; central nervous system; cardiovascular system; eye, ear, nose, throat or mouth, including upper respira-
tory; lower respiratory system (other than pneumonia); reproductive system; skin and soft tissue; and systemic infections.
Hospital Stays with HAIs
4. Lucado, J., Paez, K., Andrews, R., & Steiner, C. (2010). Adult hospital stays with infections due to medical care, 2007. Agency for Healthcare Research and Quality, Healthcare Cost and Utilization Project.
5. Peng, M. M., Kurtz, S., & Johannes, R. S. (2006). Adverse outcomes from hospital-acquired infection in Pennsylvania cannot be attributed to increased risk on admission. American Journal of Medical Quality, 21(6), 17S-28S.
HAIsareacommoncauseofmorbidityandmortality.4In2009,patientswhocontractedaninfectionwhilehospitalizedinPennsylvaniahadhighermortalityandreadmissionrates,longerlengthsofstay,andhigherestimatedaverageMedicarepayments.However, it is important to note that these patient outcomes may not have been related to the infection.Someofthedifferencesinoutcomesmaybeinfluencedbyotherfactors,includingthecomplexmedicalneedsofthepatientthatnecessitatedhospitalization.Still,onestudythatexam-inedthedifferencesinmortality,lengthofstayandhospitalchargesforhospitalizationsthatcontainedanHAIandthosethatdidnotfoundthatthedifferencesinthesemeasurescannotbeexplainedonthebasisofhowsickthepatientwasatthetimeofadmission.5
Unlikethechargedatapresentedinthetableabove,theaverageMedicarepaymentsareestimatesofwhatgeneralacutecarehospitalswereactuallyreimbursedforthetreatmentofMedicarepatients. TheestimatedMedicarepaymentsonlyincludehospitalizationsforMedicarepatientswhoareage65andolder;Medicarebeneficiariesunderage65werenotincludedinthisanalysis.
7
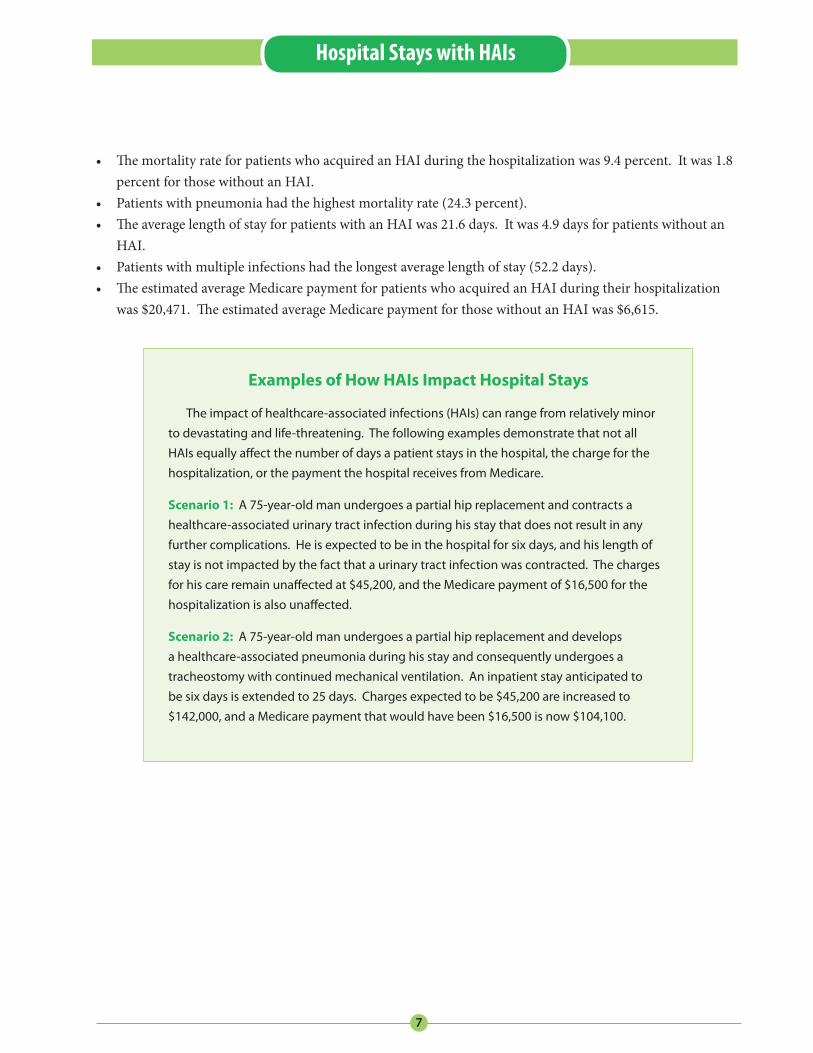
Examples of How HAIs Impact Hospital Stays
The impact of healthcare-associated infections (HAIs) can range from relatively minor to devastating and life-threatening. The following examples demonstrate that not all HAIs equally affect the number of days a patient stays in the hospital, the charge for the hospitalization, or the payment the hospital receives from Medicare.
Scenario 1: A 75-year-old man undergoes a partial hip replacement and contracts a healthcare-associated urinary tract infection during his stay that does not result in any further complications. He is expected to be in the hospital for six days, and his length of stay is not impacted by the fact that a urinary tract infection was contracted. The charges for his care remain unaffected at $45,200, and the Medicare payment of $16,500 for the hospitalization is also unaffected.
Scenario 2: A 75-year-old man undergoes a partial hip replacement and develops a healthcare-associated pneumonia during his stay and consequently undergoes a tracheostomy with continued mechanical ventilation. An inpatient stay anticipated to be six days is extended to 25 days. Charges expected to be $45,200 are increased to $142,000, and a Medicare payment that would have been $16,500 is now $104,100.
Hospital Stays with HAIs
• ThemortalityrateforpatientswhoacquiredanHAIduringthehospitalizationwas9.4percent.Itwas1.8percentforthosewithoutanHAI.
• Patientswithpneumoniahadthehighestmortalityrate(24.3percent).• TheaveragelengthofstayforpatientswithanHAIwas21.6days.Itwas4.9daysforpatientswithoutan
HAI.• Patientswithmultipleinfectionshadthelongestaveragelengthofstay(52.2days).• TheestimatedaverageMedicarepaymentforpatientswhoacquiredanHAIduringtheirhospitalization
was$20,471. TheestimatedaverageMedicarepaymentforthosewithoutanHAIwas$6,615.

8
Number of Patients
Readmitted for Any Reason
Percent of Patients
Readmitted for Any Reason
Percent of Patients Readmitted
for an Infection or Complication
Patients who contracted an HAI during their initial hospitalization and were readmitted within 30 days 7,590 40.7% 29.8%
Urinary Tract 1,230 27.8% 16.2%
Pneumonia 473 30.9% 20.4%
Bloodstream 603 38.2% 22.0%
Surgical Site 3,129 60.1% 53.6%
Gastrointestinal 1,300 37.8% 24.5%
Other Infections† 394 29.7% 17.4%
Multiple Infections 461 39.8% 27.3%
Patients who did not contract an HAI during their initial hospitalization and were readmitted within 30 days 260,350 16.3% 6.2%
Readmissions
* Of the 1,939,111 patients admitted to Pennsylvania hospitals in 2009, 1,619,750 were evaluated for possible readmissions: 18,656 (of the 23,287) patients who contracted an HAI during the initial hospitalization and 1,601,094 patients who did not. Patients who died, were out-of-state resi-dents, or for which data needed to link hospitalizations was missing were not included in this readmission analysis.
6. Jencks, S. F., Williams, M. V., & Coleman, E. A. (2009). Rehospitalizations among patients in the Medicare fee-for-service program. New England Journal of Medicine, 360, 1418-1428.
† Other infections include: bone and joint; central nervous system; cardiovascular system; eye, ear, nose, throat or mouth, including up-per respiratory; lower respiratory system (other than pneumonia); reproductive system; skin and soft tissue; and systemic infections.
Why Look at Readmissions? Reducingreadmissionsisapriorityamongthemedicalcommunity,researchersandpolicymakerswho
arefocusedonidentifyingthecausesofreadmissionsandimplementingevidence-basedstrategiestoreducethosethatarepreventable. Onenationalstudyfoundthatalmostone-fifthofMedicarepatientsarereadmittedwithin30daysofdischargeandathirdarerehospitalizedwithin90days.6 Assuch,examiningreadmissionratesisimportantfrombothaqualityofcareandcoststandpoint. Whilenotallreadmissionscanbeprevent-ed,high-qualitycaremaylessentheneedforsubsequenthospitalizations.
Ofthepatientsincludedinthisanalysis*whocontractedahealthcare-associatedinfection(HAI)duringtheirinitialhospitalstay,40.7percent(7,590)werereadmittedforanyreasontoaPennsylvaniahospitalwithin30dayswith29.8percentreadmittedspecificallyforaninfectionorcomplication. Forpatientswhohadnotcontractedaninfectionduringtheirinitialhospitalstay,16.3percentwerereadmittedforanyreasonwith6.2percentreadmittedspecificallyforaninfectionorcomplication. AmongpatientswithHAIsinthisanalysis,thereportedHAIwascontractedduringthepatient’sinitialhospitalization,notthereadmission.
Thetablebelowdisplaysthenumberandpercentofpatientswhowerereadmittedtoahospitalwithin30daysandthepercentofpatientsforwhichtheprincipalreasonforthereadmissionwasaninfectionorcomplication.• Patientswhocontractedasurgicalsiteinfectionhadthehighestreadmissionrateforanyreasonat60.1
percent,followedbypatientswhocontractedmultipleinfectionsat39.8percent,patientswhocontractedabloodstreaminfectionat38.2percentandpatientswhocontractedagastrointestinalinfectionat37.8percent.
• Patientswithsurgicalsiteinfectionsalsohadthehighestpercentofreadmissionsforaninfectionorcom-plicationat53.6percent,followedbythosewithmultipleinfectionsat27.3percentandgastrointestinalinfectionsat24.5percent.

9
Readmissions
Surgical Site Infections: A Special Look at Readmissions
SincesurgicalsiteinfectionswerethemostcommonlyoccurringHAIandhadthehighestpercentofreadmissionswithin30days,PHC4tookafurtherlookatthistopic. Slightlymorethan60percentofpatientswhocontractedasurgicalsiteinfectionwerereadmittedforanyreasonwithover53percentreadmittedforaninfectionorcomplication. Ofthe5,772patientswhohadasurgicalsiteinfection,23.1percentwereidentifiedbeforethepatientwasdischargedfromthehospitalwheretheprocedurewasperformed. For76.9percentofpatients,theirsurgicalsiteinfectionswereidentifiedduringpost-dischargesurveillance,thatis,areadmis-siontothesameoradifferenthospital,afollow-upvisittoaphysicianoffice,orasurgeonsurveyviamailorphone. Whenadifferenthospital,physician,orsurgeonofficeidentifiestheinfection,theyreportitbacktothehospitalwheretheprocedurewasperformed. ThehospitalwheretheprocedurewasperformedattributestheinfectiontoaparticularprocedurecategoryandreportstheinfectionintotheNationalHealthcareSafetyNetwork(NHSN). Theextentofahospital’spost-dischargesurveillancemayaffectthenumberofsurgicalsiteinfectionsreported.
Thetableonthefollowingpageliststhetop20procedurecategoriesforthe5,772patientswhoacquiredasurgicalsiteinfection.Thetabledisplaysthefollowinginformationforeachofthetop20procedures:1)thenumberand/orpercentofallpatientswhounderwentaparticularprocedureanddidordidnotacquireasur-gicalsiteinfection,and2)thepercentofreadmissionsforpatientswhodidordidnotcontractasurgicalsiteinfection.
• Foreachoftheprocedureslistedinthetable,thereadmissionpercentagesarehigherforthepatientswhoacquiredasurgicalsiteinfection.
• Oftheprocedureslisted,patientswhoacquiredasurgicalsiteinfectionwithsurgeryofthespine(laminec-tomy)forstenosisorherniateddiscastheirprocedurehadthehighestpercentofreadmissionsforaninfec-tionorcomplicationat78.3percent;ofthepatientswhounderwentthisprocedureanddidnotacquireasurgicalsiteinfection,3.0percentwerereadmittedforaninfectionorcomplication.
• At75.2percent,patientswhounderwentspinalfusion/refusionandcontractedasurgicalsiteinfectionhadthesecondhighestreadmissionrateforaninfectionorcomplication;ofthespinalfusion/refusionpatientswhodidnotacquireasurgicalsiteinfection,3.6percentwerereadmittedforaninfectionorcomplication.
• Whilecolonandrectalsurgerywastheprocedurewiththehighestnumberofpatients(758)whoacquiredasurgicalsiteinfection,peripheralvascularbypasswastheprocedurewiththehighestpercentofpatientswhoacquiredsurgicalsiteinfections. Ofallthepatientswhounderwentperipheralvascularbypasssur-gery,approximately7.1percentcontractedasurgicalsiteinfection.

10
Top 20 Procedure Categories with a Surgical Site Infection (SSI)
Readmissions
Procedure Category*
Total Number of
Patients who
Underwent Procedure†
Patients with a SSI Patients without a SSI
Number of
Cases†‡
Percent of
Cases‡
Percent of Patients
Readmitted for Any Reason
Percent of Patients
Readmitted for an
Infection or Complication
Number of
Cases†‡
Percent of Patients
Readmitted for Any Reason
Percent of Patients
Readmitted for an
Infection or Complication
Total Cases** 956,744 5,772 0.60% 60.1% 53.6% 950,972 14.1% 6.5%
Colon and rectal surgery 17,250 758 4.39% 49.5% 43.3% 16,492 14.4% 9.1%
Cesarean section (C-section) 45,105 348 0.77% 45.2% 41.9% 44,757 1.9% 0.8%
Knee replacement surgery 37,285 346 0.93% 58.2% 54.5% 36,939 5.8% 3.4%
Cardiac surgery 17,950 336 1.87% 72.2% 64.8% 17,614 16.6% 10.1%
Spinal fusion/refusion 19,273 328 1.70% 79.6% 75.2% 18,945 6.6% 3.6%
Hip replacement surgery 22,984 298 1.30% 67.9% 65.2% 22,686 8.9% 5.5%
Surgery to repair bone fracture 18,163 252 1.39% 53.8% 47.4% 17,911 10.1% 5.5%
Brain surgery 9,398 231 2.46% 65.9% 45.3% 9,167 22.6% 10.7%
Surgery to repair hernia 6,925 231 3.34% 57.1% 53.8% 6,694 8.7% 5.2%
Hysterectomy (via abdominal incision)
15,236 224 1.47% 61.5% 54.5% 15,012 4.7% 3.2%
Abdomen/abdominal cavity surgery 7,394 206 2.79% 44.1% 33.9% 7,188 16.2% 9.7%
Small bowel surgery 5,857 196 3.35% 47.5% 37.4% 5,661 18.8% 11.2%
Peripheral vascular bypass surgery 2,642 187 7.08% 69.6% 64.6% 2,455 19.7% 10.5%
Surgery of spine (laminectomy) for stenosis or herniated disc
14,652 178 1.21% 81.3% 78.3% 14,474 5.8% 3.0%
Liver, pancreas, and bile duct surgery
3,422 136 3.97% 67.7% 61.3% 3,286 19.7% 11.4%
Stomach surgery 10,512 133 1.27% 58.8% 53.8% 10,379 9.5% 5.7%
Breast surgery 4,567 103 2.26% 52.1% 52.1% 4,464 5.7% 3.7%
Appendectomy 12,592 100 0.79% 57.3% 55.1% 12,492 4.7% 2.7%
Surgery to remove gallbladder 17,668 87 0.49% 58.0% 50.6% 17,581 8.6% 3.9%
Pacemaker/defibrillator surgery 20,093 76 0.38% 56.2% 52.1% 20,017 15.0% 6.9%
* Procedure categories are based on the CDC’s NHSN Operative Categories.† Not all patients who underwent a procedure were included in the readmission analysis. Patients who died, were out-of-state residents, or for
which data needed to link hospitalizations was missing were not included in this readmission analysis.‡ The number of patients who underwent a procedure and acquired a surgical site infection (SSI) was determined using the NHSN data in which
hospitals attributed SSIs to a particular NHSN procedure category. The number of patients who underwent a procedure and did not acquire a SSI was determined using the principal procedure in the discharge data that hospitals reported to PHC4.
** Calculations for Total Cases include all cases with a procedure, not just cases included in the top 20 procedure categories.

11
Inrecentyears,theCentersforMedicareandMedicaidServices(CMS)hassoughttoimprovethequal-ityofcarethroughpaymentincentiveprogramsthatrewardhospitalsformeetingpre-establishedtargetsforimprovementofhealthcareandbyreducingpaymentsfornegativeconsequencesofcarethatresultin
injury,illnessordeath.InOctober2008,CMSbegantoreducepaymentsforaselectsetofmedicalerrorsandcomplicationsincludingseveraltypesofhealthcare-associatedinfections(HAIs).Inthefuture,Medicarepay-mentswillalsobereducedwhenCMSconsidershospitals’readmissionratestobehigherthanexpected.
ThissectionpresentsestimatedMedicarepaymentsforthetop25principalreasonsforwhichpatientsage65andolderwereoriginallyadmittedtoageneralacutecarefacility.OnlyMedicarepatientsage65andolderwereincludedinthisanalysis;Medicarebeneficiariesunderage65werenotincluded. TheestimatedMedicarepaymentsfortheinitialhospitalizationsinwhichpatientsdidordidnotacquireaninfectionarereported.EstimatedMedicarepaymentsarealsoreportedforreadmissionswithin30dayswhentheprincipalreasonforthereadmissionwasaninfectionorcomplication.
The estimated payments are based on the entire hospital stay, not just the payment for treatment related to the infection. Unlikehospitalcharges,thesepaymentsareestimatesofwhathospitalswereactu-allyreimbursedforthetreatmentofMedicarepatients. ItisimportanttonotethatthedifferencesinMedicarepaymentsforpatientswithandwithoutHAIsarelargerfortheinitialhospitalizationinwhichaninfectionwasorwasnotcontracted. ThedifferencesintheestimatedMedicarepaymentsforreadmissionsforinfectionorcomplicationarelesspronounced.
Medicare Payments
• In2009,therewere735,300hospitaladmissionsforMedicarebeneficiariesage65andolderinPennsylva-niageneralacutecarehospitals;10,721(approximately1.5percent)ofthesepatientscontractedatleastoneHAIduringtheirstay. TheestimatedaverageMedicarepaymentforthehospitalizationinwhichpatientsacquiredaninfectionwas$20,471. TheestimatedaverageMedicarepaymentwas$6,615forahospitaliza-tioninwhichpatientsdidnotacquireaninfection.
• OftheMedicarepatientsage65andolderwhoacquiredaninfectionduringtheirhospitalstay,29.5percentwerereadmittedwithin30daysforaninfectionorcomplication.TheestimatedtotalMedicarepaymentforthesereadmissionswasmorethan$24.6million.OftheMedicarepatientsage65andolderwithoutanHAI,8.7percentwerereadmittedforaninfectionorcomplication.
• Foreachoftheconditionslistedinthetableonthenexttwopages,Medicarepaymentsforhospitalizationsinwhichpatientsacquiredaninfectionwerehigherthanforhospitalizationsinwhichpatientsdidnotacquireaninfection.

12
Medicare Payments
Average Medicare Payment for Top 25 Reasons for Admission for Patients 65 Years of Age and Over with an HAI
Principal Reason for Admission*Number of Cases
Percent of Cases
Estimated Average Medicare
Payment for Hospital Stay in
which HAI Occurred†
Percent of Patients
Readmitted for Infection or Complication
Estimated Average Medicare Payment for Readmissions
for Infection or Complication†
Total Cases‡
Cases with HAI 10,721 1.46% $20,471 29.5% $9,477Cases without HAI 724,579 98.54% $6,615 8.7% $7,592
Primary cancer Cases with HAI 863 3.48% $21,564 35.4% $11,157Cases without HAI 23,928 96.52% $8,829 8.4% $6,599
Septicemia Cases with HAI 574 2.39% $27,841 26.2% $8,365Cases without HAI 23,410 97.61% $10,023 14.5% $8,580
Fracture of hip, leg, or footCases with HAI 485 2.79% $13,336 33.6% $9,131Cases without HAI 16,876 97.21% $8,086 8.0% $7,668
Heart failure Cases with HAI 418 0.93% $16,679 24.1% $7,887Cases without HAI 44,686 99.07% $5,949 9.5% $7,295
Inpatient rehabilitation care**
Cases with HAI 409 2.50% $18,271 15.8% $8,049Cases without HAI 15,937 97.50% $14,212 8.2% $7,999
Complication of internal device, implant, or graft Cases with HAI 383 2.28% $21,287 43.0% $8,501Cases without HAI 16,425 97.72% $9,385 13.0% $8,963
Stroke Cases with HAI 378 1.92% $19,581 21.9% $8,319Cases without HAI 19,305 98.08% $6,560 10.4% $7,606
Intestinal inflammation Cases with HAI 346 1.99% $20,442 28.9% $5,469Cases without HAI 17,066 98.01% $5,321 7.4% $6,888
Heart attackCases with HAI 335 1.68% $27,935 20.5% $8,566Cases without HAI 19,549 98.32% $9,459 9.6% $8,239
Arthritis and joint disordersCases with HAI 326 1.10% $11,683 43.5% $7,381Cases without HAI 29,245 98.90% $7,979 3.8% $6,589
Intestinal obstruction Cases with HAI 302 3.19% $19,857 21.5% $9,327Cases without HAI 9,169 96.81% $6,224 7.4% $8,941
Coronary (heart) artery disease and chest pain Cases with HAI 294 0.81% $29,209 32.7% $14,293Cases without HAI 36,120 99.19% $6,902 5.2% $6,673
* Principal reasons for admission are based on the Agency for Healthcare Research and Quality’s Clinical Classifications Software (CCS).† The estimated payments are based on the entire hospital stay, not just the payment for treatment related to the infection. ‡ Calculations for Total Cases include all cases, not just the cases included in the top 25 reasons for admission.** Inpatient rehabilitation services provided in general acute care hospitals are typically for conditions such as stroke and other brain and spinal
cord injuries, burns, and post-operative knee or hip replacement surgery.

13
Medicare Payments
Average Medicare Payment for Top 25 Reasons for Admission for Patients 65 Years of Age and Over with an HAI
Principal Reason for Admission*Number of Cases
Percent of Cases
Estimated Average Medicare
Payment for Hospital Stay in
which HAI Occurred†
Percent of Patients
Readmitted for Infection or Complication
Estimated Average Medicare Payment for Readmissions
for Infection or Complication†
Peripheral vascular disease (PVD)Cases with HAI 274 1.95% $20,445 45.0% $8,450Cases without HAI 13,765 98.05% $6,959 8.4% $7,866
Respiratory failure (adult)Cases with HAI 265 2.82% $27,698 26.1% $9,670Cases without HAI 9,117 97.18% $10,131 15.9% $9,634
Acute kidney failure Cases with HAI 246 1.63% $12,033 19.4% $11,779Cases without HAI 14,874 98.37% $5,676 12.9% $7,528
Complication of surgical procedure or medical care Cases with HAI 246 2.37% $22,237 23.6% $9,230Cases without HAI 10,152 97.63% $7,158 13.5% $7,881
Abnormal heart beatCases with HAI 243 0.51% $15,347 28.1% $9,713Cases without HAI 47,731 99.49% $5,586 8.5% $6,645
Pneumonia Cases with HAI 209 0.74% $17,990 31.2% $7,784Cases without HAI 28,131 99.26% $5,282 10.6% $7,569
Heart valve disorders Cases with HAI 206 4.29% $55,108 35.1% $16,053Cases without HAI 4,599 95.71% $23,317 11.3% $8,747
Osteoporosis and back disorders Cases with HAI 204 1.59% $15,995 58.3% $12,000Cases without HAI 12,601 98.41% $6,497 5.1% $7,092
Abdominal hernia Cases with HAI 199 4.11% $19,114 37.7% $7,208Cases without HAI 4,642 95.89% $7,619 6.7% $7,762
Spinal cord injury and head trauma Cases with HAI 197 3.24% $29,431 20.3% $14,662Cases without HAI 5,892 96.76% $7,933 8.9% $9,655
Aneurysm/blood clot of artery in abdomen or limb Cases with HAI 181 3.93% $41,336 38.7% $13,482Cases without HAI 4,423 96.07% $13,576 8.5% $7,992
Secondary cancer Cases with HAI 174 2.11% $18,176 27.7% $5,555Cases without HAI 8,056 97.89% $7,800 8.9% $7,389
Intestinal infection Cases with HAI 172 2.43% $12,010 18.2% $6,502Cases without HAI 6,898 97.57% $5,435 12.9% $6,546
* Principal reasons for admission are based on the Agency for Healthcare Research and Quality’s Clinical Classifications Software (CCS).† The estimated payments are based on the entire hospital stay, not just the payment for treatment related to the infection.
14
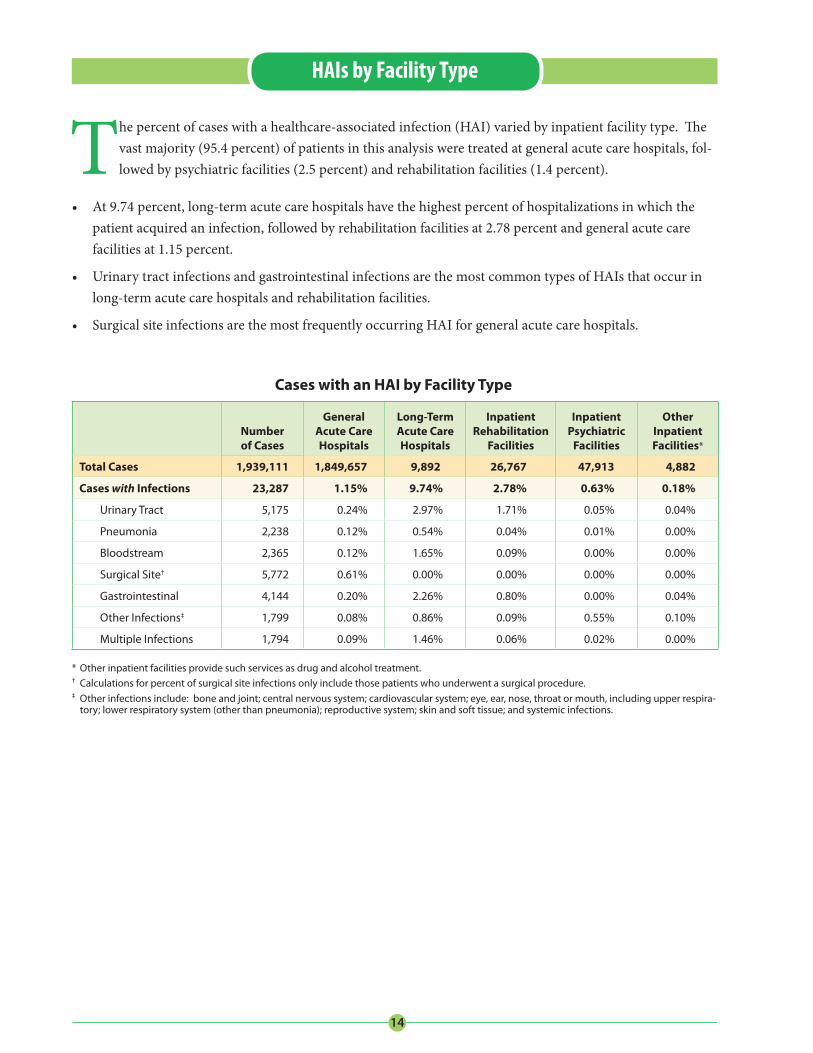
Thepercentofcaseswithahealthcare-associatedinfection(HAI)variedbyinpatientfacilitytype.Thevastmajority(95.4percent)ofpatientsinthisanalysisweretreatedatgeneralacutecarehospitals,fol-lowedbypsychiatricfacilities(2.5percent)andrehabilitationfacilities(1.4percent).
• At9.74percent,long-termacutecarehospitalshavethehighestpercentofhospitalizationsinwhichthepatientacquiredaninfection,followedbyrehabilitationfacilitiesat2.78percentandgeneralacutecarefacilitiesat1.15percent.
• UrinarytractinfectionsandgastrointestinalinfectionsarethemostcommontypesofHAIsthatoccurinlong-termacutecarehospitalsandrehabilitationfacilities.
• SurgicalsiteinfectionsarethemostfrequentlyoccurringHAIforgeneralacutecarehospitals.
Cases with an HAI by Facility Type
Number of Cases
General Acute Care Hospitals
Long-Term Acute Care Hospitals
Inpatient Rehabilitation
Facilities
Inpatient Psychiatric
Facilities
Other Inpatient Facilities*
Total Cases 1,939,111 1,849,657 9,892 26,767 47,913 4,882
Cases with Infections 23,287 1.15% 9.74% 2.78% 0.63% 0.18%
Urinary Tract 5,175 0.24% 2.97% 1.71% 0.05% 0.04%
Pneumonia 2,238 0.12% 0.54% 0.04% 0.01% 0.00%
Bloodstream 2,365 0.12% 1.65% 0.09% 0.00% 0.00%
Surgical Site† 5,772 0.61% 0.00% 0.00% 0.00% 0.00%
Gastrointestinal 4,144 0.20% 2.26% 0.80% 0.00% 0.04%
Other Infections‡ 1,799 0.08% 0.86% 0.09% 0.55% 0.10%
Multiple Infections 1,794 0.09% 1.46% 0.06% 0.02% 0.00%
* Other inpatient facilities provide such services as drug and alcohol treatment. † Calculations for percent of surgical site infections only include those patients who underwent a surgical procedure.‡ Other infections include: bone and joint; central nervous system; cardiovascular system; eye, ear, nose, throat or mouth, including upper respira-
tory; lower respiratory system (other than pneumonia); reproductive system; skin and soft tissue; and systemic infections.
HAIs by Facility Type

15
2.21.6
1.5
5.9
2.53.0
0.8 1.0
6.2
1.9
0.0
1.0
2.0
3.0
4.0
5.0
6.0
7.0
Urinary Tract Pneumonia Bloodstream Surgical Site‡ Gastrointestinal
Num
ber o
f Pat
ient
s w
ith a
n H
AI
per 1
,000
Pat
ient
s*
Type of Infection
Male Female
Patients with an HAI by Gender, 2009
Thissectionpresentsinformationonthreedemographiccharacteristics–gender,ageandrace/ethnicity–forthepatientswhoacquiredahealthcare-associatedinfection(HAI).Whiledifferencesarenotedamongdemographicgroups,HAIsaffectpatientsfromallwalksoflife.
HAIs by Gender • Therewereslightdifferencesbetweenmaleandfemalepatientsintherateofinfectionscontractedwhilein
thehospital.Foranytypeofinfection,13.0per1,000malepatientscontractedaninfectioncomparedto11.3per1,000femalepatients.
• Surgicalsiteinfections‡occurredmostoftenforbothmalesandfemales.
• Thelargestdifferenceoccurredinpneumonia;1.6per1,000malepatientscontractedpneumoniacom-paredto0.8per1,000femalepatients.
• Femalesacquiredmoreurinarytractinfectionsthanmales,3.0per1,000femalepatientscomparedto2.2per1,000malepatients.
HAIs and Patient Demographics
Gender
Number of Patients with an HAI
per 1,000 Patients*
Male 13.0
Female 11.3
* To account for differences in the percent of male and female patients, calculations for each gender only included patients of that particular gender (e.g., calculations for male patients only included male patients).
‡ Calculations for rate of surgical site infections only include those patients who underwent a surgical procedure.

16
HAIs by Age
• Olderpatientsacquiredmoreinfectionsthanyoungerpatients.• Patients65to84yearsofagehadthehighestrateofHAIs,16.6per1,000patientsinthatagegroup.
0.4 0.3
1.50.7 0.3
0.80.2
1.0
3.6
0.41.1
0.5 0.7
4.6
0.7
2.6
1.3 1.4
8.7
2.2
4.3
1.81.5
6.9
3.54.3
1.50.9
4.03.5
0.0
2.0
4.0
6.0
8.0
10.0
Urinary Tract Pneumonia Bloodstream Surgical Site‡ Gastrointestinal
Num
ber o
f Pat
ient
s w
ith a
n H
AI
per 1
,000
Pat
ient
s*
Type of Infection
0-4 5-17 18-44 45-64 65-84 85+
Patients with an HAI by Age, 2009
• Surgicalsiteinfections‡werethemostfrequentlyoccurringinfectionforallbuttheyoungestandoldestagegroups:3.6per1,000patientsage5-17;4.6per1,000patientsage18-44;8.7per1,000patientsage45-64;and6.9per1,000patientsage65-84.
• BloodstreaminfectionswerethemostfrequentlyoccurringHAIforpatientsintheyoungestagegroup,1.5per1,000patientsage0-4.
• Urinarytractinfectionswerethemostcommontypeofinfectionacquiredbypatientsintheoldestagegroup,4.3per1,000patientsage85orolder.
HAIs and Patient Demographics
Age in Years
Number of Patients with an HAI
per 1,000 Patients*
0-4 4.5
5-17 5.8
18-44 7.0
45-64 14.3
65-84 16.6
85+ 12.8
* To account for differences in the percent of patients in a particular age group, calculations for each age group only included patients in that particular group (e.g., calculations for patients 0-4 years of age only included patients 0-4 years of age).
‡ Calculations for rate of surgical site infections only include those patients who underwent a surgical procedure.

17
Race/Ethnicity
Number of Patients with an HAI
per 1,000 Patients*
White (non-Hispanic) 12.2
Black (non-Hispanic) 11.4
Hispanic✝ 8.2
HAIs by Race/Ethnicity
2.7
1.2 1.1
6.4
2.32.4
0.9
1.8
5.1
1.71.6
0.6
1.3
4.4
1.0
0.0
1.0
2.0
3.0
4.0
5.0
6.0
7.0
Urinary Tract Pneumonia Bloodstream Surgical Site‡ Gastrointestinal
Num
ber o
f Pat
ient
s w
ith a
n H
AIpe
r 1,0
00 P
atie
nts*
Type of InfectionWhite (non-Hispanic) Black (non-Hispanic) Hispanic†
Patients with an HAI by Race/Ethnicity, 2009
• Surgicalsiteinfections‡werethemostfrequentlyoccurringinfectionforallrace/ethnicitygroups:6.4per1,000white(non-Hispanic)patients;5.1per1,000black(non-Hispanic)patients;and4.4per1,000His-panicpatients.
• Urinarytract,pneumonia,surgicalsiteandgastrointestinalinfectionsoccurredmorefrequentlyforwhite(non-Hispanic)patientsthanforblack(non-Hispanic)orHispanicpatients.
• Black(non-Hispanic)patientshadthemostbloodstreaminfectionsat1.8per1,000black(non-Hispanic)patients.Hispanicpatientshad1.3bloodstreaminfectionsper1,000Hispanicpatients.White(non-His-panic)patientshad1.1bloodstreaminfectionsper1,000white(non-Hispanic)patients.
HAIs and Patient Demographics
• HAIsoccurredmostfrequentlyinwhite(non-Hispanic)patientsatarateof12.2per1,000white(non-Hispanic)patients.Black(non-Hispanic)patientshad11.4HAIsper1,000black(non-Hispanic)patients.Hispanicpatientshad8.2HAIsper1,000Hispanicpatients.
* To account for differences in the percent of patients of a particular race/ethnicity group, calculations for each race/ethnicity group only included patients in that particular group (e.g., calculations for black (non-Hispanic) patients only included black (non-Hispanic) patients).
✝ Internal PHC4 analysis suggests that Hispanic ethnicity may be slightly underreported.‡ Calculations for rate of surgical site infections only include those patients who underwent a surgical procedure.

18
4.0
1.6 1.4
6.5
3.4
1.60.8
1.3
5.2
1.11.7
0.8 1.0
6.0
1.20.90.5 0.4
3.9
0.8
0.0
1.0
2.0
3.0
4.0
5.0
6.0
7.0
Urinary Tract Pneumonia Bloodstream Surgical Site‡ Gastrointestinal
Num
ber o
f Pat
ient
s w
ith a
n H
AI
per 1
,000
Pat
ient
s*
Type of Infection
Medicare Medicaid Commercial Self †
Thissectionshowstheprimarypayerforhospitalizationsinwhichpatientscontractedahealthcare-associatedinfection(HAI).Hospitalizationdatabypayershedslightonthefinancialburdenoftheseinfections,particularlytheimpactonMedicare.
• Medicarepatientsacquiredinfectionswhileinthehospitalmoreoftenthanpatientsinanyoftheotherpayergroups(i.e.,Medicaid,commercialorself).
Payer
Number of Patients with an HAI
per 1,000 Patients*
Medicare 15.4
Medicaid 9.2
Commercial 9.7
Self✝ 5.0
• Surgicalsiteinfections‡werethemostfrequentlyoccurringinfectionforallpayers.PatientscoveredbyMedicarehadthemostsurgicalsiteinfectionsat6.5per1,000Medicarepatients,followedbypatientscov-eredbycommercialinsuranceat6.0per1,000commercialinsurancepatients.
• PatientscoveredbyMedicareweremuchmorelikelytoacquireurinarytractandgastrointestinalinfectionsthanpatientscoveredbyanyoftheotherpayers.
Patients with an HAI by Payer, 2009
HAIs by Payer
* To account for differences in the percent of patients of a particular payer group, calculations for each payer group only included patients in that particular group (e.g., calculations for Medicare patients only included Medicare patients).
✝ Includes patients who are uninsured.‡ Calculations for rate of surgical site infections only include those patients who underwent a surgical procedure.

Pennsylvania Health Care Cost Containment CouncilJoe Martin, Executive Director
225 Market Street, Suite 400, Harrisburg, PA 17101Phone: 717-232-6787 • Fax: 717-232-3821
www.phc4.org
For More InformationThe information contained in this report and other PHC4 publications is available online at www.phc4.org. Additional financial, hospitalization and ambulatory procedure health care data is available for purchase. For more information, contact PHC4’s Data Requests Unit at [email protected] or 717-232-6787.