the impact of foreign direct investment for economic ... impact of foreign direct investment for ......
TRANSCRIPT
1
9th International Conference on Sri Lanka Studies Full Paper Number 092
The Impact of Foreign Direct Investment for Economic Growth: A Case Study in Sri Lanka
P.P.A Wasantha Athukorala Address for Correspondence Department of Economics Faculty of Arts University of Peradeniya, Sri Lanka. Email: [email protected]
Paper submitted for the
9th International conference on Sri Lanka Studies, 28th – 30th November 2003,
Matara, Sri Lanka

2
The Impact of Foreign Direct Investment for Economic Growth: A Case Study in Sri Lanka
By
P.P.A Wasantha Athukorala Abstract: The integration of developing countries with the global economy increased sharply in the 1990s
with changing in their economic policies and lowering of barriers to trade and investment. Foreign Direct
Investment (FDI) is assumed to benefit a poor country like Sri Lanka, not only by supplementing domestic
investment, but also in terms of employment creation, transfer of technology, increased domestic
competition and other positive externalities. Sri Lanka offers attractive investment opportunities for foreign
companies and has adopted a number of policies to attract foreign direct investment into the country and
the country seems to offer perhaps one of the most liberal FDI regimes in South Asia. As a result, during
the last decade FDI inflows in Sri Lanka has increased considerably by 8.5 in 1990 to 15.0 in 2000 as a
percentage of GDP while Indian experience was 0.5 to 4.1 in the same period
However, previous literature suggests that the FDI inflows have a positive impact on economic
growth of host countries. Although a large volume of econometric literature comprises on the impacts of
FDI on economic growth in developing countries, there is not enough studies on the question of causality
linkage between them. This paper focuses on the FDI-led growth hypothesis in the case of Sri Lanka. The
study is based on time series data from 1959 to 2002 and the response of civil society and foreign firms.
The econometric framework of cointegration and error correction mechanism were used to capture two
way linkages between variables interest. It is evident in the results that the regression analysis do not
provide much support for the view of a robust link between FDI and growth in Sri Lanka. It does not imply
that FDI is unimportant. Rather, its analysis reduces the confidence in the belief that FDI has exerted an
independent growth effect in Sri Lanka. But net attitudes of the civil society on the impact of FDI on
opportunities for domestic business and economic activities is positive and net attitudes of foreign firms
toward FDI reveals that the investment climate has not improved in Sri Lanka as a result of lack of good
governance, corruption, political instability and disturbance, bureaucratic inertia, and poor low and order
situation.
1. Introduction

3
The growth of international production is driven by economic and technological forces. It is also
driven by the ongoing liberalization of Foreign Direct Investment (FDI)1 and trade policies. In this context,
globalization offers an unprecedented opportunity for developing countries to achieve faster economic
growth through trade and investment. In the period 1970s, international trade grew more rapidly than FDI,
and thus international trade was by far than most other important international economic activities. This
situation changed dramatically in the middle of the 1980s, when world FDI started to increase sharply. In
this period, the world FDI has increased its importance by transferring technologies and establishing
marketing and procuring networks for efficient production and sales internationally (Shujiro Urata, 1998).
Through FDI, foreign investors benefit from utilizing their assets and resources efficiently, while FDI
recipients benefit from acquiring technologies and from getting involved in international production and
trade networks. While global FDI flows increased by 24 per cent during 1991-2000, developing countries
as a group show an FDI increase of 20 per cent at constant prices (World Development Report, 2002). FDI
flows to poor countries increased to almost 3 per cent of GDP. However, after reaching a peak in 2000,
global FDI flows declined sharply in 2001. Inflows fell by 51 per cent and outflows by 55 per cent (World
Investment Report, 2002). This was the first drop in inflows since 1991 and in outflows since 1992. More
than 12 countries including the world’s three largest economies fell into recession in 2001. This slowdown
in the world economy was the major factor to decrease FDI in 2001. Although, global FDI flows marked
drastic fall, net FDI flow to developing countries remain almost unchanged in this year.
The determining factor for a particular firm to establish production facilities abroad is the prospect
of earning higher profit which induces firms to invest abroad, primarily because of lower labour costs.
Traditional theories on trade and investment assumed that factors of production, such as labour and capital,
were not internationally traded. However, in reality, factors are internationally mobile and at least since the
nineteenth century, international labour movement and international investments have been very important
in the global economy (Jayasuriya and Weerakoon, 2000). Although differences in labour costs may
sometimes help influence firms’ decisions to locate abroad, this is far from being the whole story. As the
FDI data showed, the majority of FDI still goes to the advanced countries, in particular the United States
where wages are high relative to those in developing countries. The interesting point here is that there will
normally be extra costs involved, at least initially, for a firm investing in a foreign country where it is not
familiar with the local market and the institutions. At a theoretical level, economic analysis offers various
explanatory approaches which attempting to show why, despite these disadvantages, firms may still wish to
invest abroad. According to John Dunning (1977) firms undertake FDI when three factors are present and
the resulting advantages are sufficient to offset the natural disadvantages of having to operate in a foreign
1 The term FDI raises important conceptual questions regarding definition and interpretation, as well as practical problems of measurement. The classification of certain types of investments is sometimes based on arbitrary arguments. But we use the definition which introduced by the World Trade Organization (WTO) in 1996. The WTO indicates that FDI occurs when an investor based in one country acquires an asset in another country with the intent to manage that asset. Accordingly, the management dimension is what distinguishes FDI from portfolio investment in foreign stocks, bonds and other financial instruments.

4
country. These three advantages are; ownership advantages (Hymer, 1960), locational advantages (Vernon,
1966), and international advantages (Buckley and Casson, 1976)
Except the above mentioned, there are several other macro level theories in the literature which
attempt to explain why foreign investment takes place. These include various theories of economic
imperialism, based on different interpretations of the workings of the capitalist system2.
However, FDI provides much needed resources to developing countries such as capital,
technology, managerial skills, entrepreneurial ability, brands, and access to markets. These are essential for
developing countries to industrialize, develop, and create jobs attacking the poverty situation in their
countries. As a result, most developing countries recognize the potential value of FDI and have liberalized
their investment regimes and engaged in investment promotion activities to attract various countries.
Globalization and regional integration arrangements can change the level and pattern of FDI and also it
reduces the trade costs. However, FDI flows to developing countries started to pick up in the mid-1990s
largely as a result of progressive liberalization of FDI policies in most of these countries and the adoption
of generally more outward- oriented policies. FDI flows of the developing and developed countries over the
last two decades can be depicted in Table 1. According to the Table 1, FDI flows in the world has
increased unprecedented level in the recent past. Within the developed world, the European Union, the
United States and Japan accounted for 71 per cent of world inflows and 82 per cent of outflows in 2000
(World Investment Report, 2003). Inward and outward FDI stocks as a percentage of gross domestic
product in the selected regions is given in Table 2.
Foreign Direct Investment flows to the developing countries of Asia and the Pacific fell from $
134 billion in 2000 to $ 102 billion in 2001. This decline was due to an over 60 per cent drop in flows to
Hong Kong, China from a record level of $ 62 billion in 2000. Excluding Hong Kong, China, inflows in
2001 reached the same level as in the peak years of the 1990s. FDI flows to South Asia started to pick up
in the mid-1990s largely as a result of progressive liberalization. However, South Asia has not been
generally a large recipient of FDI. In the 1980s, the average annual flow of FDI was around 2 million
dollars per annum for Bangladesh, 50 millions dollars for India, around 42 million dollars for Pakistan and
41 million dollars for Sri Lanka. These figures are very low when compared to other economies of the
developing world, especially of East Asia. Among South Asian neighbors India’s position is undisputable,
not just because of the potential of its market but because of the level of local industrial skills and
experience in the industrial production. Because of these circumstances, India could become a major
destination for FDI, one of the largest in the developing world. Inward and outward FDI stocks as a
percentage of gross domestic product in the selected countries in Asia is depicted in Table 3.
2 Apart from above theories there are several micro level theories which explain multinational investment in rather different terms, such as Oligopolistic rivalry between firms at the global level, the empire-building motives of managers of large corporations in advanced countries or strategic entry deterrence, that is, the build up of overseas capacity in order to stop potential rivals from entering any specific market or markets. However, these theories deal with lot of factors such as , access to markets, labour costs, proximity to row materials, and fiscal incentive.

5
However, the performance within the Asian regions varies from country to country. FDI growth in
China continued its momentum driven by the liberalization process and industrial restructuring. However,
during the last decade FDI inflows in Sri Lanka has increased considerably by 8.5 in 1990 to 15.0 in 2000
as a percentage of GDP while Indian experience was 0.5 to 4.1 in the same period (World Investment
Report, 2002). Against this backdrop, this article attempts to provide a broad overview of the policy
environment and experience of the FDI and economic growth in Sri Lanka.
1.1. An Overview of FDI in Sri Lanka
Prior to economic liberalization, Sri Lanka has followed inward looking economic policies, which
had limitations for foreign investors and free flow of FDI. Although there were limitations during the
period of 1950-1977, some measures had been taken to attract FDI. For instance, in 1966, presented a white
paper for FDI and also foreign investment advisory committee was set-up in 1968 in order to investigate
and manipulate policies regarding foreign direct investment in Sri Lanka.
With the market oriented economic policy accepted as being the most effective engine of growth,
political entities have made it their top priority to create an investment friendly economic climate in 1977.
Based on Foreign Investment Act in 1978, investment policies in Sri Lanka have been engineered to attract
foreign investment. In addition, Sri Lanka was one of the longest democratic traditions in the region and
over the past 20 years, successive governments have followed free market policies and continued to
liberalize the economy. Investment has been actively canvassed and now there are over 1,000 companies
from 55 countries operating in Sri Lanka. The country’s investment laws are transparent and automatic
across a wide range of sectors. There are no restrictions on the repatriation of earnings, profits, and capital
proceeds (BOI Report, 2002).
Sri Lanka offers an attractive package of fiscal incentives to foreign and local investment.
Foreign investment is encouraged in enterprises, which involve extensive use of foreign capital or
sophisticated technology, in export-oriented manufacturing, and in large- scale infrastructure projects.
Apart from this, privatization and deregulation of the various sector in the country has led to the presence
of global giants and attract FDI. Up to now, Sri Lanka has six free trade zones, also called export
processing or investment promotion zones located in Katunayake (1978), Biyagama (1986) Koggala
(1991) Pallekelle(1996) Mirigama(1997) and Malwatte(1997). There are over 155 foreign export
processing enterprises operating in the six zones. Another industrial zone, funded by the Overseas
Economic Cooperation Fund of Japan, is taking shape at Seethavaka, in Avissawela about 60 kilometers
from Colombo. However expansion of export earnings and creation of employment opportunities are the
main objectives of the establishment of Free Trade Zone in Sri Lanka. Apart from this the Government of
Sri Lanka also has signed investment protection agreements with various countries including the United
States (which came into force in May 1993).
In 2002, India emerged as Sri Lanka's major investor in terms of the number of agreements signed
and in terms of the total value of projects. A major factor behind this trend was the signing of the Indo-

6
Lanka Free Trade Agreement that has made it attractive for Indian investors to set up plants in Sri Lanka
for re-exports to India. Sri Lanka will enter into a similar agreement with Pakistan, the possibility exists for
bilateral trade and investment between these two large South Asian States through Sri Lanka.
Sri Lanka’s average total gross domestic investment in the last decade has been around 25 per cent
of GDP; actually it fell from 27.0 per cent of GDP in 1994 to 21.3 percent in 2002. The failure to achieve
the target was mainly because of poor response from the private sector. The government too could not
maintain its level of public investment as announced in the policy statement; public investment declined
from 7.0 percent of GDP in 1994 to 4.6 per cent in 2002. Foreign direct investment in Malaysia is 46 times
than Sri Lanka (1995). Total investment and FDI of Sri Lanka over last several years is given in Table 3.
Foreign investment inflows to Sri Lanka continued to increase over the last decade as a result
of investment favorable policies adopted by the successive government. The downturn in world economic
activities, slowing down in capital inflows to developing countries, deterioration of investor confidence due
to the civil war and politics related uncertainty and the stagnation of the Japanese economy adversely
affected the investment inflows to Sri Lanka in the past few years. Since the beginning of the 90’s decade,
the annual value of FDI inflows to Sri Lanka has started to continue with an increasing rate when compared
to 80’s decade. This kind of upward movement of FDI is interpreted as an outcome of the second
liberalization reforms initiated in 1989. The mostly observed transformation of relocating of labour-
intensive production activities from rapidly growing East Asian Newly Industrialized countries to labour
surplus countries in South Asia. Following these transformations, Hong Kong, Taiwan and Korean
investors showed prominently in the participation of FDI projects recently.
As far as the 1978-93 period is concerned, as a whole, FDI emerges as the dominant form of
private capital inflows other than portfolio investment, private short term and long term borrowings. FDI
increased from a negligible level in 1978 to 9 billion Rupee or around 2 per cent of the gross domestic
product by 1993. The trend of FDI corresponding to the long term investment climate produced by foreign
trade and the balance of payment liberalization was influenced by economic and political stability. FDI
increased initially due to favorable investment climate created by the 1977 reforms, liberalization, and
increased level of openness of the economy. During the 1983-89 period, the incentives for FDI were
damaged by the setbacks on foreign trade, moreover, the investment environment further deteriorated
during the same period as a result of political misalignments. The incentives under structural adjustment
and stabilization programme implemented in 1990s were of great importance in generating a surge in FDI.
Although FDI has increased in the recent past, it remains difficult to quantify the exact magnitude
of FDI basically because of the non-reporting problem. It is even more difficult to have correct estimate of
sectoral FDI. The Board of Investment keeps product category-wise records of registered investment with
BOI. Accordingly, number of enterprises registered under BOI has increased drastically between 1995 and
2002. Out of the total, Food & beverage and tobacco products, Services and Text/apparel and leather
enterprises were the most significant enterprises

7
At present, several leading business missions of the world have shown a keen interest to
participate in Sri Lanka's commercial ventures when these teams visited the BOI in last year. Some of the
delegation members were enthusiastic in launching projects in the areas of e-commerce, e-government, and
various services sectors in the country. According to the BOI sources, its aim is to achieve US$ 300
million in FDI by the end of this year (2003). The main advantages that Sri Lanka had were the proximity
to major transshipment routes and a Free Trade Agreement (FTA) with India and Pakistan that gave access
to world’s biggest markets. Currently, among the areas open to foreign investment in Sri Lanka were
privatization, shipbuilding, ship repairing, oil storage, power and energy, mineral processing, tourism and
electronics. Infrastructure development figures high on the agenda and power, ports, IT, water supply,
waste management and connectivity were identified as areas the government wanted to develop with the
idea of attracting FDI to the country. Accordingly, a new series of incentives were introduced to attract
more investors to develop regions other than the Western Province, which to date has received the largest
share of FDI. This was part of a government policy to encourage even investment and economic
development in all parts of the country with the long-term objective of creating employment opportunities
and technological transfer.
However, the BOI was able to renew interest in FDI last year as a result of the peace process in the
country. In 2002, 499 projects were approved compared to 385 in 2001, an increase of 30 per cent. There
was also an improvement with regard to implementation of projects: 71 projects commenced construction
work in 2002, which represents a 55 per cent increase from the previous year. A total of 39 per cent are
locally owned Sri Lankan investment projects while 32 per cent are foreign owned. Jointly owned projects
(Sri Lankan and Foreign) amount to 29 per cent. The significance of this development led in turn to a 3 per
cent increase in Sri Lanka's exports in 2002. In 2002, India emerged as Sri Lanka's major investor in terms
of the number of agreements signed and in terms of the total value of projects. At present, there are around
1,500 companies that operate under the BOI regime. They vary considerably in size and in scope and are
drawn from over 22 countries. Meanwhile, Sri Lanka has been ranked among the top 20 economies in the
developing Asia and Pacific region in FDI inflows.
1.2. Objectives
Foreign investment inflows to Sri Lanka continued to increase over the last decade as a result of
investment favorable policies adopted by the successive government. Since the beginning of the 90’s
decade, the annual value of FDI inflows to Sri Lanka has started to continue with an increasing rate when
compared to 80’s decade. This kind of upward movement of FDI is interpreted as an outcome of the
liberalization reforms initiated in 1977. The incentives under structural adjustment and stabilization
programme implemented in 1990s were of great importance in generating a surge in FDI. According to the
previous literature the FDI inflows have a positive impact on economic growth of host countries. This

8
paper focuses on the FDI-led growth hypothesis in the case of Sri Lanka. Accordingly the main objectives
are;
1. to consider the short run and long run relationship between FDI and economic growth
2. to consider the perception of the civil society, and foreign firm toward FDI
The bi-directional causality3 between FDI and GDP can also be expected in the short-run when the
economy adjusts to its long-run equilibrium. An infusion of FDI, while bringing the economy to a higher
long run growth path raises growth in the short run as well. With increased growth in the short run, the
economy can traverse along its transitional path4.
2. Literature Review
2.1 Previous Studies
Although most countries offered a large numbers of incentives to attract FDI, experience from
other countries shows that such plans often have limited impact on new investment, reduce transparency of
the business climate, and lead to higher taxes for other taxpayers. Tax incentives or free trade zones are
used by some countries to attract investors, despite mixed evidence about their impact on FDI flows and the
potentially high costs compared to the benefits (Piritta Sorsa, 2003).
According to the study done by Pradeep Agrawal (2000) on economic impact of foreign direct
investment in south Asia by undertaking time-series, cross-section analysis of panel data from five South
Asian countries; India, Pakistan, Bangladesh, Sri Lanka and Nepal, that there exist complementarily and
linkage effects between foreign and national investment. Further he argues that, the impact of FDI inflows
on GDP growth rate is negative prior to 1980, mildly positive for early eighties and strongly positive over
the late eighties and early nineties. Most South Asian countries followed the import substitution policies
and had high import tariffs in the 1960s and 1970s. These policies gradually changed over the 1980s, and
by the early 1990s, most countries had largely abandoned the import substitution strategy in favor of more
open international trade and generally, market oriented policies (Pradeep Agrawal, 2000). The results of the
analysis carried out by Archanun Kohpaiboon on the impact of FDI on growth performance in investment
receiving countries through a case study of Thailand for the period 1970-1999, shows that the growth
impact of FDI tends to be greater under an export promotion trade regime compared to an import-
substitution regime.
3 Economic reasoning supports many different forms of causality between FDI and GDP: causality from FDI to GDP, from GDP to FDI, permanent long-run movements, and transitory short-run adjustments. 4 Parantap Basu Derrick Reagle and Chandana Chakraborty “Empirical Dynamics of FDI and Growth in Developing Countries: Does Liberalization Matter?” Fordham University, USA and Montclair State University, USA

9
A panel study including 23 countries was carried out for the period from 1978 to 1996 by Parantap
Basu Derrick Reagle and Chandana Chakraborty to identify long run and short run effects of FDI.
Accordingly, an analysis of the cointegration estimates suggests that there was a long run cointegrated
relationship between FDI and GDP for the entire panel of 23 countries. Furthermore, for open economies,
causality between FDI and GDP appears to be bi-directional. But causality is bi-directional only in the short
run for relatively closed economies. Long run causality for relatively closed economies is uni-directional
and runs mainly from GDP to FDI. According to Nguyen Nhu Binh and Jonathan Haughton (2002) the
Bilateral Trade Agreement has lead to 30 per cent more FDI into Vietnam in the first year, and an eventual
doubling of the flow. Result would boost economic growth by 0.6 percentage points annually.
But the analysis of Brecher and Diaz-Alejandro (1977), gives us evidence that foreign capital can
lower the economic growth by earning excessive profits in a country with severe trade distortions such as
high tariffs. Maria Carkovic and Ross Levine (2002) also concluded in their econometric study on FDI and
GDP growth that the exogenous component of FDI does not exert a robust, independent influence on
growth.
However, no consensus has yet been reached on the steady state as well as dynamic effects of FDI
on growth. While some studies argue that the impact of FDI on growth is highly heterogeneous across
countries with relatively open economies showing statistically significant results, the other studies
maintains that the direction of causality between the two variables depends on the recipient country’s trade
regime. However, most studies don’t pay any serious attention to the possibility of a bi-directional link
between the two variables in reference.
2.2 Analytical Framework
The methodology involves estimating an econometric model as well as simple calculations such as
average and percentage. The model to investigate the impact of FDI on growth, we use a simple
production function5, but add several slight difference variables. The starting point of model formulation is;
Y= f (A, FDI, K) --------- (1)
Where Y is output; Gross Domestic Product (GDP), and K is capital stock. The variable A captures the total
factor productivity of growth in output not accounting for increasing in factor inputs (K, L and FDI). The
effect of trade liberalization on economic growth is operating through Total Export and Import to GDP
(TP).
Y = F (FDI DIN TP) ---------- (2)
A reliable data series on capital stock is not available. As a result in most studies, (Barro, 1999)
ratio of the gross fixed domestic investment to GDP is employed as a proxy variable represent K. In this
study we employed the gross domestic investment except FDI as a proxy variable for K. As our interest is
5 Here, I dropped the variable L (labour) from the model as Sri Lanka is a labour surplus economy.

10
in studying the impact of FDI inflows on economics growth, we consider the nationally owned investment
defined as gross fixed domestic investment minus the net FDI inflows and FDI as different variables.
Accordingly, the estimating equation used in this study is;
GDP = β0FDIβ1 DINβ2 TPβ3 U ---------- (3)
Where GDP = gross domestic product (in log form)
FDI = foreign direct investment (in percentage form)
DIN = Domestic investment 6(in log form)
TP = Trade liberalization 7(in log form)
U �= stochastic error term
The coefficients β1and β2 are the output elasticity with respect to FDI and DIN. The impact of
FDI on growth (Y) is given by β1. Note that the coefficient, β1, of this variable should be equal to the
coefficient, β2, of DIN if FDI is just as efficient in promoting GDP growth as nationally owned investment.
If the greater technology, human capital or exporting capabilities of FDI make it more efficient in
promoting growth, the co-efficient, β1, can be expected to be greater than the coefficient, β2. On the other
hand, if FDI takes excessive profits out of the country without contributing much in terms of technology
etc., the co- efficient, β1, should be smaller than the coefficient, β2.
2.3 Methodology and Data
The first step of the estimation process is to examine the time series properties of the data series.
We look at patterns and trends in the data and test for stationary and the order of integration. In fact most
economic variables are non-stationary (integrated) in their level form. These non stationary time series may
result to spurious regressions. Although a simple least squares regression of integrated variables may be
spurious, one or more linear combinations of the series may exist that result in a stationary residual. For
this purpose we employed the following forms of Dickey-Fuller and the augmented Dickey-Fuller (ADF)
test where each form differs in the assumed deterministic component(s) in the series:
�Yt = �Yt-1 +Ut ……………………………………..(1) �Yt = �1 +�Yt-1 +Ut………………………………… (2) �Yt = �1 + �2t + �Yt-1 +Ut…………………………...(3)
In each case the null hypothesis is that � = 0, that is, there is a Unit Root. As the error term Ut is
autocorrelated, we use the following equation with lagged difference term instead of equation 3
�Yt = �1 + �2t + �Yt-1 + �i��Yt-i + Ut ………… (4), where i = 1….n
After selecting the order of integrating, next step involve to test the cointegration rank. Here, we
form a Vector Autoregressive Regression (VAR) system. This step involves testing for the appropriate lag
length of the system, including residual diagnostic tests. We specify the VAR as a four variable system
6 Domestic private and government investment 7 TP = Openness of the trade policy regime proxied by OPEN = the ratio of total merchandise trade (import + export) to goods GDP.
11
with a maximum of two lags. The model includes the log of the real GDP, real FDI, real DIN and trade
liberalization. Various procedures have been suggested for determining the appropriate lag length in a
dynamic model. The adjusted R2 is one possibility. Other include the Akaike(1973) Information Criterion
(AIC) and Schwartz’s criterion (SC)8. I used above two critererias to select the appropriate lag length for
this study.
Basic structure of VAR is as following
Z1 Gross Domestic Product
Z2 Foreign Direct Investment
Zt = Z3 = Domestic Investment
Z4 Trade Liberalization
�Zt = � +
This gives the long-run and short-run dynamics of a group of integrated variables. Zt is a vector of
I(1) variables, Ut is a vector of white noise residuals, and � �is a constant vector. The adjustments to
disequilibrium are captured over n lagged periods in the coefficient matrix ti�. This part of the ECM
represents a traditional vector autoregression of the differenced variables. The ��Zt-1 terms represent long-
run equilibrium or cointegrating relationships, and the coefficient matrix can be decomposed into ��’
matrix9. A procedure developed by Johansen (1991) provides a means to investigate the cointegrating
relationship between integrated series. The Johansen test was used to determine the cointegrating rank10.
Obviously, for a long-run relationship to exist, at least the first column must contain non-zero elements. If
8 Akaike(1973) Information Criterion (AIC) ; AIC(p) = Ln (e’e /T)+ (2P/T) Schwartz’s criterion (SC); SC(p) = AIC(p) + (P/T) ( lnT -2 ) P = Number of Lags T = Time = n = sample size e’e = Residuals some of squire 9 This matrix must have lower than full rank, otherwise it can be shown that Zt is entirely a function of the residuals and therefore must be stationary. 10 In general, if Y is I(d) and X is also I(d), where d is the same value, these two series can be cointegrated. Cointegration means that despite being individually nonstationary, a linear combination of two or more time series can be stationary. Cointegration of two or more time series suggests that there is a long-run, or equilibrium, relationship between them. As a proper test for cointegration trace test was used. The CI rank: the trace statistic; Trace = -T � ln ( 1-�i ) � i = r+1 ……..k Which allows for the test of H (r) : the rank of � is r, Against the alternative that the rank of � is k. The results of the trace test are:
1. The hypothesis that r = 0 is rejected if sample value > critical value 2. The hypothesis that r � rank(1,2..) is not rejected if sample value < critical value A large value of the trace statistic is evidence against H (r): that is, with r = 0, a value
of the trace statistic greater than the appropriate critical value allows us to reject r = 0 in favor of r > 0 . The test may then be repeated for r = 1, and so on.
n � ti Zt-i + �� Zt-1 + Ut
i=1

12
more than one linear combination occurs, we can normalize and combine them to investigate pair-wise
effects between the variables. This cointegrating relationship represents the foundation of a complete
dynamic error correction model. For this paper, the ECM and cointegrating relationship allows us to
compare the immediate and overall effects and then, the model will show how fast adjustments occur.
Third, we interpret the cointegrating relations and test for weak exogeneity. Based on these results a vector
error correction model (VECM)11 of the endogenous variables is specified.
The model is estimated using annual data for the period 1959- 2002. Data on gross domestic
product (GDP), Domestic investment (DIN) export and import are obtained from the Central Bank Annual
Reports. Data on FDI are obtained from Central Bank Annual Report and the Board of Investment. Data to
investigate of perception of civil society and foreign firms were collected by interviewing company
representatives and various people who lived in and around Pallakale Industrial Zone.
3. Results and Discussion
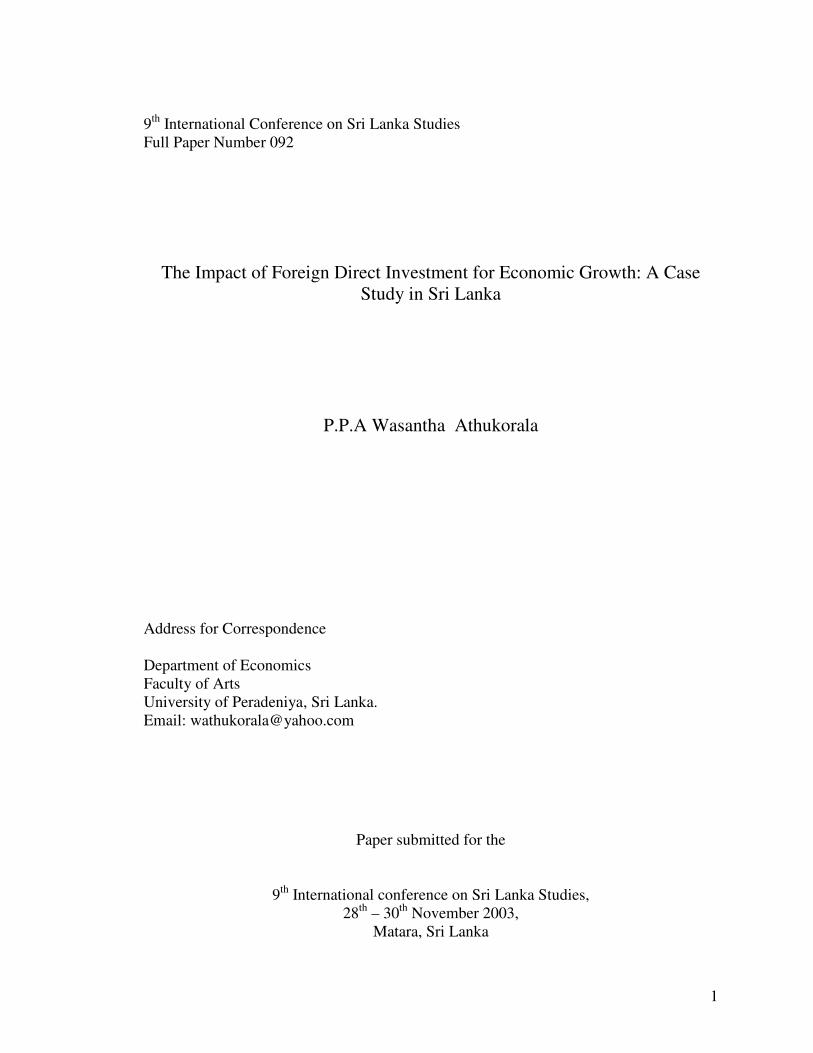
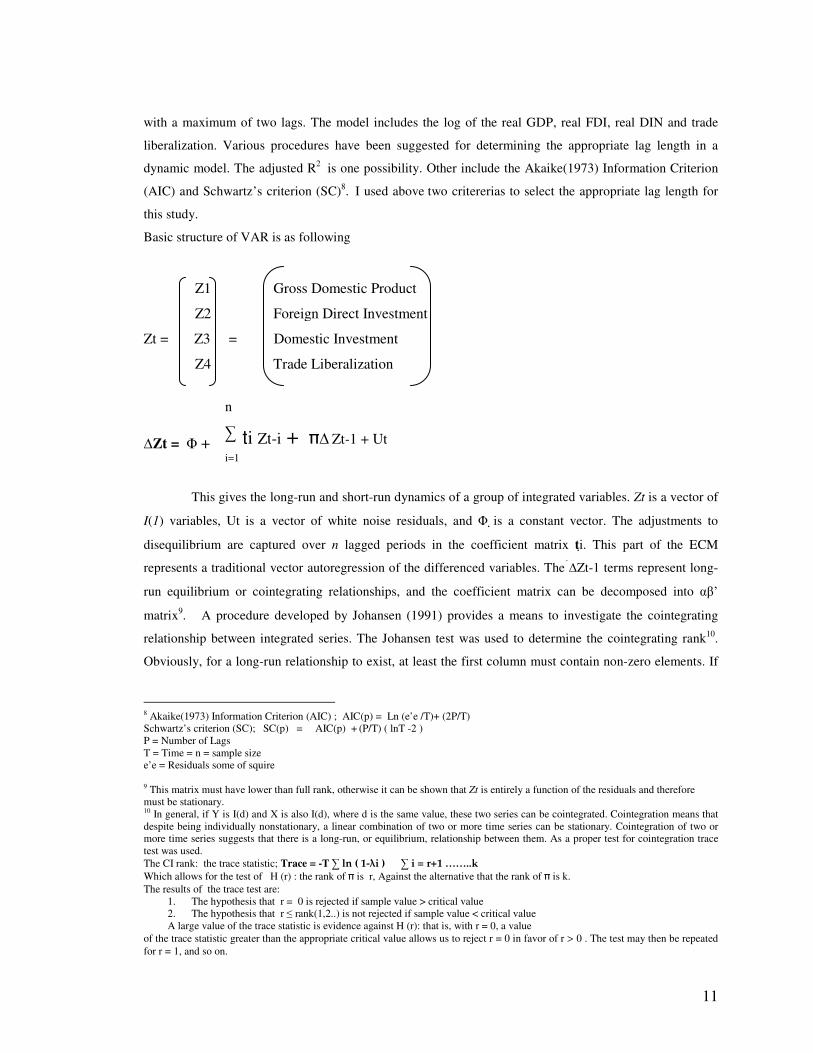
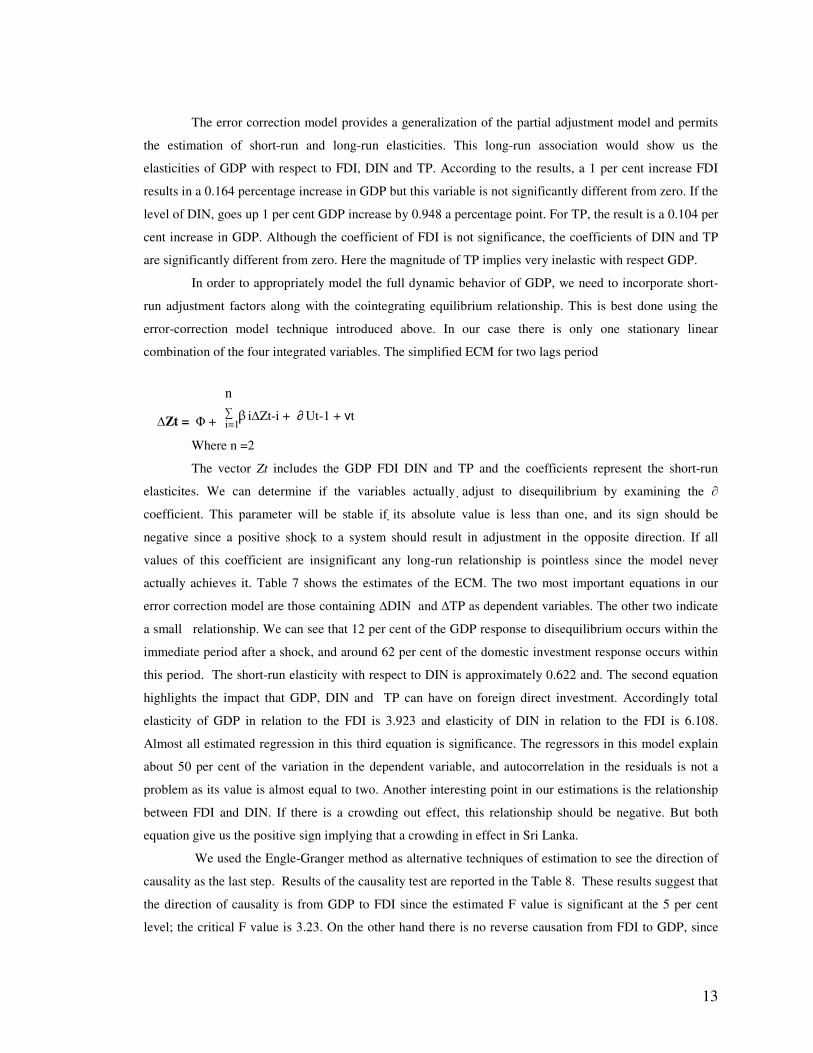
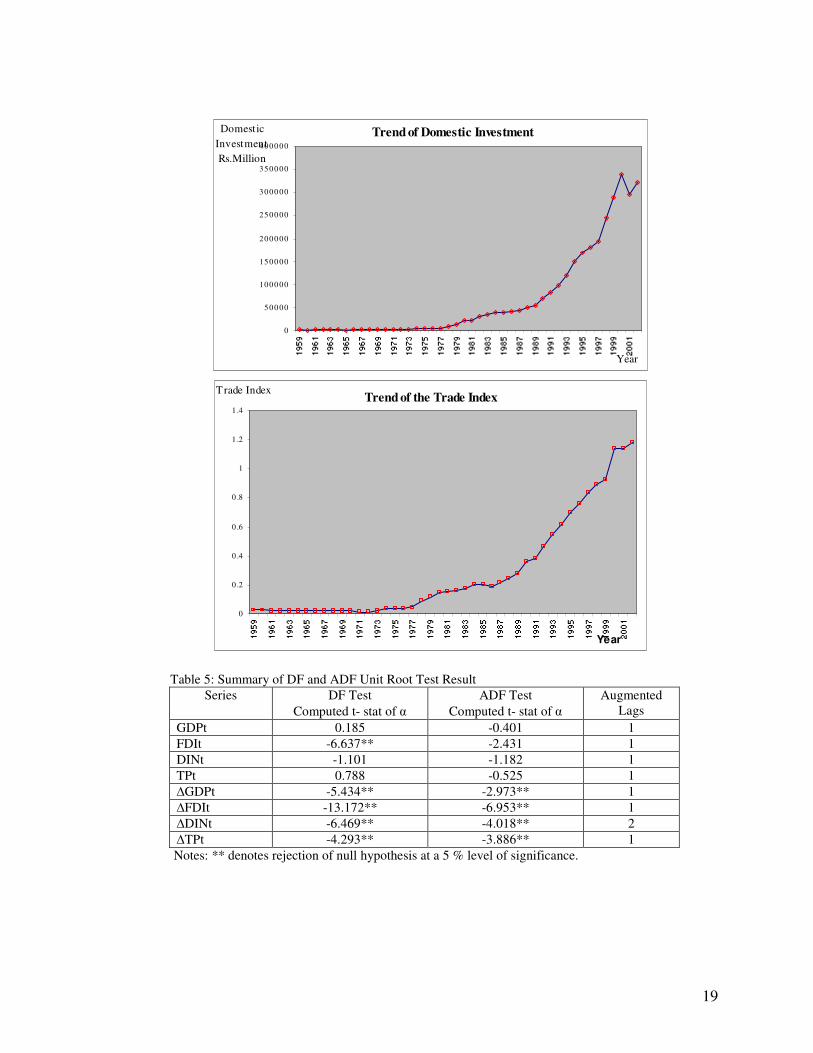
Figure 1 shows the trend of GDP, FDI, DIN and TP over the last 43 years period. According to the
graphs, a clear trend can be observed of the GDP,DIN, and TP in Sri Lanka over this period. However FDI
trend was somewhat not clear as the result of low level of FDI before the economic liberalization period.
3.1. Econometric results
Before estimating any relationships between GDP and its explanatory variables, we need to check
for the stationary of each series. As our graphs also do not give a clear picture regarding the stationary, this
property is tested using the Dickey-Fuller (DF) test and the Augmented Dickey-Fuller (ADF) test for a unit
root. The DF and ADF results for the four series involved in our equation are presented in Table 5. Our
result shows that all variables exhibit integrated order one12. This means that the series are non-stationary in
level but stationary in first-differences. The implication is that there is a possibility to have a co-integrating
vector whose coefficient can directly be interpreted as long-term equalibrium. Therefore, as next step,
Johansen trace test is used to check whether we have a cointegration relationship. Result of the trace test is
reported in Table 6 which gives the number of cointegrating vectors. According to the Table 6, we can
reject the hypothesis that no cointegration exists but fails to reject a hypothesis of more than one stationary
linear combination. The implied cointegrating relationship is obtained from first row of the standardized
beta eigenvector.
It is interpreted as the GDP;
GDPt = -5.885 + 0.164FDIt + 0.948DINt + 0.104TPt + Ut
11 At least three steps are necessary to employ the VECM approach. First, we test the three performance variables for non-stationary. Second, if the variables are integrated of the same order, we check for the presence of a cointegrating relationship. Third, if there is cointegration, we distill the lagged error terms from the estimated cointegrating vector and incorporate the lagged error terms in the VECM process 12 Here according to the DF test, FDI is I(0). But as ADF test is the proper test I used ADF to determine the stationary of the series.
13
The error correction model provides a generalization of the partial adjustment model and permits
the estimation of short-run and long-run elasticities. This long-run association would show us the
elasticities of GDP with respect to FDI, DIN and TP. According to the results, a 1 per cent increase FDI
results in a 0.164 percentage increase in GDP but this variable is not significantly different from zero. If the
level of DIN, goes up 1 per cent GDP increase by 0.948 a percentage point. For TP, the result is a 0.104 per
cent increase in GDP. Although the coefficient of FDI is not significance, the coefficients of DIN and TP
are significantly different from zero. Here the magnitude of TP implies very inelastic with respect GDP.
In order to appropriately model the full dynamic behavior of GDP, we need to incorporate short-
run adjustment factors along with the cointegrating equilibrium relationship. This is best done using the
error-correction model technique introduced above. In our case there is only one stationary linear
combination of the four integrated variables. The simplified ECM for two lags period
�Zt = � +
Where n =2
The vector Zt includes the GDP FDI DIN and TP and the coefficients represent the short-run
elasticites. We can determine if the variables actually �adjust to disequilibrium by examining the �
coefficient. This parameter will be stable if �its absolute value is less than one, and its sign should be
negative since a positive shock� to a system should result in adjustment in the opposite direction. If all
values of this coefficient are insignificant any long-run relationship is pointless since the model never �
actually achieves it. Table 7 shows the estimates of the ECM. The two most important equations in our
error correction model are those containing�� �DIN and �TP as dependent variables. The other two indicate
a small relationship. We can see that 12 per cent of the GDP response to disequilibrium occurs within the
immediate period after a shock, and around 62 per cent of the domestic investment response occurs within
this period. The short-run elasticity with respect to DIN is approximately 0.622 and. The second equation
highlights the impact that GDP, DIN and TP can have on foreign direct investment. Accordingly total
elasticity of GDP in relation to the FDI is 3.923 and elasticity of DIN in relation to the FDI is 6.108.
Almost all estimated regression in this third equation is significance. The regressors in this model explain
about 50 per cent of the variation in the dependent variable, and autocorrelation in the residuals is not a
problem as its value is almost equal to two. Another interesting point in our estimations is the relationship
between FDI and DIN. If there is a crowding out effect, this relationship should be negative. But both
equation give us the positive sign implying that a crowding in effect in Sri Lanka.
We used the Engle-Granger method as alternative techniques of estimation to see the direction of
causality as the last step. Results of the causality test are reported in the Table 8. These results suggest that
the direction of causality is from GDP to FDI since the estimated F value is significant at the 5 per cent
level; the critical F value is 3.23. On the other hand there is no reverse causation from FDI to GDP, since
n � � i�Zt-i + � Ut-1 + �t
i=1

14
the computed F value is not statistically significant. And also causality could be observed from DIN and TP
to GDP as well as from GDP to DIN and TP. The implication is the direct growth impact of FDI on the Sri
Lankan economy has not existed so for. However these results were directly affected the inward economic
policy implemented up to 1977 in the country. Because, almost all the years from 1959 to 1976 negative
FDI flows were recorded and the contribution of FDI to the overall performance of the Sri Lankan
economy was not significant during the 1950s, 1960s and 1970s. But after 1977 it is recorded a continuous
FDI growth in the country. And also the new FDI firms in 1990s are more export-oriented relatively to
those in the early 1980s.
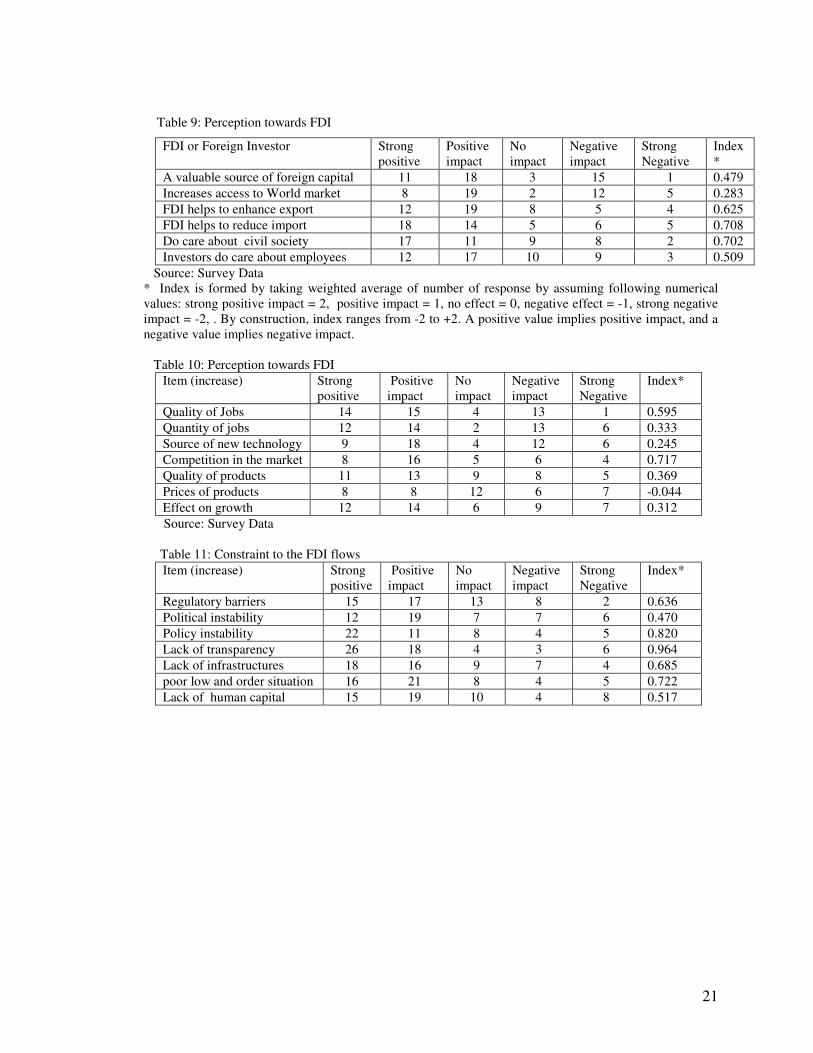
3.2. Attitudes Analysis
Perception of the civil society and foreign firm about the importance of FDI on domestic
economic development in the past is mixed. But their perception seems more aligned towards the positive
aspects of FDI. Most of the responses represent strong agreement or partial agreement with all the positive
aspects of FDI. Tables 9, 10, and 11 show the summary results of the civil society and foreign firms. To
express the summary of responses in terms of a single number, an index13 is constructed by taking weighted
average of number of response of each type. Accordingly a positive value of the index implies positive
impact, and a negative value of the index implies negative impact. And also larger positive value of the
index implies a stronger positive impact. It is evident from the tables that except for price impact, the index
is positive for all issues regarding the impact of FDI on various economic activities. Although perception of
the civil society regarding the impact of FDI is positive, net attitudes of foreign firms toward FDI reveals,
that the investment climate has not improved in Sri Lanka as a result of lack of good governance,
corruption, political instability and disturbance, bureaucratic inertia, and poor low and order situation.
4. Conclusion
This paper has examined the relationship between FDI and GDP using time series data from the
Sri Lankan economy. In Sri Lanka FDI has increased dramatically since the 1980s. Many studies find a
positive link between FDI and growth. But our econometric result shows that FDI inflows do not exert an
independent influence on economic growth. And also the direction of causation is not towards from FDI to
GDP growth but GDP growth to FDI. That is the direct growth impact of FDI on the Sri Lankan economy
has not existed so for. The impact of DIN and TP on GDP growth rate is found to be positive and direct
independent causality could be observed from DIN and TP to GDP as well as from GDP to DIN and TP.
Net attitude of the civil society and foreign firm towards FDI in the country is positive. But net attitude
reveals that the investment climate has not improved in Sri Lanka as a result of; political instability and
13 * Index is formed by taking weighted average of number of response by assuming following numerical values: strong positive impact = 2, positive impact = 1, no effect = 0, negative effect = -1, strong negative impact = -2, . By construction, index ranges from -2 to +2. A positive value implies positive impact, and a negative value implies negative impact.

15
disturbance, poor low and order situation, direct and indirect regulatory barriers, political instability and the
implied policy instability, poorly developed infrastructure facilities, low levels of human capital, lack of
transparency in the trade policy. Accordingly, the protectionist trade policies, direct and indirect regulatory
barriers ( that raised the costs of investment to foreign firms, for example, in Sri Lanka about 13 per cent of
capital costs and 30 percent of profits are lost due to impediments in the regulatory framework), political
instability and the implied policy instability, poorly develop infrastructure facilities, low levels of literacy
and investment in human capital, the war against terrorism (in the first place this has diverted the country’s
resources amounting to 5 per cent of GDP and also this created uncertainty and risk which discourage
investment), lack of transparency in the trade policy, discrimination against non- export oriented sectors
like plantations, and high lending rate are found as the major constraints to FDI flows in Sri Lanka.
The importance of FDI cannot be overstated. As a result, the investment climate in the country must
be improved through appropriate measures such as de-regulation in economic activity, increase domestic
serving, developing the port network, road network, railways and telecommunication facilities etc, creating
more transparency in the trade policy and more flexible labour markets and setting a suitable regulatory
framework and tariff structure. Currently Sri Lanka provides an attractive investment regime but the
response from the investor has not been very encouraging. If the ultimate objective of the government is to
attract FDI for development, poverty reduction and growth, then an appropriate policy mix is necessary to
achieve these.
Reference
Agrawal P.( 2000) Economic impact of foreign direct investment in south Asia Indira Gandhi Institute of Development Research, Gen. A.K. Bombay; India Asia- Europe exploratory roundtable on foreign direct investment and the environment (2001), Background Paper; Regional Institute of Environmental Technology Athukorala P.P.A.W (2003) “ The Impact of Foreign Direct Investment on Economic Growth in Sri Lanka” Proceedings of the Paradeniya University Research Sessions. Vol 8, pp,40. Board of Investment , Various reports, Colombo :Sri Lanka Bautan.L. and M.A. Sumlihskhi,(1999) “Trends in private investment in developing countries”, Statistics for 1970-1995, Discussion paper, IFC The World Bank, Washington D.C. Carkovic M. and Levine R.,(2002) Does Foreign Direct investment Accelerate Economic Growth?, University of Minnesota Dunning H.J. and Narula Rajeneesh (1999), “Foreign direct investment and governments” A catalysts for economic restructuring, Roulledge, Landon and New York.
Investment for development, Investment Performance and Perceptions Report (2002), Consumer Unity and Trust Society DFID, UK
Investment for development, Investment Policy Country Report (2002) , Consumer Unity and Trust Society DFID, UK

16
Kohpaiboon K. Foreign Trade Regime and FDI-Growth Nexus : A Case Study of Thailand, Ph D Scholar, Division of Economics, Research School of Pacific and Asian Studies, Australian National University
Manoj Pant,( 2002), Brainstorming Meeting on Competition and Investment International Working Group on the Doha Agenda, CUTS , Uganda
Shujiro Urata ( 1998) Japanese foreign direct investment in Asia: Its impact on export expantion and technology acquisition of the host economies, Waseda University and Japan Center for Economic research. Tadesse B. and Avenue W.M, The FDI-Trade Relationship: Are Developing Countries Different?, Western Michigan University, Kalamazoo.
World Investment Report (2002), Transnational Corporation and Export Competitiveness, UNTACD: New York and Geneva

17
Table 1: Inward and outward FDI stocks as a percentage of gross domestic product
Source: World Investment Report 2002.
Table 2: Inward and outward FDI stocks as a percentage of gross domestic product in the selected regions
Region 1980 1985 1990 1995 2000 Inward 6.1 9.2 10.6 12.9 30.3 European Union Outward 6.1 10.2 11.6 15.0 40.1 Inward 6.2 9.3 10.8 13.1 30.2 Western Europe Outward 6.4 10.5 12.1 16.1 41.4 Outward - 0.2 1.7 5.4 18.9 Central and
Eastern Europe Inward - - 0.4 0.9 2.7 Inward 4.5 5.5 8.0 8.3 13.5 North America Outward 7.9 6.2 8.1 10.3 14.5 Inward 6.5 11.0 10.4 11.8 30.9 Latin America Outward 1.2 1.9 1.8 3.0 6.2 Inward 5.9 8.9 8.5 8.6 30.0 South America Outward 1.5 1.8 1.5 1.9 5.0 Inward 8.8 10.3 10.7 15.6 25.5 Africa Outward 2.2 4.1 5.9 7.9 9.2 Outward 22.7 24.8 29.0 26.9 37.6 The Pacific Inward 0.3 1.0 2.1 7.3 14.6 Inward 13.0 16.3 14.8 17.0 31.6 Asia Outward 0.9 1.0 2.7 5.7 15.2
Source: World Investment Report 2002. Table 3: Inward and outward FDI stocks as a percentage of gross domestic product in the selected countries in Asia
Country 1980 1985 1990 1995 2000 Inward 3.1 3.4 7.0 19.6 32.3 China Outward - - 0.7 2.3 2.4 Inward 436.2 372.1 198.1 125.0 263.8 Hong Kong Outward 0.5 6.7 15.9 56.6 224.9 Inward 3.0 5.1 9.6 10.4 20.0 Thailand Outward - - 0.5 1.3 2.0 Inward 13.2 28.2 34.0 25.0 39.6 Indonesia Outward - 0.1 0.1 0.6 1.5 Inward 2.9 3.5 4.8 9.1 11.2 Pakistan Outward 0.2 0.4 0.6 0.7 0.8 Inward 52.9 73.6 77.9 71.5 103.8 Singapore Outward 31.7 24.8 21.3 42.0 57.5 Inward 0.6 0.5 0.5 1.6 4.1 India Outward 0.1 0.1 0.1 0.1 0.3 Inward 5.7 8.6 8.5 10.0 15.0 Sri Lanka Outward - - 0.1 0.3 0.5
Source: World Investment Report 2001.
Country 1980 1985 1990 1995 2000 Inward 6.0 7.8 9.2 10.0 20.0 World Outward 5.4 6.2 8.4 9.9 19.6 Inward 4.8 6.2 8.1 8.9 17.1 Developed
Countries Outward 6.2 7.2 9.6 11.3 22.1 Inward 10.2 13.9 13.0 15.3 30.9 Developing
Countries Outward 1.3 1.7 2.8 5.1 11.9

18
Table 4: Foreign direct investment and total investment of Sri Lanka Year Total investment
(Rs. Million) Foreign direct investment (Rs. Million)
1990 71455 1294 1991 85156 2634 1992 103239 5315 1993 127675 9107 1994 156510 7815 1995 171825 2931 1996 186264 6606 1997 217103 25504 1998 255889 12379 1999 301823 12449 2000 352632 13326 2001 309684 14129 2002 337782 16489
Source: Economic and Social Statistics of Sri Lanka Figure 1: Trend of the Variables
Trend of GDP
0
100 000
200 000
300 000
400 000
500 000
600 000
700 000
800 000
900 000
1000 000
Year
GDP Rs. Million
Trend of FDI
-5000
0
5000
10000
15000
20000
25000
30000
Year
FDI Rs. Million
19
Trend of Domestic Investment
0
500 00
1000 00
1500 00
2000 00
2500 00
3000 00
3500 00
4000 00
Year
Domestic Investment Rs.Million
Trend of the Trade Index
0
0 .2
0 .4
0 .6
0 .8
1
1 .2
1 .4
Year
Trade Index
Table 5: Summary of DF and ADF Unit Root Test Result
Series DF Test Computed t- stat of �
ADF Test Computed t- stat of �
Augmented Lags
GDPt 0.185 -0.401 1 FDIt -6.637** -2.431 1 DINt -1.101 -1.182 1 TPt 0.788 -0.525 1 �GDPt -5.434** -2.973** 1 �FDIt -13.172** -6.953** 1 �DINt -6.469** -4.018** 2 �TPt -4.293** -3.886** 1
Notes: ** denotes rejection of null hypothesis at a 5 % level of significance.

20
Table 6: Test of cointegration among variables
R T Critical Values
D T Critical Values
D
r = 0 r < 1 r < 2 r < 3
91.664 51.679 18.030 8.299
75.74 53.42 34.80 19.99
R F* F F
74.111 34.331 8.352 0.004
68.68 47.21 29.38 3.84
R F F F
The number of cointegrating vectors (r) is tested using the trace test with the constant within and outside the cointegrating vectors. The test statistic (T) is the calculated trace test, associated with the number of cointegrating vectors. The critical values are taken under 5 % level. The column labeled ‘D’ gives our decision to reject ( R ) or fail to reject (F) , at a 5 per cent level of significance, the null hypothesis of the number of cointegrating vectors. The symbol * indicates the stopping point. Table 7: Error Correction Model representation
Dependent Variable Independent �GDPt �FDIt �DINt �TPt
�GDPt 3.923 (4.829) * 0.616 (-4.180) * 0.640 (4.800) *
�GDPt-1 0.119 (0.561) -1.875 (-1..575) 0.368 (1.835) -0.311 (-1.600)
�GDPt-2 -0.137 (-0.798) 1.334 (1.361) -0.213 (-1.267) 0.221 (1.382)
�FDIt 0.115 (0.482) 0.169 (43.697) * -0.163 (-355.390) *
�FDIt-1 -0.046 (-1.321) 0.526 (2.852) -0.096 (-3.131) * 0.086 (2.884)
�FDIt-2 0.001 (0.034) -0.029 (-0.199) 0.005 (-3.131) * -0.005(-0.226)
�DINt 0.622 (-4.180) * 5.805 (43.697) * 0.951 (45.312) *
�DINt-1 0.276 (1.368) -3.006 (-2.804) 0.549 (3.062) * -0.496(-2.907)
�DINt-2 -0.003 (-0.019) 0.170 (0.186) -0.033 (-0.213) 0.032 (-2.836)
�TPt 0.705 (4.800) * 6.108 (-355.390) * 1.037 (45.311) *
�TPt-1 -0.285 (-1.338) 3.232 (2.876) -0.593 (-3.156) * 0.533 (2.907)
�TPt-2 0.003 (0.022) -0.168 (-0.187) 0.033 (0.214) -0.031 (-0.215)
Ut-1 -0.121 (3.489)* -0.001 (-0.106) -0.300 (-2.962) * 0.201(-3.063) *
R2 0.508 0.40 0.510 0.321
DW 1.971 1.966 1.973 1.966
Notes: * Denotes rejection of null hypothesis at least than 5 % level of significance Table 8: Granger Type Causality
Direction F Value Critical Value FDI to GDP 0.722 3.23 GDP to FDI 12.062* 3.23 DIN to GDP 5.228* 2.84 GDP to DIN 4.988* 2.84 TP to GDP 7.052* 3.23 GDP to TP 4.932* 3.23
Notes: F values are calculated by using different set of variables. Critical values are different due to the different lag length. * Denotes rejection of null hypothesis at least than 5 % level of significance.
A constant within the cointegrating Vectors
No constant in the cointegrating Vectors
21
Table 9: Perception towards FDI
FDI or Foreign Investor Strong positive
Positive impact
No impact
Negative impact
Strong Negative
Index*
A valuable source of foreign capital 11 18 3 15 1 0.479 Increases access to World market 8 19 2 12 5 0.283 FDI helps to enhance export 12 19 8 5 4 0.625 FDI helps to reduce import 18 14 5 6 5 0.708 Do care about civil society 17 11 9 8 2 0.702 Investors do care about employees 12 17 10 9 3 0.509
Source: Survey Data * Index is formed by taking weighted average of number of response by assuming following numerical values: strong positive impact = 2, positive impact = 1, no effect = 0, negative effect = -1, strong negative impact = -2, . By construction, index ranges from -2 to +2. A positive value implies positive impact, and a negative value implies negative impact. Table 10: Perception towards FDI
Item (increase) Strong positive
Positive impact
No impact
Negative impact
Strong Negative
Index*
Quality of Jobs 14 15 4 13 1 0.595 Quantity of jobs 12 14 2 13 6 0.333 Source of new technology 9 18 4 12 6 0.245 Competition in the market 8 16 5 6 4 0.717 Quality of products 11 13 9 8 5 0.369 Prices of products 8 8 12 6 7 -0.044 Effect on growth 12 14 6 9 7 0.312
Source: Survey Data Table 11: Constraint to the FDI flows
Item (increase) Strong positive
Positive impact
No impact
Negative impact
Strong Negative
Index*
Regulatory barriers 15 17 13 8 2 0.636 Political instability 12 19 7 7 6 0.470 Policy instability 22 11 8 4 5 0.820 Lack of transparency 26 18 4 3 6 0.964 Lack of infrastructures 18 16 9 7 4 0.685 poor low and order situation 16 21 8 4 5 0.722 Lack of human capital 15 19 10 4 8 0.517