the impact of food price volatility and food inflation on...
TRANSCRIPT

The Impact of Food Price Volatility and Food Inflation on Southern and Eastern Mediterranean Countries CIDOB paper for Union for the Mediterranean (UfM) Barcelona, October 2014
By Eckart Woertz, Eduard Soler, Oriol Farrés and Anna Busquets
LEGAL NOTICE The information and views set out in this report are those of the author(s) and do not necessarily reflect the views and official opinion of the UfMS. Neither the UfMS nor any person acting on its behalf may be held responsible for the use which may be made of the information contained therein. More information on the UfMS is available on the Internet (http://www.ufmsecretariat.org). © UfMS, 2014 Reproduction is authorised provided the source is acknowledged.
2
Table of Contents
Introduction ....................................................................................................................... 3 Global Price Developments of Major Food Items since 2000 ............................................. 5 Causes of Food Price Volatility, and Food Inflation ............................................................ 7 Effects of Global Market Developments in SEM Countries ................................................ 9 The State of Food Security in SEM Countries .................................................................. 13 The State of Agriculture in SEM Countries ...................................................................... 15 Global Import Vulnerabilities and Export Capacities ........................................................ 18 Individual Food Import Dependence of SEM Countries by Trading Partners ................... 20 Policy Measures to Address Food Price and Volatility Issues .......................................... 25 Possible Impacts of Geopolitical Events on Food Security............................................... 28 Conclusions and policy-recommendations for the UfM .................................................... 32 References ...................................................................................................................... 35 List of Figures Figure 1: FAO Food Price Index (Nominal) During the Global Food Crisis 2007-08 ............................................................................................................................. 5 Figure 2: FAO Food Price Index, Inflation Adjusted, 2000-14 ............................................ 6 Figure 3: Global Wheat Storage ........................................................................................ 8 Figure 4: Percentage of Income Spent on Food ................................................................ 9 Figure 5: Food and Fuel Subsidies as % of GDP, 2008 ................................................... 10 Figure 6: Food and Fuel Subsidies as % of Budget Expenditure 2008 ............................ 11 Figure 7: Share of Agriculture (%): Rural Population, Labor Force Value Added ............. 17 Figure 8: Global Net Trade in Cereals 2013/14 ................................................................ 18 Figure 9: Role of Food Net Trade in Food Consumption (2008) ...................................... 19 Figure 10: Net Food Trade per Capita of SEM Countries, 2013 ....................................... 21 Figure 11: Net Imports of Major Food Items, SEM Countries 2013 .................................. 22 Figure 12: Top 5 Exporters of Major Food Items to SEM Countries 2013 ........................ 23 Figure 13: Top 5 Exporters of Individual Cereals to SEM Countries 2013 ........................ 24 Figure 14: Global Market Shares of Russia and Ukraine in Wheat, Barley and Corn, 2000/01-2014/15 ............................................................................................. 29
List of Tables Table 1: Demographics in SEM Countries: 2010, 2030, 2050 ............................................ 3 Table 2: Status of Food Security in SEM Countries ......................................................... 14 Table 3: Self-Sufficiency Ratios (% of consumption) in Arab SEM Countries by Food Product Category, 2011 ..................................................................... 15 Table 4: Reactions of SEM Governments to the Global Food Crisis 2007-08 (A) and the Arab Spring Uprisings 2011 (B) .................................................................... 26 Table 5: Grain Exports of Russia and Ukraine to SEM Countries, 2013 ........................... 31

3
Introduction The Middle East and North Africa (MENA) region is the biggest food importer of the world. Its net imports of cereals amount to 92 million tons, much more than the 66 million tons of East Asia, which is the second largest importer and has a much larger population. Southern and Eastern Mediterranean (SEM) Countries encompass a major part of the MENA region, namely Turkey, Lebanon, Jordan, Israel, Palestine, Egypt, Tunisia, Algeria, Morocco and Libya. Most of them are part of the Union for the Mediterranean (UfM) and have association agreements with the EU. Yet, Libya has only an observer status in the UfM. Albania, Bosnia-Herzegovina, Montenegro, Monaco and Mauritania are also UfM members, but are not included under SEM countries for the purpose of this study.
In the wake of the global food crisis of 2008 increased food price volatility and food price inflation have sapped purchasing power of middle classes and reduced food security of the poor in SEM countries. As governments subsidize many staple foods, their budgets have been affected and their ability to plan ahead has been compromised. Of particular strategic concern were the temporary exports restrictions that food exporters like Argentina, Russia, and Vietnam announced out of concern for their own food security. Declining agricultural productivity growth rates, climate change and ecological backlash weigh on the reliability of supplies, while new demand factors like changing diets in emerging markets and biofuels have developed. Exportable surpluses on international markets might not be as readily available as in the past. There are indications that food prices will remain on structurally higher levels compared to preceding decades. Possibilities to expand domestic food production in SEM countries are limited by lack of water and arable land. Birth rates have declined and many SEM countries are now in a demographic transition, but it takes time until strong youth cohorts have moved through a population pyramid. Population growth will only level out after 2050 and food import needs of SEM countries will rise (see Table 1). Furthermore, some of the UN population projections in Table 1 might be too optimistic as some SEM countries like Algeria, Tunisia, and especially Egypt have seen a rebound in fertility rates in recent years, which would increase future food import needs.
Table 1: Demographics in SEM Countries: 2010, 2030, 2050
Population (million)
Total Fertility Rate (children per woman)
Population Growth (%)
2010 2030 2050
2010-15
2025-30
2045-50
2010-15
2025-30
2045-50
Morocco 32 37.5 39.2 2.18 1.81 1.65 0.99 0.59 0.05
Algeria 35.5 43.5 46.5 2.14 1.72 1.66 1.36 0.67 0.16
Tunisia 10.5 12.2 12.7 1.91 1.67 1.72 1.01 0.48 0.05
Libya 6.4 7.5 8.8 2.41 1.72 1.64 1.03 1.36 1.12
Egypt 81.1 106.5 123.5 2.64 2.2 1.88 1.67 1.08 0.53
Palestine 4 6.8 9.7 4.27 3.37 2.65 2.81 2.28 1.6

4
Israel 7.4 9.8 12 2.91 2.61 2.27 1.66 1.2 0.89
Jordan 6.3 7.9 9.9 2.89 2.05 1.71 2.16 1.84 1.65
Lebanon 4.2 4.7 4.7 1.76 1.59 1.64 0.73 0.33 -0.21
Turkey 72.8 86.7 91.6 2.02 1.76 1.69 1.14 0.63 0.08
West Asia 232 320.4 395.4 2.85 2.49 2.22 1.88 1.36 0.87
World 6,896 8,321 9,306 2.45 2.29 2.17 1.1 0.78 0.44
More developed world
1,236 1,296 1,312 1.71 1.85 1.97 0.33 0.15 0.03
Less developed excl. China
4,288 5,600 6,669 2.86 2.5 2.24 1.52 1.14 0.72
Source: (United Nations, 2011)
Against this backdrop this study first outlines global price developments of major food items since 2000 (cereals, oils, dairy products, sugar, and meat), and juxtaposes them with earlier levels of prices and volatility. Second, it discusses likely causes of these price developments, such as reduced agricultural productivity growth since the 1990s, population growth, changing diets of middle classes in emerging markets, biofuels, changes in the agricultural support policies in the US and the EU at the turn of the 2000s, environmental backlash, and climate change. Third, it analyzes how these changes of global food prices have materialized on a national level in SEM countries. As far as data is available it is outlined which subsidies regimes the respective governments entertain and how their budgetary position has been affected. Fourth, it outlines the state of food security in the SEM countries on a macro and a micro level. The main food security challenge are not calorie shortages, but lack of micronutrients like vitamins and iron. Fifth, it gives an overview of global export capacities on which the food import dependent SEM countries so crucially rely. Sixth, the food import dependence of each SEM country is outlined. Net imports of major food items are compared with domestic production and consumption levels. The main import partners are identified for the respective food items and an assessment of the reliability of their supplies is given. Seventh, possible policy measures are described by taking account of peculiarities of each SEM country like population size, GDP per capita and resource endowment. A brief overview of governments’ reactions is given, ranging from subsidy policies and domestic agricultural policies to agricultural investments abroad, storage and trading strategies. Particular attention is being paid to the role of large food trading and processing companies in global value chains and the importance of international organizations like WTO, World Bank and FAO in formulating policies for the global food system. Eighth, the impact of geopolitical events on food prices such as the Ukraine crisis or political unrest within the MENA is discussed. Beside past and ongoing events, the section also identifies which kind of events and under which circumstances could have a larger impact in the years to come. Finally, this report provides policy-relevant conclusions for the UfM and other actors involved in euro-Mediterranean cooperation initiatives.

5
Global Price Developments of Major Food Items since 2000
In 2007-8 global food markets witnessed a roller coaster ride. From January 2007 to July 2008 the FAO food price index leaped by 61 percent, driven by its dairy, cereals, and oils components (see Figure 1). The jump over the year was particularly pronounced for cereals. Wheat prices more than doubled. Prices for rice even tripled at one point. Rice prices can be prone to volatility as their markets are less liquid. A smaller share of total production is traded on international markets (ca. 6 percent as opposed to ca. 18 percent in the case of wheat).
Figure 1: FAO Food Price Index (Nominal) During the Global Food Crisis 2007-08
Produced by CIDOB. Source: (FAO, 2014)
In the second half of 2008 food prices corrected steeply, together with those for other commodities like oil. But they crept upwards again in 2010/11 and reached the preceding heights of 2008. Buttressed by bumper crops and supply side reactions, there was again a more drawn out correction of cereals, oils, and sugar prices towards 2014, but not for dairy and meat prices, which were driven by strong demand from new middle classes in emerging markets like China and India. Yet, despite such corrections, inflation adjusted food prices remain considerably above their averages of the 1980s and 1990s. Their volatility has increased as the pronounced peaks and troughs since 2007 show (see Figure 2). The FAO expects these food price patterns to persist over the coming decade, even though food prices will likely face further downward pressures over the next 1-2 years before stabilizing on the elevated levels reached (OECD-FAO, 2013).
0
50
100
150
200
250
300
1/2
00
7
2/2
00
7
3/2
00
7
4/2
00
7
5/2
00
7
6/2
00
7
7/2
00
7
8/2
00
7
9/2
00
7
10
/20
07
11
/20
07
12
/20
07
1/2
00
8
2/2
00
8
3/2
00
8
4/2
00
8
5/2
00
8
6/2
00
8
Food Price Index
Meat Price Index
Dairy Price Index
Cereals PriceIndex

6
Figure 2: FAO Food Price Index, Inflation Adjusted, 2000-14
Produced by CIDOB. Source: (FAO, 2014)
However, if one goes further back in time and adopts a longer historical perspective, food prices are not that high. They trended downwards in real terms from the 1860s on, before levelling out since the late 1980s (Johnson, 1999; Piesse and Thirtle, 2009; Jacks, 2013). Production growth and productivity increases via mechanized agriculture, intensive livestock production and the use of mineral fertilizers outweighed population growth. In fact before 2007-08 development debates focused on the threat of low food prices for farmers in the developing world and their exposure to unfair competition from producers in the US and the European Union who have benefitted from agricultural subsidies. Now the focus has shifted to the effect of higher food prices on consumers, especially of poor people who spend a relatively high share of their disposable income on food. Yet it needs to be kept in mind that the real problem is rather lack of income and economic development than high prices, from which poorer farmers in the developing world in turn often could not benefit because of a lack of market access (Harrigan, 2014)
0
50
100
150
200
250
300
3501
/20
00
10
/20
00
7/2
00
1
4/2
00
2
1/2
00
3
10
/20
03
7/2
00
4
4/2
00
5
1/2
00
6
10
/20
06
7/2
00
7
4/2
00
8
1/2
00
9
10
/20
09
7/2
01
0
4/2
01
1
1/2
01
2
10
/20
12
7/2
01
3
4/2
01
4
Food PriceIndexMeat PriceIndexDairy PriceIndexCereals PriceIndexOils PriceIndex

7
Causes of Food Price Volatility and Food Inflation The reasons for the global food crisis have been hotly debated. On the demand side there have been continuous though abating population growth, changing diets in emerging markets like China, biofuel production, and the increased market participation by financial investors. On the supply side productivity growth has diminished since the 1990s, ecological constraints and climate change have an increasing impact on agricultural production, input factors like fuels and fertilizers have become more expensive, stock levels have been low, and export restrictions by food exporters like Russia, Vietnam, India, and Argentina out of concern for their own food security led to panic buying (Woertz, 2013b; Harrigan, 2014).
Some of these factors like changing diets and the productivity declines have been long-term in nature, others like currency and oil price developments have had a medium-term lead time, while yet others like droughts and export restrictions occurred momentarily.
Because the possibilities to expand production area are limited, the declining productivity growth is a major concern. Unused arable land is scarce and the globally available land bank is heavily concentrated in a few countries in Africa and Latin America (Deininger et al., 2011). The very term “unused land” is disputed as it often overlooks the existence of customary land rights by pastoralist and small-scale farmers. Those might not use the land with modern technology and thus underutilize it, but their livelihoods could be threatened by expansion of modern agriculture. Some argue that Genetically Modified Organisms (GMO) could reignite productivity growth in a similar way as the Green Revolution did in the 1960s and 1970s (Paarlberg, 2010; Paarlberg, 2008). Others point to the negative environmental repercussions of the latter and risks of GMO technology like reduced biodiversity, vulnerability to super weeds, and threats to the food sovereignty of farmers, i.e. their freedom to make their own production decisions within food systems of their choice. Instead these critics call for environmentally adjusted and community based farming practices and reduced meat consumption, which has vastly more resource needs than plant based diets (Weis, 2007).
Similar vivid disagreements exist to which extent financial speculation has contributed to food price volatility and overshooting of prices. Trading in financial derivatives on agricultural products increased steeply in the 2000s. Some argue that the deregulation of commodities markets in the US in the 2000s led to the entry of new financial market participants like pension funds and increased short-term speculation. This in turn caused increased volatility and overshooting of prices (Hernandez and Torero, 2010; Schutter, 2010). Countervailing studies that were attached to a public outreach and dialogue effort on part of the Deutsche Bank have argued that the increased trading volume of derivatives has not contributed to higher prices and volatility, but rather had a neutral to positive impact as it increased market liquidity and provided hedging services to physical producers (Deutsche Bank Responsibility, 2014).
The deregulation of agriculture since the 1970s has had an impact on stock levels that carries important implications for SEM countries, which are among the largest food importers of the world. The storage of staple crops for price stabilization has declined because of three factors: 1) the failure of international commodity agreements in the 1970s, 2) the inclusion of agriculture in the Uruguay round of the GATT trade liberalization efforts in 1986, and 3) the switch in the US and the EU from price support schemes to direct subsidies to farmers in 1996 and 2003 respectively when the EU reformed its Common Agricultural Policy (CAP) (Winders, 2011).

8
Storage by food producers in the Northern hemisphere has declined and food importer nations have not increased their storage correspondingly. The reduced stocks have made markets more vulnerable. In the case of wheat, the US and the EU today only hold 12 and 6 percent of global stocks respectively, while China is the largest stockholder with 31 percent (see Figure 3). The Middle East only holds 10 percent and Egypt, the largest wheat importer of the world, only 3 percent (World Bank and FAO, 2012).
Figure 3: Global Wheat Storage
Produced by CIDOB. Source: (World Bank and FAO, 2012)
OECD and FAO have estimated that global food production will need to grow 60 percent by 2050 in order to meet the anticipated demand (OECD-FAO, 2013). This figure could decrease if food waste was tackled more efficiently (FAO, 2011), but production growth will undoubtedly need to take place. From a food security perspective the role of cereals is paramount. About 40 percent of global calorie provision goes back to wheat and rice alone. Cereals like corn and barley are also an important feedstock for meat production beside soybeans and green fodder like alfalfa.
Projected global demand trends show a particularly pronounced growth for biofuels and feedstock for animals. Biofuel demand is spurred by supporting subsidies and legislation and is currently mostly produced from corn in the US, from sugar in Brazil, and from canola and beetroot in Europe. Because of competing land needs of food production for human consumption biofuel production is controversial. It might contribute as much as 30 percent to grain price inflation until 2020 if governments achieve announced development targets (Fischer et al., 2009). Only if biofuel production from algae became technically and commercially viable this conflict could be overcome as algae can be grown with saltwater and would not compete with food production for arable land.
Spurred by growing meat consumption in emerging markets feedstock demand for animals will show above average growth. China in particular has developed into a major demand factor for soybeans, most notably from Brazil. Saudi Arabia imports a whopping 40-45% of globally traded barley for its livestock industry and will possibly become the largest importer of alfalfa over the coming decade ahead of Japan, South Korea, and the UAE.

9
Effects of Global Market Developments in SEM Countries Global food prices are different from local food prices, which are moderated by subsidies and local costs of food processing and distribution. The latter partly depend on the quality of logistic infrastructure and might show different price dynamics than agricultural raw materials. In developed countries like the US people spend a relatively low share of their overall budget on food. Moreover, processed and packaged foods constitute a large part of spending on food items (see Figure 4). Hence inflation of crops only affects a fraction of overall spending on food and the impact on overall consumer price inflation is more limited than in developing countries where people spend a larger share of their income on food and rely less on processed and packaged foods.
Figure 4: Percentage of Income Spent on Food
Produced by CIDOB. Source: (Harrigan, 2014) based on USDA data
In the SEM countries in Figure 4 people spend between 35 and 44 percent of their income on food, with the exception of Israel with 17.7 percent. Another study put the percentage spent on food as high as 55 percent and food’s contribution to total consumer price inflation at a very high level, reaching up to 60 and 80 percent in some cases (Albers and Peeters, 2011). This is considerable in international comparison, but also in comparison to other countries in the MENA with higher per capita GDP like the oil exporting countries of the Gulf.
Subsidies can cushion the impact of global food price shocks for local consumers and put the burden of adjustment on the shoulders of the respective governments. Globally food price increases have shown a pass-through effect of around 0.3 percent for every 1 percent price increase. Subsidy regimes absorbed some of the global price hikes for consumers in the SEM countries, but there has been pass through of global food price
6,9
8,7
12,7
14,5
17,7
23,7
25,9
35,7
38,1
40,4
40,7
43,8
0% 10% 20% 30% 40% 50% 60% 70% 80% 90% 100%
US
UAE
Qatar
Kuwait
Israel
Saudi Arabia
Iran
Tunisia
Egypt
Morocco
Jordan
Algeria
10
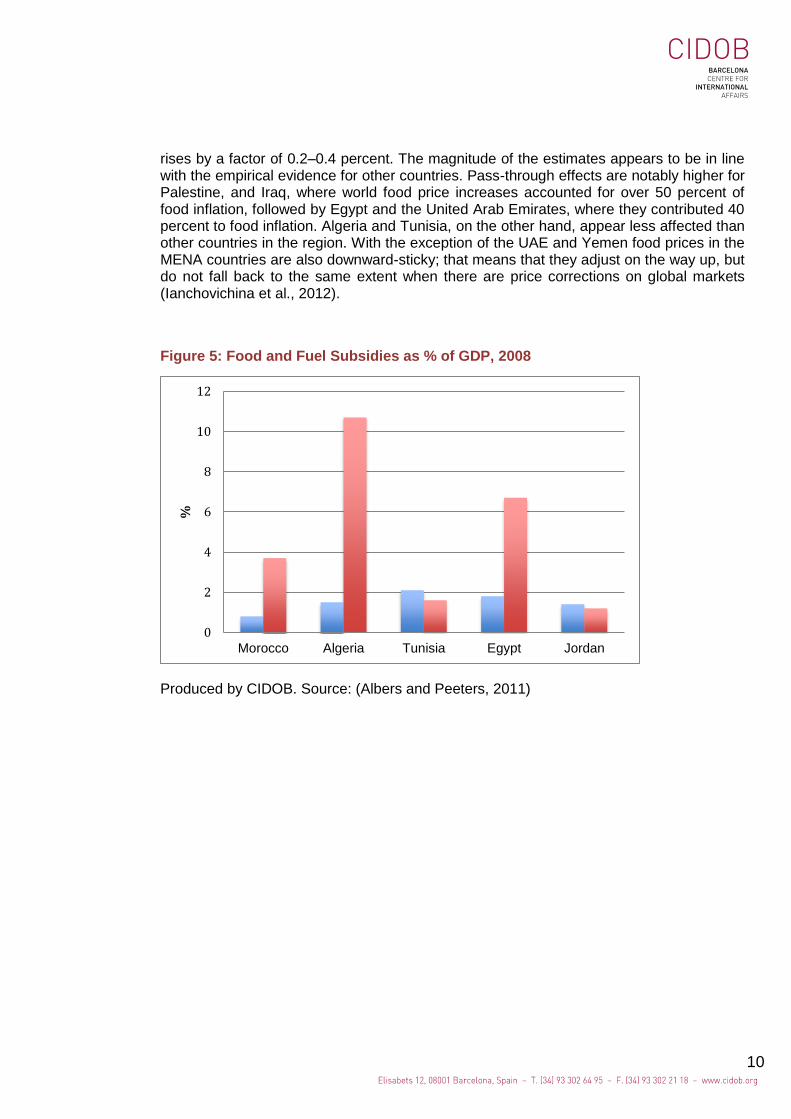
rises by a factor of 0.2–0.4 percent. The magnitude of the estimates appears to be in line with the empirical evidence for other countries. Pass-through effects are notably higher for Palestine, and Iraq, where world food price increases accounted for over 50 percent of food inflation, followed by Egypt and the United Arab Emirates, where they contributed 40 percent to food inflation. Algeria and Tunisia, on the other hand, appear less affected than other countries in the region. With the exception of the UAE and Yemen food prices in the MENA countries are also downward-sticky; that means that they adjust on the way up, but do not fall back to the same extent when there are price corrections on global markets (Ianchovichina et al., 2012).
Figure 5: Food and Fuel Subsidies as % of GDP, 2008
Produced by CIDOB. Source: (Albers and Peeters, 2011)
0
2
4
6
8
10
12
Morocco Algeria Tunisia Egypt Jordan
%

11
Figure 6: Food and Fuel Subsidies as % of Budget Expenditure, 2008
Produced by CIDOB. Source: (Albers and Peeters, 2011)
Food prices in the SEM countries outpaced overall inflation rates from late 2005 to mid-2008. Overall consumer price inflation rose from 3.4 percent in July 2007 to 10 percent in July 2008, driven to a large extent by food price inflation which jumped from 5.8 percent to 14.8 percent over this 12 month period (Albers and Peeters, 2011).
The GDP shares of food and fuel subsidies in SEM countries vary, especially in the case of fuels. In 2008 at the time of the global food crisis, they stood at around 2 percent in many SEM countries for food and reached more than 6 for fuel in Egypt. Fuel subsidies were usually considerably higher than food subsides. Only Tunisia and Jordan spend more on food than on fuel subsidies (see Figure 5).
These expenditures for subsidies have constituted a substantial fiscal burden. In the case of Morocco and Egypt they reached 20 and 31 percent respectively of total budgetary expenditure. This raised questions about the sustainability of such spending at a time when budgets deficits in SEM countries reached as high as 8.1 percent of GDP in the case of Egypt (see Figure 6). International organizations like the World Bank and the IMF have called to replace indiscriminate food and energy subsidies with targeted aids for the poor.
Such discussions are not new. The SEM countries expanded food and energy subsidies in the 1970s. In the case of Egypt, a particularly prominent example, the government regulated cotton, wheat, rice, sugarcane, beans, and winter onions via an often paradoxical mix of production taxation and consumer subsidies. In contrast, it protected livestock production by tariffs and bureaucratic import hurdles until 1987. Only fruit and vegetable markets remained free of government interference. This encouraged a shift of acreage into horticulture and fodder production like clover (birsim). In the 1980s the Egyptian state began to dismantle these policies because of fiscal pressures, but also because a widening food gap and declining self-sufficiency gave rise to concerns. In the 1990s, these policy changes were pushed further; by 1995 only cotton and sugarcane
0
5
10
15
20
25
30
35
Egypt Morocco Tunisia Jordan Algeria Israel
%

12
remained under government regulation. On the consumption side the peak of food subsidies was in 1980 when they covered 20 commodities and accounted for 15 percent of government spending. By 1997 this figure had declined to 6 percent. Subsidies now only covered four commodities: coarse “baladi” bread, coarse “baladi” flour, edible oil, and sugar (Richards and Waterbury, 2008; Adams Jr., 2003).
Israel and Turkey are special cases in the SEM countries. Both have reduced consumer subsidies early on, but still retain considerable producer subsidies. Turkey has eliminated generalized fuel and food price subsidies gradually since the 1980s and terminated them in the early 2000s as part of a broader agenda of structural adjustment. In Israel total spending on consumption subsidies today is relatively low at 0.8 percent of GDP and 2.5 percent of the government budget. Such subsidies have been reduced considerably in the 1980s when they were as high as 7.2 percent of budgetary spending in 1981 (Albers and Peeters, 2011).
Turkey used to have a far reaching program of agricultural producer subsidies that entailed price supports, input subsidies, and marketing monopolies. These have been pushed back as well with policies that favored privatization and removal of trade barriers. Turkey is one of the few countries in the MENA that is a significant agricultural exporter and it has a considerable self-sufficiency in cereals, although it is a food net importer in calorie terms overall. It is the world’s largest producer of hazelnuts, apricots, cherries, and poppy seeds; in addition, it is the second largest producer of melons, cucumbers, leeks, and strawberries. Similarly, Morocco and Tunisia are considerable exporters of fruit to the European Union. In Israel producer subsidies have been reduced, but are still extensive. Subsidies and transfer payments constitute 17 percent of gross farmer receipts, below the OECD average of 23 percent, but considerably higher than in the United States, where this figure stands at 10 percent. These subsidies have alimented a doubling of agricultural exports, mainly fruit, vegetables, and processed food, from $1.2 billion in 2003 to $2.4 billion in 2012 (Jerusalem Post, 21 January 2014). General subsidies on basic foods are self-targeting, as poor people buy these items disproportionally more. They are less distorting than subsidies on energy, which disproportionately benefit middle and upper classes as they have a higher ownership ratio of cars and energy using appliances (air conditioning, washing machines etc.). Because of this and because they are much higher, energy subsidies are more likely candidates for further subsidy reforms than food subsidies. The latter also carry great significance for political legitimacy.. Food clearly commands greater emotional appeal and because of their self-targeting nature, abolition of subsidies on staple foods would disproportionately hurt the poor. A move to targeted financial aids is easier said than done, as it requires considerable bureaucratic capacities for monitoring purposes. Financial aids can also be subject to considerable erosion via inflation, as the recent experience of Iran with subsidy reform has shown.
The State of Food Security in SEM Countries Food self-sufficiency is not food security, although the two are often wrongly equated. Hardly any country in the world is not reliant on other countries for at least some food items and about half of the world is a net importer of food (see Figures 8 and 9). Food importing countries like Singapore or Kuwait can be perfectly food secure if they have the foreign exchange to pay for food imports and world food markets are not disrupted by export restrictions or political crises. The lower the share of food imports as a
13
share of total exports and net remittances, the more food secure a country is on a macro level (see Table 2). Yet this does not preclude the existence of food insecurity of vulnerable households on a micro level.
Food security can be measured on different levels: globally, nationally, and locally. Furthermore, different approaches to measurement exist. The categories of the Global
Hunger Index (GHI) (http://www.ifpri.org/ghi/2013) mainly indicate calorie deficiency
(percentage of the undernourished among the general population and prevalence of underweight and mortality among children younger than five). Here the MENA region does not score badly on average.. Yet food security has an important micro-nutritional dimension. One can have enough calories, even too many of them and yet be food insecure. Beside poverty, uninformed dietary choices and increased consumption of sodas and junk food are contributing to a growing intake of calorie rich food.
Lack of micronutrients affects pregnant mothers and children in particular. This can have a lasting impact as such nutritional deficiency in the womb and during the first 1000 days after birth can lead to stunting and affect the cognitive abilities and educational achievements of children for the rest of their lives. If poor people cannot afford a balanced and varied diet and have to resort to basic calorie rich food either permanently or as a temporary stop gap solution in case of sudden price spikes this can have severe long-term developmental effects. Hence, the costs of food price volatility and inflation are only insufficiently measured by their short-term impact on financial indicators.
To address these shortcomings, the Beyond the Arab Awakening report by the International Food Policy Research Institute (IFPRI) in Washington uses stunting (insufficient height for age) as an indicator for food insecurity on the micro-level as it captures micro-nutritional shortcomings and other important development aspects like clean drinking water and access to health care better than the GHI (Breisinger et al., 2012). The findings of the report are less positive for SEM countries. While only 5 to 15 percent of the children under five in the Arab world are underweight, between 15 and 25 percent of them are too short for their age (Woertz, 2013b).

14
Table 2: Status of Food Security in SEM Countries
Macro FS: Food imports/ (total exports + net
remittances) (%)
Micro FS: Prevalence of
child stunting (%)
Overall FS risk
Morocco 8.2 21.6 Serious
Algeria 7.3 15.6 Serious
Tunisia 6.5 9 Moderate
Libya 3.4 21 Moderate
Egypt 8.7 30.7 Serious
Palestine 31.9 11.8 Serious
Jordan 13.9 8.3 Serious
Lebanon 16.5 15 Serious
Turkey 2 13.9 Moderate
Source: (Breisinger et al., 2012)
On a macro level many SEM countries face challenges as they spend more than 5 percent of their export earnings and net remittances on food imports. Only Libya and Turkey spend less. For Jordan and Lebanon the ratio is above 10 percent, yet Jordan has managed to achieve the best level of food security on a micro level among SEM countries despite these constraints on a macro level. l. Palestine face the worst food security situation on a macro level, as 31.9 percent of their export earnings and remittances are spent on food imports, but they are relatively food secure on a micro level compared to other SEM countries.
It is mainly micro-nutritional deficiencies and high occurrences of stunting that lead to the classification of the SEM’s countries’ food security risk as “serious”. Only Turkey, Tunisia, and Libya have a “moderate” risk. Israel was part of the IFPRI report, but as an OECD country with a high per capita income its risk is presumably low, as was the case for the oil rich countries in the Gulf in the study. The only MENA country with an “alarming” food security risk was Mauritania.
The State of Agriculture in SEM Countries If food security in the SEM countries should not be confounded with self-sufficiency and depends to a large extent on broader economic development and food imports, it does not mean that domestic agriculture does not play a role. It provides a significant part of food consumption and livelihoods to a still substantial part of the population, even though its contribution to value added per GDP lags behind and its water consumption is unsustainable in many cases (Babar and Mirgani, 2014).
15
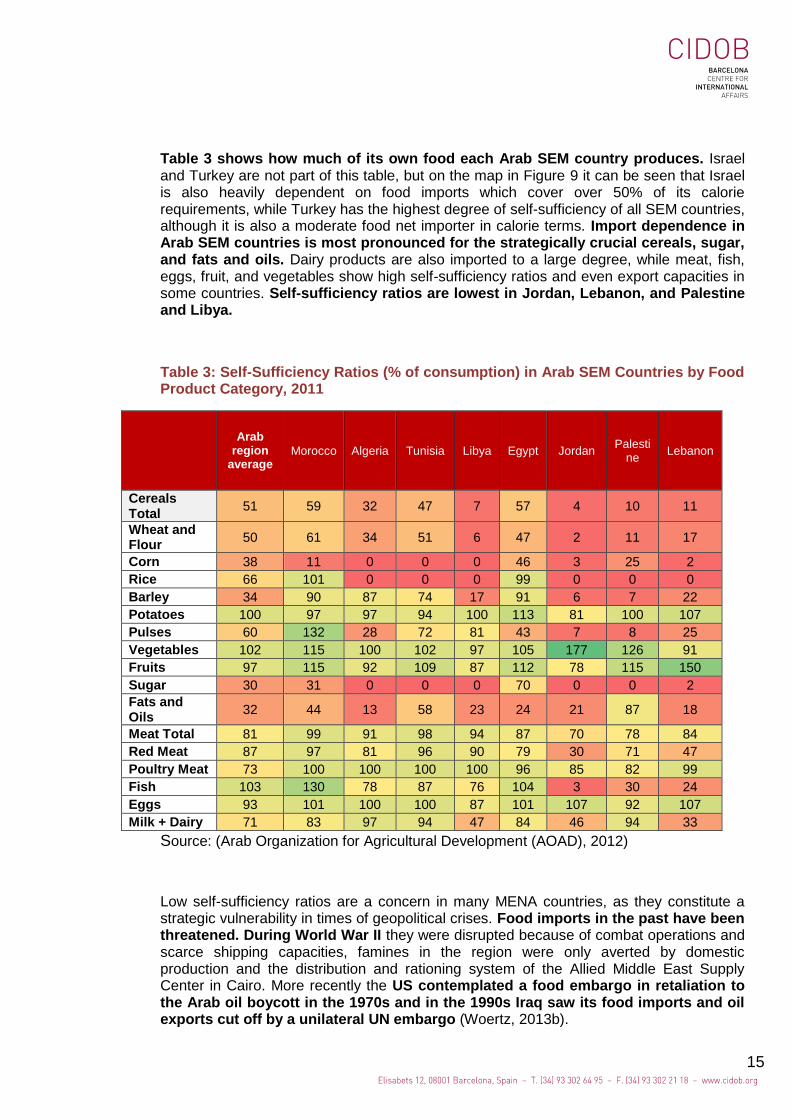
Table 3 shows how much of its own food each Arab SEM country produces. Israel and Turkey are not part of this table, but on the map in Figure 9 it can be seen that Israel is also heavily dependent on food imports which cover over 50% of its calorie requirements, while Turkey has the highest degree of self-sufficiency of all SEM countries, although it is also a moderate food net importer in calorie terms. Import dependence in Arab SEM countries is most pronounced for the strategically crucial cereals, sugar, and fats and oils. Dairy products are also imported to a large degree, while meat, fish, eggs, fruit, and vegetables show high self-sufficiency ratios and even export capacities in some countries. Self-sufficiency ratios are lowest in Jordan, Lebanon, and Palestine and Libya.
Table 3: Self-Sufficiency Ratios (% of consumption) in Arab SEM Countries by Food Product Category, 2011
Arab
region average
Morocco Algeria Tunisia Libya Egypt Jordan Palesti
ne Lebanon
Cereals Total
51 59 32 47 7 57 4 10 11
Wheat and Flour
50 61 34 51 6 47 2 11 17
Corn 38 11 0 0 0 46 3 25 2
Rice 66 101 0 0 0 99 0 0 0
Barley 34 90 87 74 17 91 6 7 22
Potatoes 100 97 97 94 100 113 81 100 107
Pulses 60 132 28 72 81 43 7 8 25
Vegetables 102 115 100 102 97 105 177 126 91
Fruits 97 115 92 109 87 112 78 115 150
Sugar 30 31 0 0 0 70 0 0 2
Fats and Oils
32 44 13 58 23 24 21 87 18
Meat Total 81 99 91 98 94 87 70 78 84
Red Meat 87 97 81 96 90 79 30 71 47
Poultry Meat 73 100 100 100 100 96 85 82 99
Fish 103 130 78 87 76 104 3 30 24
Eggs 93 101 100 100 87 101 107 92 107
Milk + Dairy 71 83 97 94 47 84 46 94 33
Source: (Arab Organization for Agricultural Development (AOAD), 2012)
Low self-sufficiency ratios are a concern in many MENA countries, as they constitute a strategic vulnerability in times of geopolitical crises. Food imports in the past have been threatened. During World War II they were disrupted because of combat operations and scarce shipping capacities, famines in the region were only averted by domestic production and the distribution and rationing system of the Allied Middle East Supply Center in Cairo. More recently the US contemplated a food embargo in retaliation to the Arab oil boycott in the 1970s and in the 1990s Iraq saw its food imports and oil exports cut off by a unilateral UN embargo (Woertz, 2013b).

16
Such strategic concerns have partly motivated programs to increase domestic self-sufficiency.. However, they are ecologically and economically questionable, because of their reliance on limited water resources and costly subsidies.
This situation is unlikely to improve. Arable land and especially water resources are scarce in the SEM countries and form an impediment to any expansion of agriculture. In some countries agricultural production actually has to be reduced in order to assure water security (Alterman and Dziuban, 2010). Agricultural productivity gains could be achieved in some cases, but countries like Egypt already have some of the highest wheat productivity rates in the world. In these cases there are no meaningful yield gaps that could be closed (Fischer et al., 2005). Rather than increasing agricultural production, the focus would need to be on more efficient water management to stabilize it. Other measures for a more sustainable agriculture in SEM countries include improved extension services, fighting of desertification, climate change adaptation, better distribution networks, waste reduction along the value chain, broader rural development programs, and new approaches to the governance of collective range land (International Centre for Advanced Agronomic Studies (CIHEAM), 2008; International Centre for Advanced Agronomic Studies (CIHEAM), 2009) and 2009).
Climate change will likely exacerbate existing scarcities of water. Considerable uncertainty exists about climate change models and predictions. Yet there is consensus that the MENA region will be disproportionately affected by higher and more variable temperatures and increasing variability of rainfalls (Intergovernmental Panel on Climate Change (IPCC), 2013; Müller et al., 2011; Cline, 2007; FAO, 2008; Gornall et al., 2010). Oceans function as a carbon sink and as increased carbon dioxide in the air can also have positive effects on agricultural productivity via the carbon fertilization effect, the worst effects of climate are only expected to materialize after 2050. Yet first changes are already visible in the climate of the Eastern Mediterranean that has witnessed an increased occurrence of drought (National Oceanic and Atmospheric Administration (NOAA), 2011; Breisinger et al., 2011b). This calls for adaptation measures of SEM countries and their increased participation in global mitigation efforts (Luomi, 2012).

17
Figure 7: Share of Agriculture (%): Rural Population, Labor Force, Value Added
Note: Data on Agriculture Value Added refers to different years: Data Libya (2008), Palestine (2011), Morocco, Algeria and Israel (2012), Egypt, Tunisia, Turkey, Jordan and Lebanon (2013).
Produced by CIDOB. Source: FAOSTAT Country Profiles: http://faostat.fao.org/site/666/default.aspx and World Bank Indicators: http://data.worldbank.org/indicator/NV.AGR.TOTL.ZS/countries?display=default, United Nations Indicators: https://data.un.org/ (accessed 30 September 2014)
Agriculture is by far the largest water consumer in the region. However, agriculture’s contribution to economic prosperity is limited. In most countries its value added as percentage of GDP is in single digit territory. In Israel it is as low as 2 percent. Some countries like Egypt, and Morocco have a large share of rural population of 42-56% of the total, but agriculture’s contribution to employment creation and value added is more limited as Figure 7 shows. This points to low productivity and hidden unemployment in the countryside. In a substantially urbanized country like Turkey for example 30 percent of the labor force still works in agriculture, but generates only 8.5 percent of the value added.
In sum, agricultural production in the SEM countries cannot be substantially increased due to natural constraints. At best it can be stabilized at currently achieved levels with improved water management. Reliance on food imports is here to stay and will likely increase with population growth. This raises the question of reliability of global markets to supply such food imports.
Palestine

18
Global Import Vulnerabilities and Export Capacities SEM countries constitute a major part of the MENA region, which is the largest food importer globally. With 92 million tons the MENA’s net imports of cereals are higher than the 66 million tons of East Asia, which has a much larger population. The most important net exporter countries that provide such food trade are North America, and the former Soviet Union States, followed by Oceania/ Australia, Europe, South Asia, and South America (see Figure 8).
Figure 8: Global Net Trade in Cereals, 2013/14
Produced by CIDOB. Source: (USDA, 2014)
These food imports constitute a substantial part of the dietary intake in SEM countries. Figure 9 shows the role of food net trade in the total food consumption of a country by calories. In heavily food import dependent countries of the Group 1 in the legend of the map, to which also belong most SEM countries, this ratio stands at over 50 percent. More than half of their calorie intake is satisfied by food imports. Group 2 is slightly better off with 25-50 percent. Group 3 is between 25 percent reliance on food net trade and self-sufficiency. The net exporters of food start with Group 4, which comprises mainly the former Soviet Union countries, Vietnam, and Myanmar. They fall between self-sufficiency and 25 percent net exports. In Group 5 this value goes up to 50 percent and in Group 6 beyond 50 percent (see Figure 9).
-120
-100
-80
-60
-40
-20
0
20
40
60
80
100
No
rth
Am
eric
a
Form
er S
ovi
et U
nio
n -
12
Oce
ania
Euro
pea
n U
nio
n -
28
Sou
th A
sia
Sou
th A
mer
ica
Oth
er E
uro
pe
MEN
A
East
Asi
a
Sub
-Sah
aran
Afr
ica
Sou
thea
st A
sia
Car
ibb
ean
Cen
tral
Am
eric
a
Mill
ion
me
tric
to
nn
es

19
Figure 9: Role of Food Net Trade in Food Consumption, 2008
Source:http://knoema.com/atlas/topics/Food-Security/Role-of-Trade/Role-in-food-consumption-of-food-net-trade based on FAO Food Security Data, June 2012
Figure 9 gives also an indication of export capacity. Some of the exporter countries like Iceland or Latvia have a high ratio of net exports to food consumption, but not a high production in absolute terms. Hence the group of strategically important net exporters narrows down to a few countries, namely Canada, USA, Brazil, Argentina, France, Ukraine, Kazakhstan, Russia, Thailand, Vietnam, Australia, and New Zealand. The net exporter status of Indonesia and Malaysia goes back to their palm oil production, which is also used for cosmetics and biofuel production. A statistical differentiation with food production might be difficult to achieve at times.
All this cereal trade constitutes “virtual water” that can be imported by SEM countries via food trade (Allan, 2001; Allan, 2011). Virtual water describes the water that was needed to produce a particular commodity. Agriculture is by far the largest “blue” water consumer worldwide. Globally it represents 70 percent of water use, in the SEM countries even more, around 80 percent. As water in agriculture evaporates and cannot be reused or recycled its global share is even 90 percent if consumptive water use is considered. What is more important, about 70 percent of global crops are not produced by irrigation agriculture that uses such blue water, but by rain fed agriculture that uses green water that is encapsulated in the soil. Such green or soil water cannot be metered, bottled, or shipped by pipeline. It does not figure in the global statistics about total renewable water reserves, which only comprise surface and groundwater. Yet green water is extremely important for global food security and for

20
the import needs of SEM countries. By importing rain fed cereals from Brazil, Canada, or Australia they effectively import the rainfalls from there and can benefit from them.
Between 70 and 90 percent of the global trade in staple food commodities is undertaken by a few food trading houses, mainly the ‘ABCDs’: ADM, Bunge, Cargill, and Dreyfus plus Glencore as a fifth company (Sojamo et al., 2012). The trade in crops and derived products constitutes 76 percent of global virtual water trade and 68 percent of this total comes from green water. Blue and grey (waste) water only contribute 13 percent and 19 percent respectively (Mekonnen and Hoekstra, 2011). Currently global virtual water net exports focus on North America (40 percent), Australia and New Zealand (40 percent), and South America (20 percent). Given available water reserves, the share of Australia will likely decrease while that of Brazil is expected to increase (Allan, 2011).
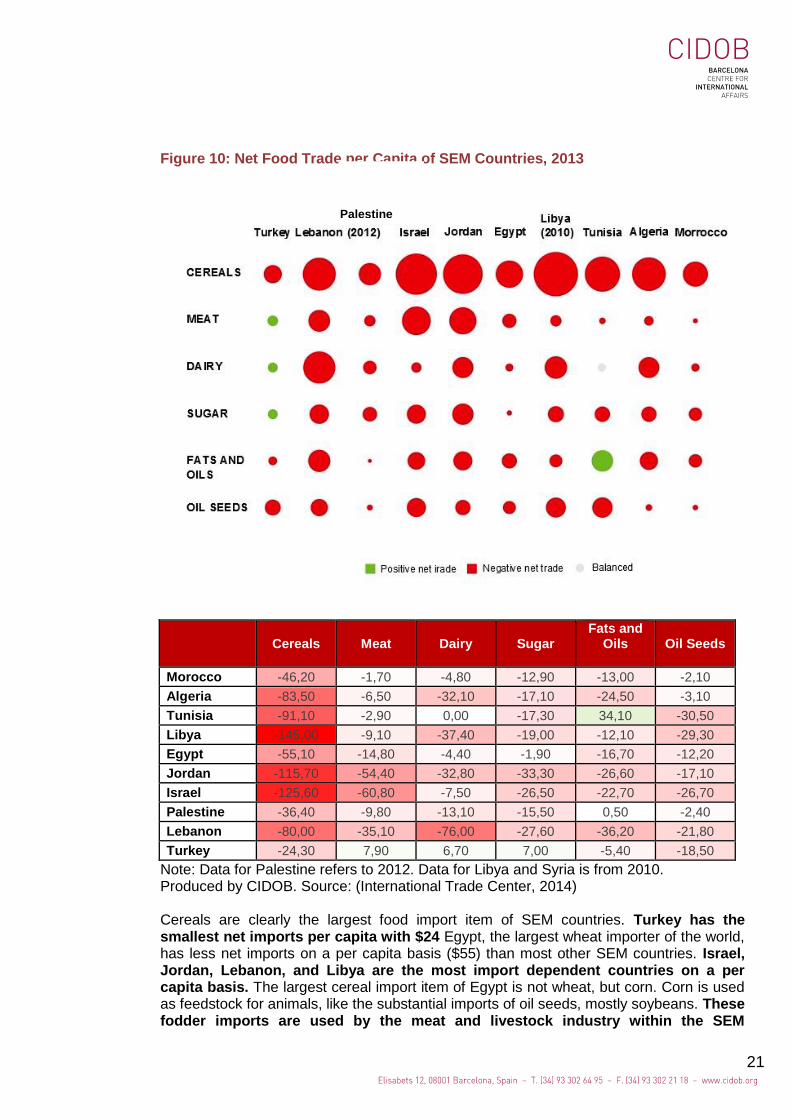
Individual Food Import Dependence of SEM Countries by Trading Partners If the food import dependence is broken down on a per capita and country level, some interesting observations can be made. All SEM countries are net importers of basic food items. Only in the case of Tunisia, Turkey, and Egypt, there have been some exceptions. Tunisia is a net exporter of fats and oils, mainly from olives. Turkey has the most varied agricultural sector of all SEM countries. Beside its rich exports of fruit and nuts, it is a net exporter of meat, dairy, and sugar products. Egypt is a net importer of cereals overall, but a net exporter of rice.
21
Figure 10: Net Food Trade per Capita of SEM Countries, 2013
Cereals Meat Dairy Sugar
Fats and Oils
Oil Seeds
Morocco -46,20 -1,70 -4,80 -12,90 -13,00 -2,10
Algeria -83,50 -6,50 -32,10 -17,10 -24,50 -3,10
Tunisia -91,10 -2,90 0,00 -17,30 34,10 -30,50
Libya -145,00 -9,10 -37,40 -19,00 -12,10 -29,30
Egypt -55,10 -14,80 -4,40 -1,90 -16,70 -12,20
Jordan -115,70 -54,40 -32,80 -33,30 -26,60 -17,10
Israel -125,60 -60,80 -7,50 -26,50 -22,70 -26,70
Palestine -36,40 -9,80 -13,10 -15,50 0,50 -2,40
Lebanon -80,00 -35,10 -76,00 -27,60 -36,20 -21,80
Turkey -24,30 7,90 6,70 7,00 -5,40 -18,50
Note: Data for Palestine refers to 2012. Data for Libya and Syria is from 2010. Produced by CIDOB. Source: (International Trade Center, 2014) Cereals are clearly the largest food import item of SEM countries. Turkey has the smallest net imports per capita with $24 Egypt, the largest wheat importer of the world, has less net imports on a per capita basis ($55) than most other SEM countries. Israel, Jordan, Lebanon, and Libya are the most import dependent countries on a per capita basis. The largest cereal import item of Egypt is not wheat, but corn. Corn is used as feedstock for animals, like the substantial imports of oil seeds, mostly soybeans. These fodder imports are used by the meat and livestock industry within the SEM
Palestine

22
countries, which caters to increasingly varied diets, alongside considerable imports of meat and dairy products in many countries, especially in Lebanon, Jordan, Israel, Algeria, and Libya.
Food imports of the SEM countries come from a varied set of countries depending on the food item. Cereals are clearly the most important import item as Figure 11 shows, not only in terms of calories, but also in terms of monetary value, particularly wheat, followed by corn, barley, and rice. After cereals, SEM countries need to mobilize the most foreign exchange for imports of fats and oils and oil seeds, followed by dairy products, meat, and sugar.
Figure 11: Net Imports of Major Food Items, SEM Countries, 2013
Source: (International Trade Center, 2014)
Figure 12 shows the net trade flows of the top 5 exporters to SEM countries for major food items. Ukraine, France, Russia, Argentina, and Brazil dominate as cereals suppliers, followed by Romania, the United States, Canada, Bulgaria, Germany, and Australia. The largest suppliers for wheat are France, Russia, Canada, Ukraine, and the USA; for rice the USA, India, Egypt, Vietnam, and Thailand; for barley France, Ukraine, Argentina, Russia, and Germany; and for corn Argentina, Ukraine, Brazil, Russia, and Romania.
Figure 12: Top 5 Exporters of Major Food Items to SEM Countries, 2013

23
Produced by CIDOB. Source: (International Trade Center, 2014)

24
Figure 13: Top 5 Exporters of Individual Cereals to SEM Countries, 2013
Produced by CIDOB. Source: (International Trade Center, 2014)

25
The largest suppliers of dairy products are New Zealand, the USA, France, the Netherlands, and Argentina. Brazil is a major supplier of meat, followed by India, the USA, Australia, and Argentina. Brazil accounts for about 20 percent of global sugar production and more than a third of global exports. It is the dominating supplier of sugar to SEM countries by far. Others like the UK, Guatemala, France, and Thailand only play a minor role in comparison. Globally Brazil has also developed into a major exporter of soybeans, but it does not play a prominent role in the oil seeds imports of SEM countries. Here the USA, Argentina, Ukraine, Uruguay, and Paraguay dominate. Indonesia and Malaysia are the first and fourth most important suppliers in the category of fats and oils as they are the world’s largest producers of palm oil. Russia and Ukraine export mainly sunflower oil and Argentina is the fifth largest exporter, mainly oil from soybeans.
The Top 5 suppliers mostly account for 52-67 percent of total imports. In the case of meat it is 81 percent. Individual cereals also have high concentration rates of above 70 percent and even 94 percent in the case of corn. Wheat and corn are the largest cereal imports in value terms; rice and barley play a minor role in comparison (see Figure 13).
Policy Measures to Address Food Price and Volatility Issues As large food net importers SEM countries are highly dependent on global food markets, but their abilities to influence them are limited. They are price takers. In the wake of the global food crisis in 2007/08 and the renewed price spikes in 2011, which happened against the backdrop of the Arab Spring uprisings their policy reactions have focused on the domestic realm and the cushioning of the impact of global food price inflation on domestic price levels. Increases of existing untargeted subsidy schemes were clearly the most popular stop-gap policy measure as Table 4 shows. It was followed by reduction of import tariffs and increase of public sector salaries. Targeted transfers and increases of other social transfers that require more advanced bureaucratic frameworks and capacities were less widespread. The same is true for the reduction of taxes to increase disposable income.
Jordan was the most proactive followed by Egypt, and Algeria, while Morocco and Lebanon followed a more liberal stance. Most countries undertook this fiscal expansion in a situation of considerable budget deficits, only in Tunisia and Algeria they were below 3 percent compared to GDP.
The choice of policy measures by SEM countries is problematic. Energy subsidies are primarily benefitting middle and upper classes with a high ownership ratio of cars, appliances, and energy intensive industries. Public sector employees are only a part of the overall population and usually not the poorest one, so this measure must be seen critical as well. Tariff reductions are also less effective in protecting the poor than targeted measures and often constitute a vital source of income for the state. Turkey for example reduced import taxes on wheat from 130 percent to 8 percent and those for barley to zero from 100 percent. Subsidies on basic foodstuffs are self-targeting, as poor spend a relatively high share of their incomes, yet other targeted programs like school meals, public work projects, educational support, and conditional cash transfers are more efficient and preferred by the IMF and others (Harrigan, 2014).

26
Table 4: Reactions of SEM Governments to the Global Food Crisis 2007-08 (A) and the Arab Spring Uprisings 2011 (B)
Reductions of Import
Tariffs
Increase of energy and
food subsidies
Reduc-tion of taxes
Increase of public sector
salaries
Increase of
targeted transfers
to the poor
Increase of other social
transfers
Number of policy
mea- sures
Budget balance as % of GDP, 2010
Morocco A AB --- --- --- --- 3 -4,2
Algeria B AB B B --- B 6 -2,7
Tunisia A AB --- --- B B 5 -1,2
Libya B B B B --- B 5 9,2
Egypt AB AB --- A A --- 6 -8,1
Jordan A AB B AB AB A 9 -5,4
Lebanon A A --- A --- --- 3 -7,2
Number of policy mea-sures
10 13 5 8 5 4
Source: (Breisinger et al., 2011a)
The oil rich Gulf countries increased strategic storage of staple crops and announced agricultural land acquisition abroad, only few of which they actually implemented, mostly in developed agro markets like Argentina or Australia (Woertz, 2013b). Such costly policy measures were not necessarily an option for the poorer SEM countries, even though some increase in storage would be advisable (see Figure 3). Egypt announced a program to achieve wheat self-sufficiency from a current coverage ratio of 60 per cent in 2011. Yet it has not led to significant production increases thus far and must be regarded as questionable given the country’s limited resources of water and arable land.
An important cornerstone of a food security strategy of SEM countries could be a more proactive engagement with the global food system. This could include the pooling of interests of net food importing countries in the region and elsewhere and reducing the high transactions costs of intra-regional food trade (Konandreas, 2012). Such collaboration is not without precedent. The Net Food Importing Developing Countries (NFIDC) formed an interest group within the GATT during the trade liberalization process of the Uruguay round. NIFDC had been beneficiaries of subsidized food exports by the US and the EU and were afraid that reduction of such subsidies could lead to more expensive food imports for them. There is good justification for the reduction of such export subsidies as they have disadvantaged farmers in the developing world. They have been in fact reduced over the past decade as has been seen above. Yet it would be conceivable that food importing countries of the SEM and elsewhere cooperated internationally on the issue of food market transparency and avoidance of food export restrictions.
The World Trade Organization (WTO) has historically been focused on trade liberalization, and the reduction of import barriers. Food export restrictions on the other hand are allowed under current WTO rules if countries justify them with domestic food security considerations. This has concerned food net importers globally, especially in the MENA

27
and Asia (Bazoobandi, 2014). There is an ongoing debate whether such restrictions should be disciplined under the WTO rules. Japan and Switzerland have put forward corresponding proposals that were backed by food importers in the MENA, like the Gulf countries (Woertz, 2013a; Sharma, 2011). Global initiatives to make food markets more transparent and efficient like the Agricultural Market Information System (AMIS) of the G20 are also in the vital interest of food importers like the SEM countries.
Beside domestic measures to cushion the impact of global food inflation and participation in international initiatives to make global food markets more reliable and transparent, inclusive economic development that keeps food affordable and accessible to the SEM countries’ citizens is arguably the most important long-term measure to ensure food security. SEM countries could have fared better in this regard. With the exception of Israel and Turkey their manufacturing base is small. Lack of access to European markets has further stymied its development. Innovation is hampered and barriers to entry are high. It is difficult for small and medium sized enterprises (SMEs) to obtain finance. Financing in the MENA is dominated by bank lending (62 percent), followed by stock markets (29 percent). Bond markets are underdeveloped (7 percent) (IMF, 2014). Bank financing leans heavily towards large enterprises that are either owned by influential business families or the state. SMEs that lack the necessary connections face difficult access to funding (World Bank, 2006).
Rent seeking and reliance on direct or indirect resource rents via remittances are widespread. Resource allocation has also been fraught by cronyism. Inequalities have increased globally over recent decades, harming social equitability and growth perspectives (Piketty, 2014). SEM countries are no exceptions to this trend. Ordinary households have not participated sufficiently in economic development.
The World Bank called Egypt the world’s leading reformer in its Ease of Doing Business Index (EDBI) in 2008 and in 2010 the country had been among the top ten reformers of the EDBI for four years in a row ((Springborg, 2012) Yet appealing real GDP growth rates of 5-7 per cent did not trickle down to the general population. The simple averages of GDP per capita figures are misleading as benefits only accrued to a minority. Real incomes declined for most Egyptian households over the 2000s.
Possible Impacts of Geopolitical Events on Food Security: Wars, Transport Routes and the Ukraine Crisis Oil became a strategic commodity when the British navy switched from coal to oil as fuel of choice on the eve of World War I. Winston Churchill, then First Lord of the Admiralty, identified two cornerstones of energy security that are vital to this day: Diversity of supplies and security of transport routes. In many ways the same applies to the food security of food importers in the MENA and the SEM countries in particular. Concerns about a possible closure of the Strait of Hormuz for example do not pertain to oil exports only, but also to food imports. The United Arab Emirates regards its port of Fujairah that is outside the Strait of Hormuz as a critical supply line in such an eventuality, as unlikely as it might be.
Such risks of supply disruptions have not materialized thus far, despite the continuously simmering crisis, but the Ukraine crisis is worth a closer look to ponder scenarios and how any future supply disruptions might affect global markets and the SEM countries in

28
particular. Russia and Ukraine are importers of fruit, vegetables, meat and dairy products, but they have become major grain exporter again, like in the 19th and early 20th century. At the turn of the millennium, Russia’s and Ukraine’s global wheat market share was still below one percent. In 2014/15 it is expected to be around 14 percent for Russia and 6 percent for the Ukraine (see Figure 14). Some expect Russia to become the largest wheat exporter worldwide by 2019 (Pall et al., 2011). However, these estimates are fraught with uncertainty as rain fed harvests have shown strong yearly variations and Russia’s agricultural sector grapples with inefficiencies and poor governance. This also can be seen in the erratic changes in exports over the years. Russia has begun to give strategic subsidies to its agricultural sector and reduce its tax load. To this end the Russian Government launched the State Program for Development of Agriculture and Regulation of Agricultural Commodities Markets for the period of 2013-2020 (Vassilieva, 2012b). Ukraine has developed into a major corn exporter with a global market share of around 15 percent, by far surpassing Russia in this item. In most years Ukraine has also been a larger barley exporter than Russia. Both countries’ market share hovers between a quarter and a third of global barley exports, at the time of the global food crisis of 2008 their share even shot up to half of global barley exports (see Figure 14)
Figure 14: Global Market Shares of Russia and Ukraine in Wheat, Barley and Corn, 2000/01-2014/15
0
5
10
15
20
25
30
35
20
00/2
00
1
20
01/2
00
2
20
02/2
00
3
20
03/2
00
4
20
04/2
00
5
20
05/2
00
6
20
06/2
00
7
20
07/2
00
8
20
08/2
00
9
20
09/2
01
0
20
10/2
01
1
20
11/2
01
2
20
12/2
01
3
20
13/2
01
4
20
14/2
01
5
%
Wheat
Russia
Ukraine

29
Source: (USDA, 2014)
In the past the Russian government has sought cooperation with neighbors Ukraine and Kazakhstan on grain marketing, which caused concerns about cartel like price fixing. On the other hand Russia has offered Egypt and Algeria subsidized wheat below world market prices (Pall et al., 2011).. Through the Russian presidential decree, No. 290 of March 20, 2009, the United Grain Company (UGC) was established to strategically handle food trade logistics. UGC has since acted as the intermediate agent between the state’s interests in both domestic and international agricultural relations (Vassilieva, 2012a). In 2010, President Medvedev decided that UGC would have to be partly privatized by 2012 in order to inject more capital. Despite widespread Western interest in purchasing shares of the company, the investment group Summa owned by the business tycoon Ziyavudin Magomedov acquired 51 per cent of the shares of UCG to take over the company. As a
0
5
10
15
20
25
30
35
20
00/2
00
1
20
01/2
00
2
20
02/2
00
3
20
03/2
00
4
20
04/2
00
5
20
05/2
00
6
20
06/2
00
7
20
07/2
00
8
20
08/2
00
9
20
09/2
01
0
20
10/2
01
1
20
11/2
01
2
20
12/2
01
3
20
13/2
01
4
20
14/2
01
5
%
Barley
Russia
Ukraine
0
5
10
15
20
25
30
35
20
00/2
00
1
20
01/2
00
2
20
02/2
00
3
20
03/2
00
4
20
04/2
00
5
20
05/2
00
6
20
06/2
00
7
20
07/2
00
8
20
08/2
00
9
20
09/2
01
0
20
10/2
01
1
20
11/2
01
2
20
12/2
01
3
20
13/2
01
4
20
14/2
01
5
%
Corn
Russia
Ukraine

30
strategic objective, UCG has formed joint ventures with East Asian companies to increase its market shares in East Asia, namely with China, Taiwan and Japan.
Given the importance of Russia and the Ukraine for global wheat, barley and corn markets, supply disruptions would affect world markets considerably. The SEM countries are located relatively close to Black Sea ports and have become major customers of both countries. Ukraine is the more important supplier of barley and corn to SEM countries, while Russia is dominating in wheat as Table 5 shows. Wheat is the most important cereal by trading volume, followed by corn. Barley’s importance is minor in comparison.
Wheat markets are fairly liquid and suppliers can change from one year to another. In the 2000s Russia dethroned the US as main wheat supplier of Egypt, only in recent years the US has reclaimed that position. The Russian share in Egyptian wheat imports was reduced in 2013 at 12.3 percent. In 2013 major supply concentrations existed for barley in Egypt, Israel, Lebanon, and Libya. The combined share of Russia and Ukraine hovered well above 50 percent in these countries and reached over 80 percent in Israel and Lebanon. Supply concentrations for corn existed for virtually every country except for Algeria, Jordan and Morocco because of Ukraine’s dominating position. In wheat the picture was only slightly more balanced. The combined share of Russia and Ukraine was between 36 and 49 percent for most countries. In the case of Turkey it stood at 73 percent. Only Algeria, Egypt, Morocco had shares of 0.3 percent, 12.3 percent and 10 percent respectively.
Table 5: Grain Exports of Russia and Ukraine to SEM Countries, 2013
RUSSIA Barley % Corn % Wheat %
Algeria 0 0 2,426 0.3 0 0
Egypt 6,817 66.6 0 0 88,985 12.3
Israel 44,993 49.7 6,739 1.8 137,8 30.8
Jordan 3,186 1.4 8,187 4.4 21,874 10.1
Lebanon 4,371 66.1 11,126 10 50,639 26.6
Libya 43,128 24.4 21,129 13.1 101,527 20.2
Morocco 0 0 0 0 4,074 0.6
Tunisia 7,381 3.1 1,038 0.4 29,813 9.9
Turkey 9,71 11.3 248,276 54.3 728,82 68.7
UKRANE Barley % Corn % Wheat %
Algeria 6,41 4.2 13,087 1.5 1,134 0.3
Egypt 0 0 723,081 36.5 0 0
Israel 28,893 31.9 244,645 64.6 80,222 17.9
Jordan 32,105 14.1 11,623 6.2 60,033 27.8
Lebanon 1,485 22.5 44,121 39.7 31,702 16.7
Libya 63,128 35.6 72,379 44.8 80,259 16
Morocco 0 0 5,579 1.2 65,114 9.4
Tunisia 14,416 6 47,747 20.4 78,278 26.1
Turkey 6,995 8.2 148,215 32.4 43,953 4.1
Source: (International Trade Center, 2014)

31
So far the Ukraine crisis did not have a meaningful impact on grain supplies to global markets. Ukraine’s thirteen ports on the Black Sea and the five Crimean ports that are now controlled by Russia have continued to operate without major disruption. As far as markets have anticipated risks, it was rather for commodities that are traded by Ukraine like corn and wheat, not for commodities that are only exported by Russia like natural gas and oil. Apart from possible impacts of secessionist movements and military action, access of farmers and traders to credit was an issue of concern.
If there was any disruption, the impact on various countries would be influenced by a) the duration of the conflict and the duration of its impact on prices, b) the grain inventories of countries, c) their net-trade status (net importers in the case of SEM countries) and d) the relative importance of wheat, corn and barley in local diets (Villalobos A., 2014). As wheat plays a prominent role in SEM countries’ diets and their livestock industries use corn as feedstock, there would be a measurable impact on SEM countries and they would need to source alternative suppliers.
As much as geopolitical crises like the one in Ukraine tend to occupy policy makers they need to be seen in perspective. Often they are short lived and have only a temporary impact on food prices as alternative supplies and trade routes are found or the respective crises abate. Compared with the socio-economic issues that have been identified in the preceding chapters they geopolitical crises are not the major food security challenge.
A more serious food security threat for the SEM countries could emanate in the form of droughts, climate change, and overexploitation of water resources in major producing region like Australia or the Mid-West of the US. They can have an impact on global supplies and prices and need to worry food importers. Oil exporters of the MENA have publicly questioned the scientific evidence of manmade climate change because they have worried about the marketing possibilities of their most important export good (Oreskes and Conway, 2010). As food importers they may want to think twice and engage more sympathetically and proactively with the global debate on climate change mitigation and adaptation. This is particularly true for those SEM countries that are not oil producers or have turned into net-importers at the end of the 2000s. They will have all the disadvantages of climate change without benefitting from oil net export revenues.
Conclusions and policy-recommendations for the UfM SEM countries have been affected by global food price spikes in 2007/08 and 2011. The impact was mitigated by subsidies that increased the fiscal burden of the respective governments, but there has been pass through food inflation that contributed to an increase in poverty. Despite price corrections after 2011, food prices are expected to stay on structurally higher levels than in the preceding two decades. SEM countries need to plan with such a scenario. Their main food security challenge relates to micronutritional deficiencies like vitamins and iron, not calorie deficiencies. This has severe implications for long-term development as undernutrition in the womb and during the first 1000 days after birth irreversibly affects cognitive abilities of a child and its future educational achievements.

32
Accessibility of a varied nutritious diet for all children at all times is a developmental imperative. It is best achieved by targeted subsidies and pro poor inclusive growth policies. Indiscriminate fuel and food subsidies are less suitable policy measures in this context. Similarly, the liberalized crony capitalism of the 2000s did lead to appealing macro growth rates, but it did not trickle down to the general population.
Increased self-sufficiency in staple crops like wheat is regarded as a strategic objective by some SEM countries like Egypt. Yet, complete self-sufficiency is unattainable because of lack of water and arable land and it should not be confounded with food security, which is access to a varied affordable diet, no matter whether it is produced domestically or abroad. Geopolitical crises can affect supplies and prices of food, but usually such effects are temporary and much less important for food security than socio-economic issues. Against this backdrop inclusive pro poor growth policies are the single most important factor for food security in SEM countries.
Food security has been neglected as an area for cooperation in Euro-Mediterranean relations. Platforms such as the Union for the Mediterranean could play a significant role in filling this gap in close coordination with national governments and coordination with international organizations such as the FAO. As this report points out, food security is a challenge for most SEM countries and it is directly related to other factors which are, indeed, part of the Euro-Mediterranean agenda (environment, transport, research and technology, social inclusion, budget support, etc.). Moreover, this report illustrates the importance of food trade between European and Southern and Eastern Mediterranean countries. Thus, a platform such as the UfM that brings together countries from both rims of the Mediterranean could be a useful instrument to launch specific projects and initiatives that aim at improving food security conditions. Such projects should be guided by five overarching principles:
1. Creating awareness of the importance of food security as a major challenge for Mediterranean societies
2. Anticipation of future crises via better mechanisms to monitor vulnerability and risk and instruments that make those countries resilient to crises or major structural trends (such as global warming or desertification)
3. A comprehensive approach that takes into account the linkages between food security and other areas such as social policies and environment
4. A tailor-made response to the specific needs of each of the UfM members, which explores complementarities among them in a scheme of flexible geometry
5. A global perspective on the food security challenge which can be translated into a systematic cooperation with international organizations such as the FAO and specific initiatives that strengthen cooperation between UfM and its members with other regional organizations and major global actors on an individual country level such as Brazil and food-producing sub-Saharan countries.
In light of the UfM’s consolidated priority-areas (Business Development; Transport & Urban Development; Energy; Environment & Water; Higher Education & Research; and Social & Civil Affairs), of the five principles above enumerated, we have identified seven specific domains where UfM’s projects could make a positive contribution.
1. Storage capacity: As said in this report, the impact of geopolitical crises on food supplies tends to be short-lived, although they represent a low probability/ high impact scenario. Building adequate storage-capacities, particularly for food staples like cereals, oils and dry milk is an intelligent measure that provides lead time to source alternative suppliers in the case of a crisis. If used as buffer stocks, storage

33
capacities could also help to moderate the impact of international food price volatility on domestic price levels. To avoid hoarding and unnecessarily high levels of storage that can be very costly, international and regional coordination of such storage should be considered. Increased storage-capacity can help SEM countries mitigate future economic and social effects of food price crises.
2. Food-waste: A significant amount of the food that SEM countries produce or import is wasted along the supply chain. Some of it rots on fields or in inadequate storage facilities and cooling chains. Thus it will never reach the consumer’s table. Overhauling supply chain networks is not only an environment friendly policy but can also reduce imports and save part of the budget devoted to food-subsidies.
3. Water efficiency: Water-scarcity is a major problem in SEM countries, which risks becoming an even larger one due to global warming, desertification processes and population growth. Thus, agriculture in most of SEMC will only be viable if there is an hydrological revolution in the coming years, which implies, both efficiency in irrigation via new technologies and an increase in the use and quality of recycled water. Both aspects require projects at a small-scale level but they could benefit from programs focusing on planning and transfer of knowledge.
4. Promoting dryland agriculture: Sustainability debates in SEM countries have an excessive focus on irrigated agriculture. However, great potential exists to increase the efficiency and resilience of rain fed farming and pastoralism via drought tolerant seeds, soil management, agro forestry, cultivation of pastures and no tillage farming. Making SEM countries’ agriculture resilient to global warming and desertification will also imply the promotion of dry land agriculture and its products.
5. Targeted trainings for agriculture and food-industry professionals: Extension services and other dissemination activities are key for a more sustainable farming and food system. Professionals in different fields of agriculture and the food-industry should be targeted for training programmes at different levels (high-school, vocation education, life-long education).
6. Nutrition education campaigns addressed to the general public: As shown in this report, the main problem in the SEM countries is not calorie shortages, but lack of micronutrients like vitamins and iron. In fact, many food consumers in SEM countries are no longer following the globally praised “Mediterranean diet”. Consumption of sodas and fast food is widespread. Like in OECD countries high rates of obesity and diabetes have developed into grave public health issues with a long-term detrimental impact on GDP growth. This should invite public authorities and private actors to design campaigns (TV, school meals, etc.) to promote more balanced diets and create a nutrition culture among the general public.
7. Mediterranean Food Watch: This report has highlighted the importance of food and particularly food prices in SEM countries. UfM could, in cooperation with like-minded individual countries and organisations such as FAO put in place a mechanism aiming at ensuring food security in this region and mitigating the effects of geopolitical crises, regional conflicts and environmental degradation.

34
References
ADAMS JR., R. H. 2003. The Political Economy and Distributional Impact of the
Egyptian Food Subsidy System. In: LOFGREN, H. (ed.) Food, Agriculture, and Economic Policy in the Middle East and North Africa 1st edition ed. Amsterdam ; New York: JAI.
ALBERS, R. & PEETERS, M. 2011. Food and Energy Prices, Government Subsidies and Fiscal Balances in Southern Mediterranean Countries. Economic Papers. 437. Brussels: European Commission, Economic and Financial Affairs Directorate-General.
ALLAN, T. 2001. The Middle East Water Question : Hydropolitics and the Global Economy, London ; New York, I.B. Tauris.
ALLAN, T. 2011. Virtual Water : Tackling the Threat to Our Planet's Most Precious Resource, London, I. B. Tauris.
ALTERMAN, J. B. & DZIUBAN, M. 2010. Clear Gold. Water as a Strategic Resource in the Middle East. Washington D. C.: Center for Strategic and International Studies (CSIS).
ARAB ORGANIZATION FOR AGRICULTURAL DEVELOPMENT (AOAD) 2012. Arab Agricultural Statistics Yearbook. 32. Khartoum.
BABAR, Z. & MIRGANI, S. (eds.) 2014. Food Security in the Middle East, London: Hurst.
BAZOOBANDI, S. (ed.) 2014. The Politics of Food Security. Asian and Midle Eastern Strategies, Berlin ; London: Gerlach Press.
BREISINGER, C., ECKER, O. & AL-RIFFAI, P. 2011a. Economics of the Arab Awakening: From Revolution to Transformation and Food Security. IFPRI Policy Brief. 18. Washington D. C.: International Food Policy Research Institute (IFPRI).
BREISINGER, C., ECKER, O., AL-RIFFAI, P. & YU, B. 2012. Beyond the Arab Awakening. Policies and Investments for Poverty Reduction and Food Security. Food Policy Report. Washington D. C.: International Food Policy Research Institute (IFPRI).
BREISINGER, C., ZHU, T., RIFFAI, P. A., NELSON, G., ROBERTSON, R., FUNES, J. & VERNER, D. 2011b. Global and Local Economic Impacts of Climate Change in Syria and Options for Adaptation. IFPRI Discussion Paper 01091, June. Washington D. C.: International Food Policy Research Institute (IFPRI).
CLINE, W. R. 2007. Global Warming and Agriculture : Impact Estimates by Country, Washington, DC, Center for Global Development : Peterson Institute for International Economics.
DEININGER, K., BYERLEE, D., LINDSAY, J., NORTON, A., SELOD, H. & STICKLER, M. 2011. Rising Global Interest in Farmland. Can It Yield Sustainable and Equitable Benefits? Agriculture and Rural Development. Washington D. C.: World Bank.
DEUTSCHE BANK RESPONSIBILITY. 2014. Agricultural Speculation and Commodity Prices – Is There a Link? [Online]. Available: https://http://www.db.com/cr/en/concrete-Agricultural-speculation-and-commodity-prices---is-there-a-link.htm [Accessed 29 August 2014].

35
FAO. Climate Change: Implications for Agriculture in the near East. 29th FAO Regional Conference for the Near East, 2008 Cairo.
FAO 2011. Global Food Losses and Food Waste. Extent, Causes and Prevention. Study conducted for the International Congress SAVE FOOD! at Interpack 2011Düsseldorf Germany. Rome.
FAO. 2014. FAO Food Pice Index [Online]. Rome. Available: http://www.fao.org/worldfoodsituation/foodpricesindex/en/ [Accessed 17 September 2014].
FISCHER, G., HIZSNYIK, E., PRIELER, S., SHAH, M. & VAN VELTHUIZEN, H. 2009. Biofuels and Food Security. Vienna: International Institute for Appplied Systems Analysis (IIASA), commisioned by OPEC Fund for International Development (OFID).
FISCHER, G., SHAH, M., N. TUBIELLO, F. & VAN VELHUIZEN, H. 2005. Socio-Economic and Climate Change Impacts on Agriculture: An Integrated Assessment, 1990–2080. Philosophical Transactions of the Royal Society B: Biological Sciences, 360, 2067-2083.
GORNALL, J., BETTS, R., BURKE, E., CLARK, R., CAMP, J., WILLETT, K. & WILTSHIRE, A. 2010. Implications of Climate Change for Agricultural Productivity in the Early Twenty-First Century. Philosophical Transactions of the Royal Society B: Biological Sciences, 365, 2973-2989.
HARRIGAN, J. 2014. The Political Economy of Arab Food Sovereignty, Basingstoke ; New York, Palgrave Macmillan.
HERNANDEZ, M. & TORERO, M. 2010. Examining the Dynamic Relationship between Spot and Future Prices of Agricultural Commodities. IFPRI Discussion Paper. 00988. International Food Policy Research Institute (IFPRI).
IANCHOVICHINA, E., LOENING, J. & WOOD, C. 2012. How Vulnerable Are Arab Countries to Global Food Price Shocks? Washington D. C.: World Bank.
IMF 2014. Global Financial Stability Review. Washington D. C. INTERGOVERNMENTAL PANEL ON CLIMATE CHANGE (IPCC) 2013. Fifth
Assessment Report: Climate Change 2013. Geneva. INTERNATIONAL CENTRE FOR ADVANCED AGRONOMIC STUDIES (CIHEAM)
2008. Mediterra 2008: The Future of Agriculture and Food in Mediterranean Countries, Paris.
INTERNATIONAL CENTRE FOR ADVANCED AGRONOMIC STUDIES (CIHEAM) 2009. Mediterra 2009: Rethinking Rural Development in the Mediterranean, Paris.
INTERNATIONAL TRADE CENTER. 2014. Trade Map Statistics [Online]. Geneva. Available: http://www.trademap.org [Accessed 2 September 2014].
JACKS, D. S. 2013. From Boom to Bust: A Typology of Real Commodity Prices in the Long Run. Working Paper, 18874.
JOHNSON, D. G. 1999. North America and the World Grain Market. In: ANTLE, J. M. & SMITH, V. H. (eds.) The Economics of World Wheat Markets. New York ; Wallingford: CABI Publishing.
KONANDREAS, P. 2012. Trade Policy Responses to Food Price Volatility in Poor Net Food-Importing Countries. In: DEVELOPMENT, I. P. O. A. T. A. S. (ed.) Issue Paper. 42. Rome: FAO and International Centre for Trade and Sustainable Development (ICTSD).
36
LUOMI, M. 2012. The Gulf Monarchies and Climate Change : Abu Dhabi and Qatar in an Era of Natural Unsustainability, London, Hurst & Company.
MEKONNEN, M. M. & HOEKSTRA, A. 2011. National Water Footprint Accounts: The Green, Blue and Grey Water Footprint of Production and Consumption. In: UNESCO-IHE (ed.) Value of Water Research Report 50. Delft
MÜLLER, C., CRAMER, W., HARE, W. L. & LOTZE-CAMPEN, H. 2011. Climate Change Risks for African Agriculture. Proceedings of the National Academy of Sciences, 108, 4313-4315.
NATIONAL OCEANIC AND ATMOSPHERIC ADMINISTRATION (NOAA). 2011. NOAA Study: Human-Caused Climate Change a Major Factor in More Frequent Mediterranean Droughts [Online]. Wahsington D. C. Available: http://www.noaanews.noaa.gov/stories2011/20111027_drought.html [Accessed 8 January 2014].
OECD-FAO 2013. Agricultural Outlook 2013-2022. Paris. ORESKES, N. & CONWAY, E. M. 2010. Merchants of Doubt : How a Handful of
Scientists Obscured the Truth on Issues from Tobacco Smoke to Global Warming, New York, Bloomsbury Press.
PAARLBERG, R. 2010. Food Politics: What Everyone Needs to Know, Oxford, Oxford University Press.
PAARLBERG, R. L. 2008. Starved for Science : How Biotechnology Is Being Kept out of Africa, Cambridge, Mass., Harvard University Press.
PALL, Z., PEREKHOZHUK, O., TEUBER, R. & GLAUBEN, T. 2011. Wheat Trade - Does Russia Price Discriminate across Export Destinations? IAMO Forum 2011. No 15.
PIESSE, J. & THIRTLE, C. 2009. Three Bubbles and a Panic: An Explanatory Review of Recent Food Commodity Price Events. Food Policy, 34, 119-129.
PIKETTY, T. 2014. Capital in the Twenty-First Century, Cambridge, Mass., Belknap Press of Harvard Univeristy Press.
RICHARDS, A. & WATERBURY, J. 2008. A Political Economy of the Middle East, Boulder, Colo., Westview Press.
SCHUTTER, O. D. 2010. Food Commodities Speculation and Food Price Crises. Regulation to Reduce the Risks of Price Volatility. Briefing Note. 02. Geneva: United Nations Special Rapporteur on the Right to Food.
SHARMA, R. 2011. Food Export Restrictions: Review of the 2007–2010 Experience and Considerations for Disciplining Restrictive Measures. Rome: FAO.
SOJAMO, S., KEULERTZ, M., WARNER, J. & ALLAN, J. A. 2012. Virtual Water Hegemony: The Role of Agribusiness in Global Water Governance. Water International, 37, 169-182.
SPRINGBORG, R. 2012. Egypt: Attempting to Improve 'Quality of Administration' without Increasing 'Public Accountability'. In: KADHIM, A. (ed.) Governance in the Middle East and North Africa: A Handbook. London ; New York: Routledge.
UNITED NATIONS 2011. World Population Prospects: The 2010 Revision. Population Division of the Department of Economic and Social Affairs of the United Nations Secretariat. New York.
USDA, U. S. D. O. A. 2014. Foreign Agricultural Service Database. Production, Supply and Distribution (PSD) [Online]. Washington D. C. Available:

37
http://www.fas.usda.gov/psdonline/psdQuery.aspx [Accessed 23 May 2014].
VASSILIEVA, Y. 2012a. Privatization of the United Grain Company. In: USDA (ed.) Global Agricultural Research Network. GAIN Report Number: RS1240. Moscow: USDA.
VASSILIEVA, Y. 2012b. Russia: Agriculture Development Program 2013-2020. In: USDA (ed.) Global Agricultural Research Network. GAIN Report Number: RS1270. Moscow: USDA.
VILLALOBOS A., V. M. 2014. Potential Impact of the Russia-Ukraine Crisis on Agriculture in the Americas. San Jose, Costa Rica: INter-Amecian Institute for Cooperaton on Agriculture (IICA).
WEIS, T. 2007. The Global Food Economy : The Battle for the Future of Farming, London; New York, Zed Books.
WINDERS, B. 2011. The Food Crisis and the Deregulation of Agriculture. The Brown Journal of World Affairs, XVIII, 83-95.
WOERTZ, E. 2013a. The Governance of Gulf Agro-Investments. Globalizations, 10, 87-104.
WOERTZ, E. 2013b. Oil for Food. The Global Food Crisis and the Middle East, Oxford ; New York, Oxford University Press.
WORLD BANK 2006. Middle East and North Africa. Economic Developments and Prospects 2006: Financial Markets in a New Age of Oil. Washington D. C.
WORLD BANK & FAO 2012. The Grain Chain. Food Security and Managing Wheat Imports in Arab Countries. Washington D. C.