the impact of fiscal rules on the grant-making … · the impact of fiscal rules on the...
TRANSCRIPT

1
THE IMPACT OF FISCAL RULES ON THE GRANT-MAKING BEHAVIOR OF AMERICAN FOUNDATIONS
Gian Paolo Barbetta Catholic University of Milano
Luca Colombo
Catholic University of Milano
Gilberto Turati University of Torino
May 2012
Abstract Private and community foundations in the USA benefit from a favorable tax treatment, at the same time being subjected to specific forms of regulation aimed at guaranteeing that they operate in the public interest. This paper investigates to what extent the different fiscal rules applying to community and private foundations - the public support test and the minimum payout requirement, respectively - influence their behavior. Using tax return data for the USA in the period 2000-2006, we show that the grant-making activities of community foundations are strongly correlated to the donations received (consistently with the design of the public support test), while those of private foundations to their endowments (consistently with that of the minimum payout requirement). Nonetheless, our results also indicate the existence of a large heterogeneity in the grant-making behavior of both community and private foundations, suggesting that an effective regulatory approach could benefit from a careful analysis of the nature and of the institutional features of the foundations under scrutiny. Keywords: community foundations, private foundations, minimum payout requirement, public support test, grant-making behavior
JEL Codes: H30, L31, K20
Excellent research assistance from Chiara Donegani is gratefully acknowledged. We thank Roger Congleton, Peter Frumkin, as well as participants to the EPCS 2011 Conference (University of Rennes) and to the SIEP 2011 Conference (University of Pavia) for helpful comments to a preliminary version. Usual disclaimers apply. Corresponding author: Catholic University of Milano, Institute of Economics and Public Finance, Largo A. Gemelli 1, 20123 Milano, Italy. Ph.: +39.02.7234.2695, Fax: +39.02.7234.2781, E-mail address: [email protected]

2
1. Introduction
Grant-making foundations represent one of the most peculiar and well-known group of
institutions in the nonprofit sector of the USA. Their grant-making activity is so
characteristic of the North American culture that these organizations have been
considered “a unique American answer to the problem of excess wealth in a society with
limited income redistribution” (Anheier and Toepler, 1999). According to the latest
available statistics of the Internal Revenue Service1, their assets exceeded $ 500 billion
in 2008, out of the about $ 1.4 trillion net assets held by the entire nonprofit sector2.
They disbursed more than $ 42 billion in charitable grants, funding many cultural,
research and welfare activities and organizations.
From a general point of view, philanthropic grant-making foundations are institutions
that pay grants, by distributing what they obtain by investing the donations received.
More precisely, they are nongovernmental, nonprofit organizations whose assets (the
foundation endowment, generally donated by one or more donors) are managed by a
board of trustees so as to generate the financial resources that will be distributed (to
deserving charitable organizations and individuals) in grants aimed at pursuing a specific
goal stated by the donors and codified in the charter of the organization (Andrews,
1956). According to the different sources of their endowment, grant-making foundations
can be classified into two different groups. The first group is made by the so called
‘private independent foundations’, whose assets are generally provided by a small group
of people, usually members of the same family, or by a corporation. More than 76.000
private independent grant-making foundations were operating in the USA in 2008. A very
well-known example of this type of organization is the Bill and Melinda Gates
Foundation, by far the best endowed foundation in the USA, with more than $ 32 billion
in assets and about $ 2.5 billion giving in year 2010. In 2001, this foundation received a
large donation of Microsoft stocks from Bill Gates, and in 2006 it received from Warren
Buffett a pledge to donate approximately 10 million shares of its corporation, Berkshire
Hathaway. More ancient examples of this group of foundations are the Ford Foundation
(the second largest in the USA by assets size), the Robert Wood Johnson Foundation and
the W. K. Kellogg Foundation, each of them with assets in the excess of $ 5 billion and
more than $ 290 million in grants paid in 2010. The second group of grant-making
foundations is made by the so called ‘community foundations’, whose assets result not
1 All data are available from the IRS website: http://www.irs.gov/taxstats/charitablestats/article/0,,id=97155,00.html 2 We refer to tax-exempt 501(c)3 organizations.
3
from the donations of a single individual but rather from wide groups of donors, both
individual and institutional ones, living in the same area and belonging to the same
community. Community foundations – more than 700 organizations in 2009 – are far less
numerous than private ones, but they include some very large institutions such as the
Tulsa Community Foundation (the largest one, with more than $ 4 billion in assets), or
the Silicon Valley Community Foundation, the New York Community Trust, and the
Chicago Community Trust, all of them with assets exceeding $ 1 billion and grants
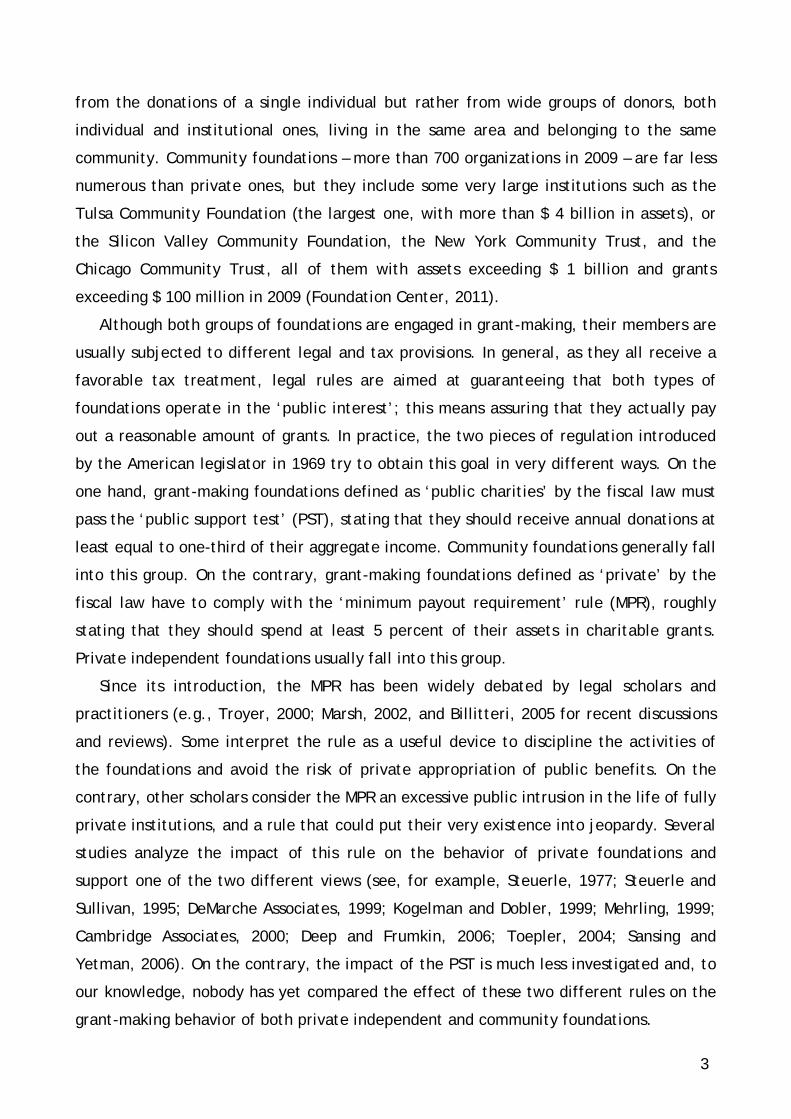
exceeding $ 100 million in 2009 (Foundation Center, 2011).
Although both groups of foundations are engaged in grant-making, their members are
usually subjected to different legal and tax provisions. In general, as they all receive a
favorable tax treatment, legal rules are aimed at guaranteeing that both types of
foundations operate in the ‘public interest’; this means assuring that they actually pay
out a reasonable amount of grants. In practice, the two pieces of regulation introduced
by the American legislator in 1969 try to obtain this goal in very different ways. On the
one hand, grant-making foundations defined as ‘public charities’ by the fiscal law must
pass the ‘public support test’ (PST), stating that they should receive annual donations at
least equal to one-third of their aggregate income. Community foundations generally fall
into this group. On the contrary, grant-making foundations defined as ‘private’ by the
fiscal law have to comply with the ‘minimum payout requirement’ rule (MPR), roughly
stating that they should spend at least 5 percent of their assets in charitable grants.
Private independent foundations usually fall into this group.
Since its introduction, the MPR has been widely debated by legal scholars and
practitioners (e.g., Troyer, 2000; Marsh, 2002, and Billitteri, 2005 for recent discussions
and reviews). Some interpret the rule as a useful device to discipline the activities of
the foundations and avoid the risk of private appropriation of public benefits. On the
contrary, other scholars consider the MPR an excessive public intrusion in the life of fully
private institutions, and a rule that could put their very existence into jeopardy. Several
studies analyze the impact of this rule on the behavior of private foundations and
support one of the two different views (see, for example, Steuerle, 1977; Steuerle and
Sullivan, 1995; DeMarche Associates, 1999; Kogelman and Dobler, 1999; Mehrling, 1999;
Cambridge Associates, 2000; Deep and Frumkin, 2006; Toepler, 2004; Sansing and
Yetman, 2006). On the contrary, the impact of the PST is much less investigated and, to
our knowledge, nobody has yet compared the effect of these two different rules on the
grant-making behavior of both private independent and community foundations.
4
The goal of the paper is to fill this gap in the literature. Taking an institutional
approach, we examine the effects of the two different sets of fiscal rules on the grant-
making behavior of both private and community foundations in the USA. Using tax return
data provided by the IRS for the period 2000 to 2006, we estimate the determinants of
grants, and test whether the PST and MPR rules have a differential impact on the
behavior of the two types of foundations. We find systematic differences in the grant-
making behavior of community and private independent foundations, with that of the
former being more correlated to the volume of donations received and that of the latter
to the size of a foundation’s endowment. This confirms the existence of a statistically
significant correlation between the grant-making behavior of the two types of
foundations and the regulations to which they are subjected. Interestingly, however,
this result emerges only when explicitly controlling for the size of foundations, which
allows us to derive more refined implications for the relationships between grant-making
and regulation. In particular, we document the existence of a large heterogeneity in the
grant-making behaviors of foundations belonging to different class sizes, with results
that are in some cases inconsistent with the general message conveyed above. This
suggests that other characteristics of a foundation may be important for the regulator,
besides its type (community or private). Further research is needed to identify these
characteristics and to see if (and how) they can be exploited in devising more
sophisticated regulatory approaches.
Our exercise may have relevant policy implications, also outside the USA, especially
today that grant-making foundations are often called to make up for public spending
reductions in several welfare sectors. For instance, in Europe, the idea of introducing (a
sort of) MPR has been considered in the framework of the policy idea of the ‘Big
Society’, put forward by the current UK government. In particular, in the recent Green
Paper on giving, one can read that “some suggest that foundations should make a
minimum payout annually, as is the case in some other countries, as this could result in
extra income for charities. Others suggest that a requirement would not help charities in
the long term, and could generate unintended consequences. We would like to explore
this issue further and welcome views on foundation giving.” (H.M. Government, 2010, p.
18). This kind of policy proposals would greatly benefit from a careful scrutiny of the
incentives of different tax provisions to the grant-making activity of foundations.
The remainder of the paper is structured as follows. Section 2 describes the most
relevant fiscal provisions for the community and private independent foundations in the

5
USA. Section 3 illustrates our data and the stylized facts concerning the industry of
grant-making foundations. Section 4 describes the determinants of the pay-out policies
for the foundations included in our sample and characterizes the differences in the
grant-making behavior of private and community foundations. Section 5 concludes the
paper.
2. Fiscal regulation of grant-making foundations in the USA
Given their not-for-profit nature and their attitude to undertake activities that can
benefit society as a whole, grant-making foundations – all over the world - benefit from
several fiscal incentives (Hopkins, 2007, for the USA; Bater and Habighorst, 2001, for
Europe). In many legal systems, foundations are exempt from income and real estate
taxation, and donors are often allowed to deduct from their income (part of their)
donations to stated organizations. These tax advantages can – directly and indirectly -
benefit foundations and increase the funds they can raise. However, they imply relevant
costs for the public purse, so that governments need to be sure that these provisions are
well deserved and balanced by a relevant amount of activity undertaken by the
foundations in favor of all of society. When considering operating foundations, the
measurement of the activity undertaken in favor of society is not complex, and output
measures are relatively easy to produce. One could consider, for instance, the amount
of free meals distributed to the poor in a soup kitchen or the number of surgeries
carried out in a hospital. Conversely, the measurement of the amount of activity
benefiting the general public that are undertaken by a grant-making foundation is more
complex. The main reason is the great variety of actions funded by most grant-making
foundations, which makes it almost impossible to produce aggregate output measures.
Unsurprisingly, a frequently used proxy of the quantity of activity producing social
benefits is the amount of grants paid to deserving grantees.
The USA are an interesting case study of how tax rules can be designed in order to
balance fiscal advantages with the amount of grants made by foundations. Grant-making
foundations are subjected to tax rules that – broadly speaking – divide them into two
separate categories: ‘public charities’ and ‘private foundations’3. In order to qualify as a
public charity, a grant-making foundation should pass the public support test (PST). This
3 This distinction was introduced in the tax legislation of 1969 as “a proxy for the amount of control the donor retained over her gift after dedicating it to philanthropy and taking the corresponding tax deduction” (Marsh, 2002, p. 139). Accordingly, public charities are institutions over which donors retain a lower degree of control with respect to private foundations.

6
test is passed if the organization normally receives at least one-third of its aggregate
income from individual contributions, each of which not exceeding 2 percent of the
charity's total income. Among the American grant-making institutions, community
foundations – usually funded by many individuals every year - generally pass this test,
and therefore qualify as public charities. When failing the PST, a grant-making
foundation is qualified by the fiscal law as a private foundation and it is subjected to a
different rule, the minimum payout requirement (MPR). This rule states that private
foundations should make annual eligible charitable expenditures that are at least equal
to 5 percent of the average monthly value of their endowment (i.e., the net investment
assets calculated the previous year)4. If this rule is not met, the foundation should pay a
penalty excise tax, the value of which is approximately equal to 30 percent of the
shortfall. Private independent grant-making foundations created by individuals or
families are typically “cold” institutions (Sansing and Yetman, 2006), endowed in the
past by their founders but no longer receiving new donations; therefore, they generally
fall into the legal group of private foundations.
Community foundations as public charities benefit from a more generous fiscal status
than private foundations. In fact, although both types of foundations are exempt from
income and real-estate taxes, the private foundation status carries some disadvantages
such as a 2 percent excise tax on the investment income gained by the foundation5, as
well as penalty excise taxes on “certain taxable expenditures”, on “self-dealing”, on
“excess business holdings”, and on “jeopardizing investments”6. Moreover, also an
4 More precisely, charitable expenditures include both grants paid to deserving organizations and administrative expenses incurred by the foundation and related to its charitable purpose, such as salaries, rents, travel costs, and grant-monitoring expenditures. Grant-making foundations making use of large staffs and expensive locations may therefore pay much less than 5 percent in grants. Critics of this legal provision argue that “reducing or eliminating administrative expenses from the payout calculation would free up billions of additional dollars for charities.” (Billitteri, 2005, p. 16). On the contrary, supporters of the provision state that “foundations might seek to reduce their administrative costs by cutting back on efforts to screen grant applications, monitor grantees' efficiency and provide guidance to grant recipients. That, they contend, especially could hurt fledgling charities and those with innovative programs.” (Billitteri, 2005, p. 16). 5 Foundations whose “qualifying distributions exceed their historical average in any given year receive a favourable 1 percent rate” (Marsh, 2002, p. 156). 6 ‘Taxable expenditures’ are amounts paid or incurred by private foundations: a) to carry on propaganda, or otherwise attempt to influence legislation (IRC 4945(d)(1)); b) to influence the outcome of any specific public election, or to carry on a partisan voter registration drive (directly or indirectly) (IRC 4945(d)(2)); c) as a grant to an individual for travel, study, or other similar purposes, unless the grant meets certain requirements (IRC 4945(d)(3)); d) as a grant to an organization unless such organization is a public charity or unless the grantor private foundation exercises "expenditure responsibility" over the grant (IRC 4945(d)(4)); and e) for any purpose other than one specified in IRC 170(c)(2)(B). ‘Self-dealing‘ is the conduct of a foundation trustee that takes advantage of his position and acts for his own interests rather than for the interests of the beneficiaries of the foundation. The ‘excess business holdings’ of a foundation are the amount of stock or other interest in a business enterprise that exceeds the permitted

7
indirect benefit - such as the deductibility of individual contributions - is subjected to
different rules: tax deductions for donations to public charities cannot exceed 50
percent of the donor’s income, while those to private foundations are generally limited
to 30 percent of that income.
Organizations that institutionally perform the same task (making grants) comply with
two different sets of rules, both intended to balance their fiscal advantages with a
relevant amount of grants: community foundations observe the PST, while private
foundations are subjected to the MPR. While the grant-making activity of private
foundations is directly regulated by the government through the MPR, the grant-making
activity of community foundations is only exposed to an indirect constraint. In fact, the
rationale behind the PST is that, in order to collect donations from a large set of
individual donors, a community foundation should build its reputation through an
effective and abundant grant-making activity. Our empirical analysis tests whether these
two mechanisms aimed at assuring a reasonable amount of grants in exchange of fiscal
benefits produce different effects on the grant-making behavior of foundations in the
USA.
3. Sample description and stylized facts
Our econometric exercises are based on a pooled cross-section of grant-making
foundations, including both private and community foundations active in the USA
between 2000 and 2006. Our dataset - explicitly constructed for the purposes of this
paper – is based on data that are released by the Statistics of Income (SOI) Division of
the Internal Revenue Service (IRS) and, to a small extent, also on data published by the
Council on Foundations. The sampling procedures adopted by the IRS are different
between the two groups of grant-making institutions. As for private foundations, the SOI
provides a sample of forms 990-PF that this group of organizations must file with the IRS
every year. Note that “the SOI sample of private foundations is stratified based on both
the size of fair market value of total assets and the type of organization (…). The private
foundation sample is designed to provide reliable estimates of total assets and total
revenue. To accomplish this, 100 percent of returns filed for foundations with fair
market asset value of $10 million or more are included in the samples (…). The holdings. A private foundation is generally permitted to hold up to 20 percent of the voting stock of a corporation, reduced by the percentage of voting stock actually or constructively owned by disqualified persons. ‘Jeopardizing investments’ are investments that show a lack of reasonable business care and prudence in providing for the long- and short-term financial needs of the foundation for it to carry out its exempt function (www.irs.gov).

8
remaining foundation population is randomly selected for the sample at various rates,
ranging from 1 percent to 100 percent, depending on asset size”7. Forms 990-PF are
filed by several types of private foundations. In order to get information referring to
independent tax-exempt grant-making foundations only, we excluded from the SOI
sample: a) all operating foundations (identified through codes Q030 and Q100 of the
990-PF form); b) foundations that did not distribute any grants; c) all foundations that
were not 501(c)3 tax-exempt charitable organizations, such as non-exempt charitable
trusts (identified through code E050 of the 990-PF form); d) foundations using a ‘cash’
and not an ‘accrual’ accounting method (identified through code E090 of the 990-PF
form). Table 1a illustrates the SOI sample and population counts, as well as their
composition in terms of (tax-exempt) private foundations and (nonexempt) charitable
trusts.
<Table 1a about here>
As for community foundations, the analysis is based on a SOI sample of forms 990
that 501(c)3 tax-exempt organizations must file with the IRS each year. Forms 990 are
filed annually by a huge number of organizations, which qualify as public charities. In
order to make sure that we consider community foundations only, we selected data
referring to community trusts exclusively, identified through code S100 (11b) of the 990
form. Moreover, given that some community trusts are not ‘community foundations’, we
checked each record with the list of community foundations published by the Council of
Foundations8 and ruled out all inappropriate records. Statistics on population count, SOI
sample and excluded organizations are in Table 1b.
<Table 1b about here>
Our final sample includes - over the entire time period - 44,046 observations, largely
private foundations. Given that community foundations are substantially less common
than private ones, our sample mirrors quite well the actual distribution of the number of
these two types of institutions in the USA nonprofit sector, as illustrated in Table 2.
<Table 2 about here>
7 See the website: http://www.irs.gov/taxstats/charitablestats/article/0,,id=212357,00.html. 8 The list can be found at the website: www.cof.org.

9
Both for community and private foundations, our sample covers approximately about 10
percent of the overall population. Conversely, in terms of endowment and grants, the
percentage of the population represented by the sample of private foundations is about
three times larger than that of community foundations. This characteristic of our sample
follows directly from the sampling procedure of the SOI data. In particular, the SOI data
should include all the public charities with endowments above $ 50 million, but only a
fraction of the smaller organizations. Recall that, as the largest community foundations
are on average smaller than the largest public charities, community foundations are
necessarily under-represented in the SOI sample of 990 forms.
The two types of organizations included in the sample are quite different in size,
with community foundations that are on average larger than the private ones (Table 3).
<Table 3 about here>
In particular, the mean endowment of community foundations is more than 2.5 times
that of private foundations, while the median is about four times larger. Note that, in
the absence of the sample bias discussed above, the observed differences would have
been even larger. Disparities between the two groups emerge also when considering
grants paid and sources of income, with average grants being three times larger, and
donations six times larger, for community foundations than for private ones9.
Furthermore, note that the median of received donations is zero for private foundations.
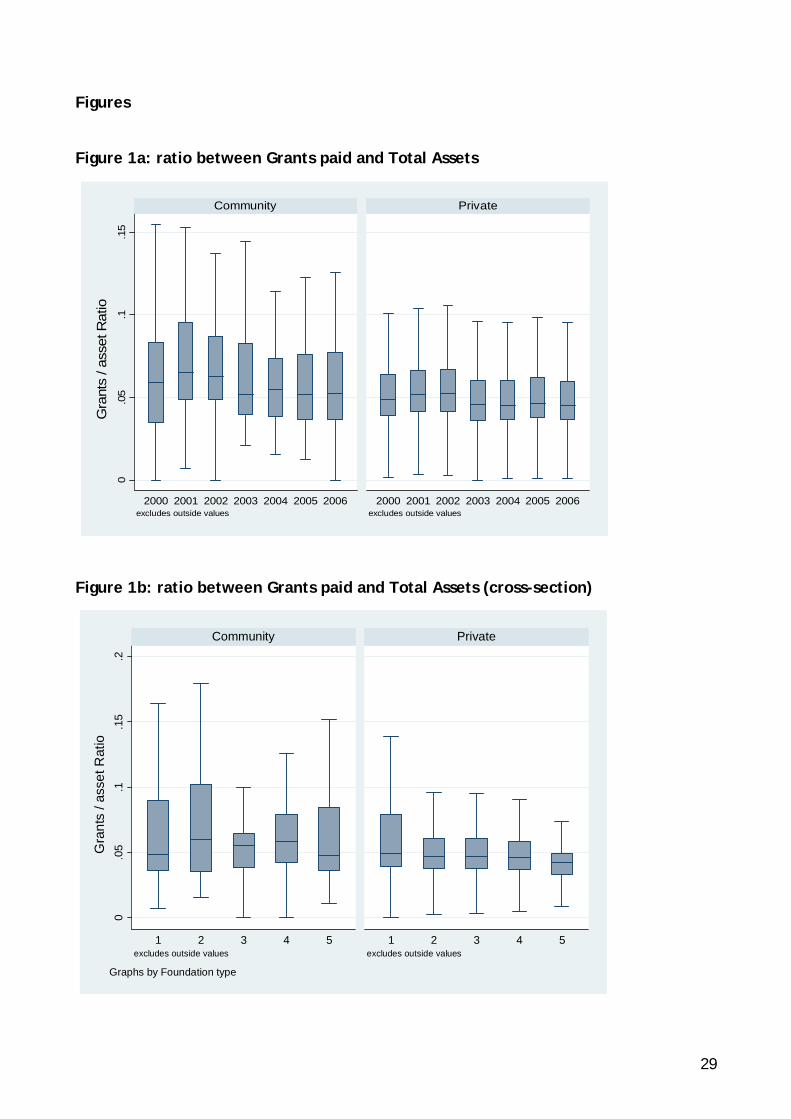
In order to properly account for differences in size, Figure 1a shows grants as a share
of total assets using box-plots10.
<Figure 1a about here>
Community foundations pay out larger amounts of resources than private foundations
also when accounting for differences in size, given that the median of the grants-to-
asset ratio is always above the median for private foundations. However, this median
behavior hides a large variability, which again appears to be much bigger for community
than for private foundation. This is true both observing the boxes and the whiskers. 9 Following Mehrling (1999), we did not include administrative expenses in the calculation of grants paid by private foundations. This is consistent both with the idea of comparing the grant-making behavior of the two classes of foundations (as comparable data on administrative expenses for community foundations are not available), and with Mehrling's idea that “society does not care how much foundations are spending on their rent, or how much they are giving to their top executives. What is in the social interest is actual charitable giving”. 10 In all box-plots, boxes include all observations in the second and the third quartiles, with the line in each box denoting the median value, and whiskers include all observations, but for the extreme values.
10
Moreover, the (average) behavior of private foundations remains close to the 5 percent
threshold in all years, while that of community foundations appears to be more volatile
over time. Note, in particular, that the 5 percent floor is always included in the box.
Figure 1b shows the grant-to-assets ratio for quintiles of the distribution of
foundations by assets size.
<Figure 1b about here>
Quite interestingly, variability in the grant making behavior sharply decreases for the
largest private foundations, meaning that the smallest institutions are those that
contribute the more to the variability observed for this group of foundations. On the
contrary, for community foundations, a large variability is observed in all quintiles, with
the largest variance at the two ends of the distribution.
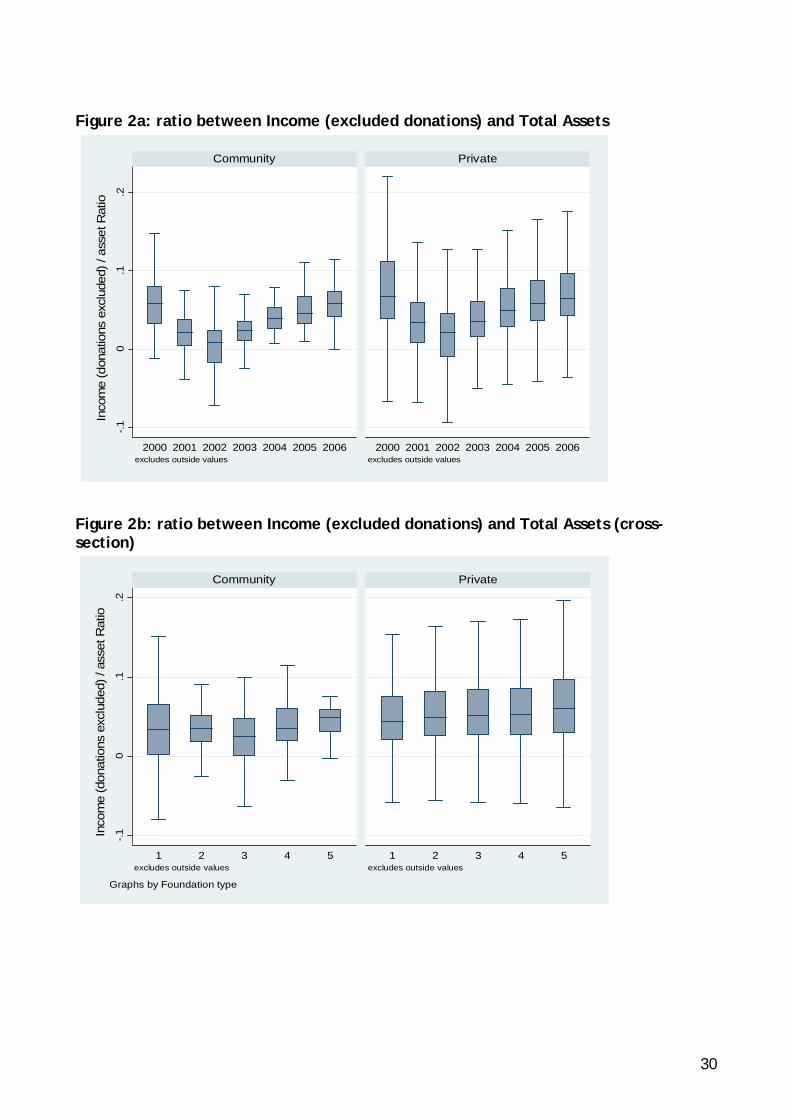
Looking at the income of the two types of foundations, there are two sources of
revenues that need to be explored: the returns from the financial management of the
endowment, and the donations collected from individuals and private firms. As for
returns from financial management (defined as the income-to-assets ratio), it appears
that the median value for private foundations is slightly larger than that for community
foundations, indicating that the former are better at managing their resources (Figure
2a).
<Figure 2a about here>
Note, however, that the risk profile of private foundations’ investments is likely to be
higher than that of community foundations, as they are characterized by a larger
variability of returns. In particular, the returns of community foundations are much
more clustered around the median than those of private foundations. Furthermore,
when looking at the evolution of returns over time, we observe a similar pattern for the
two types of foundations that closely mirrors the evolution of the stock market indices:
from the peak of the dot-com bubble in 2000 to the market recovery in the second half
of our sample period, passing through the burst of the dot-com bubble in 2002.
Figure 2b, illustrating the income-to-assets ratio for quintiles of the distribution of
foundations by assets size, shows that the variability of returns is almost always larger
for private than for community foundations.
<Figure 2b about here>

11
Furthermore, the variability of returns is clearly increasing in assets size for private
foundations, while community foundations behave very differently. Indeed, in this case,
the highest (smallest) variability of returns is observed for the smallest (largest)
foundations.
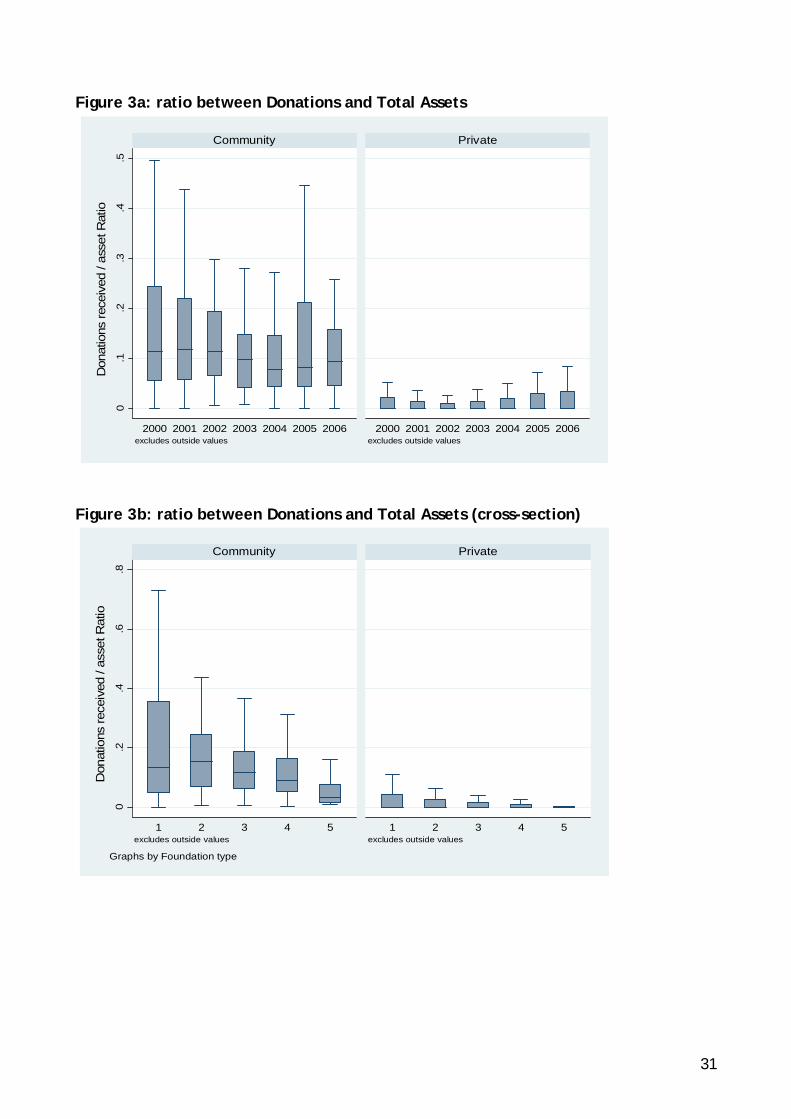
Finally, focusing on the donations-to-assets ratio for the two types of foundations,
we find (unsurprisingly) that community foundations rely more heavily on this source of
income than private foundations. Figure 3a shows that the median of the donations
received by private foundations is zero for all the years considered in the sample, while
it is about 10 percent for community foundations.
<Figure 3a about here>
Furthermore, the variability of donations received by private foundations appears to be
significantly lower than that observed for community foundations.
The same findings are confirmed when looking at the cross-sectional variability of
the donations-to-assets ratio (Figure 3b).
<Figure 3b about here>
In particular, the variability of the ratio for private foundations is very limited and
decreasing across quintiles (being essentially nil for the largest foundations). A similar
pattern is observed for community foundations where, however, the variability of the
donations-to-assets ratio remains significantly larger than for private foundations.
Overall, the descriptive empirical evidence summarized by the figures above
suggests that, on average, the different tax rules to which community and private
foundations are subjected influence their behavior, inducing specialization in fund-
raising activities by community foundations and in asset management by private
foundations. In particular, it appears that most private foundations, especially the
largest ones, apply a ‘fixed rule’ in their grant-making activity, strictly complying with
the MPR. This stylized fact is consistent with the findings of both Deep and Frumkin
(2006) and Sansing and Yetman (2006)11. Conversely, community foundations specialize
11 Deep & Frumkin (2006) analyze a panel of 290 private foundations for the period 1972 to 1996 finding that “most foundations simply pay out the mandated minimum amount each year, regardless, of other relevant considerations”. Furthermore, they argue that “the minimum rate has gone from being a floor when it was enacted decades ago to a ceiling today”. Sansing and Yetman (2006), using a larger sample of about 3800 foundations between 1994 and 2000, show that “the minimum distribution requirement is a binding constraint for foundations that are ‘‘passive’’ in terms of management expenditures and ‘cold’ (as
12
in fund-raising and in most cases appear to be successful in collecting donations, largely
a result of the PST. This is likely to be also the reason why they pay more grants than
private foundations, a fact that - to the best of our knowledge - has not been pointed
out in the literature. However, despite a distinct specialization of the two groups of
foundations, there remains a wide ‘within group’ heterogeneity that needs to be taken
into account in the following empirical analysis.
4. Empirical analysis
Our empirical analysis focuses on the determinants of the amount of grants paid by
private and community foundations. The main goal of our econometric specifications is
to test whether different tax rules generate different incentives for foundations’ grant-
making behavior. Two hypotheses seem natural, based on the constraints imposed by the
PST and the MPR. As for the former, we conjecture that the PST establishes a positive
correlation between grant-making activities and donations. This follows from the
observation that, in order to attract the volume of donations needed to pass the test, a
foundation must find ways to signal its quality. The effectiveness and extent of its grant-
making activities are natural ways to provide such a signal. Therefore, also consistently
with the descriptive evidence presented in Section 3, we expect to find a stronger
positive correlation between grants paid and donations received for community
foundations than for private foundations. In fact, only the former need to comply with
the requirements of the PST not to lose their public charity status, while the latter - not
qualifying as public charities - are not subjected to such a constraint.
As for the minimum payout rule, we expect it to establish a direct correlation
between grant-making activities and the size of a foundation’s endowment, since pay-
out requirements are measured precisely against it. In particular, we expect the
correlation between grant-making and endowment to be stronger for private foundations
than for community ones, as the former are subjected to the MPR while the latter are
not (unless they lose their status as public charities). We also expect the MPR rule to
give private foundations strong incentives not to increase grants above the minimum
level stated by the law, and at the same time, to manage effectively their assets, so as
to avoid depleting their endowments after paying out the minimum amount of grants
required by the law. In fact, any ineffective management of their financial assets may
opposed to ‘hot’) in the sense of having no source of new donations and a relatively low rate of asset growth” (Sansing and Yetman, 2006, p. 365).

13
affect the integrity of a foundation’s endowment, jeopardizing its ability to benefit from
a favorable tax treatment. Although our data do not allow us to test how effective
foundations are in managing their financial assets, the descriptive evidence provided in
Section 3 is fully consistent with the idea that private foundations stick to the 5 percent
rule imposed by the MPR.
4.1. The empirical strategy
In order to test our hypotheses we estimate the following log-log model
GRANTSit = β0 + β1ENDOWMENTit + β2DPFi + ∑jβ3jXjit + ∑jβ4jZjit + β5Tt + εit , (1)
where the dependent variable GRANTS is the amount of grants paid annually by each
foundation; ENDOWMENTi is the size of the i-th foundation measured by its total assets;
DPFi is a dummy variable taking value 1 if the i-th foundation is a private foundation and
value 0 in the case of a community foundation; Xit is a vector of covariates capturing the
sources of revenues of the i-th foundation; Zit is a set of dummy variables allowing us to
explicitly control whether the i-th foundation does not have a specific source of income;
finally, Tt is a set of dummy variables for years 2001 to 2006 (with year 2000 as a
reference) that control for time fixed effects.
The set of covariates Xit includes the level of donations raised by a foundation
(DONATIONS), as well as all other sources of income (INCOME). The latter comprises the
total amount of interests and dividends stemming from the management of the
foundation’s assets (INTERESTS), the total amount of rents gained (RENTS), the amount
of capital gains (CAPGAIN) and capital loss (CAPLOSS), and any other positive (OTHER) or
negative income (MINUSOTHER). Descriptive statistics for all the variables used in
empirical analysis are in Appendix Table 1.
In our econometric analysis, we consider two specifications of Equation (1): the first,
in which all sources of income (other than donations) are considered as an aggregate,
and the second, in which different sources of income are separately taken into account.
Given the use of a number of group dummy variables, we do not rely on a fixed-effects
panel specification because of the large correlation between the individual fixed effects
and the group variables, which would result in inefficient estimators. In order to control
for unobserved heterogeneity among foundations, equation (1) is estimated using a
pooled regression model with cluster-corrected standard errors.
14
Equation (1) does not allow to fully disentangling the impact of the different
variables on the grant-making behavior of the two types of foundations we are dealing
with. According to the descriptive evidence discussed in the previous section, one may
in fact conjecture that the size of a foundation influences its granting behavior in ways
that are not directly captured by the endowment coefficient only. Therefore, we enrich
our econometric specification splitting both private and community foundations into
three groups – ‘small’, ‘medium’ and ‘large’ foundations - on the basis of the size of
their endowment. In particular, for each type of foundation, we consider as ‘small’
those with total assets lower than the 25th percentile of their asset distribution, and as
‘large’ those with assets higher than the 75th percentile of their asset distribution. In
order to identify specific effects for the different types of foundations, we define with
DSIZE the set of dummy variables for each group (i.e., DCF-SMALL, DCF-MEDIUM, DCF-
LARGE for, respectively, the small, medium, and large community foundations, as well
as DPF-SMALL, DPF-MEDIUM for the small and medium private foundations, with large
private foundations being used as the benchmark group), and interact them with the
whole set of explanatory variables. This augmented model is described by the following
Equation:
GRANTSit = β0 + β1ENDOWMENTit + ∑k β2kENDOWMENTkit*DSIZEki + ∑jβ3j Xjit +
+ ∑j∑kβ4jkXjkit*DSIZEki + ∑jβ5jZjit + ∑kβ6kDSIZEki + β7Tt + εit.
(2)
We estimate Equation (2) both aggregating all sources of income (other than
donations), as well as considering these sources separately. Finally, as a further
robustness check of our results, we also explore the effects of different thresholds in the
definition of small, medium and large foundations in the estimate of Equation (2).
4.2. Results
Several interesting findings emerge from our econometric exercises. The first is that size
matters, as the amount of grants paid-out by foundations is strongly positively
correlated to the magnitude of their endowments. In the baseline Model (1), in which
we consider all sources of income (other than donations) as an aggregate and control for
the type of foundations, but not for different class sizes, a 1 percent increase in the size
of the endowment is associated with a 0.81 percent increase in grants paid by the

15
foundation; a correlation statistically significant at the 1 percent level (Table 4, model
1).
<Table 4 about here>
Considering again Model (1), but disaggregating the different sources of income
(other than donations), a 1 percent increase in the size of the endowment is associated
with a slightly lower increase (0.67 percent) in the amount of grants paid by the
foundation (Table 5, model 1), again statistically significant at the 1 percent level.
<Table 5 about here>
Controlling both for the type and the size of foundations in Model (2), it appears that
the effect of size (for each class size) is larger for private than for community
foundations. While a 1 percent increase in endowment is associated with a 0.86 percent
increase in grants for large private foundations, this relationship diminishes by 0.16
percent and by 1.08 percent for large and medium sized community foundations,
respectively (Table 4, model 2). Qualitatively equivalent results are obtained when
adopting different definitions of foundations classes, but for the obvious effects that the
alternative thresholds used in these definitions have on medium size foundations (Table
6).
<Table 6 about here>
Analogous results are also obtained when disaggregating the different sources of income
in Model (2), with a 1 percent increase in endowment associated with a 0.74 percent
increase in grants for large private foundations, but only with a 0.29 percent increase
for large community foundations (Table 5, model 2).
Second, we show the existence of a positive correlation between grants and
donations received that, although quantitatively small, is strongly statistically
significant, with a coefficient of 0.03 in our baseline Model (1) (Table 4, model 1) and a
coefficient of 0.04 in the model disaggregating the different sources of income other
than donations (Table 6, model 1). When controlling also for the class size of
foundations, our estimates reveal the existence of a much larger correlation between
donations and grants for medium and large community foundations with respect to the
group of private foundations: a 1 percent increase in donations to large and medium
community foundations is associated with a 0.33 percent and a 0.39 percent increase in
16
grants, respectively, with both coefficient statistically significant at the 1 percent level
(Table 4, model 2). This result is robust to changes in the way we define the class sizes
to which a foundation belongs, as well as to the disaggregation of the sources of income
other than donations. Alternative definitions of class size (Table 5) reveal a stronger
correlation between donations and grants for large community foundations than in the
baseline model, although a weaker (and less significant) correlation for medium size
community foundations. Conversely, when disaggregating the different sources of
income other than donations, the correlation between donations and grants appears to
be stronger for medium than for large sized community foundations (Table 6, model 2)12.
Our findings about the correlation between grants and donations are consistent with the
idea that the world of community foundations is more and more dominated by ‘donor
advised funds’; i.e. money coming from donors that use the community foundation as a
simple and convenient pass-through for their donations, with no intention of building an
endowment of any kind. In this case, the constraint of perpetuity, that influences the
life of many – but not all of - private foundations13, is simply much less present. We may
therefore conclude that, while community foundations directly transfer their donations
to beneficiaries increasing the level of their grants, private foundations (at least the
‘hot’ ones) accumulate donations for future grants, increasing the size of their
endowments. This is also consistent with the idea that the managers of private
foundations compete with their peers on the basis of the size of their endowment; by
spending more than the minimum required by the tax rules, they might risk losing “their
relative standing in the pecking order, as defined by net worth” (Billitteri, 2005, p. 5).
According to the results for all our econometric exercises (Tables 4, 5 and 6, model 2),
small private foundations represent an exception to this behavior, as the correlation
between donations and grants is systematically and significantly larger than that
observed for the benchmark group of large private foundations. This may be due to the
fact that, given the limited size of their endowments, these foundations need to rely on
donations to pay out a significant level of grants.
Turning now to all income sources different from donations we can illustrate a third
set of results, overall indicating a positive relationship between income and grants. In
Model (1), a 1 percent increase in income is associated with a 0.07 percent increase in
grants (Table 4, model 1); a result that is confirmed when splitting the sample into
12 Note that, most likely, the impact of donations on grants would have been even stronger in the absence of the bias towards small community foundations that is inherent in our sample. 13 For a discussion of ‘limited life foundations’, see Ostrower (2009).
17
foundations of different size. In particular, the effect of income on grants is much
stronger for medium size community foundations than in the benchmark, and conversely
it is weaker for small private foundations (Table 4, model 2). Similar results are
obtained when allowing for different definitions of foundations’ classes, net of the
effects induced by alternative thresholds in the definition of medium size foundations
(Table 5, model 2). More refined observations can be made when explicitly splitting
income into its components. Almost all coefficients have the expected positive sign and
are statistically significant at the usual confidence level. In particular, not controlling
for the size of foundations, the coefficient of INTERESTS (one of the important income
sources, net of donations, together with capital gains) indicates that a 1 percent
increase in the amount of interests and dividends is associated with a 0.15 percent
increase in grants paid by a foundation (Table 6, model 1). The interaction of INTERESTS
with class sizes, in Model (2), shows a particularly strong effect of this source of income
for large community foundations, for which a 1 percent increase in INTERESTS is
associated with a 0.37 percent increase in GRANTS. This finding suggests that the simple
picture of a community foundation solely involved in collecting donations from a large
public is somewhat misleading. Large community foundations seem to be actively
involved with asset management, and their grant-behavior turns-out to be sensitive to
the returns of their investments. Moving to the remaining income sources and controlling
for class sizes, Model (2) shows that a 1 percent increase in CAPGAIN is associated with a
0.06 percent increase in grants for the benchmark group of large private foundations.
This effect is even stronger for medium-sized community foundations (with a coefficient
of 0.12) and for small private foundations (0.07). More puzzling results are obtained
when looking at the coefficients on CAPLOSS and MINUSOTHER, which indicate an
unexpected positive correlation between losses and grants. One possible explanation is
that also foundations making losses are forced to pay-out grants in order to comply with
legal regulations (possible by exploiting accumulated reserves).
Finally, interesting implications arise also when focusing on the coefficients of
dummy variables. In particular, when looking at the dummies for the different types of
foundations (Table 6, model 2), it emerges that community foundations have a more
similar granting behavior across sizes than private foundations, a finding that matches
with the descriptive evidence discussed in section 314.
14 Although we do not report them in the paper, we also control for time-effects by means of year dummies, finding that they capture quite closely the impact of the stock market cycle and, in particular,
18
4.3. Discussion
Overall, when not controlling for different groups of foundations defined on the basis of
size (small, medium, large foundations), we find no statistically significant differences
in the grant-making behavior of private and community foundations15, so that one might
think that the impact of fiscal rules on the grant-making behavior of foundations in the
USA is likely to be overstated. However, the picture changes quite radically when
controlling for different groups of foundations based on their size. When doing so, we
show that the grant-making activities of (large and medium-sized) community
foundations are more correlated to donations, while those of (large and medium-sized)
private foundations are more correlated to the size of their endowments (and, to a
smaller extent, also to the level of their income). The differences in the factors
affecting the grant-making behavior of community and private foundations are
consistent with the different regulations to which they are subjected16. Nonetheless,
there appears to be a large heterogeneity in the behavior of both types of foundations,
depending on their size. Two results are particularly interesting. First, when focusing on
grant-making, small community foundations rely less on donations and more on
endowment than large community foundations, in this respect, behaving more similarly
to large private foundations. This may be due to the fact that small community
foundations often still have to build up a solid reputation, which prevents them from
collecting a sufficient amount of donations and consequently forces them to rely on
their endowments to support their grant-making activities. Second, the grant-making of
small private foundations seems to rely more on donations and less on endowment than
that of large private foundations, which makes small private foundations more similar to
community foundations. To make sense of this finding, note first that small private
foundations are, on average, smaller than small community ones (the average level of
assets being about $ 2.2 million for the former and $ 8.5 million for the latter), which
makes it difficult for them to rely on endowment to support grants. Furthermore, small
the climax and the burst of the dot-com bubble, which is not controlled for by the other variables. Interestingly, it appears that different types of foundations responded differently to the burst of the bubble. 15 The dummy variable for private foundations in model (1) of Table 4 is not statistically significant at the usual levels. 16 The PST - by requiring community foundations to receive yearly donations for at least one-third of their aggregate income in order to maintain the status of public charity - establishes an immediate link between donations and grant-making activities. Analogously, the MPR - by requiring all private foundations to distribute approximately 5 percent of its assets yearly in charitable grants – establishes a clear link between grants and endowment for this type of foundations.

19
private foundations are often either corporate foundations, or single donor foundations
still building up their endowments. In the first case, the grant-making activity is almost
entirely financed by the annual donations made by the parent company. In the second
one, it is supported by the occasional donations made by the founder that are typically
targeted – at least partially - to new grants.
The USA regulator has so far concentrated on regulatory schemes building on the
nature of public charity (for community foundations) or private foundation of the
different institutions performing the same grant-making activity, imposing to pass the
public support test to the former and to comply with the minimum payout requirement
to the latter. The large heterogeneity in the grant-making behavior of both private and
community foundations belonging to different class sizes - documented above - suggests
a further dimension for regulation, complementing the regulatory approach based on the
nature of the foundation with one that also appropriately takes into account other
characteristics (related to size) that impact on grant-making. In fact, it is important to
underline that the differences among foundations belonging to distinct class sizes
captured by our econometric specifications may indeed reflect the existence of relevant
characteristics that are not captured in our dataset, which also have an effect on size.
The discussion above on corporate and “single-donor” foundations well exemplifies the
importance of the issue17. In this respect, our analysis points to the need for a more
refined regulatory approach, although size may not be the best indicator on which such
a finer regulation should be based. More research and additional data are needed to
identify the fundamental characteristics of a foundation that may be used as a guide for
the regulator.
5. Conclusions
In the USA, the legislator awards fiscal privileges to grant-making institutions to the
extent that they operate in the ‘public interest’. To guarantee that these institutions
effectively contribute to social welfare, they are subjected to specific forms of
regulations. In this paper, we show that the regulatory approach followed by the USA
17 For instance, corporate foundations – treated as private foundations by the law and typically with a small endowment – can legally distribute only a limited amount of grants to charitable activities. This allows parent corporations to use a non-negligible share of the donations made to their foundations to distribute perks. This indicates that the minimum payout requirement may not be an effective device for this type of foundations to foster grant-making activities, suggesting the opportunity of different kinds of regulations (e.g., requiring them to distribute a large share of the donations received by their parent corporations).
20
legislator is successful in influencing the behavior of grant-making foundations, which
appear to respond to the different incentives induced by the PST support test and the
MPR, the two fundamental regulatory tools. In fact, on the one hand, the amount of
grants paid by large and medium private foundations - subjected to the MPR - is
positively correlated with the size of their endowment and (although to a more limited
extent) with the level of their income. On the other hand, the grants made by
community foundations - subjected to the PST - are positively correlated with the level
of donations they collect. Nonetheless, and perhaps more interestingly, our empirical
analysis also shows that other characteristics of grant-making institutions (proxied here
by the size of their endowments) seem to impact on their behavior, and may therefore
be exploited to devise more refined regulatory schemes, complementing - or, in some
cases, even substituting - the traditional regulatory approaches discussed above.
The lessons learnt from the analysis of the US case may be helpful in guiding the
action of the regulators in other countries, where there is not an established regulatory
tradition of grant-making foundations. Although grant-making foundations - an
archetypical American institution - were traditionally not so common outside the USA,
they are now spreading in continental Europe and in other regions as a consequence of
different developments (such as privatization processes, inter-generational transfers of
wealth, and reductions in public expenditures for the welfare state)18. While valuable
from an economic point of view19, quite often these foundations – because of lack of
tradition - operate in legal and fiscal environments not as developed as the North
American one. Therefore, while many of them benefit from a favorable fiscal treatment
(that is costly for the public purse), not so many of them are the object of careful
scrutiny regarding the benefits they create for their communities.
The experience of the USA suggests that quantitative and automatic regulatory
mechanisms such as those implied by the public support test and the minimum payout
requirement - although overall well-functioning, relatively inexpensive, and easy to
implement (and therefore quite attractive) – could fail capturing some characteristics of
foundations that may bear a significant impact on their grant-making behavior. This
18 Examples of this burst of new grant-making institutions are the foundations of banking origin (created in Italy, New Zealand, and Austria) as a result of the transformation of the former savings-banks, or the many new community foundations – relevant welfare players at the local level - created in England, Italy, Germany and the countries of the former Soviet Union. 19 For example, the 88 Italian foundations of banking origin boast an aggregate assets level of about € 50 billion, more than 54 percent of the whole assets of the 5,000 Italian foundations.
21
suggests that an effective regulatory approach should not abstract from a careful
analysis of the nature and of the institutional features of the foundations under scrutiny.
References
Andrews F.E. (1956). Philanthropic foundations. New York: Russell Sage Foundation.
Anheier H.K. and Toepler S. (1999). Philanthropic foundations. An international prespective, in Anheier H.K. and Toepler S. (eds.), Private funds, public purpose. Philanthropic foundations in international perspective. New York: Kluwer.
Bater P. and Habighorst O. (2001). Tax treatment of foundations and their donors, in Schluter A., Then V. and Walkenhorst P. (eds.), Foundations in Europe. Society, management and law. London: The Directory of Social Change.
Billitteri T.J. (2005). Money, mission, and the payout rule: in search of a strategic approach to foundations spending. The Aspen Institute, Working paper series.
Cambridge Associates Inc. (2000). Sustainable payout for foundations. Grand Haven (Michigan): The Council of Michigan Foundations.
Deep A. and Frumkin P. (2006). The foundation payout puzzle, in Damon W.V.B. and Verducci S. (eds.), Taking Philanthropy seriously. Bloomington (Indiana): Indiana University Press.
DeMarche Associates (1999). Spending policies and investment planning for foundations: a structure for determining a foundation's asset mix. Washington, DC: Council on Foundations.
Foundation Center, (various years), Foundations growth and giving estimate, Current report. The Foundation Center.
Foundation Center, (2011), Key facts on community foundations. The Foundation Center.
H.M. Government (2010). Giving. Green paper. Available from the UK Government website at www.cabinetoffice.gov.uk
Hopkins B.R. (2007). The law of tax-exempt organizations. Hoboken (NJ): John Wiley and Sons.
Kogelman S. and Dobler T.A. (1999). Sustainable spending policies for endowments and foundations. New York (NY): Goldman Sachs.
IRS (various years). SOI tax Stats. Available from the IRS website at: http://www.irs.gov/taxstats/charitablestats/article/0,,id=96996,00.html#4
Marsh, T. D. (2002). A dubious distinction: rethinking tax treatment of private foundations and public charities. Virginia Tax Review, 22, p. 137-186.
Mehrling P. (1999). Spending policies for foundations: the case for increased grants payout. San Diego (CA): National Network of Grantmakers.
Ostrower F. (2009). Limited life foundations. Motivations, experiences and strategies. Washington (DC): The Urban Institute Center on Nonprofts and Philanthropy.
Sansing R. and Yetman R. (2006). Governing private foundations using the tax law. Journal of Accounting and Economics, 41, p. 363-384.

22
Steuerle E. (1977). Payout requirements for foundations, in Public Commission on Private Philanthropy and Public needs, Research Papers, Vol. III, p. 1663-1678. Washington: Department of the Treasury.
Steuerle E. and Sullivan M.A. (1995). Toward a more simple and effective giving: reforming the tax rules for charitable contributions and charitable organizations, in American Journal of Tax Policy, 12, N. 2. p. 399-447.
Toepler S. (2004). Ending payout as we know it: a conceptual and comparative perspective on the payout requirement for foundations. Nonprofit and Voluntary Sector Quarterly, 33, p. 729-738.
Troyer T. (2000). The 1969 private foundation law: historical perspective on its origin and underpinning. The Exempt Organization Tax Review, 27, 52-65.

23
Tables Table 1a: population and SOI sample size for organizations filing forms 990-PF (Private Foundations)
Tax Year
All Forms 990-PF Excluded from the sample Final sample
Population count
SOI sample count
Nonexempt Charitable Trusts
Private foundations excluded based on rules a)-d)
2000 72,605 8,202 966 955 6,281 2001 75,643 6,465 821 697 4,947 2002 79,333 6,301 794 1,038 4,469 2003 81,962 10,537 3,235 1,333 5,969 2004 84,216 11,451 3,646 1,000 6,805 2005 86,896 12,003 3,759 1,074 7,170 2006 88,886 12,741 3,629 1,190 7,922
Source. Own elaborations based on IRS data available at: http://www.irs.gov/taxstats/charitablestats/article/0,,id=212357,00.html Table 1b: population and SOI sample size for organizations filing forms 990 (Community Foundations)
Tax Year
All Forms 990 Excluded from the sample
Final sample Population count
SOI sample Count
2000 233,816 16,353 16,277 76 2001 244,129 17,003 16,922 81 2002 255,732 17,569 17,491 78 2003 267,490 14,415 14,372 43 2004 279,415 15,070 15,007 63 2005 290,094 15,862 15,796 66 2006 305,133 16,872 16,796 76
Source. Own elaborations based on Foundation Center (various years) and IRS data available at: http://www.irs.gov/taxstats/charitablestats/article/0,,id=212608,00.html Table 2: Sample size as a percentage of total population Year Community foundations Private foundations Total
foundations in sample (absolute values)
Number (%)
Endowment (%)
Grants paid (%)
Number (%)
Endowment (%)
Grants paid (%)
2000 13.6 26.2 26.6 11.3 61.0 56.8 6,357 2001 13.5 25.7 24.6 8.4 61.5 58.1 5,028 2002 11.8 21.8 18.8 7.3 59.4 56.1 4,547 2003 6.2 18.6 17.9 9.2 62.8 58.4 6,012 2004 9.0 23.4 18.2 10.7 65.0 64.0 6,868 2005 9.3 21.9 18.8 10.6 69.5 64.2 7,236 2006 10.6 28.0 29.7 11.5 68.3 62.1 7,998
Source. Own elaborations.

24
Table 3: Summary statistics (million $) Type of foundation
Observations (number) Mean Median Std. Dev. Min Max
Endowment
Community 483 127 55 227 1 2,040 Private 43,563 50 15 399 0 32,800
Grants paid Community 483 9 3 19 0 232 Private 43,563 3 1 17 0 1,570
Donations received Community 483 12 5 21 0 228 Private 43,563 2 0 25 0 3,690
Total income (w/out donations) Community 483 6 1 14 -17 146 Private 43,563 3 1 30 -401 2,250
Source. Own elaborations.

25
Table 4: the determinants of GRANTS (donations and other income (aggregated))
Model 1 Model 2 (threshold 25%, 75%) Coefficient Robust SE Coefficient Robust SE ENDOWMENT .81*** .01 .86*** .02
ENDOWMENT*DCF-Small -.40 .55 ENDOWMENT*DCF-Medium -1.08*** .26 ENDOWMENT*DCF-Large -.16* .09 ENDOWMENT*DPF-Small -.21*** .03 ENDOWMENT*DPF-Medium .02 .03
DONATIONS .03*** .004 .04*** .004 DONATIONS*DCF-Small .03 .02 DONATIONS*DCF-Medium .39*** .14 DONATIONS*DCF-Large .33*** .05 DONATIONS*DPF-Small .02*** .002 DONATIONS*DPF-Medium .001 .001
INCOME .07*** .01 .08*** .02 INCOME*DCF-Small .03 .09 INCOME*DCF-Medium .74*** .15 INCOME*DCF-Large -.02 .06 INCOME*DPF-Small -.05** .02 INCOME*DPF-Medium .03* .02
MINUS-INCOME .08*** .01 .08*** .02 MINUS-INCOME*DCF-Small .03 .08 MINUS-INCOME*DCF-Medium .75*** .16 MINUS-INCOME*DCF-Large .02 .06 MINUS-INCOME*DPF-Small -.04** .02 MINUS-INCOME*DPF-Medium .03* .02
NO-DONATIONS .69*** .11 1.02*** .12 NO-INTERESTS 1.69*** .30 1.06*** .23 NO-RENTS .20*** .03 .22*** .03 NO-CAPGAIN .14*** .04 .07** .03 NO-CAPLOSS .10*** .04 .0003 .04 NO-OTHER -.02 .01 -.001 .01 NO-MINUSOTHER -.04* .02 -.02 .02 DPF -.03 .12 DCF-Small 5.89 8.51 DCF-Medium 13.12*** 4.21 DCF-Large -2.04 1.60 DPF-Small 2.94*** .53 DPF-Medium -.34 .55 CONSTANT -.47* .24 -1.35*** .38 Year dummies Yes Yes N. obs. 44046 44046 R-squared .72 .73 F 1030.12 1474.49 Prob > F .000 .000
All variables in log Significance levels: *>90%; **>95%; ***>99% Robust standard errors adjusted for 10086 clusters

26
Table 5: the determinants of GRANTS (donations and all sources of income) Model 1 Model 2 (threshold 25%, 75%) Coefficient Robust SE Coefficient Robust SE ENDOWMENT .67*** .018 .74*** .022
ENDOWMENT*DCF-Small -.47 .433 ENDOWMENT*DCF-Medium -.32 .237 ENDOWMENT*DCF-Large -.45*** .134 ENDOWMENT*DPF-Small -.23*** .031 ENDOWMENT*DPF-Medium .03 .030
DONATIONS .04*** .004 .04*** .004 DONATIONS*DCF-Small .04 .029 DONATIONS*DCF-Medium .51* .287 DONATIONS*DCF-Large .34*** .051 DONATIONS*DPF-Small .02*** .002 DONATIONS*DPF-Medium .001 .001
INTERESTS .15*** .014 .15*** .013 INTERESTS*DCF-Small -.0008 .017 INTERESTS*DCF-Medium .12 .140 INTERESTS*DCF-Large .22** .104 INTERESTS*DPF-Small -.02 .013 INTERESTS*DPF-Medium -.02 .015
RENTS .03*** .010 .02** .009 RENTS*DCF-Small -.08 .069 RENTS*DCF-Medium .003 .009 RENTS*DCF-Large .002 .004 RENTS*DPF-Small .0001 .005 RENTS*DPF-Medium -.002 .002
CAPGAIN .08*** .005 .06*** .005 CAPGAIN*DCF-Small .002 .020 CAPGAIN*DCF-Medium .06* .031 CAPGAIN*DCF-Large -.003 .011 CAPGAIN*DPF-Small .01*** .004 CAPGAIN*DPF-Medium .002 .003
CAPLOSS .06*** .005 .04*** .006 CAPLOSS*DCF-Small .03 .025 CAPLOSS*DCF-Medium .06* .034 CAPLOSS*DCF-Large -.0004 .012 CAPLOSS*DPF-Small .01*** .004 CAPLOSS*DPF-Medium .001 .003
OTHER .02*** .004 .01*** .004 OTHER*DCF-Small .04* .022 OTHER*DCF-Medium .02 .019 OTHER*DCF-Large .0004 .004 OTHER*DPF-Small .007*** .002 OTHER*DPF-Medium .003*** .001
MINUSOTHER .01* .008 .004 .008 MINUSOTHER*DCF-Small .07*** .022 MINUSOTHER*DCF-Medium -.04 .059 MINUSOTHER*DCF-Large .001 .007 MINUSOTHER*DPF-Small .003 .004 MINUSOTHER*DPF-Medium .002 .002
NO-DONATIONS .90*** .114 1.14*** .117 NO-INTERESTS 4.06*** .404 3.53*** .359 NO-RENTS .81*** .227 .61*** .22 NO-CAPGAIN 2.14*** .132 1.80*** .121 NO-CAPLOSS 1.53*** .142 1.28*** .148 NO-OTHER .49*** .080 .37*** .084 NO-MINUSOTHER .31* .186 .13 .202 DPF .01 .119 DCF-Small 6.65 5.99 DCF-Medium -4.38 4.093 DCF-Large -0.29 1.379 DPF-Small 3.39*** .419 DPF-Medium -.84* .450 CONSTANT -2.55*** .205 -3.07*** .281 Year dummies Yes Yes N. obs. 44046 44046 R-squared .73 .74 F 1525.20 1048.68 Prob > F .000 .000
All variables in log Significance levels: *>90%; **>95%; ***>99% Robust standard errors adjusted for 10086 clusters

27
Table 6: the determinants of GRANTS (donations and other income (aggregated), different size thresholds) Model 2 (threshold 10%, 90%) Model 2 (threshold 30%, 70%) Coefficient Robust SE Coefficient Robust SE ENDOWMENT .84*** .04 .86*** .02
ENDOWMENT*DCF-Small .05 .43 -1.23*** .38 ENDOWMENT*DCF-Medium -.78** .30 -.17 .22 ENDOWMENT*DCF-Large -.01 .11 -.12 .09 ENDOWMENT*DPF-Small -.34*** .05 -.17*** .03 ENDOWMENT*DPF-Medium .04 .04 -.007 .04
DONATIONS .04*** .004 .04*** .004 DONATIONS*DCF-Small .01 .02 .07*** .02 DONATIONS*DCF-Medium .29* .15 .25* .14 DONATIONS*DCF-Large .40*** .05 .34*** .06 DONATIONS*DPF-Small .03*** .003 .01*** .002 DONATIONS*DPF-Medium .001 .001 .002 .001
INCOME .10*** .03 .08*** .01 INCOME*DCF-Small .02 .09 .74*** .17 INCOME*DCF-Medium .64*** .19 .11 .12 INCOME*DCF-Large -.002 .08 -.04 .05 INCOME*DPF-Small -.07** .04 -.05** .02 INCOME*DPF-Medium -.01 .03 .04** .02
MINUS-INCOME .10*** .03 .08*** .01 MINUS-INCOME*DCF-Small -.01 .09 .75*** .17 MINUS-INCOME*DCF-Medium .65*** .20 .12 .13 MINUS-INCOME*DCF-Large .006 .08 -.04 .05 MINUS-INCOME*DPF-Small -.07* .04 -.04** .02 MINUS-INCOME*DPF-Medium -.009 .03 .04** .02
NO-DONATIONS 1.07*** .12 .97*** .12 NO-INTERESTS .85*** .22 1.15*** .24 NO-RENTS .23*** .03 .22*** .03 NO-CAPGAIN .07** .03 .08** .04 NO-CAPLOSS -.01 .04 .008 .04 NO-OTHER .006 .01 -.002 .01 NO-MINUSOTHER -.02 .02 -.03 .02 DCF-Small -1.11 6.48 19.68*** 5.98 DCF-Medium 9.13** 3.78 -.77 5.10 DCF-Large -6.27*** 1.76 -2.96** 1.23 DPF-Small 4.50*** .87 2.49*** .47 DPF-Medium -.62 .72 .09 .67 CONSTANT -.99 .69 -1.30*** .34 Year dummies Yes Yes N. obs. 44046 44046 R-squared .73 .73 F 1558.30 1483.20 Prob > F .000 .000
All variables in log Significance levels: *>90%; **>95%; ***>99% Robust standard errors adjusted for 10086 clusters

28
APPENDIX TABLE 1: Summary statistics
Variable Observations
(number) Mean Std. Dev. Min Max GRANTS 44,046 2,861,057 16,800,000 0 1,570,000,000 ENDOWMENT 44,046 50,900,000 397,000,000 28 32,800,000,000 DONATIONS 44,046 2,191,085 24,700,000 0 3,690,000,000 INTERESTS 44,046 1,197,152 11,600,000 0 1,240,000,000 RENTS 44,046 40,519.75 632,699.6 0 64,700,000 CAPGAIN 44,046 2,158,351 20,400,000 0 1,280,000,000 CAPLOSS 44,046 267,348.8 3,266,175 0 417,000,000 OTHER INCOME 44,046 215,711.3 3,093,682 0 362,000,000 MINUSOTHERINCOME 44,046 22,989.22 394,293.4 0 29,800,000
Source. Own elaborations.
29
Figures
Figure 1a: ratio between Grants paid and Total Assets
0.0
5.1
.15
2000 2001 2002 2003 2004 2005 2006 2000 2001 2002 2003 2004 2005 2006excludes outside values excludes outside values
Community Private
Gra
nts
/ ass
et R
atio
Figure 1b: ratio between Grants paid and Total Assets (cross-section)
0.0
5.1
.15
.2
1 2 3 4 5 1 2 3 4 5excludes outside values excludes outside values
Community Private
Gra
nts
/ as
set R
atio
Graphs by Foundation type
30
Figure 2a: ratio between Income (excluded donations) and Total Assets
-.1
0.1
.2
2000 2001 2002 2003 2004 2005 2006 2000 2001 2002 2003 2004 2005 2006excludes outside values excludes outside values
Community Private
Inco
me
(don
atio
ns e
xclu
ded)
/ a
sset R
atio
Figure 2b: ratio between Income (excluded donations) and Total Assets (cross-section)
-.1
0.1
.2
1 2 3 4 5 1 2 3 4 5excludes outside values excludes outside values
Community Private
Inco
me
(dona
tions
exc
luded)
/ as
set R
atio
Graphs by Foundation type
31
Figure 3a: ratio between Donations and Total Assets 0
.1.2
.3.4
.5
2000 2001 2002 2003 2004 2005 2006 2000 2001 2002 2003 2004 2005 2006excludes outside values excludes outside values
Community Private
Don
atio
ns r
eceiv
ed / a
sset R
atio
Figure 3b: ratio between Donations and Total Assets (cross-section)
0.2
.4.6
.8
1 2 3 4 5 1 2 3 4 5excludes outside values excludes outside values
Community Private
Don
atio
ns r
ecei
ved /
ass
et R
atio
Graphs by Foundation type