the impact of financial difficulties on earnings
TRANSCRIPT

Vol. 14(11), pp. 511-528, November, 2020
DOI: 10.5897/AJBM2020.9105
Article Number: 28992BB65450
ISSN: 1993-8233
Copyright© 2020
Author(s) retain the copyright of this article
http://www.academicjournals.org/AJBM
African Journal of Business Management
Full Length Research Paper
The impact of financial difficulties on earnings management strategies: The case of Italian
non-listed firms
Gaetano Matonti1*, Aurelio Tommasetti1, Carlo Torre1 and Jon Tucker2
1Dipartimento di Scienze Aziendali - Management and Innovation Systems, University of Salerno, 132, Giovanni Paolo II
Street, 84084 Fisciano (SA), Italy. 2Faculty of Business and Law, University of the West of England, United Kingdom.
Received 4 September, 2020; Accepted 29 October, 2020
This study investigates the impact of the degree of financial distress on the earnings management activities of Italian non-listed firms using a linear regression model proxied by the Altman Z-Score which controls the heteroscedasticity and autocorrelation using the Petersen method. The extant literature provides mixed evidence on this relationship for listed firms. In this study we find a positive (negative) relationship between financial distress risk and income-decreasing (income-increasing) earnings management, suggesting that firms tend to manage earnings downward as financial distress risk increases. In two robustness tests, we test the power of the Kothari model and we also analyse a reduced firm sample representing over 80% of the population, though the results are qualitatively the same. Our research has several implications for academics, practitioners, lenders, and national standard setters, showing that, in contrast to the extant literature, non-listed firms are more likely to manage earnings downward as their financial situation deteriorates. Furthermore, our findings are of interest to national standard setters and professional accountants who are concerned with advanced warning indicators of firm financial problems such as Altman’s Z-score, especially in recent years in which countries are focused on developing robust empirical models to detect firm financial difficulties. Key words: Financial distress, Altman’s Z-score, accrual-based earnings management, non-listed firms, Italian context.
INTRODUCTION
Financial information plays an important role in mitigating agency problems between firm owners and lenders and other creditors who are concerned with the real financial performance of firms that they currently or potentially provide with finance. Where financial performance deteriorates, firms run the risk of having to repay lenders
and creditors early, thereby reducing their borrowing capacity (Mafrolla and D’Amico, 2017). As a consequence, when firms experience financial difficulties, this may create an incentive for firms to mask poor financial performance by managing earnings upward. Dechow et al. (2010) finds that firms experiencing
*Corresponding author. E-mail: [email protected]. Tel: +39 3407438751.
JEL Classification: M41.
Author(s) agree that this article remain permanently open access under the terms of the Creative Commons Attribution
License 4.0 International License

512 Afr. J. Bus. Manage. financial distress are more likely to manage earnings upward, while DeAngelo et al. (1994) find that firms close to failure as the last stage of financial distress (Nagar and Sen, 2016) are likely to be more conservative than non-stressed firms. Therefore, managers of listed firms may adjust their earnings management strategy according to their proximity to technical default.
When listed firms run a lower risk of financial distress, managers are more likely to manage earnings opportunistically (upward) in order to mask weak financial performances. However, for firms close to bankruptcy as the final stage of financial distress (Habib et al., 2013; Nagar and Sen, 2016), their managers become more conservative and less opportunistic in the preparation of financial information (DeAngelo et al., 1994).
These findings indicate that financial distress impacts on the earnings management strategies of listed firms because it enables them to meet or beat analysts’ forecasts. Opler and Titman (1994) find that US listed firms take actions that impact positively yet temporarily on operating income in the years approaching financial distress.
Mafrolla and D’Amico (2017), analysing a sample of Italian, French and Spanish non-listed firms, provide empirical evidence that the Basel II regulations, enacted from 2008, increase borrowers’ incentives to engage in (income-increasing) earnings management to improve their creditwothiness and their borrowing capacities, since the financial statements of borrowers are deeply scrutinised by lenders in order to assess their ability to repay loans.
However, there is a paucity of literature concerning the relationship between financial distress risk and earnings management behaviour in non-listed firms.
In the extant literature, to our best knowledge, only Campa (2019) investigates earnings management initiatives in both listed and non-listed firms experiencing financial difficulties, and finds that French firms of both type are likely to manage earnings downward as financial difficulties worsen. Unfortunately, the findings of Campa’s research do not provide evidence on the impact of financial distress on the earnings management incentives of non-listed firms as they only compare the earnings management strategies of listed and non-listed firms experimenting financial difficulties.
Therefore, since Italian firms are financed mainly by bank loans, the aim of this research is to investigate if a deterioration in the financial situation of Italian non-listed firms impacts on their earnings management initiatives. More specifically, we investigate whether managers of distressed firms are likely to engage in income-decreasing earnings management, according to the Jensen (1986) control hyptothesis, or in income-increasing earnings management initiatives, consistent with the debt hypothesis (Watts and Zimmerman, 1986).
Our research is grounded firmly in the extant literature and contributes to that literature by examining the link
between financial distress risk and earnings management which is underdeveloped in the context of non-listed firms. Our paper focuses on non-listed firms as they constitute the vast majority of firms in the European Union (EU, 2019), and around 99.8% of firms in Italy. The focus is on firms experiencing financial problems, rather than firms facing bankruptcy, as financial distress does not necessarily lead to bankruptcy (Habib et al., 2013). The context is interesting as Italian non-listed firms predominantly employ debt rather than equity to finance their operations (Poli, 2013a; Poli, 2015), and therefore such firms could have incentives to mask poor financial performance otherwise their access to credit may be impaired. Our research should provide some context for both academics and practitioners when analysing the reliability of financial information in Italian non-listed firms suffering from financial distress risk. To assess financial distress risk, we employ Altman’s Z-Score, the validity of which is confirmed by Altman et al. (2017), and this established approach is employed extensively in the empirical literature (Habib et al., 2013; Nagar and Sen, 2016; Campa, 2019). Our findings suggest that increasing financial distress risk leads to greater income-decreasing earnings management, indicating that firms in technical default are more likely than healthy firms to managing their earnings downward.
LITERATURE REVIEW AND HYPOTHESIS DEVELOPMENT
Financial difficulties and earnings management
According to agency theory (Jensen and Meckling, 1976), managers of financially distressed firms may engage in earnings management initiatives to mask poor financial performance, threatening the interests of the firm’s creditors and lenders (Panda and Leepsa, 2017). The extant literature (DeFond and Jimbalvo, 1994; DeAngelo et al., 1994; Beneish and Vargus, 2002) suggest that financial distress risk may impact on earnings management behaviour, thereby impacting the manager’s accounting choices and the quality of financial information.
The extant literature investigates whether the degree of financial distress impacts on earnings management initiatives and employs a variety of proxies for financial distress. Some authors investigate this relationship in the case of those firms violating debt covenants as they are likely to be in financial distress (Gilson, 1989). DeFond and Jimbalvo (1994) find that US listed firms manage their earnings upward in the year before a costly debt covenant violation. Further, Sweeney (1994) finds that US listed firms violating debt covenants are more likely to engage in earnings overestimation to improve short-term cash flows and firm performance in order to avoid technical default. Dichev and Skinner (2002) argue that the direction of the earnings manipulation

(underestimation or overestimation) depends on the severity of the financial difficulties. In a sample of US listed firms, they find that a large proportion just meet the covenant threshold, indicating that these firms manage earnings to avoid the expensive debt covenant violations. Jha (2013) finds that US listed firms experiencing temporary financial distress manage their earnings upward in order to avoid debt covenant violations that may be costly for them.
Smith et al. (2001) study Australian listed firms using a multi-dimensional measure of financial distress and cluster firms into three groups, failing, distressed and healthy. They find that distressed non-failing firms are more likely to manage their earnings upward than non-distressed firms, while distressed firms filing for bankruptcy are less likely to engage in income increasing earnings management than other firms. Their findings are consistent with DeAngelo et al. (1994) who find that stressed firms are more likely to reveal their weak financial performance to stakeholders in order to renegotiate their debt on better terms and signal to stakeholders the manager’s willingness to deal with these problems. Further, they argue that managers have an incentive to manage earnings downward in the case of close auditor and lender monitoring. However, Garcia Lara et al. (2009) find that UK failed firms manage earnings upward up to four years in advance of bankruptcy in order to mask weak performance, and that such firms use real activity-based earnings management where accruals-based earnings management is less effective or is complex to action (Nagar and Sen, 2016).
Some studies in the extant literature use firm bankruptcy as the signal of financial distress. Rosner (2003) studies failed US firms and finds that they manage earnings upward in the five years leading up to bankrupty. Charitou et al. (2007a, b) find that the managers of stressed US firms underestimate earnings in the period before they become bankrupt, providing evidence that firms close to failure are more likely to manage earnings downward than healthy firms due to the pressure exerted by auditors or lenders. Bisogno and De Luca (2015) find that Italian SMEs experiencing financial difficulties are more likely to manage earnings upward because of the need to obtain new funding from lenders. Nagar and Sen (2016) find that in their initial stages of distress, Indian listed firms are likely to cut indirect (SG&A) expenses, and when the distress becomes more severe, they increase such expenses while managing earnings upward instead by manipulating discretionary accruals. Their findings indicate that the type of earnings management behavior reflects the degree of financial distress.
The literature identifies a range of alternative proxies for financial distress. Habib et al. (2013) uses three different proxies for financial distress in a study of New Zealand listed firms: negative net income; current year working capital, where distressed firms are those
Matonti et al. 513 exhibiting negative working capital in a given year; and a combined variable for firms showing negative net income and working capital. They find evidence that firms manage their earnings both upward and downward, and that distressed firms have lower leverage than their non-distressed counterparts, the latter indicating that higher leverage may not be a key driver of financial distress.
Finally, many studies employ Altman’s Z-Score as a proxy for financial distress. This measure is a linear combination of five key business ratios, weighted by coefficients, thereby producing a more encompassing indicator of financial distress (Altman et al., 2017; Lubawa and Loungrath, 2016). Agrawal and Chatterjee (2015) investigate Indian listed firms classified as exhibiting either low or high distress risk according to Altman’s Z-score. Their findings are interesting as they find that low-distress risk firms are more likely to manage their earnings upward than their higher distress risk counterparts, consistent with Jaggi and Lee (2002), who explain that while low distress firms try to mask weak financial performance (as managers hope their financial problems are temporary), the managers of highly distressed firms are likely to more honestly reflect their financial problems in order to restructure or renegotiate the firm’s debts. Therefore, the earnings management behaviour of financially distressed firms depends on the severity of financial distress. Hypothesis development The extant literature provides evidence that managers of distressed firms may engage in income-increasing and income-decreasing earnings management initiatives depending on the incentives to do so. These two earnings management practices are consistent with the debt hypothesis (Watts and Zimmerman, 1986) and the control hypothesis (Jensen, 1986), respectively. We know that non-listed firms are more likely to be financed by bank debt than listed firms (Van Tandeloo and Vanstraelen, 2008; Mafrolla and D’Amico, 2017), therefore, managers of these firms have an incentive to manage earnings upward to improve their financial performance and meet lenders’ forecasts and expectations. However, Basel II regulations have facilitated banks’ abilities to use software technology (Mafrolla and D’Amico, 2017) in order to estimate borrower creditworthiness (rating) based on both qualitative and quantitative borrowing information, including accounting information. Therefore, it is argued that banks have strengthened their monitoring and scrutiny role in assessing the borrowing capacity of their clients, expecially for those firms in financial difficulties. As a consequence, the managers of these firms are less likely to manage earnings downward, since accrual-based earnings management is a technique easily detectable by outsiders (Cohen et al., 2008). In this case,

514 Afr. J. Bus. Manage.
Table 1. Sample firms (observations over the period 2009-2017).
Code Description Freq. % Number of firms
1 Mining, Quarrying, Agriculture, forestry and Fishing 540 0.62 60
2 Manufacturing 44,802 51.19 4,978
3 Water supply, electricity, gas 3,150 3.60 350
4 Construction, real estate activities 5,778 6.60 642
5 Wholesale and retail trade, transportation and services 29,025 33.16 3,225
6 Information and communication 2,736 3.13 304
7 Healthcare and social works 1,494 1.71 166
Total 87,525 100% 9,725
earnings management may be very costly for the firm because it erodes its relationship with lenders, thereby reducing their trust in the firm. Consistent with the control hypothesis (Jensen, 1986), we propose the following hypothesis: Italian non-listed firms experiencing financial problems are more likely to engage in income-decreasing earnings management initiatives than healthy firms. RESEARCH METHODOLOGY
Sample selection
For the purposes of this study, all accounting, financial market, and corporate governance data are collected from the Bureau van Dijk Aida Database for the period 2009 to 2017. The AIDA Database covers 10 years, therefore when the data was collected 2008 was the first sample year available for analysis, while 2017 was the last. The year 2008 is used to calculate the change in some of the study variables, therefore our first sample year is 2009. The data consists of Italian non-listed stock corporations that, according to Italian civil law, are not obliged to prepare consolidated financial statements, and which have equity capital exceeding a threshold of €120,000. Consistent with these criteria, the population available in the database is 437,949 firms. From the population we exclude limited liability companies to address missing data issues, along with finance industry firms given the non-standard format of their financial statements and regulatory status, and firms filing simplified financial statements as they are not obliged to report certain financial information. After eliminating firms with insufficient data for the estimation of the variables in our empirical models, the final sample consists of a balanced sample of 9,725 non-listed firms, giving a total of 87,525 firm-year observations over the nine year sample period of 2009 to 2017. The use of a balanced firm sample allows us to include all active firms during the sample period. The number of firms in each industry is given in Table 1 along with their two-digit NACE industry code membership.
Table 1 shows that the sample firms available in the database are composed mainly of manufacturing firms (51.19% of sample firms) and by wholesale, retail, transportation and service sector firms (33.16% of sample firms). These firms represent around 85%
of the sample, consistent with the wider Italian economy at the end of 2017, as noted by the Italian Institute of Statistics (ISTAT, 2018). Identifying firms in financial difficulty
As discussed earlier, the literature identify several proxies for financial distress, including: debt covenant violation (DeFond and Jimbalvo, 1994; Jha, 2013); persistent loss occurrence (DeAngelo et al., 1994); bankruptcy status (Rosner, 2003; Garcia-Lara et al., 2009; Bisogno and De Luca, 2015); Ohlson’s O-score default prediction model (Ranjbar and Farsad Amanollahi, 2018); firm free cash flows (Mohammadi and Amini, 2016); the Fich and Slezak (2008) ratio (Campa, 2019); and Altman’s Z-Score (Agrawal and Chatterjee, 2015; Nagar and Sen, 2016; Campa, 2019), the latter used widely in the literature.
We do not use debt covenant violation as a proxy for the status of financial distress for two reasons. First, in Italy debt covenant information is not readily available as it is not mandatory and thus not shown in the financial reporting information. Second, Dichev and Skinner (2002) criticise the use of debt covenant violation as a proxy for financial distress as firms not violating debt covenants may also fail. Further, we do not use bankruptcy status as a proxy for financial distress as the data is not available on the Aida Database. Finally, we do not employ the indicators used in only a minority of studies, particularly given that the results of such studies are in any case similar to those using more standard proxies of financial distress. Our focus is therefore on the Altman Z-Score measure given its wide use and confirmed validity in predicting a firm’s financial distress in non-listed firms (Altman and Hotchkiss, 2006; Altman et al., 2017). We argue that it provides a strong proxy for firm financial distress. This study employed Altman’s Z-Score as a proxy for financial distress for at least two reasons, consistent with Altman et al. (2017). First, the model is used not only to predict firm bankruptcy but also wider firm financial difficulties. Second, the measure uses accounting rather than market data and is therefore suitable for non-listed firms. Third, it is more widely accepted, understood and established as the primary measure of financial distress risk in the extant literature (Bisogno et al., 2018). Agrawal and Chatterjee (2015) note that Altman’s Z-Score (hereafter, Z-Score) is a score of the overall financial health of a firm based on its available accounting data. It is composed of five indicators drawn from the financial statements of non-listed firms. Altman’s original Z-Score (1968) model is parameterized as given in Equation 1:
(1) where Z= Overall Index or Score; X1 = Working Capital/Total Assets; X2 = Retained Earnings/Total Assets; X3 = Earnings before
Interest and Taxes; X4= Market Value of Equity/Book Value of Total Liabilities; X5 = Sales/Total Assets.
Matonti et al. 515
The model was subsequently modified by Altman (1983) and Altman and Hotchkiss (2006) to apply to non-listed firms, as
detailed in Equation 2:
(2) where Z’= Overall Index or Score; X1 = (Current Assets – Current Liabilities)/Total Assets; X2 = Retained Earnings/Total Assets; X3 = Earnings before Interest and Taxes/Total Assets; X4= Book Value of Equity/Total Equity; X5 = Sales/Total Assets.
Three zones are identified for the outcome of the Z-Score: a “safe-zone” where the Z-Score exceeds 2.90; a “Grey zone” where the Z-Score value falls between 1.23 and 2.90, where it is uncertain whether firms may or may not go bankrupt; and a “distress zone” where the Z-Score is lower than 1.23, indicating a high probability of distress and financial difficulties within a given time period (Altman and Hotchkiss, 2006). Therefore, the higher the Z-Score, the lower the probability that a firm fails. In this paper we investigate the relationship between the earnings management behaviour of non-listed firms and their Altman Z-Score. We operationalise this by means of a categorical financial distress variable which takes the value of 0 for observations in “safe-zone”; the value of 1 for observations in the “grey-zone”, which includes firms not suffering severe financial problems, and the value of 2 for observations in the “distress zone”, which includes firms in financial difficulty. Therefore, as the value of the categorical variable increases, the severity of firm financial problems increases. Measurement of accrual-based earnings management Consistent with the extant research, discretionary accruals are employed to proxy for accrual-based earnings management as they reflect subjective accounting choices made by the firm (Lazzem & Jilani, 2018). According to Yang et al. (2009), the higher the value
of firm discretionary accruals, the greater that earnings are managed. Further, discretionary accruals may take the form of either income-increasing (positive discretionary) or income-decreasing (negative discretionary) accruals. For the purpose of this paper, we use signed discretionary accruals as a proxy for earnings management rather than their absolute value (Ugrin et al., 2017). Chen et al. (2007) argue that managers may inflate earnings (managing them upward) to make their firm financial performance more attractive to investors. Conversely, Givoly and Hayn (2000) argue that negative discretionary accruals indicate that economic losses are recognised in a timely fashion by the firm. Such earnings underestimation signals conservatism rather than managerial opportunism (Ugrin et al., 2017).
To decompose total accruals into its discretionary and non-discretionary components we use the Dechow et al. (1995) model. To control for heteroscedasticity, all of the model variables are standardised using opening total assets. This model is estimated using a cross-sectional approach, and so the coefficients are industry- and year-specific rather than firm-specific, the latter using a time series approach (Yang et al., 2009).
Total accruals at time t (TAt) is defined as the difference between accounting earnings (net income before extraordinary items) and operating cash flows, consistent with Subramanyam (1996). However, since 2015, cash flow statements are not mandatory for Italian non-listed firms, and thus in this paper we estimate total accruals from the format of the financial statements adopted by such firms according to Italian civil law. Therefore, we define total accruals as given in Equation 3:
(3)
DeAngelo (1981) defines abnormal total accruals as the difference between total accruals and normal (expected) total accruals. Therefore, total accrual changes from the previous year to the
current year can be separated into discretionary and non-discretionary accrual changes as given in Equation 4:
= + (4)
Applying the modified version of the Jones model (Dechow et al., 1995), total accruals can then be expressed as in Equation 5:
(5) where TAi,t = total accruals for firm i in year t; ΔREVi,t = revenues for firm i in year t less revenues in year t–1; ΔRECt = receivables for firm i in year t less receivables in year t–1; PPEi,t = property, plant
and equipment + long-term deferred expenses for firm i in year t; Ai,t-1 = total assets in year t–1; and εt = the model error term.
To estimate the coefficients in Equation 5, we use a cross-sectional regression approach, including all firms within the same first two digit NACE code. The model implicitly assumes that all firms within a given industry and year share the same incentive for earnings manipulation. Consistent with Dechow et al. (1995), discretionary accruals are then calculated as the difference between total and expected accruals, that is, the error term in Equation 6.
(6) As we hypothesise that firms experiencing financial difficulties are likely to manage their earnings downward, we focus on income-decreasing earnings management as the dependent variable in the main model, Model 1. In addition, we propose an additional control model using income-increasing earnings management (Model 2) as dependent variable. If our hypothesis is supported, in Model 1 we expect a significant positive relationship between the degree of
financial distress and the dependent variable EM1 (the income-decreasing earnings management), as managers may manage earnings downward when the severity of their financial difficulties increase. As a consequence, in Model 2 we expect a negative relationship between the degree of financial distress and the dependent variable EM2 (income-increasing earnings management).
516 Afr. J. Bus. Manage. To compute negative discretionary accruals (dependent variable EM1) all positive values of discretionary accruals are set to zero to reflect only income-decreasing earnings management. The second measure of earnings management (dependent variable EM2) captures positive abnormal accruals, and so all negative values of discretionary accruals are set to zero to reflect income-increasing earnings management alone.
The empirical model
To test our hypothesis, the model given in Equation 7 is estimated in order to examine the relationship between signed discretionary accruals and financial distress risk for non-listed firms. We introduce Altman’s Z-Score as a categorical variable labelled DISTRESS. The variable takes the value of 0 for observations in
+ (7)
the safe zone (where the Z-Score is greater than 2.9), the value of 1 for observations in the grey area (where the Z-Score is between 1.23 and 2.9), and the value of 2 for observations in the distress zone (where the Z-Score is lower than 1.23). where EMi,t is the dependent variable of the main model (M1), reflecting income-decreasing earnings management, computed according to the modified Jones’ model (Dechow et al., 1995). We also employ the following control dependent variable: EM2 which proxies for income-increasing earnings management. Here after we list the testing and control variables. = categorical variable for Altman’s Z-Score, assuming the value of 0 for observations in safe zone, 1 for observations falling into the grey area, and 2 for observations falling into the distressed zone. In the regression model, the base for the categorical variable is zero. LEVi,t = firm leverage, measured as loans to total assets; SIZEi,t = natural logarithm of total assets; GROWi,t = firm’s growth rate measured as the percentage annual change in revenues; TAXi,t = tax burden measured as the sum of tax payables and deferred taxes, scaled by income before taxes; ROAi,t = return on assets ratio; TACCi,t = the signed value of total accruals; DEBTCHi,t = dummy variable taking the value of 1 if a firm issued new debt compared to the previous year; EQUCHi,t = dummy variable taking the value of 1 if a firm issued new equity compared to the previous year; and εi,t = model error term.
The test variable DISTRESS is categorical such that it takes the value 0 for observations in the safe zone, the value 1 for observations in the grey zone, and the value 2 for observations in the distressed zone. In the regression model, we use the categorical dependent variable of zero (safe zone) as the base. Therefore, we expect a positive sign for the variable DISTRESS assuming the value of 1 (grey zone) and 2 (distress zone). These findings would suggest that with an increase in financial difficulties, firms are more likely to engage in income-decreasing earnings management initiatives than healthy firms (where the variable DISTRESS assumes the value of zero). In other words, as the dependent variable EM1 proxies negative discretionary accruals, we expect that the greater are the firm’s financial difficulties, the greater are income-decreasing earnings managements initiatives. This is consistent with the control hypothesis (Jensen, 1986).
Consistent with the extant research examining the determinants of earnings management, Equation 7 includes several control variables (Dechow et al., 1995; Kothari et al., 2005; Jelinek, 2007; Dechow et al., 2010; Mariani et al., 2010; Bisogno, 2012; Habib et al., 2013; Shan et al., 2013; Agrawal and Chatterjee, 2015; Bisogno and De Luca, 2016; Humeedat, 2018; Lazzem and Jilani, 2018; Ranjbar and Farsad Amanollahi, 2018; Campa, 2019) which are likely to impact on earnings management initiatives.
This study controls for the impact of leverage on earnings management. The literature provides mixed findings about the relationship between leverage and accrual-based earnings management. Because Italian non-listed firms rely more on external capital to finance their operations (Mafrolla and D’Amico, 2017), it is
argued that managers of firms in financial difficulties attempt to manage their earnings downward. As lenders estimate borrower creditworthiness focusing on accounting information, there could be high political costs (Watts and Zimmerman, 1978) if they discover earnings management initiatives (Mafrolla and D’Amico, 2017). Therefore, non-listed firms are monitored closely by lenders and we expect that more highly leveraged firms are more likely to manage earnings downward than lower leveraged firms, consistent with the control hypothesis (Jensen, 1986).
This study controls for firm growth (proxied by the change in sales) as it impacts on the degree of earnings management. Skinner and Sloan (2002) argue that the market penalises growing firms in the case of negative earnings surprises. In addition, the managers of growing firms may have an incentive to smooth earnings by managing accruals since earnings volatility may increase firm risk (Beaver et al., 1970). Gorganli and Vakilifard (2014) argue for a positive relationship between firm growth and accounting discretion in listed firms, though find a negative relationship between the two, indicating that managers of firms with growth opportunities engage less in earnings management. Therefore, we expect a positive relationship between firm growth and negative abnormal accruals (income-decreasing earnings management).
This study controls for firm profitability. DeAngelo et al. (1994) argue, and find evidence, that managers of firms experiencing financial difficulties are less likely to inflate earnings to mask their poor financial performances, and such firms are instead likely to manage earnings downward. By reducing their reported earnings, managers attempt to signal to lenders and other creditors their financial difficulties in order to negotiate better terms in contract renegotiations. Therefore, managers of firms experiencing financial difficulties are likely to manage earnings downward. Agrawal and Chatterjee (2015) find a negative relationship between discretionary accruals and firm profitability for listed firms, suggesting an income-decreasing earnings management strategy. Thus, we expect a positive relationship between firm profitability and income-decreasing earnings management.
The study controls for the impact of firm size on earnings management, though there are competing views on the direction of relation. One view is that larger firms are less likely to manage earnings than other firms as they have better internal control systems to reveal such activity (Francis et al., 1999), and that such activity would damage their financial market reputation (Charitou et al., 2011; Habib et al., 2013; Nalarreason et al., 2019). Further, larger (listed) firms are in general audited by more highly qualified and competent auditors that limit earnings management behaviour. The altenative view argues that larger firms are more likely to manage their earnings than other firms given their concern to meet analysts expectations and their greater bargaining power with auditors (Habib et al., 2013; Agrawal and Chatterjee, 2015). Campa (2019) finds a negative relationship between income-increasing discretionary accruals and firm size in French listed and non-listed
Matonti et al. 517 Table 2. Variable description and measurement.
Label Variable description
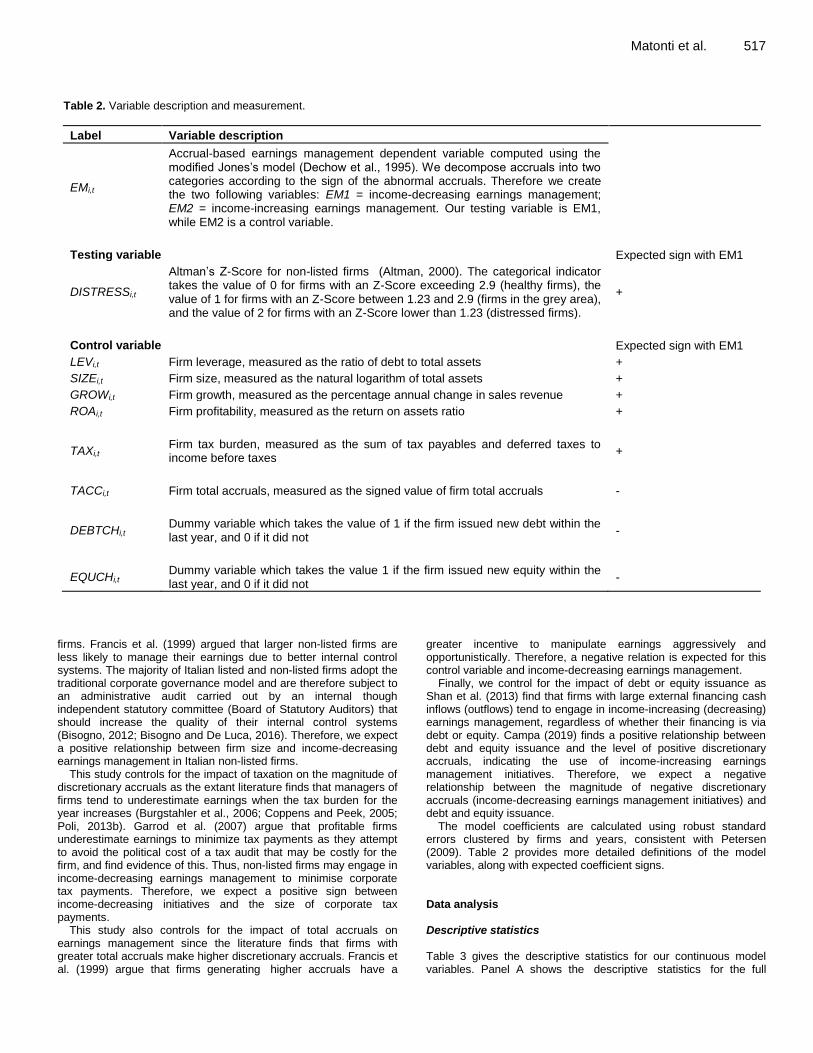
EMi,t
Accrual-based earnings management dependent variable computed using the modified Jones’s model (Dechow et al., 1995). We decompose accruals into two categories according to the sign of the abnormal accruals. Therefore we create the two following variables: EM1 = income-decreasing earnings management; EM2 = income-increasing earnings management. Our testing variable is EM1, while EM2 is a control variable.
Testing variable Expected sign with EM1
DISTRESSi,t
Altman’s Z-Score for non-listed firms (Altman, 2000). The categorical indicator takes the value of 0 for firms with an Z-Score exceeding 2.9 (healthy firms), the value of 1 for firms with an Z-Score between 1.23 and 2.9 (firms in the grey area), and the value of 2 for firms with an Z-Score lower than 1.23 (distressed firms).
+
Control variable Expected sign with EM1
LEVi,t Firm leverage, measured as the ratio of debt to total assets +
SIZEi,t Firm size, measured as the natural logarithm of total assets +
GROWi,t Firm growth, measured as the percentage annual change in sales revenue +
ROAi,t Firm profitability, measured as the return on assets ratio +
TAXi,t Firm tax burden, measured as the sum of tax payables and deferred taxes to income before taxes
+
TACCi,t Firm total accruals, measured as the signed value of firm total accruals -
DEBTCHi,t Dummy variable which takes the value of 1 if the firm issued new debt within the last year, and 0 if it did not
-
EQUCHi,t Dummy variable which takes the value 1 if the firm issued new equity within the last year, and 0 if it did not
-
firms. Francis et al. (1999) argued that larger non-listed firms are less likely to manage their earnings due to better internal control systems. The majority of Italian listed and non-listed firms adopt the traditional corporate governance model and are therefore subject to an administrative audit carried out by an internal though independent statutory committee (Board of Statutory Auditors) that should increase the quality of their internal control systems (Bisogno, 2012; Bisogno and De Luca, 2016). Therefore, we expect a positive relationship between firm size and income-decreasing earnings management in Italian non-listed firms.
This study controls for the impact of taxation on the magnitude of discretionary accruals as the extant literature finds that managers of firms tend to underestimate earnings when the tax burden for the year increases (Burgstahler et al., 2006; Coppens and Peek, 2005; Poli, 2013b). Garrod et al. (2007) argue that profitable firms underestimate earnings to minimize tax payments as they attempt to avoid the political cost of a tax audit that may be costly for the firm, and find evidence of this. Thus, non-listed firms may engage in income-decreasing earnings management to minimise corporate tax payments. Therefore, we expect a positive sign between income-decreasing initiatives and the size of corporate tax payments.
This study also controls for the impact of total accruals on earnings management since the literature finds that firms with greater total accruals make higher discretionary accruals. Francis et al. (1999) argue that firms generating higher accruals have a
greater incentive to manipulate earnings aggressively and opportunistically. Therefore, a negative relation is expected for this control variable and income-decreasing earnings management.
Finally, we control for the impact of debt or equity issuance as Shan et al. (2013) find that firms with large external financing cash inflows (outflows) tend to engage in income-increasing (decreasing) earnings management, regardless of whether their financing is via debt or equity. Campa (2019) finds a positive relationship between debt and equity issuance and the level of positive discretionary accruals, indicating the use of income-increasing earnings management initiatives. Therefore, we expect a negative relationship between the magnitude of negative discretionary accruals (income-decreasing earnings management initiatives) and debt and equity issuance.
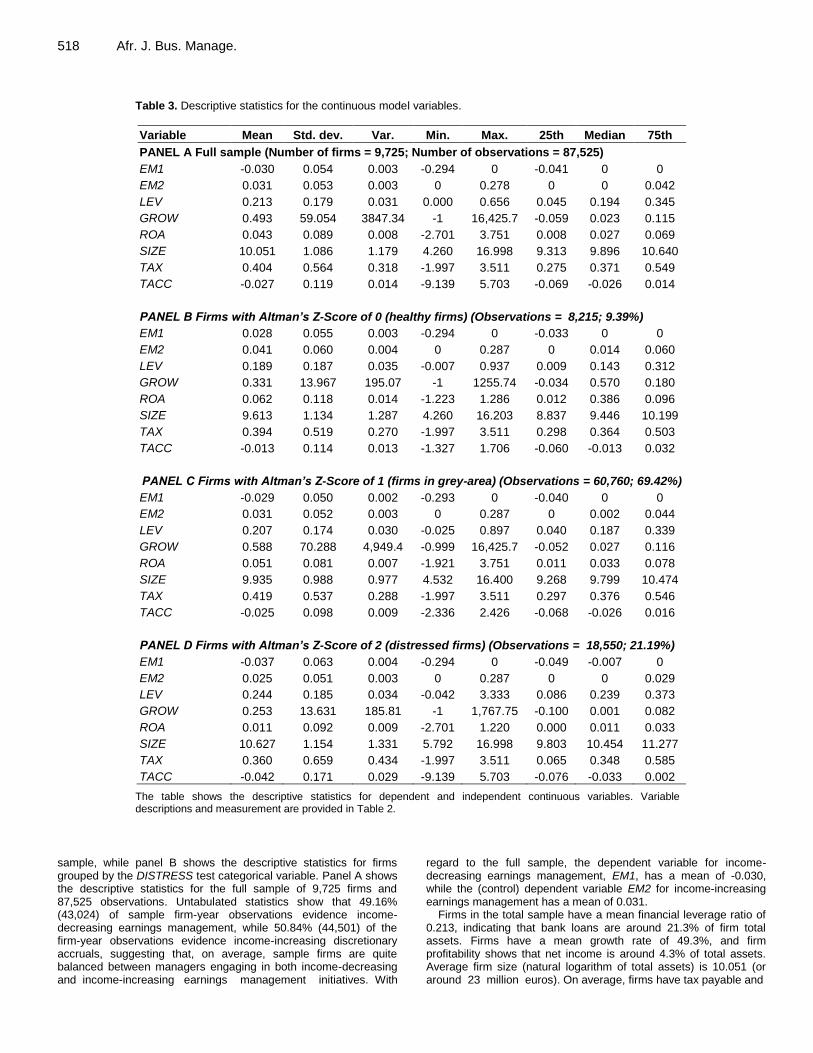
The model coefficients are calculated using robust standard errors clustered by firms and years, consistent with Petersen (2009). Table 2 provides more detailed definitions of the model variables, along with expected coefficient signs. Data analysis Descriptive statistics Table 3 gives the descriptive statistics for our continuous model variables. Panel A shows the descriptive statistics for the full
518 Afr. J. Bus. Manage.
Table 3. Descriptive statistics for the continuous model variables.
Variable Mean Std. dev. Var. Min. Max. 25th Median 75th
PANEL A Full sample (Number of firms = 9,725; Number of observations = 87,525)
EM1 -0.030 0.054 0.003 -0.294 0 -0.041 0 0
EM2 0.031 0.053 0.003 0 0.278 0 0 0.042
LEV 0.213 0.179 0.031 0.000 0.656 0.045 0.194 0.345
GROW 0.493 59.054 3847.34 -1 16,425.7 -0.059 0.023 0.115
ROA 0.043 0.089 0.008 -2.701 3.751 0.008 0.027 0.069
SIZE 10.051 1.086 1.179 4.260 16.998 9.313 9.896 10.640
TAX 0.404 0.564 0.318 -1.997 3.511 0.275 0.371 0.549
TACC -0.027 0.119 0.014 -9.139 5.703 -0.069 -0.026 0.014
PANEL B Firms with Altman’s Z-Score of 0 (healthy firms) (Observations = 8,215; 9.39%)
EM1 0.028 0.055 0.003 -0.294 0 -0.033 0 0
EM2 0.041 0.060 0.004 0 0.287 0 0.014 0.060
LEV 0.189 0.187 0.035 -0.007 0.937 0.009 0.143 0.312
GROW 0.331 13.967 195.07 -1 1255.74 -0.034 0.570 0.180
ROA 0.062 0.118 0.014 -1.223 1.286 0.012 0.386 0.096
SIZE 9.613 1.134 1.287 4.260 16.203 8.837 9.446 10.199
TAX 0.394 0.519 0.270 -1.997 3.511 0.298 0.364 0.503
TACC -0.013 0.114 0.013 -1.327 1.706 -0.060 -0.013 0.032
PANEL C Firms with Altman’s Z-Score of 1 (firms in grey-area) (Observations = 60,760; 69.42%)
EM1 -0.029 0.050 0.002 -0.293 0 -0.040 0 0
EM2 0.031 0.052 0.003 0 0.287 0 0.002 0.044
LEV 0.207 0.174 0.030 -0.025 0.897 0.040 0.187 0.339
GROW 0.588 70.288 4,949.4 -0.999 16,425.7 -0.052 0.027 0.116
ROA 0.051 0.081 0.007 -1.921 3.751 0.011 0.033 0.078
SIZE 9.935 0.988 0.977 4.532 16.400 9.268 9.799 10.474
TAX 0.419 0.537 0.288 -1.997 3.511 0.297 0.376 0.546
TACC -0.025 0.098 0.009 -2.336 2.426 -0.068 -0.026 0.016
PANEL D Firms with Altman’s Z-Score of 2 (distressed firms) (Observations = 18,550; 21.19%)
EM1 -0.037 0.063 0.004 -0.294 0 -0.049 -0.007 0
EM2 0.025 0.051 0.003 0 0.287 0 0 0.029
LEV 0.244 0.185 0.034 -0.042 3.333 0.086 0.239 0.373
GROW 0.253 13.631 185.81 -1 1,767.75 -0.100 0.001 0.082
ROA 0.011 0.092 0.009 -2.701 1.220 0.000 0.011 0.033
SIZE 10.627 1.154 1.331 5.792 16.998 9.803 10.454 11.277
TAX 0.360 0.659 0.434 -1.997 3.511 0.065 0.348 0.585
TACC -0.042 0.171 0.029 -9.139 5.703 -0.076 -0.033 0.002
The table shows the descriptive statistics for dependent and independent continuous variables. Variable descriptions and measurement are provided in Table 2.
sample, while panel B shows the descriptive statistics for firms grouped by the DISTRESS test categorical variable. Panel A shows the descriptive statistics for the full sample of 9,725 firms and 87,525 observations. Untabulated statistics show that 49.16% (43,024) of sample firm-year observations evidence income-decreasing earnings management, while 50.84% (44,501) of the firm-year observations evidence income-increasing discretionary accruals, suggesting that, on average, sample firms are quite balanced between managers engaging in both income-decreasing and income-increasing earnings management initiatives. With
regard to the full sample, the dependent variable for income-decreasing earnings management, EM1, has a mean of -0.030, while the (control) dependent variable EM2 for income-increasing earnings management has a mean of 0.031.
Firms in the total sample have a mean financial leverage ratio of 0.213, indicating that bank loans are around 21.3% of firm total assets. Firms have a mean growth rate of 49.3%, and firm profitability shows that net income is around 4.3% of total assets. Average firm size (natural logarithm of total assets) is 10.051 (or around 23 million euros). On average, firms have tax payable and
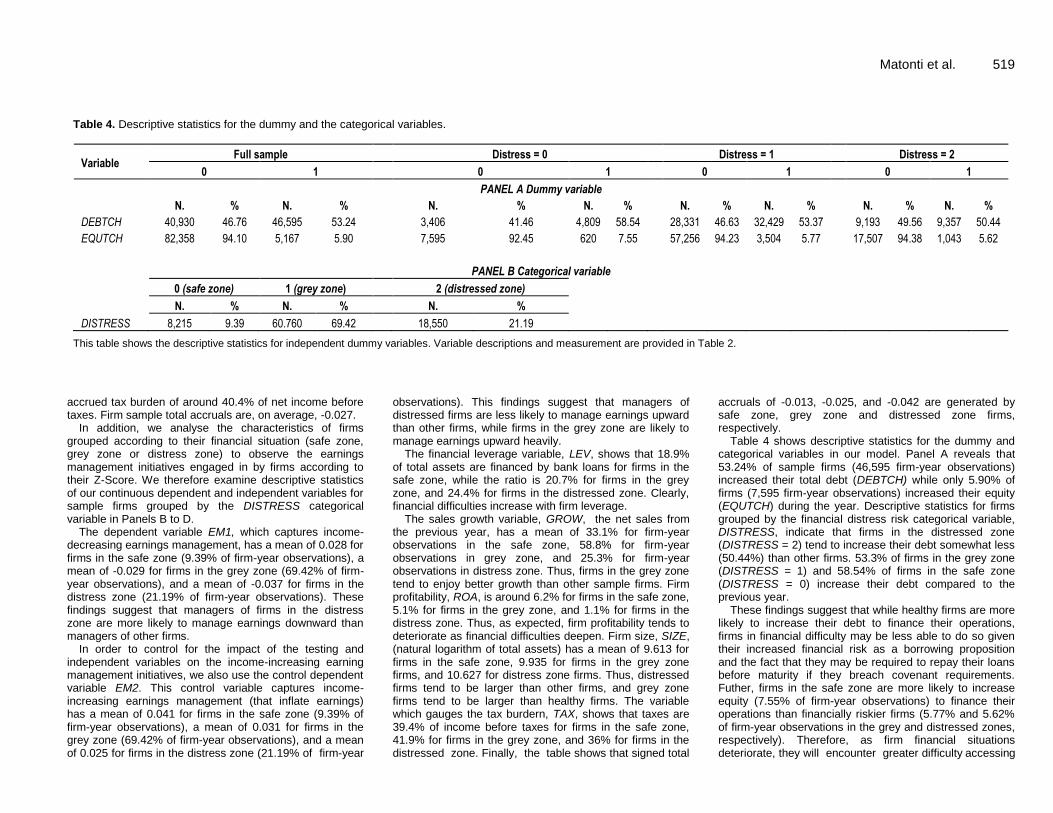
Matonti et al. 519 Table 4. Descriptive statistics for the dummy and the categorical variables.
Variable Full sample Distress = 0 Distress = 1 Distress = 2
0 1 0 1 0 1 0 1
PANEL A Dummy variable
N. % N. % N. % N. % N. % N. % N. % N. %
DEBTCH 40,930 46.76 46,595 53.24 3,406 41.46 4,809 58.54 28,331 46.63 32,429 53.37 9,193 49.56 9,357 50.44
EQUTCH 82,358 94.10 5,167 5.90 7,595 92.45 620 7.55 57,256 94.23 3,504 5.77 17,507 94.38 1,043 5.62
PANEL B Categorical variable
0 (safe zone) 1 (grey zone) 2 (distressed zone)
N. % N. % N. %
DISTRESS 8,215 9.39 60.760 69.42 18,550 21.19
This table shows the descriptive statistics for independent dummy variables. Variable descriptions and measurement are provided in Table 2.
accrued tax burden of around 40.4% of net income before taxes. Firm sample total accruals are, on average, -0.027.
In addition, we analyse the characteristics of firms grouped according to their financial situation (safe zone, grey zone or distress zone) to observe the earnings management initiatives engaged in by firms according to their Z-Score. We therefore examine descriptive statistics of our continuous dependent and independent variables for sample firms grouped by the DISTRESS categorical variable in Panels B to D.
The dependent variable EM1, which captures income-decreasing earnings management, has a mean of 0.028 for firms in the safe zone (9.39% of firm-year observations), a mean of -0.029 for firms in the grey zone (69.42% of firm-year observations), and a mean of -0.037 for firms in the distress zone (21.19% of firm-year observations). These findings suggest that managers of firms in the distress zone are more likely to manage earnings downward than managers of other firms.
In order to control for the impact of the testing and independent variables on the income-increasing earning management initiatives, we also use the control dependent variable EM2. This control variable captures income-increasing earnings management (that inflate earnings) has a mean of 0.041 for firms in the safe zone (9.39% of firm-year observations), a mean of 0.031 for firms in the grey zone (69.42% of firm-year observations), and a mean of 0.025 for firms in the distress zone (21.19% of firm-year
observations). This findings suggest that managers of distressed firms are less likely to manage earnings upward than other firms, while firms in the grey zone are likely to manage earnings upward heavily.
The financial leverage variable, LEV, shows that 18.9% of total assets are financed by bank loans for firms in the safe zone, while the ratio is 20.7% for firms in the grey zone, and 24.4% for firms in the distressed zone. Clearly, financial difficulties increase with firm leverage.
The sales growth variable, GROW, the net sales from the previous year, has a mean of 33.1% for firm-year observations in the safe zone, 58.8% for firm-year observations in grey zone, and 25.3% for firm-year observations in distress zone. Thus, firms in the grey zone tend to enjoy better growth than other sample firms. Firm profitability, ROA, is around 6.2% for firms in the safe zone, 5.1% for firms in the grey zone, and 1.1% for firms in the distress zone. Thus, as expected, firm profitability tends to deteriorate as financial difficulties deepen. Firm size, SIZE, (natural logarithm of total assets) has a mean of 9.613 for firms in the safe zone, 9.935 for firms in the grey zone firms, and 10.627 for distress zone firms. Thus, distressed firms tend to be larger than other firms, and grey zone firms tend to be larger than healthy firms. The variable which gauges the tax burdern, TAX, shows that taxes are 39.4% of income before taxes for firms in the safe zone, 41.9% for firms in the grey zone, and 36% for firms in the distressed zone. Finally, the table shows that signed total
accruals of -0.013, -0.025, and -0.042 are generated by safe zone, grey zone and distressed zone firms, respectively.
Table 4 shows descriptive statistics for the dummy and categorical variables in our model. Panel A reveals that 53.24% of sample firms (46,595 firm-year observations) increased their total debt (DEBTCH) while only 5.90% of firms (7,595 firm-year observations) increased their equity (EQUTCH) during the year. Descriptive statistics for firms grouped by the financial distress risk categorical variable, DISTRESS, indicate that firms in the distressed zone (DISTRESS = 2) tend to increase their debt somewhat less (50.44%) than other firms. 53.3% of firms in the grey zone (DISTRESS = 1) and 58.54% of firms in the safe zone (DISTRESS = 0) increase their debt compared to the previous year.
These findings suggest that while healthy firms are more likely to increase their debt to finance their operations, firms in financial difficulty may be less able to do so given their increased financial risk as a borrowing proposition and the fact that they may be required to repay their loans before maturity if they breach covenant requirements. Futher, firms in the safe zone are more likely to increase equity (7.55% of firm-year observations) to finance their operations than financially riskier firms (5.77% and 5.62% of firm-year observations in the grey and distressed zones, respectively). Therefore, as firm financial situations deteriorate, they will encounter greater difficulty accessing
520 Afr. J. Bus. Manage. either debt or equity financing.
Table 4, panel B, shows that 9.39% of the (8,215) observations fall in the safe zone (Z-Score coded 0), 69.42% of the (60,760) observations fall in the grey area (Z-Score coded 1), and 21.19% of the (18,550) observations fall in the distress zone (Z-Score coded 2). Thus, less than 10% of firms are classed as healthy, while around 70% may experience some financial difficulties and around 21% are distressed.
Correlation analysis
Table 5 shows a correlation matrix for the full sample of firms with Pearson (Spearman) correlations given below (above) the diagonal. To capture the relationship between financial distress risk and earnings management initiatives, we examine the categorical test variable, DISTRESS, whereby the safe zone is coded 0, the grey zone is coded 1, and the distressed zone is coded 2.
The table shows a negative Pearson correlation of 0.015 between the dependent variable EM1 (income-decreasing earnings management) and the test variable DISTRESS when it takes the value 0 (safe zone) which is significant at 1% level. There is a significant positive Pearson correlation (0.050) at 1% level, between the dependent variable EM1 and DISTRESS when it takes the values of 1, the grey zone, and a negative Pearson correlation (-0.066), significant at 1% level, between the dependent variable EM1 and DISTRESS when it takes the values of 2, the distress zone. The Pearson correlation is positive (0.062) and significant at 1% level, between the income-increasing earnings management dependent variable EM2 and DISTRESS when it takes the value 0 (safe zone). There is a positive correlation of 0.009 which is significant at the 1% level between EM2 and DISTRESS when it takes the value 1 (grey zone), and a negative correlation of -0.055 between EM2 and DISTRESS when it takes the value 2 (distressed
zone). These findings suggest that managers of distressed firms are likely to engage less in income-decreasing earnings management (EM1) and less in income-increasing earnings management initiatives (EM2).
The table shows a negative Pearson correlation which is not significant between EM1 and LEV and the control variables GROW and EQUTCH, while the correlation is positive, though insignificant between EM1 and SIZE and TAX. The Pearson correlation is positive and significant at the 1% level between EM1 and the control variables ROA (0.163) and TACC (0.693). Finally, the correlation is negative and significant at the 1% level between EM1 and DEBTCH (-0.070).
The table shows a positive Pearson correlation, which is significant at the 1% level, between EM2 and ROA (0.170), TACC (0.679) and EQUTCH (0.051). There is a negative correlation, which is significant at the 1% level, between EM2 and LEV (-0.074), SIZE (-0.026), and DEBTCH (-0.092).
Leverage is correlated negatively with both income-decreasing (EM1) and income-increasing (EM2) earnings management initiatives, indicating that leveraged firms, consistent with De Angelo et al. (1994), are likely to reduce earnings management initiatives. Firms issuing new debt and larger firms are likely to increase income-decreasing (EM1) and reduce income-increasing earnings management (EM2), indicating that such firms are likely to smooth their earnings. The positive correlations between both EM1 and EM2 and TACC suggest that the overall measure of earnings management (proxied by both income-decreasing and income-increasing earnings management initiatives) are related to the overall measure of total accruals, as in the previous literature. There is a positive Pearson correlation, significant at the 1% level, between the control variables ROA and DISTRESS when it takes the value 0 (0.066) and 1 (0.125), while the correlation is negative and significant at the 1% level when DISTRESS takes the value 2 (-0.187). These findings confirm that firms in the safe and grey zones
are in general more profitable than distressed firms. Moreover, the Pearson correlation between ROA and LEV is negative (-0.276) and significant at the 1% level, suggesting that more leveraged firms have lower profitability due in part to the interest paid on loans. The correlation between SIZE and DISTRESS when it takes the value 0 (safe zone) and 1 (grey zone) are negative and significant at the 1% level (-0.130 and -0.162, respectively), though it is positive and significant at the 1% level when DISTRESS takes the value 2 (distressed zone). Therefore, distressed firms tend to be larger than other firms.
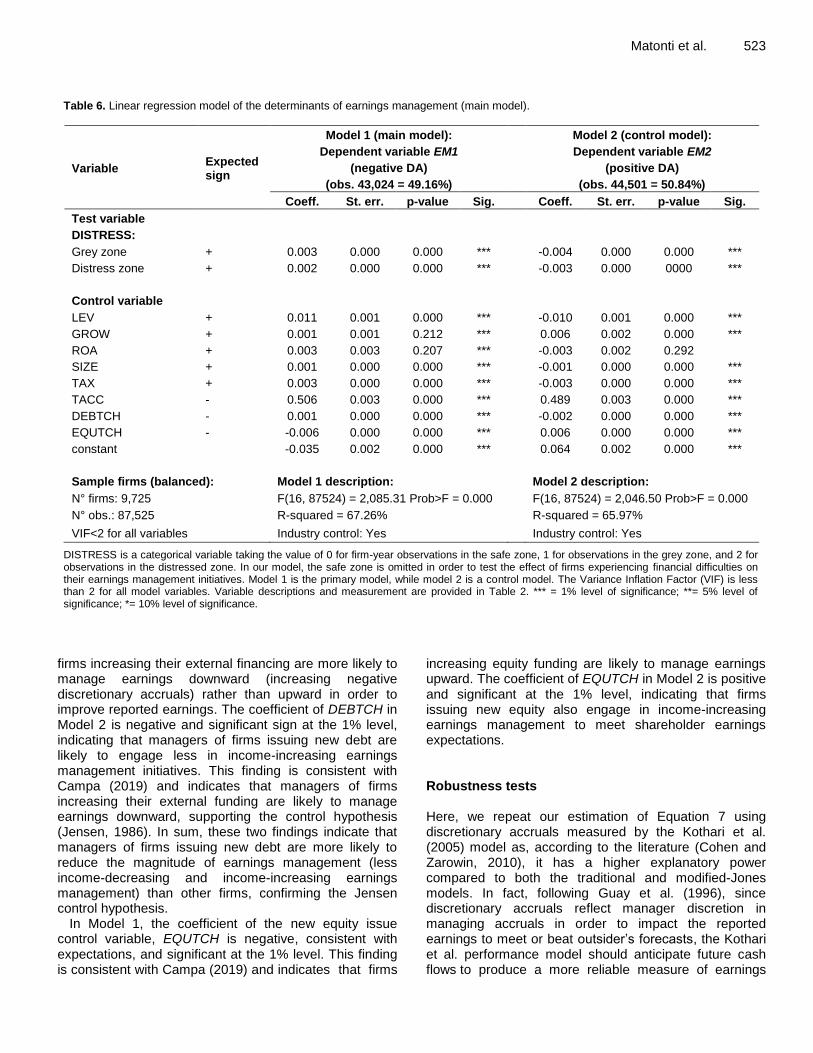
RESULTS AND DISCUSSION Table 6 presents the results of our empirical model to test the impact of firm financial difficulties on earnings management behaviour. Consistent with Campa (2019), the model uses the categorical test variable DISTRESS which takes the value 0 when the Z-Score is higher than 2.9 (safe zone), the value 1 when it lies between 1.23 and 2.9 (grey zone), and 2 when it falls below 1.23 (distressed zone).
From our hypothesis which is based on the control hypothesis (Jensen, 1986) we expect a positive relationship between financial distress risk (Z-Score) and income-decreasing earnings management behaviour (dependent variable EM1). Consistent with DeAngelo et al. (1994), we expect that firms suffering from financial difficulties (high Z-Scores) are likely to manage their earnings downward. Therefore, we expect a positive relationship between the categorical independent variable
DISTRESS and the dependent variable EM1, proxying the income-decreasing accrual-based earnings management(negative discretionary accruals). To confirm
our hypothesis, we also employ a dependent control variable, EM2, reflecting income-increasing earnings management (positive discretionary accruals). Therefore, we compare the findings of our main Model 1 (dependent variable EM1) with those of the control Model 2 (dependent control variable EM2). We run an ordinary least squares regression with robust standard errors clustered by both firm and year, consistent with Petersen (2009). This helps us to control for autocorrelation and heteroscedasticity. Further, the model controls for both industry sector and year. Our main empirical model, Model 1 with EM1 as dependent, has an R-square of 67.26% and an F-test significant at the 1% level. The control Model 2 (using EM2 as dependent variable), has an R-square of 65.97%, with an F-test significant at the 1% level. The test categorical variable, DISTRESS, has three categories: 0 for the safe zone, 1 for the grey zone, and 2 for the distressed zone. Since the purpose of this paper is to investigate whether the severity of a firm’s financial problems induces managers to manage their earnings downward, we employ the safe zone as the base case in our regression model. We first comment on the findings of Model 1, the negative value of discretionary accruals (income-decreasing earnings management) as the dependent variable.

Matonti et al. 521
Table 5. Correlation matrix for the model variables (full sample).
Correlation EM1 EM2 SAFE GRAY DISTRESS LEV GROW ROA SIZE TAX TACC DEBTCH EQUTCH
EM1 1 0.857** 0.044** 0.028** -0.064** -0.031** 0.054** 0.146** -0.004 0.048** 0.926** -0.092** 0.016**
(0.000) (0.000) (0.000) (0.000) (0.000) (0.000) (0.000) (0.250) (0.000) (0.000) (0.000) (0.000)
EM2 0.329** 1 0.066** 0.026** -0.076** -0.071** 0.054** 0.179** -0.032** -0.003 0.932** -0.093** 0.036**
(0.000) (0.000) (0.000) (0.000) (0.000) (0.000) (0.000) (0.000) (0.316) (0.000) (0.000) (0.000)
SAFE 0.015** 0.062** 1 -0.485** -0.167** -0.056** 0.079** 0.066** -0.141** -0.007* 0.060** 0.034** 0.022**
(0.000) (0.000) (0.000) (0.000) (0.000) (0.000) (0.000) (0.000) (0.039) (0.000) (0.000) (0.000)
GRAY 0.050** 0.009** -0.485** 1 -0.781** -0.046** 0.043** 0.180** -0.152** 0.070** 0.026** 0.004 -0.009**
(0.000) (0.008) (0.000) (0.000) (0.000) (0.000) (0.000) (0.000) (0.000) (0.000) (0.224) (0.010)
DISTRESS -0.066** -0.055** -0.167** -0.781** 1 0.092** -0.106** -0.250** 0.271** -0.074** -0.072** -0.029** -0.006
(0.000) (0.000) (0.000) (0.000) (0.000) (0.000) (0.000) (0.000) (0.000) (0.000) (0.000) (0.068)
LEV -0.005 -0.074** -0.044** -0.053** 0.091** 1 0.001 -0.322** 0.080** 0.118** -0.056** 0.044** 0.069**
(0.129) (0.000) (0.000) (0.000) (0.000) (0.807) (0.000) (0.000) (0.000) (0.000) (0.000) (0.000)
GROW -0.001 0.003 -0.001 0.002 -0,002 -0.001 1 0.239** -0.003 0.056** 0.042** 0.288** 0.043**
(0.695) (0.352) (0.794) (0.473) (0.533) (0.688) (0.000) (0.423) (0.000) (0.000) (0.000) (0.000)
ROA 0.163** 0.170** 0.066* 0.125** -0.187** -0.276** 0.000 1 -0.066** -0.007* 0.173** 0.034** -0.028**
(0.000) (0.000) (0.000) (0.000) (0.000) (0.000) (0.950) (0.000) (0.027) (0.000) (0.000) (0.000)
SIZE 0.004 -0.026** -0.130** -0.162** 0.275** 0.062** -0.001 -0.060** 1 -0.136** -0.022** -0.006 0.033**
(0.273) (0.000) (0.000) (0.000) (0.000) (0.000) (0.854) (0.000) (0.000) (0.000) (0.076) (0.000)
TAX 0.000 -0.003 -0. 001 0.006 -0.006 -0.002 0.000 -0.001 -0.006 1 0.020** 0.014** -0.002
(0.957) (0.324) (0.744) (0.076) (0.078) (0.555) (0.953) (0.863) (0.075) (0.000) (0.000) (0.586)
TACC 0.693** 0.679** 0.039** 0.033** -0.065** -0.045** -0.001 0.254** -0.019** -0.002 1 -0.102** 0.027**
(0.000) (0.000) (0.000) (0.000) (0.000) (0.000) (0.706) (0.000) (0.000) (0.653) (0.000) (0.000)
DEBTCH -0.070** -0.092** 0.034** 0.004 -0.029** 0.041** 0.006 0.017** -0.004 -0.004 -0.083** 1 0.022**
(0.000) (0.000) (0.000) (0.224) (0.000) (0.000) (0.078) (0.000) (0.224) (0.287) (0.000) (0.000)
EQUTCH -0.004 0.051** 0.022** -0.009** -0.006 0.067** 0.016** -0.028** 0.037** 0.000 0.020** 0.022** 1
(0.281) (0.000) (0.000) (0.010) (0.068) (0.000) (0.000) (0.000) (0.000) (0.975) (0.000) (0.000)
The table shows the Pearson (Spearman) correlation below (above) the median. *= 5% level of significance; ** = 1% level of significance.
522 Afr. J. Bus. Manage. The results show that the DISTRESS variable coefficient is positive, as expected, and significant at the 1% level for firms in both the grey and distress zones. These findings indicate that when the financial difficulties increase managers of these firms are likely to manage their earnings downward. The results are consistent with the prior literature (De Angelo et al., 1994; Charitou et al., 2007a, b; Campa, 2019) and suggest that managers of firms in financial distress face political costs (Watts and Zimmerman, 1978) related to the increased monitoring and scrutiny of outsiders (mainly creditors and lenders). The findings are also confirmed by the coefficients of the DISTRESS variable in Model 2 which for firms in the grey and distress zone has a negative sign which is significant at the 1% level. These findings suggest that there is a negative relation between firm financial difficulties and the probability of managing earnings upward. In conclusion, consistent with DeAngelo et al. (1994), stressed firms are more likely to reveal their weak financial performance to stakeholders in order to renegotiate their debt on better terms and to signal to stakeholders the manager’s willingness to deal with these problems. Further, DeAngelo et al. argue that managers have an incentive to manage earnings downward in the case of close auditor and lender monitoring, as noted by Etemadi et al. (2013). Within the traditional corporate governance system, adopted by the majority of Italian listed and non-listed firms, the Board of Statutory Auditors (BSA), an independent and skilled statutory auditor which submits firms to frequent administrative audit (Bisogno, 2012), works to monitor the day-to-day prudence of operations on behalf of both minority shareholders and external stakeholders. Therefore, we find support for our central hypothesis.
The possible incentives motivating managers to decrease firm earnings when firms experience financial difficulties was examined by examining the model control variables. In Model 1, LEV is positive and significant at the 1% level and thus, consistent with expectations, more indebted firms are more likely to manage their earnings downward. The result is consistent with Jensen’s (1986) control hypothesis, which indicates a negative relationship between leverage and earnings management (that is, firms managing earnings downward) due to the scrutiny and the monitoring role of outsiders (including lenders). This finding may be also explained by managers having an incentive to report financial difficulties in order to obtain better conditions in debt renegotiations (De Angeloet al., 1994). Further, since firms in financial difficulties are under the monitoring and scrutiny of lenders, an income-increasing earnings management initiative would be costly since discretionary accruals may be easily detected by outsiders (Graham et al., 2005). The finding is also confirmed by the negative LEV coefficient in Model 2, which is significant at the 1% level, indicating that leveraged firms engage less in income-increasing earnings management initiatives.
The coefficient of the control variable GROWTH, measured as the change in net sales, is positive, as expected, though it is not significant in Model 1. This finding is not consistent with Gorganli and Vakilifard (2014). The sign of this control variable in Model 2 indicates that managers with growth opportunities are also more likely to engage in income-increasing earnings management.
The coefficient of the profitability control variable ROA is positive, though it is not significant in the main Model 1. In Model 2, contrary to the extant literature (Dichev and Skinner, 2002; Agrawal and Chatterjee, 2015), we find a not insignificant relationship between firm profitability and income-increasing earnings management.
In Model 1, the coefficient of the control variable firm size (SIZE) is positive, consistent with expectations, and is significant at the 1% level. This indicates that managers of larger non-listed firms experiencing financial difficulties have more incentive to manage earnings downward. The control Model 2 which focuses on income-increasing earnings management, shows a negative relationship between firm size and (income-increasing) earnings management which is significant at the 1% level. This finding, consistent with the prior literature (Francis et al., 1999), indicates that larger firms are less likely to manage earnings upward because of their better internal control systems. The results across the two models suggest that the managers of larger firms manage their earnings to meet an expected earnings level in order to avoid political costs (Garrod et al., 2007) related to financial distress, for example to avoid debt covenant restrictions.
As expected, in Model 1, the tax burden, TAX, is significantly positively associated with income-decreasing earnings management at the 1% level. Thus, firms reduce reported earnings in order to minimise corporate tax payments (Garrod et al., 2007) while attempting to avoid a tax audit (a political cost). This finding is consistent with the prior literature (Burgstahler et al., 2006; Coppens and Peek, 2005; Garrod et al., 2007; Van Tendeloo and Vanstraelen, 2008). Model 2 confirms this relationship since the variable TAX has a negative and significant sign at 1% level.
The coefficient of the total accruals variable TACC is positive, contrary to expectations, and is significant at the 1% level. This finding is not consistent with Francis et al. (1999), who find that firms generating higher total accruals are more likely to manage their reported earnings upward. This finding is underpinned by the positive and significant coefficient at 1% level for the variable TACC in Model 2.
The coefficient of the new debt issue variable, DEBTCH, is positive, contrary to expectations, and significant at the 1% level in Model 1. This finding is not consistent with Shan et al. (2003), while it is consistent with Campa (2019). This finding, consistent with the Jensen’ control hypothesis, indicates that managers of
Matonti et al. 523 Table 6. Linear regression model of the determinants of earnings management (main model).
Variable Expected sign
Model 1 (main model):
Dependent variable EM1
(negative DA)
(obs. 43,024 = 49.16%)
Model 2 (control model):
Dependent variable EM2
(positive DA)
(obs. 44,501 = 50.84%)
Coeff. St. err. p-value Sig. Coeff. St. err. p-value Sig.
Test variable
DISTRESS:
Grey zone + 0.003 0.000 0.000 *** -0.004 0.000 0.000 ***
Distress zone + 0.002 0.000 0.000 *** -0.003 0.000 0000 ***
Control variable
LEV + 0.011 0.001 0.000 *** -0.010 0.001 0.000 ***
GROW + 0.001 0.001 0.212 *** 0.006 0.002 0.000 ***
ROA + 0.003 0.003 0.207 *** -0.003 0.002 0.292
SIZE + 0.001 0.000 0.000 *** -0.001 0.000 0.000 ***
TAX + 0.003 0.000 0.000 *** -0.003 0.000 0.000 ***
TACC - 0.506 0.003 0.000 *** 0.489 0.003 0.000 ***
DEBTCH - 0.001 0.000 0.000 *** -0.002 0.000 0.000 ***
EQUTCH - -0.006 0.000 0.000 *** 0.006 0.000 0.000 ***
constant -0.035 0.002 0.000 *** 0.064 0.002 0.000 ***
Sample firms (balanced): Model 1 description: Model 2 description:
N° firms: 9,725 F(16, 87524) = 2,085.31 Prob>F = 0.000 F(16, 87524) = 2,046.50 Prob>F = 0.000
N° obs.: 87,525 R-squared = 67.26% R-squared = 65.97%
VIF<2 for all variables Industry control: Yes Industry control: Yes
DISTRESS is a categorical variable taking the value of 0 for firm-year observations in the safe zone, 1 for observations in the grey zone, and 2 for observations in the distressed zone. In our model, the safe zone is omitted in order to test the effect of firms experiencing financial difficulties on their earnings management initiatives. Model 1 is the primary model, while model 2 is a control model. The Variance Inflation Factor (VIF) is less than 2 for all model variables. Variable descriptions and measurement are provided in Table 2. *** = 1% level of significance; **= 5% level of significance; *= 10% level of significance.
firms increasing their external financing are more likely to manage earnings downward (increasing negative discretionary accruals) rather than upward in order to improve reported earnings. The coefficient of DEBTCH in Model 2 is negative and significant sign at the 1% level, indicating that managers of firms issuing new debt are likely to engage less in income-increasing earnings management initiatives. This finding is consistent with Campa (2019) and indicates that managers of firms increasing their external funding are likely to manage earnings downward, supporting the control hypothesis (Jensen, 1986). In sum, these two findings indicate that managers of firms issuing new debt are more likely to reduce the magnitude of earnings management (less income-decreasing and income-increasing earnings management) than other firms, confirming the Jensen control hypothesis.
In Model 1, the coefficient of the new equity issue control variable, EQUTCH is negative, consistent with expectations, and significant at the 1% level. This finding is consistent with Campa (2019) and indicates that firms
increasing equity funding are likely to manage earnings upward. The coefficient of EQUTCH in Model 2 is positive and significant at the 1% level, indicating that firms issuing new equity also engage in income-increasing earnings management to meet shareholder earnings expectations. Robustness tests Here, we repeat our estimation of Equation 7 using discretionary accruals measured by the Kothari et al. (2005) model as, according to the literature (Cohen and Zarowin, 2010), it has a higher explanatory power compared to both the traditional and modified-Jones models. In fact, following Guay et al. (1996), since discretionary accruals reflect manager discretion in managing accruals in order to impact the reported earnings to meet or beat outsider’s forecasts, the Kothari et al. performance model should anticipate future cash flows to produce a more reliable measure of earnings

524 Afr. J. Bus. Manage.
Table 7. Linear regression model of the determinants of earnings management – First robustness test (discretionary accruals estimated using the Kothari et al. (2005) model).
Variable Expected
sign
Model 3 (main model):
Dependent variable EM3
(negative DA)
(obs. 42,778 = 48.88%)
Model 4 (control model):
Dependent variable EM4
(positive DA)
(obs. 44,747 = 51.12%))
Coeff. St. err. p-value Sig. Coeff. St. err. p-value Sig.
Test variable
DISTRESS:
Grey zone + 0.005 0.000 0.000 *** -0.001 0.000 0.010 ***
Distress zone + 0.008 0.000 0.036 ** 0.005 0.000 0.000 ***
Control variable
LEV + 0.014 0.001 0.000 *** -0.007 0.001 0.000 ***
GROW + 0.004 0.001 0.000 *** 0.008 0.001 0.000 ***
ROA + -0.010 0.003 0.000 *** -0.016 0.003 0.000 ***
SIZE + 0.001 0.000 0.000 *** -0.001 0.000 0.000 ***
TAX + 0.003 0.000 0.000 *** -0.003 0.000 0.000 ***
TACC - 0.498 0.003 0.000 *** 0.475 0.003 0.000 ***
DEBTCH - 0.001 0.000 0.000 *** -0.002 0.000 0.000 ***
EQUTCH - -0.005 0.001 0.000 *** 0.007 0.000 0.000 ***
constant -0.035 0.002 0.000 *** 0.063 0.002 0.000 ***
Sample firms (balanced): Model 3 description: Model 4 description:
N° firms: 9,725 F(16, 87524) = 1,924.32 Prob>F = 0.000
F(16, 87524) = 1,940.64 Prob>F = 0.000
N° obs.: 87,525 R-squared = 64.67% R-squared = 63.63%
VIF<2 for all variables Industry control: Yes Industry control: Yes
This table shows the first robustness linear regression, using the discretionary abnormal accruals estimated by the Kothari et al. (2005) model as dependent variable. The dependent variable EM3 indicates discretionary accruals below zero, while the dependent variable EM4 indicates the discretionary accruals above zero. DISTRESS is a categorical variable taking the value of 0 for firm-year observations in the safe zone, 1 for observations in the grey zone, and 2 for observations in the distressed zone. In our model, the safe zone is omitted in order to test the effect of firms experiencing financial difficulties on their earnings management initiatives. Model 1 is the primary model, while model 2 is a control model. The Variance Inflation Factor (VIF) is less than 2 for all model variables. Variable descriptions and measurement are provided in Table 2. *** = 1% level of significance; **= 5% level of significance; *= 10% level of significance.
than cash flows (Watts and Zimmerman, 1986). The findings of this first robustness test are shown in Table 7.
In Table 7, Model 3 reports the findings of the estimation of Equation 7 using the main dependent variable EM3, proxying income-decreasing earnings management (positive discretionary accruals are set to zero). Model 4 reports the findings of the estimation of the equation using the control dependent variable EM4 which proxyies income-increasing earnings management (negative discretionary accruals are set to zero). The R-square of Model 3 is 64.67% which is lower than the R-square of Model 1 in Table 6. The R-square of the control Model 4 is 63.63% which isalso lower than the R-square value of the control Model 2 in Table 6. Contrary to Cohen and Zarowin (2010), the results indicate a lower explanatory power of the Kothari et al. model compared to the modified-Jones model in decomposing total accrual in non-listed firms. The VIF is below 2 for all variables in the equation. The models are run with the Petersen
(2009) methodology, in the same manner as the models in Table 6.
Apart from the differences in explanatory power, we find that the signs of the test categorical variable Z-Score in the Model 7, assuming the values 1 (grey zone) and 2 (distressed zone), are consistent with expectations and the sign of the same variable in the main Model 1. Contrary to the results of the control Model 2, the results of the test variable Z-Score are negative and positive for firms in the grey zone and the distress zone, respectively. These findings suggest that, using the Kothari et al. (2005) model, managers of firms in the grey zone are more likely to manage earnings downward than managers of healthy firms, while managers of firms in the distress zone, consistent with the debt hypothesis, are more likely to manage earnings upward than managers of healthy firms.
The signs of control variables in Models 3 and 4 are consistent with expectations and with those in Models 1
and 2 (Table 6), except for the variable ROA in Model 3 which shows a negative and significant sign at the 1% level. This suggests that more profitable firms are likely to reduce negative discretionary accruals in order to demonstrate a better financial situation to the stakeholders.
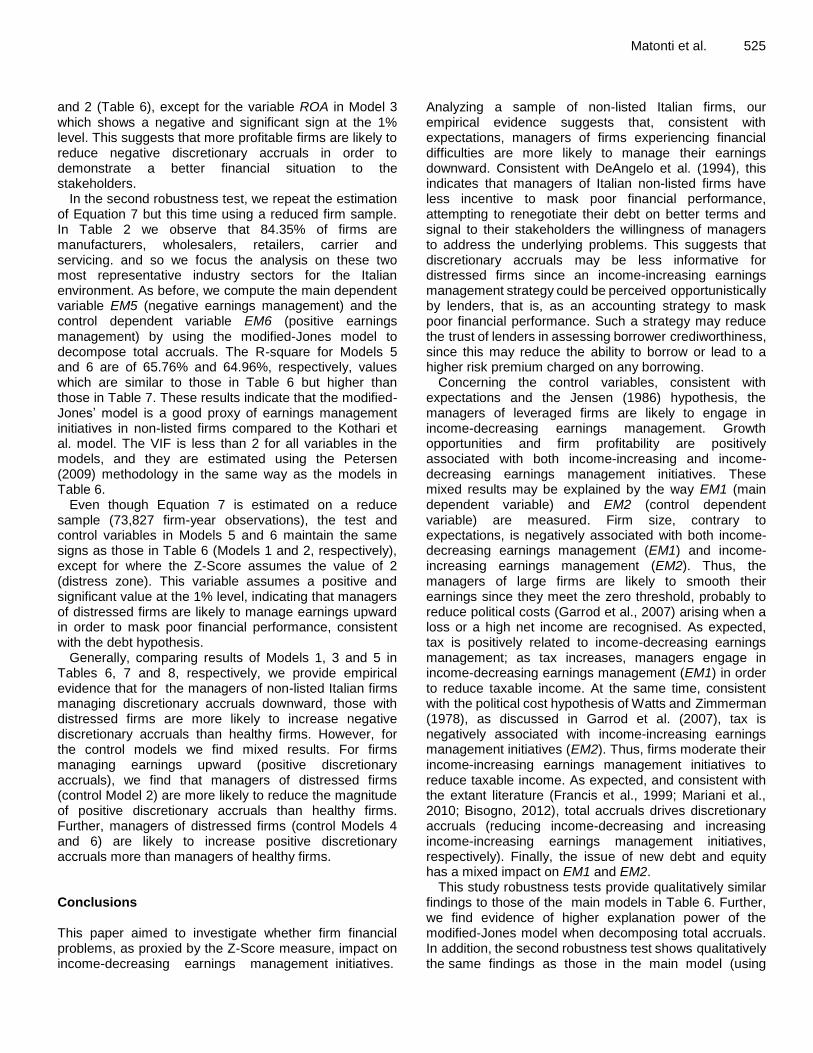
In the second robustness test, we repeat the estimation of Equation 7 but this time using a reduced firm sample. In Table 2 we observe that 84.35% of firms are manufacturers, wholesalers, retailers, carrier and servicing. and so we focus the analysis on these two most representative industry sectors for the Italian environment. As before, we compute the main dependent variable EM5 (negative earnings management) and the control dependent variable EM6 (positive earnings management) by using the modified-Jones model to decompose total accruals. The R-square for Models 5 and 6 are of 65.76% and 64.96%, respectively, values which are similar to those in Table 6 but higher than those in Table 7. These results indicate that the modified-Jones’ model is a good proxy of earnings management initiatives in non-listed firms compared to the Kothari et al. model. The VIF is less than 2 for all variables in the models, and they are estimated using the Petersen (2009) methodology in the same way as the models in Table 6.
Even though Equation 7 is estimated on a reduce sample (73,827 firm-year observations), the test and control variables in Models 5 and 6 maintain the same signs as those in Table 6 (Models 1 and 2, respectively), except for where the Z-Score assumes the value of 2 (distress zone). This variable assumes a positive and significant value at the 1% level, indicating that managers of distressed firms are likely to manage earnings upward in order to mask poor financial performance, consistent with the debt hypothesis.
Generally, comparing results of Models 1, 3 and 5 in Tables 6, 7 and 8, respectively, we provide empirical evidence that for the managers of non-listed Italian firms managing discretionary accruals downward, those with distressed firms are more likely to increase negative discretionary accruals than healthy firms. However, for the control models we find mixed results. For firms managing earnings upward (positive discretionary accruals), we find that managers of distressed firms (control Model 2) are more likely to reduce the magnitude of positive discretionary accruals than healthy firms. Further, managers of distressed firms (control Models 4 and 6) are likely to increase positive discretionary accruals more than managers of healthy firms. Conclusions This paper aimed to investigate whether firm financial problems, as proxied by the Z-Score measure, impact on income-decreasing earnings management initiatives.
Matonti et al. 525 Analyzing a sample of non-listed Italian firms, our empirical evidence suggests that, consistent with expectations, managers of firms experiencing financial difficulties are more likely to manage their earnings downward. Consistent with DeAngelo et al. (1994), this indicates that managers of Italian non-listed firms have less incentive to mask poor financial performance, attempting to renegotiate their debt on better terms and signal to their stakeholders the willingness of managers to address the underlying problems. This suggests that discretionary accruals may be less informative for distressed firms since an income-increasing earnings management strategy could be perceived opportunistically by lenders, that is, as an accounting strategy to mask poor financial performance. Such a strategy may reduce the trust of lenders in assessing borrower crediworthiness, since this may reduce the ability to borrow or lead to a higher risk premium charged on any borrowing.
Concerning the control variables, consistent with expectations and the Jensen (1986) hypothesis, the managers of leveraged firms are likely to engage in income-decreasing earnings management. Growth opportunities and firm profitability are positively associated with both income-increasing and income-decreasing earnings management initiatives. These mixed results may be explained by the way EM1 (main dependent variable) and EM2 (control dependent variable) are measured. Firm size, contrary to expectations, is negatively associated with both income-decreasing earnings management (EM1) and income-increasing earnings management (EM2). Thus, the managers of large firms are likely to smooth their earnings since they meet the zero threshold, probably to reduce political costs (Garrod et al., 2007) arising when a loss or a high net income are recognised. As expected, tax is positively related to income-decreasing earnings management; as tax increases, managers engage in income-decreasing earnings management (EM1) in order to reduce taxable income. At the same time, consistent with the political cost hypothesis of Watts and Zimmerman (1978), as discussed in Garrod et al. (2007), tax is negatively associated with income-increasing earnings management initiatives (EM2). Thus, firms moderate their income-increasing earnings management initiatives to reduce taxable income. As expected, and consistent with the extant literature (Francis et al., 1999; Mariani et al., 2010; Bisogno, 2012), total accruals drives discretionary accruals (reducing income-decreasing and increasing income-increasing earnings management initiatives, respectively). Finally, the issue of new debt and equity has a mixed impact on EM1 and EM2.
This study robustness tests provide qualitatively similar findings to those of the main models in Table 6. Further, we find evidence of higher explanation power of the modified-Jones model when decomposing total accruals. In addition, the second robustness test shows qualitatively the same findings as those in the main model (using
526 Afr. J. Bus. Manage.
Table 8. Linear regression model of the determinants of earnings management – Second robustness test (discretionary accruals estimated using the modified Jones model).
Variable Expected sign
Model 5 (main model):
Dependent variable EM5
(negative DA)
(obs. 36,125 = 41.27%)
Model 6 (control model):
Dependent variable EM6
(positive DA)
(obs. 51,400 = 58.73%))
Coeff. St. err. p-value Sig. Coeff. St. err. p-value Sig.
Test variable
DISTRESS:
Grey zone + 0.005 0.000 0.000 *** -0.000 0.001 0.207 -
Distress zone + 0.007 0.000 0.000 *** 0.007 0.000 0.000 ***
Control variable
LEV + 0.015 0.001 0.000 *** -0.010 0.001 0.000 ***
GROW + 0.002 0.001 0.133 - 0.006 0.001 0.000 ***
ROA + 0.003 0.003 0.326 - -0.005 0.003 0.052 *
SIZE + 0.001 0.000 0.000 *** -0.001 0.000 0.000 ***
TAX + 0.003 0.000 0.000 *** -0.003 0.000 0.000 ***
TACC - 0.497 0.003 0.000 *** 0.472 0.003 0.000 ***
DEBTCH - 0.001 0.000 0.000 *** -0.002 0.000 0.000 ***
EQUTCH - -0.004 0.000 0.000 *** 0.007 0.000 0.000 ***
constant -0.031 0.001 0.000 *** 0.056 0.001 0.000 ***
Sample firms (balanced): Model 5 description: Model 6 description:
N° firms: 8,203 F(16, 87524) = 2,422.71 Prob>F = 0.000 F(16, 87524) = 2,488.32 Prob>F = 0.000
N° obs.: 73,827 R-squared = 65.76% R-squared = 64.96%
VIF<2 for all variables Industry control: Yes Industry control: Yes
This table shows the second robustness linear regression, using the discretionary abnormal accruals estimated using the modified-Jones model (Dechow et al., 1995) as dependent variable. The dependent variable EM5 indicates discretionary accruals below zero, while the dependent variable EM6 indicates discretionary accruals above zero. Our sample includes only those firms belonging to the most representative industry sectors, manufacturing and wholesale firms (n= 8,203 firms; obs. 73,827). DISTRESS is a categorical variable taking the value of 0 for firm-year observations in the safe zone, 1 for observations in the grey zone, and 2 for observations in the distressed zone. In our model, the safe zone is omitted in order to test the effect of firms experiencing financial difficulties on their earnings management initiatives. Model 1 is the primary model, while model 2 is a control model. The Variance Inflation Factor (VIF) is less than 2 for all model variables. Variable descriptions and measurement are provided in Table 2. *** = 1% level of significance; **= 5% level of significance; *= 10% level of significance.
signed discretionary accruals as the dependent variable), indicating that for firms showing negative discretionary accruals (income-decreasing earnings management), the managers of distressed firms are more likely to increase the magnitude of these accruals than the managers of healthy firms.
The findings have several implications for academics, professionals and domestic standard setters. First, they suggest that a deterioration in firm financial performance creates managerial incentives to manage earnings downward, within firms showing negative discretionary accruals. However, our robustness tests indicate that for firms showing positive discretionary accruals (suggesting income-increasing earnings management), the managers of distressed firms are likely to reduce the magnitude of these accruals.
Overall, financial distress has a positive impact on income-decreasing and a negative impact on income-
increasing earnings management initiatives suggesting that the managers of more distressed firms are, on average, more likely to be more conservative than other firms. This may help borrowers and other creditors in assessing firm creditworthiness as they need more reliable accounting information. Second, our findings support the usefulness of Altman’s Z-Score in a non-listed firm setting for assessing financial distress risk. Third, our findings provide support for the control hypothesis, suggesting that when firms are under the monitoring and scrutiny of stakeholders, managers have a greater incentive to manage earnings downward. This may be explained by managers facing political costs due to the higher monitoring and scrutiny of firms in financial difficulties that in turn may generate a wealth transfer from owners, managers (or both in wholly-owned firms) to third parties (e.g. lenders, tax offices, etc).
This research suffers from a number of limitations.
First, generalization of our findings may be limited due to our focus solely on the Italian non-listed firm context. Second , we we were unable to investigate the earnings management behavior of bankrupt non-listed firms due to the limitations of the Aida Database. CONFLICT OF INTERESTS The authors have not declared any conflict of interests. REFERENCES Agrawal K, Chatterjee C (2015). Earnings management and financial
distress: Evidence from India. Global Business Review 16(5 suppl):140-154.
Altman E (1983). Corporate Financial Distress: A Complete Guide to Predicting, Avoiding and Dealing with Bankruptcy. New York. Wiley.
Altman EI, Iwanicz‐Drozdowska M, Laitinen EK, Suvas A (2017). Financial distress prediction in an international context: A review and
empirical analysis of Altman’s Z‐score model. Journal of International Financial Management and Accounting 28(2):131-171.
Altman E, Hotchkiss E (2006). Predict and avoid bankruptcy, analyze and invest in distressed debt. New Jersey. John Wiley & Sons.
Beaver W, Kettler P Scholes M (1970). The association between market determined and accounting determined risk measures. The Accounting Review 45(4):654-682.
Beneish MD, Vargus ME (2002). Insider trading, earnings quality, and accrual mispricing. The accounting review 77(4):755-791.
Bisogno M, Restaino M, Di Carlo A (2018). Forecasting and preventing bankruptcy: A conceptual review. African Journal of Business Management 12(9):231-242.
Bisogno M, De Luca R (2016). Voluntary Joint Audit and Earnings Quality: Evidence from Italian SMEs. International Journal of Business Research 5(1):1-22.
Bisogno M, De Luca, R (2015). Financial distress and earnings manipulation: Evidence from Italian SMEs. Journal of Accounting and Finance 4(1):42-51.
Bisogno M (2012). Audit quality of Italian industrial non-listed firms: an empirical analysis. International Journal of Business Research and Development 1(1):32-47.
Burgstahler DC, Hail L, Leuz C (2006). The Importance of Reporting Incentives: Earnings Management in European Private and Public Firms. The Accounting Review 81(5):983-1016.
Campa D (2019). Earnings management strategies during financial difficulties: A comparison between listed and unlisted French companies. Research in International Business and Finance 50:457-471.
Charitou A, Lambertides N, Trigeorgis L (2007a). Earnings behavior of financially distressed firms: the role of institutional ownership. Abacus 43(3):271-296.
Charitou A, Lambertides N, Trigeorgis L (2007b). Managerial discretion in distressed firms. The British Accounting Review 39(4):323-346.
Charitou A, Lambertides N, Trigeorgis L (2011). Distress risk, growth and earnings quality. Abacus 47(2):158-181.
Chen KY, Elder RJ, Hsieh YM (2007). Corporate governance and earnings management: The implications of corporate governance best-practice principles for Taiwanese listed companies. Journal of Contemporary Accounting and Economics 3(2):73-105.
Cohen DA, Dey A, Lys TZ (2008). Real and accrual‐based earnings management in the pre‐and post‐Sarbanes‐Oxley periods. The Accounting Review 83(3):757-787.
Cohen DA, Zarowin P (2010). Accrual-based and real earnings management activities around seasoned equity offerings. Journal of accounting and Economics 50(1):2-19.
Coppens L, Peek E (2005). An Analysis of Earnings Management by European Private Firms. Journal of International Accounting, Auditing and Taxation 14:1-17.
Matonti et al. 527 DeAngelo H, DeAngelo L, Skinner DJ (1994). Accounting choice in
troubled companies. Journal of Accounting and Economics 17(1-2):113-143.
DeAngelo LE (1981). Auditor size and audit quality. Journal of Accounting and Economics 3:183-199.
Dechow P, Ge W, Schrand C (2010). Understanding earnings quality: A review of the proxies, their determinants and their consequences. Journal of Accounting and Economics 50(2-3):344-401.
Dechow P, Sloan RG, Sweeney AP (1995). Detecting earnings management. Accounting Review 70(2):193-225.
DeFond ML, Jiambalvo J (1994). Debt covenant violation and manipulation of accruals. Journal of Accounting and Economics 17(1-2):145-176.
Dichev ID, Skinner DJ (2002). Large-Sample Evidence on the Debt Covenant Hypothesis. Journal of Accounting Research 40(4):1091-1123.
Etemadi H, Dehkordi HF, Amirkhani K (2013). Effect of auditor opinion on discretionary accruals behavior of distressed firms: Empirical evidences from Iran. African Journal of Business Management 7(20):1956-1965.
European Union (EU) (2019). 2019 SBA Fact Sheet, Italy. Available at https://ec.europa.eu/docsroom/documents/38662/attachments/1/translations/en/renditions/native
Fich EM, Slezak SL (2008). Can corporate governance save distressed firms from bankruptcy? An empirical analysis. Review of Quantitative Finance and Accounting 30 (2):225-251.
Francis JR, Maydew EL, Sparks HC (1999). The role of Big 6 auditors in the credible reporting of accruals. Auditing: a Journal of Practice and Theory 18(2):17-34.
Garcia Lara JM, García Osma B, Neophytou E (2009). Earnings quality
in ex‐post failed firms. Accounting and Business Research 39(2):119-138.
Garrod N, Ratej PS, Valentincic A (2007). Political cost (dis) incentives for earnings management in private firms. Available at: https://ssrn.com/abstract=969678
Gilson SC (1989). Management turnover and financial distress. Journal of Financial Economics 25(2):241-262.
Givoly D, Hayn C (2000). The changing time-series properties of earnings, cash flows and accruals: Has financial reporting become more conservative? Journal of Accounting and Economics 29(3):287-320.
Gorganli J, Vakilifard H (2014). The effect of firm size and growth opportunity on accounting discretion and its relationship with future stock return (management opportunism test). European Online Journal of Natural and Social Sciences 3(3):511-521.
Graham J, Harvey C, Rajgopal S (2005). The economic implications of corporate financial reporting. Journal of Accounting and Economics 40(1-3):3-73.
Guay WR, Kothari, SP, Watts RL (1996). A market-based evaluation of discretionary accrual models. Journal of Accounting Research 34:83-105.
Habib A, Bhuiyan BU, Islam A (2013). Financial distress, earnings management and market pricing of accruals during the global financial crisis. Managerial Finance 39(2):155-180.
Humeedat MM (2018). Earnings Management to Avoid Financial Distress and Improve Profitability: Evidence from Jordan. International Business Research 11(2):222-230.
ISTAT (2018), Italian Statistic Institute, Registro Statistico delle Imprese Attive (Statistic Register of Italian Firms. Available at: http://dati.istat.it/Index.aspx?QueryId=20596
Jaggi B, Lee P (2002). Earnings management response to debt covenant violations and debt restructuring. Journal of Accounting, Auditing and Finance 17(4):295-324.
Jelinek K (2007). The effect of leverage increases on earnings management. The Journal of Business and Economic studies 13(2):24.
Jensen MC (1986). Agency costs of free cash flow, corporate finance, and takeovers. The American Economic Review 76(2):323-329.
Jensen MC, Meckling WH (1976). Theory of the Firm: Managerial Behavior, Agency and Ownership Structure. Journal of Financial Economics 3(4):305-360.
528 Afr. J. Bus. Manage. Jha A (2013). Earnings management around debt-covenant violations–
An empirical investigation using a large sample of quarterly data. Journal of Accounting, Auditing and Finance 28(4):369-396.
Kothari SP, Leone AJ, Wasley CE (2005). Performance matched discretionary accrual measures. Journal of Accounting and Economics 39(1):163-197.
Lazzem S, Jilani F (2018). The impact of leverage on accrual-based earnings management: The case of listed French firms. Research in International Business and Finance 44:350-358.
Lubawa G, Louangrath P (2016). Using Altman z-score to assess the financial effects of Multiple loans on SMEs. International Journal of Research & Methodology in Social Science 2(1):63-86.
Mafrolla E, D’Amico E (2017). Borrowing capacity and earnings management: An analysis of private loans in private firms. Journal of Accounting and Public Policy 36(4):284-301.
Mariani L, Tettamanzi P, Corno F (2010). External Auditing vs Statutory Committee Auditing: the Italian Evidence. International Journal of Auditing 14:25-40.
Mohammadi F, Amini P (2016). Investigating The Relationship Between Financial Distress and Earnings Management in Corporations of Accepted in Tehran Stock Exchange. International Academic Journal of Accounting and Financial Management 3(6):41-50.
Nagar N, Sen K (2016). Earnings management strategies during financial distress. Indian Institute of Management Ahmedabad. Research and Publication. pp. 1-42.
Nalarreason KM, Sutrisno T, Mardiati E (2019). Impact of leverage and firm size on earnings management in Indonesia. International Journal of Multicultural and Multireligious Understanding 6(1):19-24.
Opler TC, Titman S (1994). Financial distress and corporate performance. The Journal of Finance 49(3):1015-1040.
Panda B, Leepsa NM (2017). Agency theory: Review of theory and evidence on problems and perspectives. Indian Journal of Corporate Governance 10(1):74-95.
Petersen MA (2009). Estimating standard errors in finance panel data sets: Comparing approaches. The Review of Financial Studies 22(1):435-480.
Poli S (2013a). Small-sized companies’ earnings management: Evidence from Italy. International Journal of Accounting and Financial Reporting 3(2):93-109.
Poli S (2013b). The Italian unlisted companies’ earnings management practices: The impacts of fiscal and financial incentives. Research Journal of Finance and Accounting 4(11):48-60.
Poli S (2015). The links between accounting and tax reporting: The case of the bad debt expense in the Italian context. International Business Research 8(5):93-100.
Ranjbar S, Farsad Amanollahi G (2018). The effect of financial distress on earnings management and unpredicted net earnings in companies listed on Tehran Stock Exchange. Management Science Letters 8(9):933-938.
Rosner RL (2003). Earnings manipulation in failing firms. Contemporary
Accounting Research 20(2):361-408. Shan D, Cao G, Dong H (2013). LGMS-FOA: an improved fruit fly
optimization algorithm for solving optimization problems. Mathematical Problems in Engineering 13:1-9.
Skinner DJ, Sloan RG (2002). Earnings surprises, growth expectations, and stock returns or don’t let an earnings torpedo sink your portfolio. Review of Accounting Studies 7(2-3):289-312.
Smith M, Kestel JA, Robinson P (2001). Economic recession, corporate distress and income increasing accounting policy choice. Accounting Forum 25(4):334-352.
Subramanyam KR (1996). The pricing of discretionary accruals. Journal of Accounting and Economics 22:249-282.
Sweeney AP (1994). Debt-covenant violations and managers' accounting responses. Journal of Accounting and Economics 17(3):281-308.
Ugrin JC, Mason TW, Emley A (2017). Culture’s consequence: The relationship between income-increasing earnings management and IAS/IFRS adoption across cultures. Advances in Accounting 37:140-151.
Van Tendeloo B, Vanstraelen A (2008). Earnings management and audit quality in Europe: Evidence from the private client segment market. European Accounting Review 17(3):447-469.
Watts RL, Zimmerman JL (1978). Towards a positive theory of the determination of accounting standards. Accounting Review 53(1):112-134.
Watts R, Zimmerman J (1986). Positive accounting theory. Englewood Cliffs, New Jersey: Prentice-Hall.
Yang WS, Chun LS, Ramadili SM (2009). The effect of board structure and institutional ownership structure on earnings management. International Journal of Economics and Management 3(2):332-353.