the impact of diversity of ownership scale on social ... · i the impact of diversity of ownership...
TRANSCRIPT

AGRICULTURE, ENVIRONMENT AND MARINE
researchsocial
The impact of diversity ofownership scale on social,economic and environmentaloutcomes

i
The impact of diversity of ownership scale on social, economic and environmental outcomes: Exploration and case studies CR/2014/19 Final Report to the Scottish Government
March 2016
Authors:
Steven Thomson1, Andrew Moxey4, Andy Wightman, Annie McKee3,
Dave Miller3, Ellie Brodie1, Jayne Glass2, Jon Hopkins3, Keith Mathews3,
Ken Thomson3, Rob Mc Morran1 and Rosalind Bryce2.
1 Scotland‟s Rural College (SRUC) 2 Centre for Mountain Studies, University of Highlands and Islands 3 James Hutton Institute (JHI) 4 Pareto Consulting
Andy Wightman

2
The views expressed in this report are those of the researchers and do not necessarily represent those of the Scottish Government or Scottish
Ministers.

3
Contents
Contents ................................................................................................................ 3
List of Figures ....................................................................................................vi
List of Tables .....................................................................................................vi
List of Acronyms ............................................................................................... vii
Executive Summary ................................................................................................ 1
Background ............................................................................................................ 1
Main findings .......................................................................................................... 1
Economic change .................................................................................................. 2
Societal Change .................................................................................................... 2
Environmental Change .......................................................................................... 2
Methodology .......................................................................................................... 3
Policy and Project Background ............................................................................. 4
General Policy Influence on Land Ownership ....................................................... 4
Contemporary Land Reform Policy in Scotland ..................................................... 5
Diversity of Ownership in Scottish Policy .............................................................. 7
Methodology .......................................................................................................... 11
Observations on qualitative approach to data gathering ..................................... 13
Case Study Selection .......................................................................................... 15
Option estates / parishes ................................................................................. 15
Selected Paired Case Studies ......................................................................... 16
Scottish Land Ownership Overview .................................................................... 19
Land ownership concentration ............................................................................. 19
Land ownership churn ......................................................................................... 19
Land Settlement ................................................................................................... 20
Break up of large estates ..................................................................................... 21
Landownership change and scale factors ........................................................... 22
Sustainable Development Frameworks ............................................................... 24
Outcomes Framework ......................................................................................... 24
Other Factors Framework .................................................................................... 27
Results .................................................................................................................... 34
Land ownership and tenure ................................................................................. 34
Land ownership changes from 1900 ............................................................... 34

4
Agricultural Holding Size, 1982-2012 .............................................................. 38
Agricultural Tenure .......................................................................................... 39
Economy .............................................................................................................. 41
Successful businesses .................................................................................... 42
High-Quality Jobs ............................................................................................ 46
People .............................................................................................................. 48
Society ................................................................................................................. 49
Good-quality, affordable homes....................................................................... 49
Migration .......................................................................................................... 52
Community Activities and Spaces ................................................................... 53
Community Outdoor Benefits ........................................................................... 56
Environment ......................................................................................................... 56
Public Benefits from Environment.................................................................... 57
Healthy environment ........................................................................................ 58
Carbon Footprint .............................................................................................. 60
Main drivers of change ........................................................................................ 61
Conclusions ........................................................................................................... 63
The influence of landownership scale ................................................................. 63
Drivers of Change ................................................................................................ 64
Economic Change ........................................................................................... 65
Societal Change .............................................................................................. 66
Environmental Change .................................................................................... 67
Methodological considerations ............................................................................ 68
Appendix 1: Policy factors (1900-1980) and policy timeline (1900-2014) affecting Scottish land ownership ....................................................................... 70
Policy Factors ...................................................................................................... 70
Pre-First World War ......................................................................................... 70
The First World War and the 1920s ................................................................. 70
The Second World War and the Immediate Post-War Years .......................... 71
The 1950s, 1960s and 1970s .......................................................................... 72
Policy influences in the 1980s and 1990s ....................................................... 73
Policy influences since 2000............................................................................ 74
Policy Timeline ..................................................................................................... 74
Appendix 2 - Case Study Semi-Structured Interview prompt ........................... 79

5
Appendix 3 – Focus Group Schedule .................................................................. 82
Appendix 4 - Case Study Selection ..................................................................... 84
Altitude / topography ........................................................................................ 84
Land Capability for Agriculture......................................................................... 84
Land Cover of Scotland (LCS88) ..................................................................... 85
Peripherality (8 fold rural urban classification) ................................................. 86
Less Favoured Area (LFA) .............................................................................. 86
Agricultural Holdings ........................................................................................ 88
Appendix 5 – Land ownership scale factors ....................................................... 89
Appendix 6 – Case study change timelines ........................................................ 91
Appendix 7 – Case study agricultural data tables............................................ 100
Appendix 8 - References ..................................................................................... 105
vi
List of Figures
Figure 1 Area of each LCA (as % of Parish) for option parishes - anonymised ............................ 16 Figure 2 Factors affecting land ownership and potential impact on scale ...................................... 23 Figure 3 Principal land ownership changes in case study 1a ........................................................ 34 Figure 4 Principal land ownership changes in case study 1b ........................................................ 35 Figure 5 Principal land ownership changes in case study 2a ........................................................ 36 Figure 6 Principal land ownership changes in case study 2b ........................................................ 36 Figure 7 Principal land ownership changes in case study 3a ........................................................ 37 Figure 8 Principal land ownership changes in case study 3b ........................................................ 37 Figure 9 Distribution of agricultural holdings under and over 20 hectares 1982 - 2012 .................. 38 Figure 10 Tenure of agricultural land, 1982 - 2012 ........................................................................ 40 Figure 11 Occupier types of agricultural holdings 1982-2012 ........................................................ 42 Figure 12 On-farm workers (per 1,000 hectares), 1982 -2012 ....................................................... 44 Figure 13 Employment status of 16-74 year olds. 1991 – 2011 ..................................................... 46 Figure 14 Sectors of employment 2001 and 2011 ......................................................................... 47 Figure 15 Population structure, 1991 to 2011 ................................................................................ 49 Figure 16 Tenure of housing stock 1991-2011 .............................................................................. 50 Figure 17 Average house price 1993-2011 ................................................................................... 51 Figure 18 Residents‟ place of birth, 1991 to 2011 ......................................................................... 52 Figure 19 Agricultural land use 1982-2012 .................................................................................... 57 Figure 20: Elevation Statistics for Option Parishes - anonymised .................................................. 84 Figure 21: LCA Area (as % of Parish) for Option Parishes - Anonymised ..................................... 85 Figure 22: LCS88 Area (as % of Parish) for Option Parishes ........................................................ 86 Figure 23: Urban-Rural Classification (2013-2014) area as % of Parish for Option Parishes ........ 87 Figure 24 : LFA Area (as % of Parish) for Option Parishes ........................................................... 87 Figure 25: Count of Agricultural Holdings (2014) for Option Parishes - Anonymised ..................... 88 Figure 26 Main Common Agricultural Policy Payments, 2014 .................................................... 104
List of Tables
Table 1 Reference to diversity of land ownership in key land reform documentation ....................... 8 Table 2 Anonymised description of case study pairs ..................................................................... 17 Table 3 Land ownership trends during the last century ................................................................. 21 Table 4 Outcomes Framework ...................................................................................................... 25 Table 5 Other Factors Framework ................................................................................................ 28 Table 6 Direct CAP support and LFASS payments, 2014 ............................................................. 43 Table 7 Average economic intensity of agricultural activity, 2014 .................................................. 43 Table 8 Council tax band of dwellings, 2011 and housing stock turnover, 2001 and 2011 ............ 52 Table 9 Agri-environment scheme claimants and payments, 2000-2006 ....................................... 58 Table 10 Proportion of case study covered by selected environmental designations, 2014 .......... 59 Table 11 Water bodies classified as less than good, 2015 ............................................................ 59 Table 12 Total woodland area, and estimated recent woodland planting, 2014 ............................. 60 Table 13 Key influencing factors in achieving local outcomes identified by case study participants using multi criteria analysis. .......................................................................................................... 61 Table 14 Factors influencing scale of land ownership ................................................................... 89 Table 15 Drivers of economic change in case studies identified by fieldwork participants, 1910-2015.............................................................................................................................................. 91 Table 16 Drivers of societal change in case studies identified by fieldwork participants, 1910-2015 ..................................................................................................................................................... 94 Table 17 Drivers of environmental change in case studies identified by fieldwork participants, 1910-2015..................................................................................................................................... 98 Table 18 Agricultural Holding Size Distribution, 1982 to 2012 (JAC) ........................................... 100 Table 19 Agricultural land ownership and use distribution, 1982 to 2012 (JAC) ......................... 101 Table 20 Proportion of holdings by land ownership and land use, 1982 to 2012 (JAC) .............. 102 Table 21 Agricultural holding occupiers and workers, 1982 to 2012 (JAC) ................................. 103
vii
List of Acronyms
CAP Common Agricultural Policy
CDB Congested Districts Board
ESA Environmentally Sensitive Area
EU European Union
FIT Feed In Tariff
GIS Geographical Information System
JAC June Agricultural Census
LCA Land Capability for Agriculture
LCS Land Cover Scotland
LFA Less Favoured Area
LFASS Less Favoured Area Support Scheme
LRPG Land Reform Policy Group
LRRG Land Reform Review Group
MCA Multi-Criteria Analysis
NIMBY Not In My Back Yard
NNR National Nature Reserve
RESAS Rural and Environment Science and Analytical Services
SAC Special Area of Conservation
SEPA Scottish Environment Protection Agency
SLR Standard Labour Requirement
SNH Scottish Natural Heritage
SPA Special Protection Area
SRDP Scotland Rural Development Programme
SSSI Sites of Special Scientific Interest
WWI First World War
WWII Second World War
1
Executive Summary
Background
This research report was commissioned by the Scottish Government to offer some insights into the local impacts of differing scales of rural land ownership in Scotland on social, economic and environmental outcomes. The study considered three case study pairs of parishes, each comprising a parish dominated by one or more large land owners and a nearby comparator parish that had historically been dominated by one or more large land owners but is no longer due to ownership fragmentation at some point. The findings presented here are intended to inform both the on-going development of Scotland‟s land reform policy and current deliberations over the Land Reform (Scotland) Bill.1
Main findings
Land ownership scale is one of a myriad of factors that influence the economic, social and environmental development of rural communities. The complexity of ownership motivations, societal, policy and economic interactions in driving community development means that it is too simplistic to conclude that scale of land ownership is a significant factor in the sustainable development of communities.
There was a wide range of land ownership scales and degrees of land ownership fragmentation within the selected case studies and different local community development pathways that have resulted in quite different local sustainable development outcomes. Whilst it therefore may be tempting to conclude that the different local outcomes were related to land ownership factors, the research findings confirm that interactions of other factors have a very strong bearing on local development.
Indeed the key historical (and current) forces of change in the case studies were often reported by research participants as not being directly related to land ownership, instead being driven by a range of general socio-economic factors: regional economic growth, mechanisation, reduced land based workforce, mobility of people, housing developments, tourism growth, infrastructure, communications, commuters, second homes, ageing populations, improved standards of living etc.
The types of change faced by communities are heavily influenced by location – more specifically accessibility of urban areas. Changes in land-based employment, demography and housing development were influenced by
1 However, crofting and community ownership were not within the remit of this study which
excluded most areas in the Highlands and Islands. Similarly, whilst estates with agricultural tenants were included in the study agricultural tenure was not a principal focus of the study.

2
proximity to urban areas. Accessible areas had population growth and housing developments driven by urban based employment and commuting opportunities, whilst more remote areas had less population growth, higher shares of employment in farming, forestry, a growing reliance on the tourism sector and higher proportions of housing stock used as second homes and tourism accommodation. Choices made by land owners clearly influence the availability of land for housing development, but so do local and national policies (e.g. council/social housing, planning permission).
Economic change
Land-based businesses referred spontaneously to land tenure issues and to the possible effects of ownership scales, both in terms of the trend over time towards increased enterprise size and also landlord-tenant relationships. However, whilst other businesses and wider community interests occasionally acknowledged land ownership as a factor, they more commonly focused on other policy spheres (e.g. communications) and general trends (e.g. urbanisation) as more important. Land-based businesses were acutely aware of the direct influence of support payments on business viability. Tourism was acknowledged as an important component in rural economies, but pressure on housing availability and employment quality were noted. Areas with fragmented-ownership did, however, exhibit higher agricultural output and higher population growth than concentrated-ownership parishes, though not necessarily attributable to ownership scale.
Societal Change
Social changes were attributed to a mix of discrete local events and more diffuse trends. For example, the loss of public transport (e.g. trains, buses), the closure of local shops (e.g. post office, grocers) and services (e.g. school, banks, doctors) were commonly cited as identifiable events weakening community vitality. Equally, wider trends such as declining church attendances, increasing car ownership and greater reliance on multimedia entertainment were also commonly cited as negative influences on community cohesion and participation. Patterns of land ownership were not generally regarded as significant in determining social outcomes relative to other factors.
Environmental Change
Land ownership was mentioned only infrequently in relation to environmental quality, noting the potential for large landowners to coordinate across wider areas but also for absentee landlords to neglect some aspects of land management. Environmental designations, aspects of the CAP, and forestry grants and taxes were identified as key drivers of such changes, although the role of earlier incarnations of the CAP in removing dykes and hedges was also noted.

3
Methodology
Each case study pair was selected through careful inspection of both current and historical data across Scotland relating to (in particular) land ownership, land use, land capability and remoteness. The scientific matching process controlled, as far as possible, for confounding factors to identify nearby and broadly physically comparable parishes with different land ownership patterns.
In addition to the selection framework developed to support objective selection of case studies, other frameworks were also developed. Drawing on previous research and published literature, these frameworks describe the types of social, economic and environmental outcomes characterising sustainable rural development and identify factors other than land ownership that also affect development. These frameworks were used to guide data collection and interpretation for each of the case studies.
Quantitative data from a variety of sources were collated to describe recent and current trends in each parish in relation to, for example, land use, population size and environmental condition. Qualitative fieldwork was then undertaken in each parish to elicit information from local stakeholders, including estate owners, farmers, other businesses and community representatives (although younger and in-migrant groups were under-represented).
The methodological approach adopted proved effective in structuring how data were collected and interpreted plus selecting broadly comparable cases for exploration. There may be merit in establishing more routine and/or regular monitoring of social, economic and environmental development in selected areas to help improve understanding of how various factors interact to influence outcomes in different locations.

4
Policy and Project Background Land use across much of Scotland takes place within a complex pattern of land ownership and tenure, with size, climate, land capability, distance to markets, traditions, management objectives, support policies, fiscal policies, exchanges rates, etc. all playing important roles.
The owners of private estates and large farms represent sources of local power that historically have had significant impacts on the socio-economic conditions across rural Scotland, with such owners having significant control over the availability of housing, employment opportunities and development opportunities (Bird, 1982; McKee, 2013). McGregor (1993) acknowledged the influence landowners have in many areas of rural Scotland, suggesting: “large landowners play a crucial role in local development: they are the rural planners". Whilst there is growing acceptance that some large privately owned estates are “amongst the most dynamic and innovative of owners” (Munton, 2009), questions have been raised with regard to the extent to which the motivations and personal choices of private landowners are compatible with sustainable land management (Macmillan et al., 2010).
General Policy Influence on Land Ownership
Land use in rural Scotland falls within a number of overlapping policy spheres (e.g. agriculture, forestry, energy) and is subject to a range of policy instruments (e.g. subsidies, taxes, regulation), some of which are determined at European level, some at a UK level and some within Scotland. However, relatively few policy measures are concerned explicitly with types of owner or scale of ownership per se. For example, in contrast to some other countries, there are no specific policy targets or controls in relation to who can own land or how much land can be owned by one individual in Scotland.
Hence, although particular types of owner (e.g. crofter, public sector) or ownership structures (e.g. community) are explicitly favoured in some cases by financial or regulatory measures, policy generally influences ownership only indirectly via how land may be used and the rewards accruing to it. In particular, agricultural, forestry and wild game policies and taxation policy affect both income and capital values, and hence influence individuals‟ and institutions‟ incentives to buy, keep or sell rural land. However, motivations for owning land vary (e.g. income, recreation, privacy), and responsiveness to such incentives also vary across different types of owner and land holdings (e.g. farming vs. game management vs. housing).
Excluding crofting and community land ownership legislation and policy, that were outwith the remit of this project, there has been considerable change in policies that have influenced rural (mainly agricultural) land ownership in Scotland over the past 100 years or so. Appendix 1 contains a review of key changes in these policy factors that have influenced land ownership since
5
1900 that includes: taxation of land transfers by inheritance through estate duties/inheritance tax; capital gains tax; agricultural relief for both inheritance tax and capital gains tax; state intervention in agriculture during the World Wars; agricultural support policies (including the Common Agricultural Policy); security of agricultural tenure since the 1940s; state forestry investment, fiscal relief for forestry investment, etc. Moreover, macro-economic policy, such as the setting of interest and exchange rates, also has an influence on land ownership.2
Contemporary Land Reform Policy in Scotland
The Land Reform Policy Group (LRPG) was established by the Scottish Office in 1997 under the chairmanship of Lord Sewel, “to identify and assess proposals for land reform in rural Scotland, taking account of their cost, legislative and administrative implications and their likely impact on the social and economic development of rural communities and on the natural heritage" (LRPG, 1998). In the 1998 John McEwen Memorial Lecture Dewar (1998) hinted at the post devolution direction of travel towards contemporary land reform in Scotland, emphasising the need to “sweep away outdated land laws, properly securing the public interest in land use and land ownership, increasing local involvement and accountability.”
The first key step in the contemporary land reform process was the Abolition of Feudal Tenure etc. (Scotland) Act 2000 which removed the centuries-old system of land ownership whereby „vassals‟ could be restricted in activities on their land through feudal burdens. This Act simplified titles to land, and the Title Conditions (Scotland) Act 2003 modernised the types of interests and legitimate burdens that can be attached to titles to land.
The Land Reform (Scotland) Act 2003 introduced measures aimed at addressing greater diversity in ownership through the community (pre-emptive3) right to buy (Part 2) and the crofting community (absolute4) right to buy (Part 3) and statutory non-motorised access rights over most land (and inland water) for all (Part 1). Additionally, the Agricultural Holdings (Scotland) Act 2003 sought to reinvigorate the tenanted farming sector with Part 2 introducing the tenant farmers‟ (pre-emptive) right to buy their holding5.
2 A detailed consideration of macroeconomic impacts was beyond the scope of this project.
3 Land owners wishing to sell land must offer first refusal of the land to a community/tenant if
they have successfully registered an interest in the land (http://rcil.ros.gov.uk). 4 Crofting communities can, under certain conditions, force the sale of land from an unwilling
seller. 5 At the time it was thought that the reforms would improve landlord confidence in making
more let land available thereby encouraging new entrants into the industry, but amidst the passing of the Act through Parliament consideration of an option for an absolute right to buy caused concerns amongst landowners that led many to withdraw further from the let market amongst fears of the Scottish Government revisiting this option in the future.
6
More recently, the creation of the Land Reform review Group (LRRG) by the Scottish Government in July 2012, the House of Commons Scottish Affairs Committee‟s Inquiry into Land Reform in Scotland,6 the Community Empowerment Act (Scotland) 20157, and the introduction of the Land Reform (Scotland) Bill8 in 2015 have highlighted the continued political interest in the subject and a political appetite for further progressive reform. All aspects of land ownership and the potential for reform to create greater diversity of ownership across Scotland are therefore currently being scrutinised.
In Scotland land is treated differently to other property with regards to laws of succession (inheritance) and primogeniture in relation to land was only abolished in the 1960s. However, succession law in Scotland continues to protect land holdings from being broken-up upon inheritance, as it is still permissible to omit family members from bequeaths, meaning land holdings can be held in their entirety inter-generationally and in perpetuity (LRRG, 2014). These factors have been identified as the principal cause of Scotland having the most concentrated pattern of land ownership in Europe (Warren, 2009; Hunter et al., 2014). The LRRG (2014) recommended that “the Scottish Government in the interests of social justice, develop proposals in consultation with the Scottish Law Commission for legislation to end the distinction between immoveable and moveable property in Scotland’s laws of succession”. The Scottish Government subsequently published a consultation seeking views on proposals by the Scottish Law Commission to modernise succession law, including removing the distinction between heritable and movable property (Scottish Government, 2015).
The LRRG (2014) note that “in terms of addressing rural housing need, there are three issues which need to be considered: patterns of tenure and ownership, providing sufficient land for housing development (at the right price) and the most effective use of existing property. The concentration of land ownership in rural Scotland means that all three of these areas are still dependent to a large extent, on the attitudes and decisions of a relatively small number of people and the asset policies of a relatively few public sector agencies.” As such they recommended a National Housing Land Corporation be established charged with the acquisition and development of land, and to have an extended remit in small rural communities where there is market failure in the land market .
The LRRG (2014) stated that “the concentration of private ownership in rural Scotland can often stifle entrepreneurial ambition, local aspirations and the ability to address identified community need … The Group considers that a
6 http://www.parliament.uk/business/committees/committees-a-z/commons-select/scottish-
affairs-committee/inquiries/parliament-2010/land-reform-in-scotland/ 7 http://www.legislation.gov.uk/asp/2015/6/contents/enacted
8 http://www.scottish.parliament.uk/S4_Bills/Land%20Reform%20(Scotland)%20Bill/b76s4-
introd.pdf
7
less concentrated pattern of land ownership would open up increased economic and social opportunities in many parts of rural Scotland, helping create stronger and more resilient rural communities”. They acknowledged that some owners are concerned in the well-being of communities but recommended that there should be an upper limit set for the amount of land held by a single private owner or beneficial interest.
The Community Empowerment (Scotland) Act 20159 introduced a community right to buy land if the land is abandoned or neglected (and there is a new Register of Community Interests in Abandoned or Neglected Land). Unlike the existing community rights to buy land this new right to buy is not pre-emptive but is rather absolute, whereby Scottish Ministers can compel the owner to sell the land to the community.
The Land Reform (Scotland) Bill10 was introduced to the Scottish Parliament on the 22 June 2015 and contains provisions that aim to:
ensure the development of an effective system of land governance andon-going commitment to land reform in Scotland;
address barriers to furthering sustainable development in relation toland and improve the transparency and accountability of landownership; and
demonstrate commitment to effectively manage land and rights in landfor the common good, through modernising and improving specificaspects of land ownership and rights over land.
Diversity of Ownership in Scottish Policy
The LRPG (1998) concluded that the existing system of landownership in Scotland was inhibiting development in rural communities and causing degradation of the natural heritage as a result of poor land management (LRPG, 1998). This conclusion ultimately led to the adoption of the main objective of Scottish land reform policy, which remains relevant today11: “to remove the land-based barriers to the sustainable development of rural communities” (LRPG, 1999) that could “only” be achieved through:
Increasing diversity in land ownership – between private, public,partnership, not-for-profit and community sectors.
9 http://www.legislation.gov.uk/asp/2015/6/contents/enacted
10 http://www.scottish.parliament.uk/parliamentarybusiness/Bills/90675.aspx
11 See the Land Reform Bill (2015)
(http://www.scottish.parliament.uk/S4_Bills/Land%20Reform%20(Scotland)%20Bill/b76s4-introd.pdf) and the associated policy memorandum (2015) (http://www.scottish.parliament.uk/S4_Bills/Land%20Reform%20(Scotland)%20Bill/b76s4-introd-pm.pdf)

8
Increasing community involvement in local decision-making about how land is owned and managed.
After nearly a decade since the Land Reform (Scotland) Act 2003, the Scottish Government‟s Rural and Environment Science and Analytical Services (RESAS, 2012) suggested that there was a “lack of clarity over the rationale and remit of Land Reform” surrounding the land based barriers to the sustainable development of communities: “it is not clear what form this sustainable development should take, or what features should be prioritised”. They questioned whether the land-based barriers mentioned in the policy rhetoric related to ownership or stewardship, since both are likely to be important for sustainable development, with different measures required for each (i.e. potential benefits are unlikely to be accrued through changing ownership alone). They further suggested that in certain circumstances other approaches (e.g. land leasing, changes to land and asset management) may indeed be at least as effective as Land Reform policy in achieving sustainable development in rural communities.
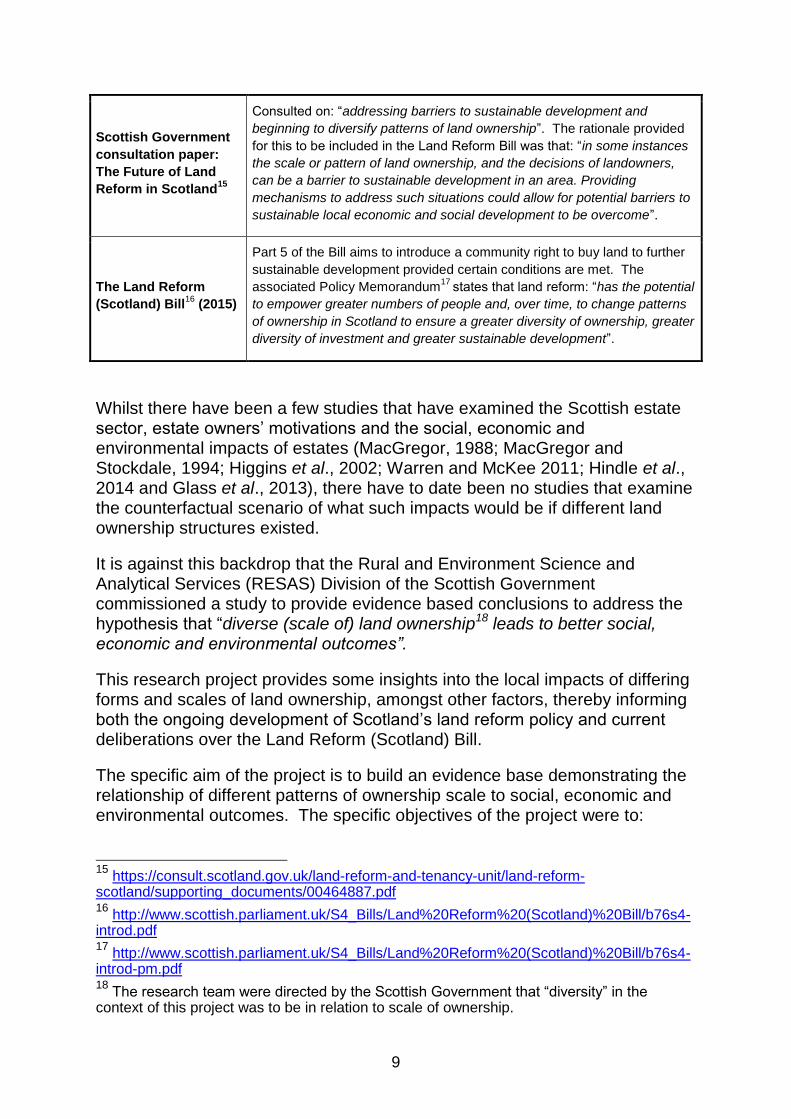
In the most recent round of the land reform debate there has been considerable reference to diversity of land ownership in the policy rhetoric, including: the independent LRRG; ministerial statements; official consultations, and; the Land Reform (Scotland) Bill (2015). These are summarised in Table 1.
Table 1 Reference to diversity of land ownership in key land reform documentation
Source Referral to scale / diversity of land ownership
Land Reform Review
Group – remit set by
Scottish Government12
Identify how land reform could “enable more people in rural and urban
Scotland to have a stake in the ownership, governance, management and
use of land, which will lead to a greater diversity of land ownership, and
ownership types, in Scotland”
Final report of the
Land Reform Review
Group (2014)
“The concentrated ownership of private land in rural communities places
considerable power in the hands of relatively few individuals, which can in
turn have a huge impact on the lives of local people and jars with the idea
of Scotland being a modern democracy. The Group considers that a less
concentrated pattern of land ownership would open-up increased economic
and social opportunities in many parts of rural Scotland, helping create
stronger and more resilient rural communities”.
Scottish Government
ministerial statement
(2014)
Aim for “a fairer, or wider and more equitable, distribution of land in
Scotland where communities and individuals have access to land”13. Aim
to “build a society with greater diversity of land ownership”14
12
http://www.scotland.gov.uk/About/Review/land-reform/Remit 13
Wheelhouse, P. (2014) Parliamentary answer to Question S4W-19122 14
Wheelhouse, P. (2014) Address to fourth Community Land Scotland conference, June 2014.
9
Scottish Government
consultation paper:
The Future of Land
Reform in Scotland15
Consulted on: “addressing barriers to sustainable development and
beginning to diversify patterns of land ownership”. The rationale provided
for this to be included in the Land Reform Bill was that: “in some instances
the scale or pattern of land ownership, and the decisions of landowners,
can be a barrier to sustainable development in an area. Providing
mechanisms to address such situations could allow for potential barriers to
sustainable local economic and social development to be overcome”.
The Land Reform
(Scotland) Bill16
(2015)
Part 5 of the Bill aims to introduce a community right to buy land to further
sustainable development provided certain conditions are met. The
associated Policy Memorandum17
states that land reform: “has the potential
to empower greater numbers of people and, over time, to change patterns
of ownership in Scotland to ensure a greater diversity of ownership, greater
diversity of investment and greater sustainable development”.
Whilst there have been a few studies that have examined the Scottish estate sector, estate owners‟ motivations and the social, economic and environmental impacts of estates (MacGregor, 1988; MacGregor and Stockdale, 1994; Higgins et al., 2002; Warren and McKee 2011; Hindle et al., 2014 and Glass et al., 2013), there have to date been no studies that examine the counterfactual scenario of what such impacts would be if different land ownership structures existed.
It is against this backdrop that the Rural and Environment Science and Analytical Services (RESAS) Division of the Scottish Government commissioned a study to provide evidence based conclusions to address the hypothesis that “diverse (scale of) land ownership18 leads to better social, economic and environmental outcomes”.
This research project provides some insights into the local impacts of differing forms and scales of land ownership, amongst other factors, thereby informing both the ongoing development of Scotland‟s land reform policy and current deliberations over the Land Reform (Scotland) Bill.
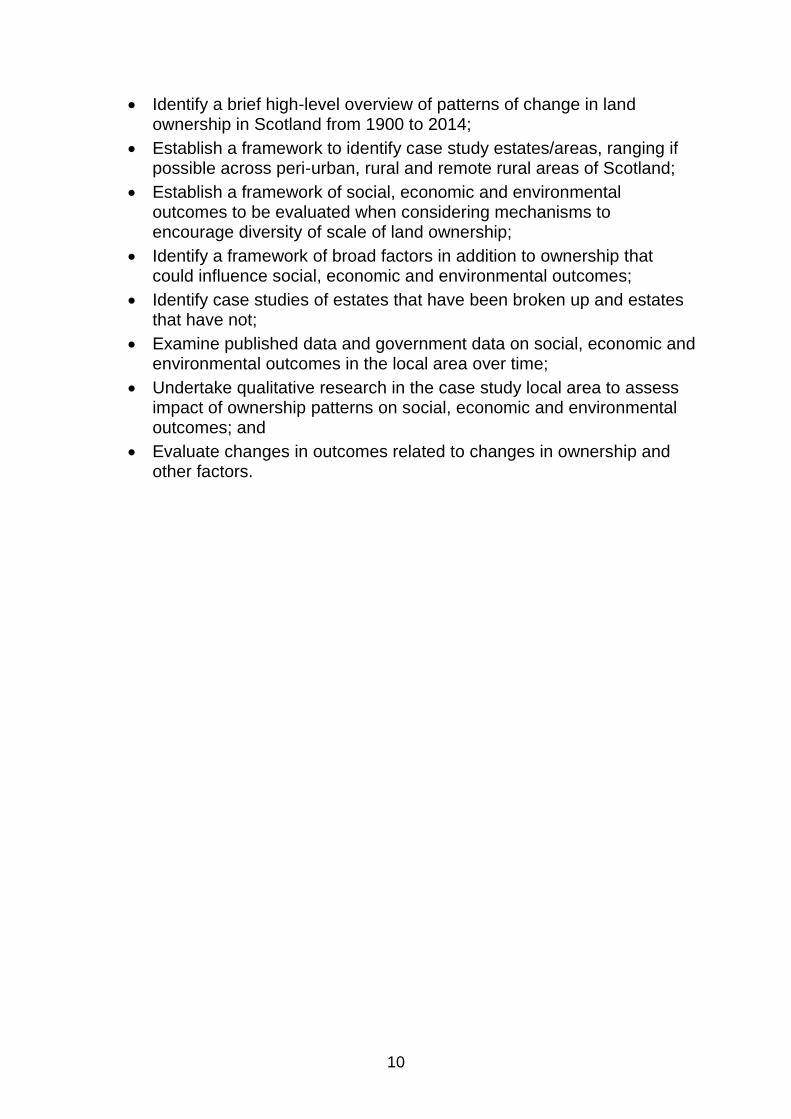
The specific aim of the project is to build an evidence base demonstrating the relationship of different patterns of ownership scale to social, economic and environmental outcomes. The specific objectives of the project were to:
15
https://consult.scotland.gov.uk/land-reform-and-tenancy-unit/land-reform-scotland/supporting_documents/00464887.pdf 16
http://www.scottish.parliament.uk/S4_Bills/Land%20Reform%20(Scotland)%20Bill/b76s4-introd.pdf 17
http://www.scottish.parliament.uk/S4_Bills/Land%20Reform%20(Scotland)%20Bill/b76s4-introd-pm.pdf 18
The research team were directed by the Scottish Government that “diversity” in the context of this project was to be in relation to scale of ownership.
10
Identify a brief high-level overview of patterns of change in land ownership in Scotland from 1900 to 2014;
Establish a framework to identify case study estates/areas, ranging if possible across peri-urban, rural and remote rural areas of Scotland;
Establish a framework of social, economic and environmental outcomes to be evaluated when considering mechanisms to encourage diversity of scale of land ownership;
Identify a framework of broad factors in addition to ownership that could influence social, economic and environmental outcomes;
Identify case studies of estates that have been broken up and estates that have not;
Examine published data and government data on social, economic and environmental outcomes in the local area over time;
Undertake qualitative research in the case study local area to assess impact of ownership patterns on social, economic and environmental outcomes; and
Evaluate changes in outcomes related to changes in ownership and other factors.
11
Methodology This project was designed to examine the social, economic and environmental outcomes that may have resulted in three case study localities from the fragmentation of large land holdings into smaller units since 1900 by comparing them against outcomes in three paired case study localities where scale of land ownership has been maintained. As there are many factors that have influenced local outcomes beyond scale of land ownership, a non-exhaustive list of „other factors‟ was developed to help identify the key factors in the development process of each case study.
The initial case study selection method was to identify six proximal historic estates (three pairs) which were similar in character (one of each pair having been fragmented whilst the other had remained substantially intact) and collect information on both these areas and communities within their boundaries. However, after consideration of this approach to selecting case studies and the methods of assessing outcomes in more detail, the research team concluded that it would beneficial to move away from using estate areas to utilising parishes instead. The rationale for this methodological change surrounded the imperfect knowledge of (changing) estate boundaries and the fact that these do not align themselves to administrative boundaries and data. The parish approach had the benefit of being able to have greater confidence in using administrative information in detailing the timeline of change within each case study.
The project was designed around five key methodological stages to provide case study evidence on the impacts of diversity of ownership in Scotland.
Literature and Policy Review: provided the context for the project including a review of land ownership patterns, policy and other factors affecting the social, economic and environmental development of rural communities in Scotland.
Development of Assessment Frameworks: created three robust and transparent methodological frameworks to assess: (a) social, economic and environmental outcomes at the local level; (b) factors, other than land ownership scale that may have led to observed local community outcomes; and (c) the selection of comparable case studies. The Scottish Government and representatives of key stakeholder organisations were provided with the opportunity to comment on these frameworks.
Case Study Selection: analysed bio-physical Geographical Information System (GIS) datasets to scientifically select three appropriately paired case studies that met the Scottish Government‟s criteria. At the direction of the

12
Scottish Government this project excluded crofting areas and areas under community land ownership19 as potential case studies.
Data Collection: created quantitative profiles of case studies and undertook qualitative fieldwork to ascertain how local outcomes have been achieved and what role, if any, scale of land ownership played.
The quantitative profiling of case studies utilised a wide range of datasets (e.g. population census, Integrated Administration and Control System, June Agricultural Census, environmental GIS datasets and Sasine Register) to provide a timeline of key land ownership changes, and statistical timelines for key outcomes (demography, housing, etc.) for each case study. For population census data20 there was a need to match output areas to parish boundaries using National Records for Scotland lookup tables21 due to boundary changes for official statistics.
Qualitative fieldwork was undertaken in case studies in order to elicit information regarding local “trigger events” and trends and their causes using both semi-structured interviews with key individuals (see Appendix 2 for interview schedule) and focus groups with wider interest groups (see Appendix 3 for topic guide) were conducted in each case study. The semi-structured interviews were conducted with land owners and/or managers, local heritage groups/historians and other community members in order to develop a more detailed understanding of parish history over the study period. These case study timelines were triangulated with the quantitative case study profiles and an adapted participatory multi-criteria analysis approach (MCA) was used to evaluate the perceived main drivers of the social, economic and environmental change (following Davies et al, 2013; Sheppard and Meitner, 2005).
In each case study between 5 to 10 semi-structured interviews were conducted, with most carried out prior to the focus groups and some afterwards to allow for follow-up with some participants who were unable to make the dates/times of the focus groups. Three focus groups were targeted per case study with the local business community, land managers and the wider community. However, due to a low availability of business representatives, this focus group was combined with the wider community
19 Whilst the Community Right to Buy (CRtB) and financial support measures introduced by
the Scottish Government have been credited with helping increase the diversity of ownership of land in Scotland, the impacts of the CRtB are beyond the scope of this project with another research project specifically evaluating the impacts of CRtB (http://www.gov.scot/Publications/2015/10/8581). 20
For 1991 and 2001 data was extracted from http://casweb.mimas.ac.uk/ a service of the UK Data Service composed of data specialists at JISC and The Universities of Central London, Edinburgh, Leeds and Manchester. 2011 census data was extracted from http://www.scotlandscensus.gov.uk/ a service of National Records Scotland 2011. 21
http://www.nrscotland.gov.uk/statistics-and-data/geography/our-products/census-datasets

13
focus group in some case studies. Key contacts were identified initially through online research, including local historians, chairs/secretaries of community councils and the main local landowner(s)/estate manager.
With the aim of developing a diverse purposive sample of community members, business owners and land managers/farmers as potential participants, a database of contacts was developed through emailing and phoning key contacts, adopting a snowball sampling approach (where recruited participants help identify further possible participants from among their acquaintances and contacts). This approach generated a relatively comprehensive database of owner-occupier and tenant farmer contacts, local business listings and a range of community members. Interviews conducted with key contacts led to further identification of relevant land managers, farmers and community representatives. Following the development of specific lists for each focus group, potential participants were contacted individually by letter, email and phone to invite their participation in the process and made aware of the date, time and location of the most relevant focus group.
The sample for both interviews and focus groups was generally biased towards older community members due to the historical focus of the work. This sample of older, longer term residents undoubtedly introduced biases in the qualitative feedback, and it was notable that observed changes over time were often perceived negatively, with many aspects of community life, particularly relating to community cohesion, considered better in the past. Younger and newer community members would have offered different socio-economic perspectives but, due to the historic nature of the research in identifying changes, they were not specifically targeted as fieldwork participants.
Data analysis and write up: qualitative, thematic analysis of notes from case study interviews and focus groups was integrated with the quantitative case study profiles and case study timelines, in order to complete the data requirements of the two assessment frameworks. Interpretation of these completed frameworks and the case study timelines provided an evidence-base for conclusions on/insights into the outcomes arising from diversity of land ownership, including a discussion of the limitations of the approach. An assessment of commonalities and differences in the quantitative indicators and the rich context provided by the qualitative results across case studies allowed conclusions to be drawn on the effect of land ownership scale on local outcomes.
Observations on qualitative approach to data gathering
The fieldwork team made a number of observations about the approach adopted that may act to guide future research:

14
The task of identifying appropriate people to interview and invite to the focus groups was not straightforward and therefore took considerably longer than anticipated, due to the practicalities of locating contact details and confirming willing participation, therefore recruitment costs were relatively high.
Most of the participants were long term residents as many newer residents felt they did not have the tacit knowledge of local changes that occurred over the study period, thereby limiting the recruitment pool available. This made recruitment more difficult (i.e. people not feeling they were able/suitable to take part, or not targeting certain groups) and also meant that the findings are biased towards the views of the more elderly, long-term, residents and those with an interest in local history. Local historical knowledge was dependent on the participants although some gaps in knowledge were filled through local books and media.
The participatory timeline process, in which participants completed a timeline of important change factors, worked very well by animating people and ensuring their engagement in the focus group discussion.
Participants often focused attention to perceived negative factors in each of the case studies rather than discussion of positive factors, even when guided to discuss more positive elements.
Other than land based businesses it was challenging to get a number of other businesses to engage in the project especially where they felt they had no real connection to landownership. Many businesses that were influential to case study communities within were actually located outwith case study parish boundaries and therefore were not invited to participate.
Identification of community “gatekeepers” is important for recruitment but it is also acknowledged that these people can bias who is recruited.
The multi-criteria analysis (MCA) approach worked well when there was a common issue that people could debate. However, the approach was considered too difficult for some to make an assessment of the key factors for all nine identified sustainable rural development “ingredients” as participants often found close interdependencies in factors or outcomes meaning that they could become confused by the task. A reduced, more targeted MCA is recommended for future community research.
Tenant farmers sometimes needed reassurance that the land owner or their representatives would not attend the focus group in order to encourage participation of the tenant farming community (i.e. many

15
were reticent to engage when their landlords may be present). Main landowners (or their representatives) were interviewed separately.
Case Study Selection
Option estates / parishes
The intention, from the outset of this work, was to ensure that the parishes (and hence estates) used in the study were not identifiable. This was perceived as important to ensure that sentiments and opinions were non attributable, thereby improving the likelihood of local participation during the fieldwork stage. As such the case study locations and estates have been anonymised throughout this report.
Following agreement with the Scottish Government to use parish boundaries instead of estate boundaries as a means of selecting case studies, the team set out to identify unfragmented and fragmented estates that were in similar geographic locations and are (or were) the dominant land holding in a parish. These estates were identified from a range of sources, including: the teams‟ collective knowledge of unfragmented and fragmented estates; land ownership literature; historic valuation office records; and current land ownership databases (including Who Owns Scotland22, Deer Management Groups, etc.). This process allowed us to identify a range of „option‟ parishes (as proxies for estates) in similar locations (grouped into „sets‟) to geospatially analyse where the parish either: (a) largely remains under the influence of a small number of large estates, or; (b) was historically under the control of a small number of large estates but has become more fragmented.
The option estates/parishes within local „sets‟ were picked to be of similar characteristics whereas the different local „sets‟ of parishes were selected to ensure a range of different: land qualities, farming systems, degrees of peripherality, etc. were available for the selection of case study pairs. An initial set of 28 option parishes, grouped into 6 local sets, was identified, and following consultation with RESAS and stakeholder groups this was expanded to 31 parishes, grouped into 7 local sets that included both fragmented and unfragmented estates.
Following the selection of the option parishes a number of Geographic Information System (GIS) datasets were used to analyse the option parishes to allow an objective scientific assessment of similarities and differences to be made between option parishes within each geographic cluster. The purpose of this exercise was to assess the similarities of parishes within each set thereby ensure that each of the final three paired case study parishes were as similar as possible yet reflected different types of estate and differing degrees of peripherality.
22
www.whoownsscotland.org.uk

16
The GIS datasets analysed included:
Altitude / topography
The Macaulay Land Capability for Agriculture (LCA) classification
Land Cover of Scotland (LCS88)
Peripherality (8 fold rural urban classification)
Less Favoured Area (LFA)
A summary of the GIS analysis are presented in Appendix 4. As an example of the scientific selection process amongst the option estates Figure 1 reveals the proportion of land within each LCA class within each of the option parishes 23 . For example in Set 1 each of the parishes has a high proportion of LCA 3.2 land (land capable of producing a moderate range of crops with a tendency to grass within rotations) whilst parishes in Set 6 have a high proportion of LCA 6.1- 6.3 (land capable of only rough grazing due to intractable physical limitations). This helped identify within the geographic sets which parishes are closely similar in terms of land capability proportions allowing for further comparisons between unfragmented and fragmented land ownership parishes within each set.
Figure 1 Area of each LCA (as % of Parish) for option parishes - anonymised
Selected Paired Case Studies
Having considered all the GIS evidence generated the merits of the different sets and option parishes were considered. It was concluded that there could be four useful case study pairs to study; however, with budget and time

17
constraints in conducting fieldwork and in order to meet the Scottish Government‟s requirements to assess a range of land capabilities and range of distances from major urban centres the most appropriate three were selected. These include pairs that are (a) very accessible to major urban area with mixed farmland; (b) relatively accessible with good quality grazing land; and, (c) hill and upland land in remoter areas. The case study pairings chosen were:
A1 (fragmented) and A3 (unfragmented) E2 (fragmented) and E4 (unfragmented) F1 (fragmented) and F3 (unfragmented).
The initial numbering system used for parishes considered as potential case studies is potentially confusing if used for the actual case studies (i.e. the reference numbers become non-sequential). Hence the selected case studies have been renumbered to facilitate interpretation of the results throughout this report. The new reference number for the anonymised case studies area are:
Case study A1 = 1a Case Study A3 = 1b Case Study E2 = 2a Case Study E4 = 2b Case Study F1 = 3a Case Study F3 = 3b
An anonymised summary description of each of the chosen case study parishes is provided in Table 2
Table 2 Anonymised description of case study pairs
Paired Case Studies
“Unfragmented”
Landholding Scale Maintained
“Fragmented”
Landholding Scale not Maintained
Parish 1a: is an accessible rural area with the
main village being about half an hour from a
major urban centre. It contains six villages
and two smaller hamlets with the two largest
villages being located on main roads
connecting the urban area to its hinterlands.
Both main villages contain typical services:
shop, restaurant, primary school, village hall
and playing fields etc. The population of both
villages has increased in the last two decades
due to phases of housing development on
land sold directly from the main private estate.
The parish is largely owned by a single private
estate with a handful of other private
landowners. Primary industry includes mixed
farming (largely tenanted), quarrying, and
forestry, with significant local employment
influenced by urban employment.
Parish 1b: is an accessible rural area with
the main village being about 25 minutes
from the centre of a major urban centre. It
contains two towns, one of which has been
growing rapidly in the last 20 years. The
area is well serviced with the main town
lying adjacent to the main trunk between
two large urban areas. It is situated 5 miles
from a main railway station with an airport
close by, meaning that it is slightly more
accessible than its paired case study, 1a.
The main estate in the parish was sold in
the decade after the First World War,
particular as a result of financial difficulties
around the financial crash of the 1920s.
The main town is surrounded by new
housing developments and industrial
estates and has several shops, public hall,

18
caravan park, golf course, etc. but is quite
reliant on neighbouring larger town for many
facilities (e.g. shops and restaurants).
Parish 2a: is classified as relatively
accessible, with the main estate office being
within 20 minutes of an urban centre with a
population of just over 10,000. The hillier
section of the parish is more remote and has
poorer accessibility than the coastal, low lying
areas that are well connected through trunk
roads. The parish boundary cuts through a
large urban area and includes another village
that plays an important role as a regional
transport hub. A number of other small
villages make up the remainder of the parish.
The majority of the parish is under the
ownership of a private estate although a
number of smaller landowners and farmers
also own land. Agriculture in the area consists
primarily of tenanted farms engaged in
livestock farming.
Parish 2b: is a coastal parish that is just
classified as being remote, situated about
40 minutes from an urban centre with
population of just over 10,000. The parish
is not directly connected to the main trunk
roads servicing the urban centre. There are
4 villages and the main settlement is now a
popular tourist destination but facilities are
relatively limited in these villages. One of
the main estates in the parish was split up in
the 1920s and 1940s, although the main
house remains within the family associated
with historic ownership. Agriculture remains
important to the area and is dominated by
livestock farming.
Parish 3a
The parish has 2 main villages and a cluster
of several hamlets, all in relatively close
proximity. In a remote rural area, the main
village is just under an hour from an urban
centre. Situated within the highland area,
there are extensive montane and upland
habitat and major rivers and lochs. Large
parts of the parish area have very low
populations. Sporting is a major land use in
the parish with livestock farming and forestry
also significant activities. The area has been
popular with tourists since the 1930s and this
has become increasingly so over the years
due to its scenic value, range of recreational
activities available and relative accessibility.
The parish has good access through rail and
trunk road networks.
Parish 3b
In a remote rural area, the parish is over an
hour drive from the nearest urban area and
consists of one main village and thirteen
other small villages and hamlets. There is a
rich cultural and archaeological history
associated with the area and tourism has
been the dominant industry in the parish
since the 1960s, due to the high scenic
value of the area and its relative
accessibility with many related
developments (including housing) in the last
30 years. There is extensive woodland
cover (associated with commercial forestry
and woodland regeneration activities) and
livestock farming. The parish contains the
summits of several hills, including Munros.
The parish has more restricted transport
access than its paired case study 3a. The
principal estate was largely sold off
following the death of the incumbent laird in
the 1920s following mounting debts.
19
Scottish Land Ownership Overview
Land ownership concentration
The ownership and management of land are fundamental to society, and impact on most aspects of rural life, influencing social, economic and environmental development (MacGregor, 1993; Wightman, 1996; Slee et al., 2008). It is widely accepted that Scotland has the most concentrated pattern of private landownership in Europe (Lorimer, 2000; Cahill, 2001; Wightman, 2001) as a result of a number of historic factors (feudalism, succession laws, fiscal policies, agricultural support, etc.). The most comprehensive landownership pattern research in recent decades includes the work of Millman (1969; 1970), McEwen (1977), Callander (1987) and Wightman (1996; 2013), much of it with radical land reform overtones.
Land ownership churn
The ownership and structure of Scotland‟s estates shows a degree of continuity across the centuries with over a quarter of Scottish landowning families able to trace their landowning ancestry back to at least the 16th century (Callander, 1986; Cramb, 2000). Hindle et al., (2014) also reported continuity of estate ownership with 35% of 228 respondent‟s families having owned their land for over 100 years, including 5% who could trace ownership for more than 500 years. McKee et al. (2013) found that 91% of respondents to a survey of 84 estates, regardless of whether they had inherited or purchased their estates, wished to pass the estate to their heirs suggesting that the long term pattern of low turnover in the estate land market is unlikely to change in the foreseeable future.
LRRG (2014) highlighted that the “lack of change in the number of owners with over 405 ha (between 1872 and 1970) reflects the degree to which both the underlying structure of private estates, and the concentrated pattern of private landownership, has continued to survive in rural Scotland.” It is now estimated that 432 landowners account for 50% of the privately owned land in Scotland (Wightman, 2013). Additionally, Hindle et al. (2014) estimated that 1,125 “estates”23 controlled about 70% of privately owned land in Scotland.
23 There is no universally accepted definition of an “estate”, nor are there any complete databases of “estates”. This makes their identification more difficult, and necessitates a degree of subjectivity. Armstrong and Mather (1983) defined an estate as “…a continuous and discrete area of land held by one owner, whether the owner be an individual, a company a trust or an institution”. Kerr (2004) describes estates as “generally characterised by features such as a large house with surrounding policies for amenity areas, land owned with part or all let out to tenants, actively managed forestry, commercial woodland and possibly deer forest.”.

20
Land Settlement
Land settlement in Scotland took place under a number of legislative phases in the early part of the 20th century in response to rural overcrowding, landlessness and deprivation that had developed in many parts of the Highlands and Islands during the 19th century (Mather, 1985). The Napier Commission Inquiry (1884), the Crofters Holdings Act (1886) provided the foundations for land settlement and the Royal Commission (Highlands and Islands) (1892) concluded that “325,000 ha of land currently used as deer forest or large sheep farms was suitable for subdivision into holdings to be occupied by crofters or other small tenants, and that a further 225,000 ha were suitable for subdivision into farms of moderate size.” Mather concluded that these early actions “marked a turning point and set the scene for state intervention.”
The Congested Districts Board (CDB) operated between 1897 and 1912 with the aim, amongst others, to acquire land (by agreement) for settlement and to help create new holdings on private estate land (Mackay, 1955). Mather (1985) suggested that despite the small scale of early land settlement there was evidence of intensification of land use with considerable local effects: “In the case of the property of Syre in Sutherland, for example, which was acquired by the CDB in 1900, the 5,000 ha sheep farm was subdivided into 21 holdings. The population resident on the property increased from 10 to 21, the cultivated area increased from 2 to 94 ha, and livestock numbers increased almost forty-fold in the case of cattle and by about 27% in the case of sheep”24.
Leneman (1989a) and Mather (1985) tracked the land settlement process and discussed challenges faced by the land settlement programme: lack of capital to equip intermediate sized holdings, absenteeism, lack of infrastructure, lack of agricultural skill by ex-servicemen, etc. Mather (1985) revealed that the number of state smallholdings started declining in the 1950s, particularly as a result of structural improvement policies leading to amalgamation of smaller holdings into more viable units. Mather also highlighted anecdotal evidence of the “Rapid resale of holdings by purchasing tenants to neighbouring farmers. The number of holdings disappearing in this way is as yet unknown, as is their spatial pattern”.
Both Mather (1985) and Leneman (1989b) highlighted that no evaluation of small holdings in terms of social, economic and agricultural impacts had been made (by the 1980s), with the latter suggesting that: "Studies could usefully be carried out comparing areas with and without settlements with regard to population levels, size of holdings, prosperity and so on. Until someone
24
This parallels findings by Best and Ward (1956) in England regarding increased intensity of food production on farmland converted to household gardens.

21
attempts such a comparison, there is no way of knowing how much local impact the land settlement programme still has at present".
Break up of large estates
Clark (1981) identified a weakening of the oligopoly of landownership in many regions of Scotland between the 1870s and 1970s, illustrated by a reduction in estate size and an increasing number of owners. However, the reduction in estate size in some regions was matched by the expansion of other estates, often owned by old Scottish families such as well as an increasing number of „newcomers‟ (Sutherland, 1968; Clark, 1981). Callander (1987) reported on important changes in the pattern of landownership during the 20th century, caused by: (a) a reduction in area held by larger estates; (b) an increase in number of small owners, and; (c) a major expansion in the extent of land owned by the state and public agencies.
Whilst Callander (1987) suggested that the traditional estate structure survived between the 1870s and 1970s with a fair degree of consistency, his research highlighted that the fragmentation of larger estates was a key trend in changing landownership patterns throughout the 20th century where the number of estates:
Over 20,000 acres (8,000 hectares) fell from 171 to 121 (29% decline).
Over 5,000 acres (2,000 hectares) fell from 576 to 546 (5% decline).
Over 1,000 acres (400 hectares) fell from 1,758 to 1,723 (2% decline).
Cramb (2000) refers to Scottish land being more recently “subject to fashions, fads and the relative health of world economies.” He discussed that: “there has been an Arab period, there has been a Dutch period, there is an on-going Danish period… there was a very strong Hong Kong period…and a rock group period”, highlighting the global demand for Scottish estates and land during the 1980s and 1990s.
Table 3 provides a summary of the patterns of change in Scottish landownership, and the drivers of change, that took place during specific periods of the last century.
Table 3 Land ownership trends during the last century
Period Land Ownership Trend
Early 20th
Century
Deteriorating economic conditions led to increased number of land sales and
fragmentation of many large estates (Callander, 1987)
Inter-War
Continued fragmentation of large estates, particularly during the depression
of the 1920s. Emergence of the trend for holdings to be sold to estate
tenants leading to the rise of the owner-occupier farm. Owner-occupied
farmland increased from 11% in 1914 to 29% in 1929 (Callander, 1987).
Government purchase of private land for crofting and smallholder

22
resettlement and for public forestry.
1950s to
1970s
High public support (grants and subsidies) for agriculture and forestry
coupled with a reduction in the overall tax burden faced by landowners
improved the financial position of many farms and estates. Less pressure to
sell off land and limited the growth in owner-occupier farmland (51% in 1960
and 57% in 1970). Continued purchase of private land for forestry by the
state (Callander, 1987).
1980 to
2000
Private purchase of significant areas of land for forestry until tax relief ended
in the late 1980s. Growth in foreign investment in Scottish estates but also
domestic period of purchase in the 1980s as a result of the stock market
boom. Very large insurance claims (Piper Alpha, Exon Valdez, San Francisco
earthquake, asbestos and pollution cases) in the late 1980s and early 1990s
led to many Lloyd‟s “names” having to realise assets causing greater churn
within the estate market. Rise in area of land owned by environmental
organisations. Area of farmland under owner-occupation continued to rise
from 59% in 1982 to 68% in 2000 (Scottish Government, 2015).
2000 -
onward
Growth in community ownership of land, in particular some major purchases
(often in conjunction with environmental organisations) of private estates,
often where there have been issues between the local communities and
landowners. Continued growth in area owned by environmental
organisations, with some rationalisation of the area owned by the state. Area
of farmland under owner-occupation continued to rise, to 77% of total
agricultural area in 2014 (Scottish Government, 2015).
Landownership change and scale factors
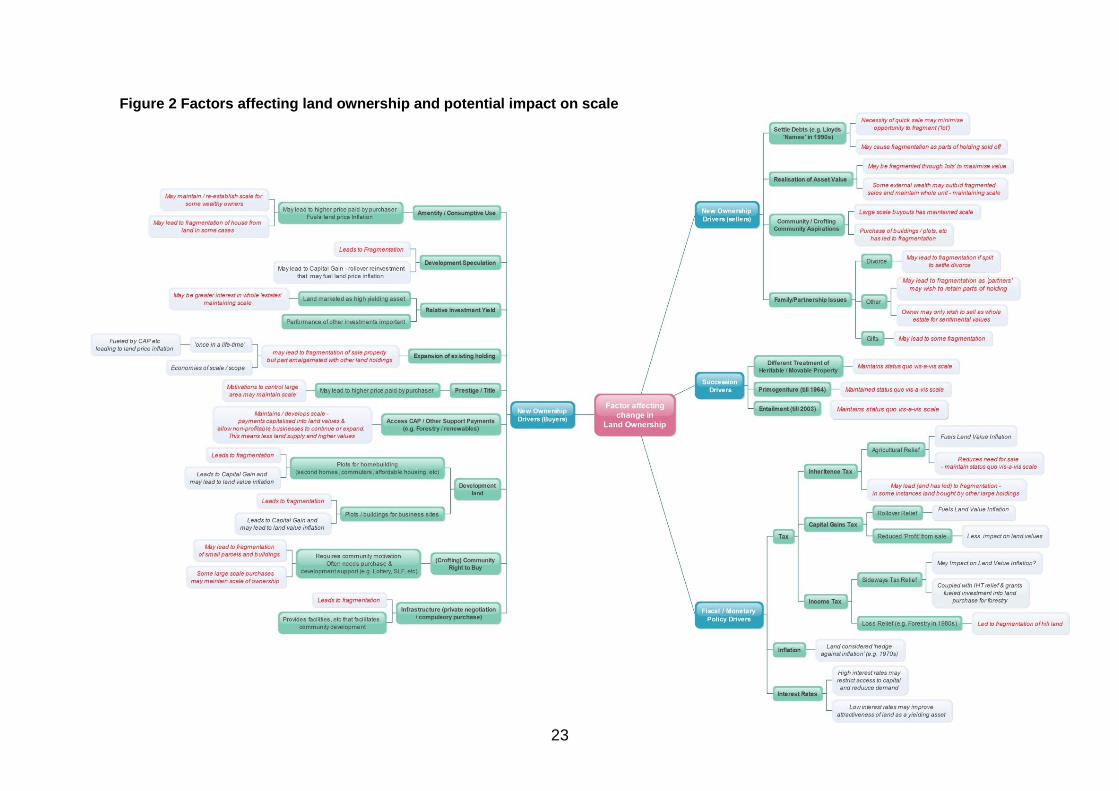
In considering the land ownership policy environment, a number of complex factors that affect changes in land ownership were considered that may also impact on the scale of land ownership held (by individuals, partnerships, trusts, etc.). Whilst many of these factors are interconnected, to varying degrees, for individual landowners and / or individual land transactions, they can impact on land ownership change and scale of landownership over time.
Using the research team‟s expertise, these factors were split into those that may influence new purchases of land, those that may affect sales of land, those that affect succession of land, and finally monetary / fiscal policies that directly impact on land holdings and sale/purchase decisions. These factors and the potential impact that they have on land values and scale of ownership are represented in Figure 2 with greater detail of how some of these factors affect land ownership (and scale of ownership) provided in Appendix 5.
23
Figure 2 Factors affecting land ownership and potential impact on scale
24
Sustainable Development Frameworks
Outcomes Framework
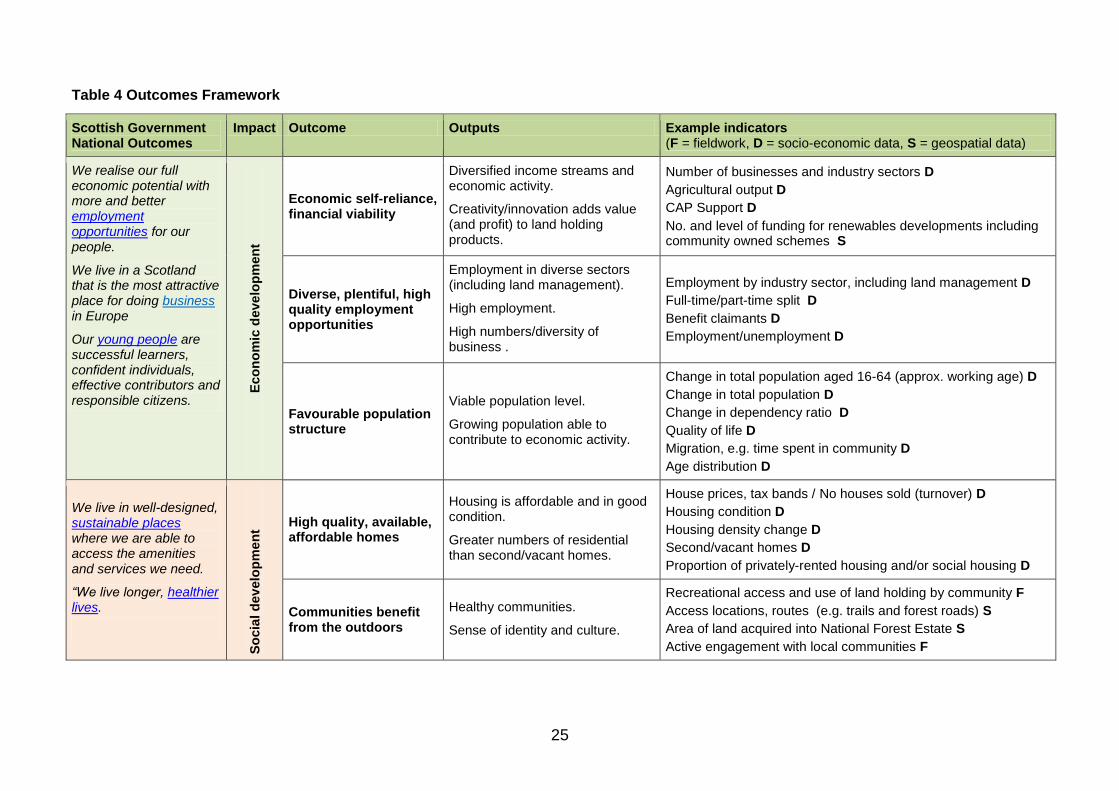
A sustainable development outcomes framework was developed to provide a clear rationale for the collection of primary and secondary data in case studies. It follows a logic model approach, setting out the anticipated local outcomes that may arise from certain actions taken by key stakeholders (e.g. landowners, land managers, Scottish Government, industry, local authorities and communities) that may influence the sustainable development of local areas. The framework also articulates how these outcomes feed into Scottish Government National Performance Framework and how they may be measured (i.e. potential indicators).
The outcomes framework incorporates outcomes that may be attributed to either differing land ownership scales or to a myriad of other factors (see the Other Factors Framework). It provided an overarching structure from which the primary (fieldwork) and secondary data collection were developed with comparative analysis of the data used to assess whether change in local sustainable development outcomes (or indeed lack of change) can be attributed in any way to scale of land ownership or to other factors.
The starting point for the framework creation was to review existing outcome measurement frameworks for estates, including the Sustainable Estates Toolkit (Glass et al. 2013) and the National Upland Outcomes25, as well as rural-specific outcomes measures guided by the research on Mapping Rural Socio-Economic Performance (Copus and Hopkins, 2015). The Scottish Government‟s National Outcomes26 were also reviewed. Based on these resources, and the existing knowledge and expertise amongst the research team (e.g. agriculture, land economics, estate management and outcomes, community development, environmental sustainability), ten outcomes were identified: three economic; four social, and three environmental.
The researcher team then identified the ways in which the outcomes could be assessed, identifying three types of measurement: socio-economic data (D); geospatial data (S) and fieldwork (F).
The finalised Outcomes Framework is presented in Table 4.
25
https://www.gov.uk/government/uploads/system/uploads/attachment_data/file/273800/pb14111-uplands-outcome-framework.pdf 26
http://www.gov.scot/About/Performance/scotPerforms/outcomes
25
Table 4 Outcomes Framework
Scottish Government National Outcomes
Impact Outcome Outputs Example indicators (F = fieldwork, D = socio-economic data, S = geospatial data)
We realise our full economic potential with more and better employment opportunities for our people.
We live in a Scotland that is the most attractive place for doing business in Europe
Our young people are successful learners, confident individuals, effective contributors and responsible citizens.
Eco
no
mic
deve
lop
men
t
Economic self-reliance, financial viability
Diversified income streams and economic activity.
Creativity/innovation adds value (and profit) to land holding products.
Number of businesses and industry sectors D
Agricultural output D
CAP Support D
No. and level of funding for renewables developments including community owned schemes S
Diverse, plentiful, high quality employment opportunities
Employment in diverse sectors (including land management).
High employment.
High numbers/diversity of business .
Employment by industry sector, including land management D
Full-time/part-time split D
Benefit claimants D
Employment/unemployment D
Favourable population structure
Viable population level.
Growing population able to contribute to economic activity.
Change in total population aged 16-64 (approx. working age) D
Change in total population D
Change in dependency ratio D
Quality of life D
Migration, e.g. time spent in community D
Age distribution D
We live in well-designed, sustainable places where we are able to access the amenities and services we need.
“We live longer, healthier lives.
So
cia
l d
ev
elo
pm
en
t High quality, available, affordable homes
Housing is affordable and in good condition.
Greater numbers of residential than second/vacant homes.
House prices, tax bands / No houses sold (turnover) D
Housing condition D
Housing density change D
Second/vacant homes D
Proportion of privately-rented housing and/or social housing D
Communities benefit from the outdoors
Healthy communities.
Sense of identity and culture.
Recreational access and use of land holding by community F
Access locations, routes (e.g. trails and forest roads) S
Area of land acquired into National Forest Estate S
Active engagement with local communities F

26
Scottish Government National Outcomes
Impact Outcome Outputs Example indicators (F = fieldwork, D = socio-economic data, S = geospatial data)
We value and enjoy our built and natural environment and protect it and enhance it for future generations.”
We have strong, resilient and supportive communities where people take responsibility for their own actions and how they affect others.
So
cia
l d
ev
elo
pm
en
t
Strong rural social fabric and infrastructure
High level of support for delivering community needs and projects .
Sufficient number of places and spaces for community activities.
Nature of community support provided (e.g. £ / in kind) F
No. of / levels of use of community centres F
Empowered and confident communities
Collaborative, participatory management.
Shared knowledge and best practice.
Community contribution to/voice in landscape scale planning.
Well managed land holdings.
Collaborative land use planning and delivery F
Land management partnerships F
Adherence to best practice guidance (e.g. deer management code) F
Residency D Communities know who manages the land F
We value and enjoy our built and natural environment and protect it and enhance it for future generations.
We reduce the local and global environmental impact of our consumption and production.
En
vir
on
men
tal en
han
cem
en
t
Public benefits from sustainable ecosystems
Integrated management planning.
Provision of ecosystem services.
Water quality (rivers /lochs / coast /estuaries) – changing status and quality (at least good) D
Soil quality – peatland location S
Flood management schemes S
Enhanced biodiversity
Growth in areas of land of high biodiversity quality (improved habitat condition and/or healthy species).
Growth in areas with protected habitats and species present.
Change in areas of land designated as relevant protected areas e.g. Sites of Special Scientific Interest (biological type), Special Areas of Conservation, other habitats and species data S
Agri-environment schemes D Increase in extent of Biodiversity Action Plan habitats D
Contribution to climate change mitigation
Increased woodland planting
Increased carbon storage potential.
Increased renewable activity
New woodland planting S
Renewable energy schemes S Protection of carbon storing landscapes S
27
Other Factors Framework
Alongside the factors that influence land ownership decisions there are a wide range of other factors that may have influenced development pathway of the case studies. A framework of „other factors‟ that influence local social, economic and environmental outcomes could have been based along the same three sustainability dimensions. However, adapting the approach taken by Miller et al. (2009) to identify drivers of land use change was considered more appropriate for this study, if only because the Scottish Government can control or influence some factors (e.g. policy) much more than others (e.g. labour prices, technology). Miller, et al. categorised 38 identified drivers of change into eight thematic groups:
Environmental: e.g. climate change, water quality, soil quality
Demographic: e.g. migration, consumer preferences
Economic: e.g. prices, labour market [sic], transport, housing
Technological factors: e.g. technological changes, improved varieties
Policy and institutional objectives: e.g. living standards, water quality
Policy and institutional frameworks: e.g. international obligations
Policy and institutional instruments: e.g. grants/subsidies, regulations
Cultural and social: e.g. public [sic], land manager [sic], heritage
The research team considered the wide range of factors that can influence the outcomes to be examined in the case studies and developed the following „other factors framework‟:
1. Geographic: including peripherality/remoteness, land capability, land-cover, settlement pattern, climate, environment, etc.
2. Infrastructure and technology: including mechanisation (e.g. in land management) and infrastructure/communication improvements, etc.
3. Economic: i.e. market prices and conditions (e.g. supply, demand, „thinness‟) for e.g. labour and capital, fuel, tourism, etc.
4. Policy: both support and regulation including those for agriculture, forestry, wider rural businesses, rural housing, the environment and energy, as well as income and business taxation.
5. Social and demography: including demographic (though several of the above factors will influence migration), cultural (both “local” and general, e.g. heritage, consumer/preferences), political (e.g. local government arrangements, locations and practices) and ownership motivations and attitudes (e.g. passive vs. active, resident vs. absentee owners).
These factors, fully detailed in Table 5, are generally not mutually exclusive in that they often relate to more than one other factor including, in many cases, factors influencing land ownership decisions.

28
Table 5 Other Factors Framework
Section Type Factor Potential Impact on Outcomes
Economic
Diversification Business diversification
The extent of business diversification in local economy affects local outcomes through creating employment variety, building economic resilience, improving gross added value from local products, attract visitors, etc. The extent of such diversification is likely to be linked to many factors, including available support (grants), finance (banks, asset value growth facilitating borrowing), scale enabling greater borrowing potential, scale offering additionality to project, realisable local opportunities, etc.
Diversification Leisure and tourism opportunities
Opportunity for diversification, particularly in tourism, leisure and recreation are often location specific with the area's amenity, culture, heritage, attractions, etc. being the catalyst for bringing visitors to an area from which business piggybacking can occur. Some estates may have final destination attractions (castles) etc. Much of the success of tourism business is associated with internationalisation and improved accessibility through infrastructure developments. Where these opportunities exist the local outcomes will be affected, particularly if local accommodation providers (hotels, bed and breakfast, etc.) can capture trade.
Diversification Entrepreneurialism - other diversification opportunities
The entrepreneurial nature and opportunity for local businesses (particularly landed businesses) will clearly affect local outcomes (e.g. Rothiemurchus estate, Laggan Outdoor). With tourism ventures location is paramount but for manufacturing (food, products, etc.) location may be less important where a market niche has been identified (e.g. Cream o‟ Galloway ice-cream). Sometimes place is important in product identity - and often effective infrastructures to enable modern business (internet, roads) are essential for success. These ventures can have significant impacts on local outcomes through employment, increased local visitors, etc. New business developments are often reliant on appropriate development approvals, the process of which some claim act as a barrier to development.
Workforce Labour Supply Local labour supply is intrinsically linked to outcomes - i.e. without an appropriately skilled labour force the outcomes will be significantly different. This is linked with local demographic change, mechanisation, etc. but also to „pull‟ factors through opportunities elsewhere (e.g. urban areas).
General / Local Economy
Household incomes
General household incomes have increased significantly over the timeframe of the study and households have much greater disposable income to spend on non-essential items that may affect local outcomes than early in the last century. There are issues over high levels of fuel poverty in many rural areas (Skerratt, et al, 2014), but others have seen general incomes rise as
result of commuting or regional economic success (e.g. Aberdeenshire and Shetland through the oil and gas sector). Higher incomes has meant that cars etc. have become more affordable meaning that access to urban centres, etc. is easier - this may negatively impact on local services such as shops and garages - and undoubtedly leads to housing pressure.
Landowner finance
External source of funds
Personal motivations can lead some landowners to utilise external funding sources to subsidise land management activities / land ownership activities, especially sporting and conservation. The performance of the stock market can have a bearing on external sources of finance for many land holdings that may influence investment / employment decisions on estates. .Any changes in the access to external funds (stock market crash/business decline/bankruptcy, etc.) or changes to motivations can affect the outcomes delivered.
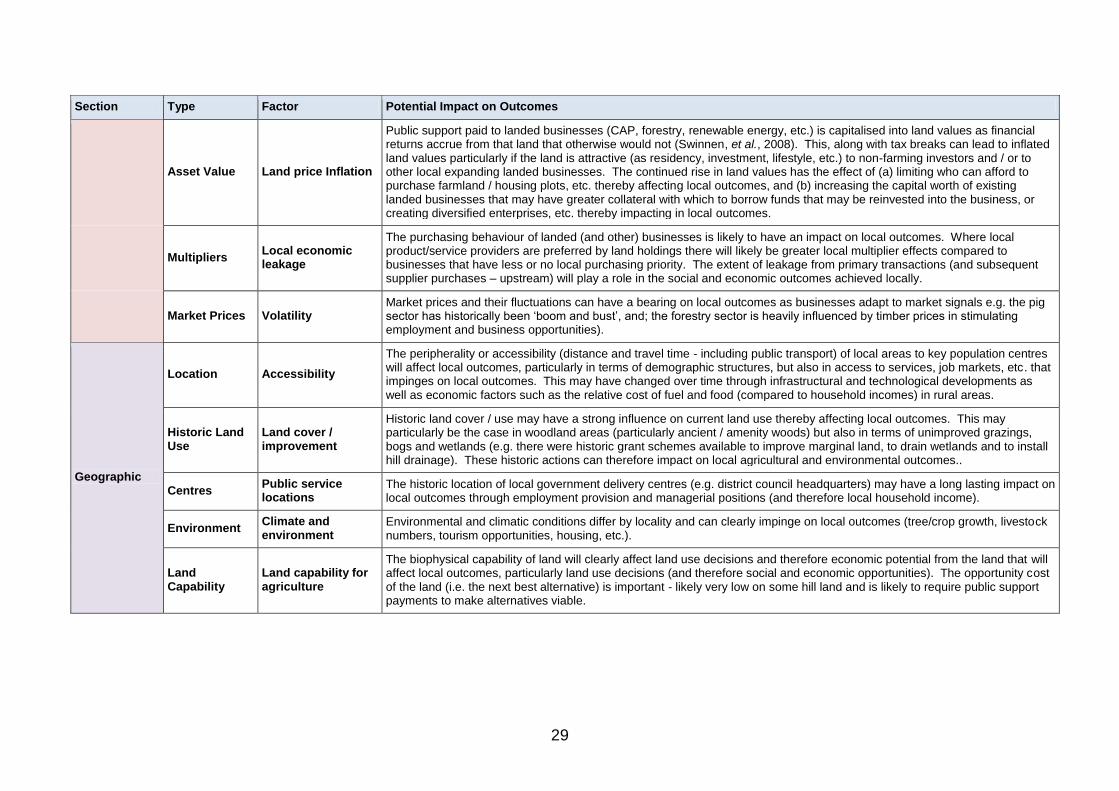
29
Section Type Factor Potential Impact on Outcomes
Asset Value Land price Inflation
Public support paid to landed businesses (CAP, forestry, renewable energy, etc.) is capitalised into land values as financial returns accrue from that land that otherwise would not (Swinnen, et al., 2008). This, along with tax breaks can lead to inflated land values particularly if the land is attractive (as residency, investment, lifestyle, etc.) to non-farming investors and / or to other local expanding landed businesses. The continued rise in land values has the effect of (a) limiting who can afford to purchase farmland / housing plots, etc. thereby affecting local outcomes, and (b) increasing the capital worth of existing landed businesses that may have greater collateral with which to borrow funds that may be reinvested into the business, or creating diversified enterprises, etc. thereby impacting in local outcomes.
Multipliers Local economic leakage
The purchasing behaviour of landed (and other) businesses is likely to have an impact on local outcomes. Where local product/service providers are preferred by land holdings there will likely be greater local multiplier effects compared to businesses that have less or no local purchasing priority. The extent of leakage from primary transactions (and subsequent supplier purchases – upstream) will play a role in the social and economic outcomes achieved locally.
Market Prices Volatility Market prices and their fluctuations can have a bearing on local outcomes as businesses adapt to market signals e.g. the pig sector has historically been „boom and bust‟, and; the forestry sector is heavily influenced by timber prices in stimulating employment and business opportunities).
Geographic
Location Accessibility
The peripherality or accessibility (distance and travel time - including public transport) of local areas to key population centres will affect local outcomes, particularly in terms of demographic structures, but also in access to services, job markets, etc. that impinges on local outcomes. This may have changed over time through infrastructural and technological developments as well as economic factors such as the relative cost of fuel and food (compared to household incomes) in rural areas.
Historic Land Use
Land cover / improvement
Historic land cover / use may have a strong influence on current land use thereby affecting local outcomes. This may particularly be the case in woodland areas (particularly ancient / amenity woods) but also in terms of unimproved grazings, bogs and wetlands (e.g. there were historic grant schemes available to improve marginal land, to drain wetlands and to install hill drainage). These historic actions can therefore impact on local agricultural and environmental outcomes..
Centres Public service locations
The historic location of local government delivery centres (e.g. district council headquarters) may have a long lasting impact on local outcomes through employment provision and managerial positions (and therefore local household income).
Environment Climate and environment
Environmental and climatic conditions differ by locality and can clearly impinge on local outcomes (tree/crop growth, livestock numbers, tourism opportunities, housing, etc.).
Land Capability
Land capability for agriculture
The biophysical capability of land will clearly affect land use decisions and therefore economic potential from the land that will affect local outcomes, particularly land use decisions (and therefore social and economic opportunities). The opportunity cost of the land (i.e. the next best alternative) is important - likely very low on some hill land and is likely to require public support payments to make alternatives viable.

30
Section Type Factor Potential Impact on Outcomes
Infrastructure and Technology
Infrastructure Road / rail / piers
The development of local infrastructure can have a significant bearing on the outcomes. For example, road improvements may make communities more accessible to commuters, second home owners and tourism and recreation visitors, and thus impact on local outcomes. Equally, transport infrastructure improvements have helped more remote businesses access markets / or clients‟ access to them. Improved road and ferry networks have also eased the extraction of timber / livestock from many relatively inaccessible places. The rail network has shrunk considerably since the Beeching report of 1963, and closures of local lines and stations mean that some communities may have been negatively affected, therefore impacting on local outcomes. The Scottish Government's commitment to infrastructure projects like the Borders Railway, dualling of the A9, Campbeltown pier, etc. is based on the expectation that it will stimulate economic development, employment, housing demand, etc. thereby impacting on local outcomes.
Infrastructure Business parks
The location of government-funded business parks / units may impact on local outcomes as these provide opportunities for business development, income generation, employment and growth. The choice of location will be largely influenced by local demand but may also be due to the availability of development land and infrastructure. Development of business parks is reliant on appropriate development approvals and more likely need to be included within the local plan – a pre-condition some claim act as a barrier to appropriate development
Infrastructure Business premises Availability of business premises (public or private) is likely to affect diversity in the economy and may impact on demography (employment / youth retention, etc.)
Infrastructure Broadband / mobile In recent years increasing importance has been placed on mobile and internet connectivity, which can affect local outcomes through, for example, relocation of businesses, creating social and business opportunities (e.g. people may be attracted to an area due to the local amenity but they conduct their business remotely)
Infrastructure Housing
Lack of affordable housing can be a problem in some areas and can act as a barrier to development through its impact on the local labour market. This housing issue is often related to land availability, local planning implementation and general economic development of an area (i.e. that can stimulate demand for housing). Second home owners competing for local housing stock may have limited economic impact on the local area. Some landowners will provide housing stock for local residents, whereas others may opt to use such stock solely for staff (tied housing), leave vacant, or lease out for tourism visits. Each of these housing issues affects local outcomes.
Land management
Technology development
Technological developments have reduced the labour requirement for many landed businesses (e.g. tractors vs. ploughman in farming; harvesters vs. sawmen in forestry; off-road vehicles vs. ponymen in estate management). These clearly affect local outcomes through reduced employment (and associated multipliers) and possibly environmental impact through use of ever-larger and potentially more damaging machinery.
Services Transport Accessibility and cost of transport are the key issues for rural areas and greater distance and less frequent public transport mean that there is higher reliance on private car ownership and greater proportion of disposable income spent on transport. Transportation issues can impact on labour mobility and therefore business locations and ultimately local outcomes.

31
Section Type Factor Potential Impact on Outcomes
Services Education
Local schools are important for the maintenance of a vibrant young population. Local school closures (particularly primary schools) have often been part of a „cycle of decline‟ were low pupil numbers (a result of demographic change) led to school closure, which in turn made the community less attractive to potential economically active in-migrants with children - thus exacerbating the situation. School availability can therefore have major impacts on local social outcomes.
Services Health care
Local doctors,, dental practices and pharmacies play an important role in maintaining vibrant communities. Reduction or closure of these services may be due to a combination of a number of factors including declining populations and improved accessibility of towns and urban centres. Lack of these services can make an area less attractive to in-migrants, particularly young families and the elderly. Healthcare access can therefore affect local social outcomes.
Services Shops, post offices, banks, community facilities, pubs, etc.
The provision of local services affects the vibrancy of local communities and therefore outcomes. The social cohesion of communities is often affected by facilities that foster local people meeting each other, whether through shopping or attending events in community facilities etc. In much of rural Scotland there has been a gradual decline in the provision of many of these facilities (often because of improved accessibility of larger villages and towns) affecting local social outcomes.
Policy
Support payments
Agricultural, forestry and environmental support
The amount of CAP support (including agri-environment payments, investment in holdings grants, etc.) historically going into a region will undoubtedly have influenced outcomes. The amount of forestry and agri-environmental support (fencing, ground works, planting, etc.) and investment in holdings (buildings, fencing, roads, drainage, etc. ) have the effect of creating work for local contractors / suppliers and associated multiplier effects that undoubtedly impact on local outcomes. Agricultural support has undoubtedly made it harder for new entrants to the sector to purchase land due to inflated land values and access to support meaning when land has been sold often neighbouring farmers (with substantial capital resources) will take the „once-in-a-lifetime‟ opportunity to expand their farm business. Decoupling of agricultural support and the reality of market forces in the last 20 years has seen changes to the scale and structure of some farm businesses (particularly in hill and upland areas where sheep and cattle numbers have declined and non-replacement of retired farm workers) affecting local outcomes. The future CAP will see greater redistribution of CAP support, and this will undoubtedly lead to further change - some of which is already starting to have an impact.
Regulation Business regulations
Businesses are heavily regulated in their activities, particularly those that may impact on: (a) the environment; (b) climate change; (c) health and safety; (d) animal welfare. These clearly impact on local outcomes, particularly in relation to permitted management activities (e.g. in designated areas) - some of these regulations can be thought of as restrictive to land managers that may affect local outcomes. The blend of regulation with policy support (e.g. business rates relief) and other socio-economic factors could have a major bearing on locally delivered outcomes.
Investment Renewable energy
The advent of Renewable Obligation Certificates and the Feed In Tariff scheme has seen the renewable sector prosper in Scotland, bringing good economic returns to investment and short payback periods. Landowners are most likely to have benefited from these schemes - and larger landowners are likely to have benefited from larger installations. Anecdotal evidence suggests that third-party (large-scale) energy companies prefer to deal with individual businesses rather than groups of disparate landowners meaning that scale may indeed affect local outcomes. The revenue streams / cost savings may have a bearing on outcomes via the reinvestment into other aspects of land management, but the future of such incentives is a political decision and there have already been major revisions to the payment rates available.

32
Section Type Factor Potential Impact on Outcomes
State land / national industries
Government owned land
Outcomes in some rural areas are / were affected by state owned ventures (e.g. by the Forestry Commission). The Government‟s investment in afforestation in Scotland during the 1920s-1970s saw the rise of many small communities (forestry housing) as people were employed to establish and manage the national forest. These impacted on local outcomes in some communities, though reducing some agricultural opportunities. The reduction in the Forestry Commission workforce may have affected local outputs (employment / incomes) but the remaining housing stock is a legacy, even if a proportion is used for second / holiday homes etc. SNH and Ministry of Defence estates still maintain jobs in some local areas.
Fiscal Policy Tax incentives
„Sideways Loss Relief‟ provides an opportunity to offset profits made elsewhere against losses in agriculture (or vice versa)
providing that the farm made a profit in the previous 5 years (a large incentive for „lifestyle‟ farmers). Agricultural Property Relief on Inheritance Tax has reduced the requirement to sell off parts of land to pay tax bills on succession, and has also acted as an attractant to outside investors into land. Similarly, Rollover Relief on the Capital Gains Tax can lead to reinvestment into holdings that otherwise may not have happened. The income tax treatment of forestry until 1988 allowed owners effectively to switch between two bases of taxation. „Schedule B‟ was most advantageous when woodland was generating revenue from timber sales as it taxed woodland income on the basis of modest annual values, whereas „Schedule D‟ was more advantageous during periods of expenditure because it allowed claims for loss relief on planting and other management expenditure. The resulting losses could be set off against any other income (loss relief). This led to significant investment into forestry land purchase and plantation during the 1980s.
State land / national industries
National industries
Outcomes in some rural areas have been affected by 'national' industries (e.g. coal mining, energy) and their changing fortunes over time. Many central belt and southern villages were significantly affected by mine closures that still impact on local outcomes today (structural unemployment, poverty, poor health, lack of social cohesion, etc.). The closure of Dounreay will likely have led to changing social and economic fortunes of the surrounding communities (brain / wealth drain) although that will be partially offset by the lengthy decommissioning process. For many workers location is a critical factor (e.g. how close are alternative employment opportunities if closure / downscaling).
Land-use-planning
Environmental / heritage designations
The importance of environmental designations has grown in the last 30 - 40 years (SSSI, SAC, SPA, Ramsar, etc.) and these can impact on economic outcomes by restricting activities and developments. Some designations (e.g. National Park, NNR) may relate to the beauty of the area as well as to nature and this may, whilst posing some restrictions on activities may act as an attractant to recreationalists and tourists. Similarly, historic/heritage designations (Ancient Woodlands / Listed Buildings / Historic Sites / World Heritage Sites, etc.) may restrict development activities but may offer business opportunities through tourism.
Land-use-planning
Local development planning
Local development plans drawn up by Local Authorities aim to protect sensitive areas and mark out land (green and brownfield) that is earmarked for development in all settlements (business development and housing development). These plans can therefore impact on outcomes of local areas - and are often an indication of the vibrancy of a local village (i.e. expansion of development requirements - or its stagnation).
Land-use-planning
Planning permission industrial / housing development
Regulations may act as a barrier to achievement of local outcomes if planning permission is considered a significant barrier to business (diversification of the rural economy) and housing development. Scale of ownership may provide a greater asset base and more stable platform with which to take development / business risks. Business and housing development may lead to marginal fragmentation of ownership and clearly can affect local outcomes through job opportunities and housing stock.

33
Section Type Factor Potential Impact on Outcomes
Social and Demography
Demography Demographic patterns
Changing demographic pattern will in part be related to peripherality, with population decline still occurring in remote rural areas of Scotland and counter-urbanisation occurring in more accessible. This is undoubtedly linked to local and accessible economic opportunities, service provision, infrastructure, etc. in the “commuter belt.
Demography Migration
The relative proportion of in-migrants in an area may impact on the relationship of the local community with the land (i.e. if the connections to farming, forestry and estate work are lost through generations of change in landed activities). In-migration may occur in accessible locations, in high-amenity areas, etc. In-migrants may put pressure on local housing stock / lead to demand for new housing stock supply / development. Out-migrants may be former farm / estate / forestry workers that were closely connected to the land and community, and their loss may impact on community cohesion and therefore local outcomes.
Motivations Owner residency Resident owners may lead to different outcomes from absentee owners.
Motivations Factor residency Resident factors may lead to different local outcomes from third party factors (agents) that are not connected with the local community.
Technology General households Technological developments have made the lives of rural households more comfortable - fridges/freezers meaning that food purchases can be less frequent; computers / television / internet meaning that social interactions are less restricted; cars improving accessibility; and central heating and insulation meaning less reliance on solid fuel.
Motivations Landowners Landowners have many different motivations for ownership of land, and these will undoubtedly influence outcomes over time (e.g. landowners with sporting and amenity motivations for ownership may have entirely different management and control methods compared to landowners who are driven by business motivations or those driven by environmental motivations).
Political Community aspirations
Local politics (democracy) and community aspirations may affect local outcomes to varying degrees. Active communities may be responsible for the achievement of certain local outcomes (social cohesion, sense of wellbeing, provision of community facilities, etc.) despite land ownership scale, management or motivations. This may, over time, lead to community ownership of certain assets, or to agreements with local landowners over access to resources for community development.
Culture Local Culture Local culture may play an important role in delivering outcomes particularly when there is a link to tourism (e.g. Ayrshire and Burns, Speyside and Whisky, west coast / Gaelic and crofting, etc.).that
Motivations / Amenity
Second and holiday homes
The proportion of housing stock that is vacant or used as second homes / holiday lets can have a bearing on local outcomes. In areas of high vacant/second/let housing stock, there may be / have been pressures on local housing supply and local families may be squeezed out of the market (meaning that they may have to leave).
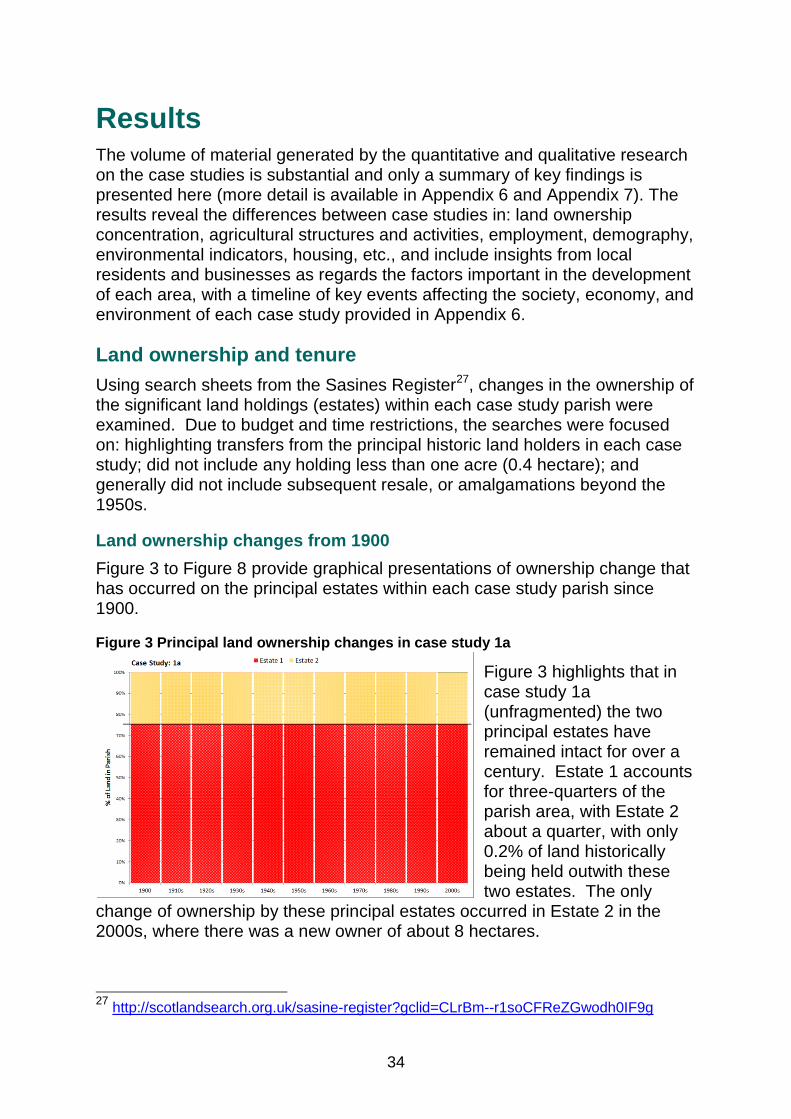
34
Results The volume of material generated by the quantitative and qualitative research on the case studies is substantial and only a summary of key findings is presented here (more detail is available in Appendix 6 and Appendix 7). The results reveal the differences between case studies in: land ownership concentration, agricultural structures and activities, employment, demography, environmental indicators, housing, etc., and include insights from local residents and businesses as regards the factors important in the development of each area, with a timeline of key events affecting the society, economy, and environment of each case study provided in Appendix 6.
Land ownership and tenure
Using search sheets from the Sasines Register27, changes in the ownership of the significant land holdings (estates) within each case study parish were examined. Due to budget and time restrictions, the searches were focused on: highlighting transfers from the principal historic land holders in each case study; did not include any holding less than one acre (0.4 hectare); and generally did not include subsequent resale, or amalgamations beyond the 1950s.
Land ownership changes from 1900
Figure 3 to Figure 8 provide graphical presentations of ownership change that has occurred on the principal estates within each case study parish since 1900.
Figure 3 Principal land ownership changes in case study 1a
Figure 3 highlights that in case study 1a (unfragmented) the two principal estates have remained intact for over a century. Estate 1 accounts for three-quarters of the parish area, with Estate 2 about a quarter, with only 0.2% of land historically being held outwith these two estates. The only
change of ownership by these principal estates occurred in Estate 2 in the 2000s, where there was a new owner of about 8 hectares.
27
http://scotlandsearch.org.uk/sasine-register?gclid=CLrBm--r1soCFReZGwodh0IF9g

35
Figure 4 Principal land ownership changes in case study 1b
Figure 4 shows how the two principal estates in case study 1b fragmented during the last century, in direct contrast to its paired case study, 1a. In 1900, Estate 1 owned over 82% of the parish whilst Estate 2 owned 14%, with about 3.5% owned by others. In the 1910s, Estate 1 was significantly fragmented, with ownership
of 52% of the parish area being transferred to 33 other owners, whilst it maintained ownership of 30% of the parish land. The 1920s saw further break-up of Estate 1 to a further 49 different landowners (many of the ownership transfers related to land parcels of less than 40 hectares), with Estate 1 owning less than 5% of the parish. Estate 2 was also split in the 1920s, with land transferred to 8 other owners, and further fragmentation occurred in the1940s and 1970s, with the remainder of Estate 2 being transferred to new owners in the 1980s. The two principal estates in case study 1b were therefore fragmented into 105 different owners over the 20th century (before further fragmentation or amalgamations took place28).
The focus groups confirmed that Estate 1 was fragmented and sold off in the inter-war period as a result of the owner experiencing financial difficulties during the 1920s depression. This led to more owner-occupied farms, small holdings and private house plots. The principal estate house was originally retained by the family following fragmentation but it was subsequently sold (unknown date) and only about 200 hectares currently remain of the original estate. Since the fragmentation of the main estate there has been only limited changes to the landownership scale, although land has been bought and sold between owners, as well as farmland being sub-let, typically as seasonal lets.
28
Due to budget restrictions these subsequent transfers (amalgamations or further fragmentation) were not assessed but were commented upon by fieldwork participants..

36
Figure 5 Principal land ownership changes in case study 2a
Case study 2a experienced very little fragmentation in the 20th century, as shown in Figure 5. In 1900, Estate 1 owned 79% of the parish area, Estate 2 owned 14%, and 5% was owned by four rural landowners, with 1% made up of the parish‟s main town. Estate 1 has remained significantly intact since 1900, with only 0.9%
of the parish transferred to three new owners in the 1970s and 1980s. Estate 2 remained intact until the 1980s when 62% of it (9% of the parish) was transferred to new ownership.
Figure 6 Principal land ownership changes in case study 2b
Figure 6 shows how the three principal estates in case study 2b fragmented during the 20th century, in direct contrast to its paired case study, 2a. Up until the 1920s, the parish was owned by three estates: Estate 1 accounted for 51% of the parish, whilst Estates 2 and Estate 3 accounted for 49% and 13%
respectively. The 1920s saw about a third of Estate 2 transferred to 28 new owners (parcel size ranging from 2 to 130 hectares), while Estate 1 transferred about 8% of its land holding to a new owner. Estate 2 underwent further major fragmentation in the 1940s to another 14 owners, with further ownership changes in the 1950s and 1960s. Estate 3 was significantly broken up to six new owners in the 1950s and 1960s, with the original estate falling to only 2.3% of the parish area. The 1950s, 1960s and 1980s saw Estate 1 conduct further transfers of land to four new owners but remain the principal land holding in the parish, at 28% of the total area. The three principal estates in case study 2b were therefore fragmented into 60 different owners over the last century (before further fragmentation or amalgamations took place29).
29
Due to budget restrictions and the time taken to access land record these subsequent transfers (amalgamations or further fragmentation) were not assessed but were commented upon by fieldwork participants..

37
The splitting up of Estate 2 was reported in the fieldwork to have been the result of land sales required to pay death duties, repatriation after the First World War (when land was sold to ex-soldiers upon return to their tenancy), and economic problems in the 1930s when leasing land was uneconomic. Landowners attending the 2b focus group felt that they had benefitted from the demise of the area‟s estates and the purchase of their tenanted farms. Feedback from the focus group also revealed that following the Estate 2 break-up there was a period of re-amalgamation when the larger, more ambitious, farms bought up smaller, uneconomic units in the quest for economies of scale enabled by mechanisation in agriculture and downstream processing.
Figure 7 Principal land ownership changes in case study 3a
Figure 7 shows how land ownership in case study 3a remained relatively stable over the last century. Up until the 1920s, there were four principal estates (over 1,400 hectares), with the land ownership dominated by Estate 1 (79%) and Estate 2 (13%). From the 1920s to the 1940s ownership of about 30% of Estate 1 was
transferred to four new owners including three land holdings over 4,000 hectares. Estate 2 had 43% of its area transferred to 5 different owners, including 1 holding over 4,000 hectares. Whilst there was some fragmentation of the original estates (from 4 to 12 owners), Estate 1 still currently dominates land ownership in the parish (54% of the land).
Figure 8 Principal land ownership changes in case study 3b
Figure 8 shows how the principal estate in case study 3b was almost entirely fragmented by 1950, in direct contrast to its paired case study, 3a. In the 1920s, a quarter of the estate transferred to 20 other owners (14 of the parcels were less than 3 hectares), including two holdings of over 1,600
hectares. The 1930s saw another large area fragmented off (that was

38
subsequently split further, most significantly in the 2000s). In the 1940s, the majority of the remaining estate area was transferred to another 6 owners (including three holdings over 3,000 hectares). The remainder of the original estate was transferred to a new owner in the 1950s and less than half a hectare remains of this fragmented estate. It is also noticeable that in the 1950s there was significant secondary fragmentation of the landed areas transferred in the 1940s. Over the century since 1900, the solitary estate was significantly fragmented, being split into 77 different owners (before any further fragmentation or amalgamations taking place through subsequent resale by new owners30).
It was noted by a number of fieldwork participants that land value inflation had been significant, particularly in recent years, driven in part by income from sales for housing developments being reinvested and partly by CAP support being capitalised into land values. It was considered that the high land values were a barrier for many to enter agriculture, and the purchase of small holdings. Over the last decade, low interest rates and rapid land price inflation has facilitated continuation of, and reinvestment in, some marginally profitable farm businesses.
Agricultural Holding Size, 1982-2012
Holding-level data from the annual June Agricultural Census (JAC)31 revealed that the total area of agricultural holdings differed somewhat between case studies due to farming systems (related to land capability) and to the extent of ownership fragmentation.
Figure 9 Distribution of agricultural holdings under and over 20 hectares 1982 - 2012
Figure 9 shows that in case study 1b (fragmented) two thirds of holdings were less than 20 hectares in 1982, and whilst this proportion increased to three quarters in 2012 it was largely as a result of a reduction in the total number of holdings. This contrasted with 1a (unfragmented) where the number of holdings under
20 hectares fell between 1982 and 2012. In 1a the total number of holdings fell by a quarter over the period and the fieldwork feedback suggested that this was a direct result of the amalgamation of holdings to create more viable units
30
Due to budget restrictions these subsequent transfers (amalgamations or further fragmentation) were not assessed but were commented upon by fieldwork participants.. 31
www.gov.scot/Topics/Statistics/Browse/Agriculture-Fisheries/PubFinalResultsJuneCensus
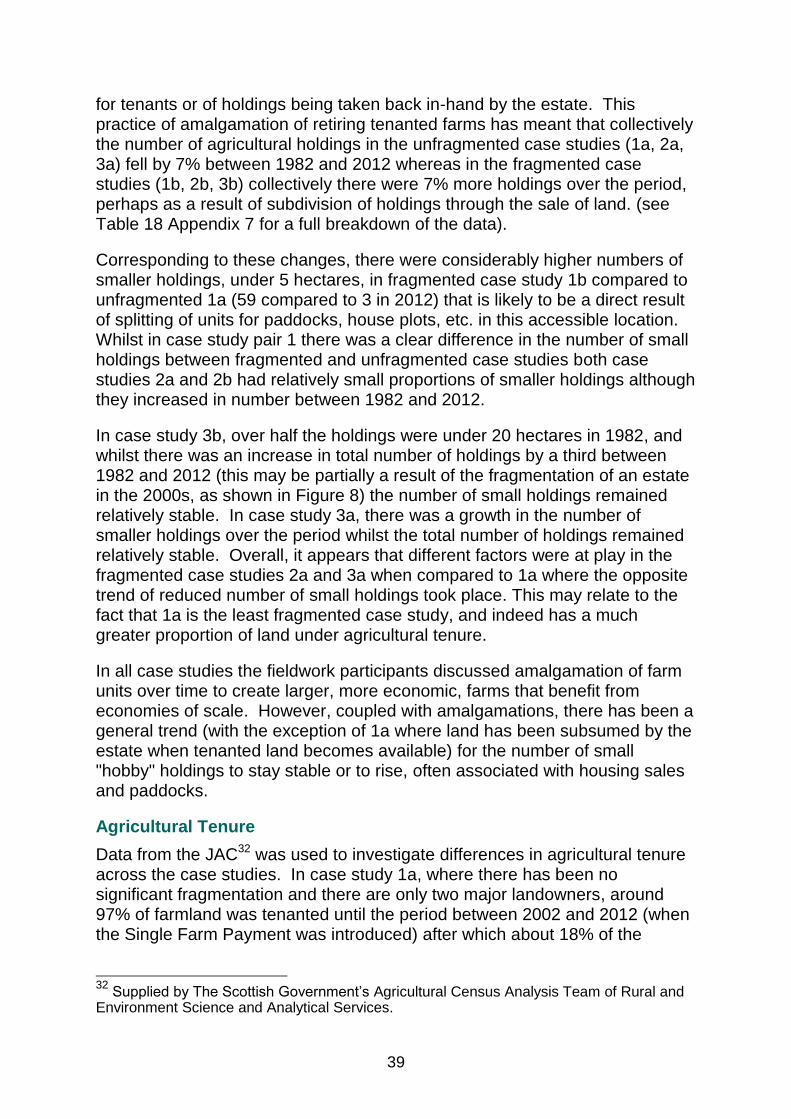
39
for tenants or of holdings being taken back in-hand by the estate. This practice of amalgamation of retiring tenanted farms has meant that collectively the number of agricultural holdings in the unfragmented case studies (1a, 2a, 3a) fell by 7% between 1982 and 2012 whereas in the fragmented case studies (1b, 2b, 3b) collectively there were 7% more holdings over the period, perhaps as a result of subdivision of holdings through the sale of land. (see Table 18 Appendix 7 for a full breakdown of the data).
Corresponding to these changes, there were considerably higher numbers of smaller holdings, under 5 hectares, in fragmented case study 1b compared to unfragmented 1a (59 compared to 3 in 2012) that is likely to be a direct result of splitting of units for paddocks, house plots, etc. in this accessible location. Whilst in case study pair 1 there was a clear difference in the number of small holdings between fragmented and unfragmented case studies both case studies 2a and 2b had relatively small proportions of smaller holdings although they increased in number between 1982 and 2012.
In case study 3b, over half the holdings were under 20 hectares in 1982, and whilst there was an increase in total number of holdings by a third between 1982 and 2012 (this may be partially a result of the fragmentation of an estate in the 2000s, as shown in Figure 8) the number of small holdings remained relatively stable. In case study 3a, there was a growth in the number of smaller holdings over the period whilst the total number of holdings remained relatively stable. Overall, it appears that different factors were at play in the fragmented case studies 2a and 3a when compared to 1a where the opposite trend of reduced number of small holdings took place. This may relate to the fact that 1a is the least fragmented case study, and indeed has a much greater proportion of land under agricultural tenure.
In all case studies the fieldwork participants discussed amalgamation of farm units over time to create larger, more economic, farms that benefit from economies of scale. However, coupled with amalgamations, there has been a general trend (with the exception of 1a where land has been subsumed by the estate when tenanted land becomes available) for the number of small "hobby" holdings to stay stable or to rise, often associated with housing sales and paddocks.
Agricultural Tenure
Data from the JAC32 was used to investigate differences in agricultural tenure across the case studies. In case study 1a, where there has been no significant fragmentation and there are only two major landowners, around 97% of farmland was tenanted until the period between 2002 and 2012 (when the Single Farm Payment was introduced) after which about 18% of the
32
Supplied by The Scottish Government‟s Agricultural Census Analysis Team of Rural and Environment Science and Analytical Services.

40
farmland was farmed by the owner. This contrasts with the fragmented case study 1b where in 1982 less than 10% of the farmland was tenanted, although this grew to around 14% in 2012.
In 2a, between 70% and 80% of the land was farmed by tenants which contrasts with 2b, its paired case study, where the amount of land farmed by tenants fell from about 35% in 1982 to only 20% in 2012, highlighting the growing prevalence of owner occupation. 3a is the case study where large landholdings still dominate ownership despite some fragmentation, yet only 20% to 30% of the land was farmed under tenancy arrangements between 1982 and 2012. Between 2002 and 2012 the significant drop in the area of tenanted land in 3b contrasts with the relatively more stable tenure position in 3a.
Figure 10 Tenure of agricultural land, 1982 - 2012
It is apparent that in all of the case studies, with the exception of 2b, there was a sudden decrease in land farmed under agricultural tenure between 2002 and 2012. During this period decoupling of agricultural support occurred and the area-based Single Farm Payment was introduced (in 2005). It was specifically
mentioned in the 2a land managers‟ focus group that over the last decade there has been a notable reduction in estate investment on tenanted farms and the trend to subsume tenanted holdings where possible has often been followed by seasonal letting of the land, thereby avoiding security of tenure issues and access to area-based CAP payments.
In case study 2b, the land managers (who were mostly owner-occupiers) considered that it is more difficult for tenant farmers to access finance than owner-occupiers. They therefore concluded that access to finance is a barrier to tenants‟ developing or restructuring their business. They suggested that if farming was more efficient, and there were higher market returns, then accessing finance would be easier for tenants and would merit higher rents that could be reinvested by landowners into their holdings. Helping to make farming more efficient and profitable and less reliant on CAP support was seen as being in the best interests of both landowners and tenants alike, as well as potentially reducing fragmentation through sales of plots of land to maintain the farm business.

41
Feedback from the case studies revealed that the reforms of agricultural holdings legislation coupled with CAP reform have led to some tensions between landowners and tenants, with impacts on long-term strategic development and investment. In recent times, some estates have taken more farmland in hand through absorption of small tenanted holdings when they became economically non-viable, or when a tenant retires. Equally, some tenants have benefited from economies of scale through amalgamations with smaller non-viable units, although it was considered that this policy can restrict opportunities for new entrants, and can be seen as a restriction by those tenants that do not receive an expansion opportunity.
Land manager participants agreed (in both fragmented and unfragmented case studies) that agricultural tenure represents a very good opportunity for getting involved in farming, particularly for those with limited capital. Being given this opportunity by landowners was seen as crucial to „moving up the farming ladder‟, but it was perceived that landowner concerns over security of tenure and rights to buy has meant that more owners (including smaller-scale “lifestyle” owners) are utilising contract farming agreements rather than engaging in longer term leases.
Economy
Feedback from the fieldwork suggests that landowner absenteeism (for both fragmented and unfragmented estates) was not considered a major issue compared to owner motivations. It was evident that even different generations of owners from the same families had differing degrees of engagement with the local community, and in particular with the development of the estate infrastructure, businesses and assets (e.g. housing). It was noted in case study 1a (unfragmented) that previous generations of owners had “taken great interest in the area, but that has waned with the present generation”, whilst many other estates were recognised as being more engaged with their local communities. In each of the unfragmented case studies, the focus group respondents felt that the estate(s) still had an important influence over the area.
Figure 11 shows how the type of occupiers of agricultural holdings changed between 1982 and 2012 in each case study. Both case studies 1a and 1b have seen a sharp decline in the number of full-time occupiers (44% and 67% decrease respectively). Whilst the number of part-time occupiers (>50% - where they spend more than half their time on the farm) increased slightly in 1a between 2002 and 2012, the overall decrease in occupiers largely mirrored the decline in full-time occupiers. In 1b, there was a slight increase in the number of part-time occupiers (<50% - where they spend less than half their time on the farm) between 1982 and 2002, with a decrease between 2002 and 2012 that may be related to housing development.

42
Successful businesses
Figure 11 Occupier types of agricultural holdings 1982-2012
In 2a, the number of full-time occupiers fell by more than a third between 1992 and 2012, with limited change in the number of part-time occupiers. This contrasts with 2b where the number of full-time occupiers was largely maintained over the period, with a small growth in the number of part-time farmers. The number of full-time
farmers in 3a fell by more than a half, whilst there was some increase in the number of part-time occupiers over the period, which differs from 3b where the number of full-time occupiers increased alongside those of part-time occupiers. In two of the case study pairs (2 and 3), there were differences between the unfragmented and fragmented case studies, with the latter having been able to maintain the number of full-time farmers on the ground.
The case study fieldwork suggested that the reduction in full-time occupiers (with the exception of 3b where recent fragmentation of land farmed in-hand has led to increased opportunities for new owners) was related to amalgamations enabled by mechanisation of farming activities, a general need to generate additional off-farm incomes to help maintain the farming business, and purchases of farms by new entrants who see the farm as secondary to their main job. The land managers in 2b reported that, for some time, very few spouses have been fully engaged on farms, with spouses earning off-farm income as a means of contributing to the survival of the family farm, having become common place over the last 20 to 30 years. Thus part-time farming in all areas has become more prevalent.
CAP support payments are important to the economic survival of Scottish farms and businesses in the wider agri-food supply chain, and through local expenditure and wages to the local economy. Analysis of the direct support payments33 made to farm businesses located in each case study confirmed the significance of CAP funding in all areas. It is noticeable that whilst 1b had a high number of agricultural holdings (102) and occupiers (38), only 18 businesses located in the parish were in receipt of direct CAP support in 2014. In most of the case studies, the large differences between the mean and median payments show that mean figures are being skewed by some large
33
Single Farm Payment, Scottish Beef Scheme and Less Favoured Area Support Scheme payments
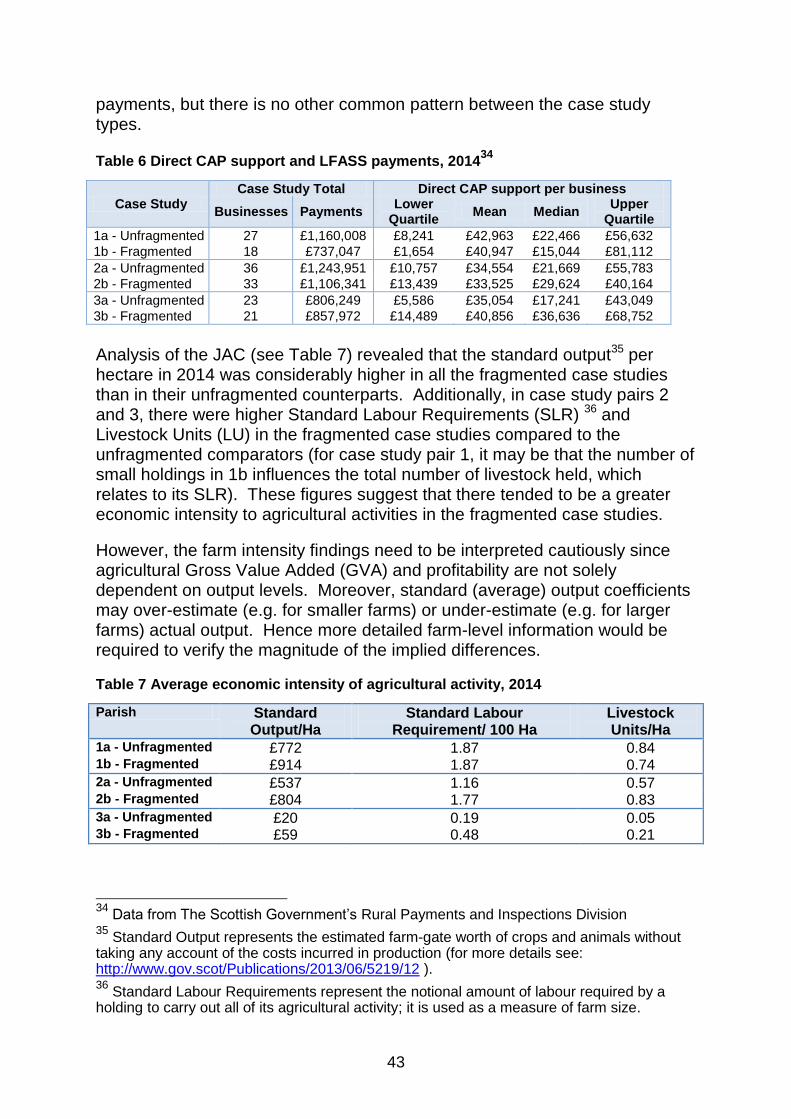
43
payments, but there is no other common pattern between the case study types.
Table 6 Direct CAP support and LFASS payments, 201434
Case Study Case Study Total Direct CAP support per business
Businesses Payments Lower
Quartile Mean Median
Upper Quartile
1a - Unfragmented 27 £1,160,008 £8,241 £42,963 £22,466 £56,632
1b - Fragmented 18 £737,047 £1,654 £40,947 £15,044 £81,112
2a - Unfragmented 36 £1,243,951 £10,757 £34,554 £21,669 £55,783
2b - Fragmented 33 £1,106,341 £13,439 £33,525 £29,624 £40,164
3a - Unfragmented 23 £806,249 £5,586 £35,054 £17,241 £43,049
3b - Fragmented 21 £857,972 £14,489 £40,856 £36,636 £68,752
Analysis of the JAC (see Table 7) revealed that the standard output35 per hectare in 2014 was considerably higher in all the fragmented case studies than in their unfragmented counterparts. Additionally, in case study pairs 2 and 3, there were higher Standard Labour Requirements (SLR) 36 and Livestock Units (LU) in the fragmented case studies compared to the unfragmented comparators (for case study pair 1, it may be that the number of small holdings in 1b influences the total number of livestock held, which relates to its SLR). These figures suggest that there tended to be a greater economic intensity to agricultural activities in the fragmented case studies.
However, the farm intensity findings need to be interpreted cautiously since agricultural Gross Value Added (GVA) and profitability are not solely dependent on output levels. Moreover, standard (average) output coefficients may over-estimate (e.g. for smaller farms) or under-estimate (e.g. for larger farms) actual output. Hence more detailed farm-level information would be required to verify the magnitude of the implied differences.
Table 7 Average economic intensity of agricultural activity, 2014
Parish Standard Output/Ha
Standard Labour Requirement/ 100 Ha
Livestock Units/Ha
1a - Unfragmented £772 1.87 0.84 1b - Fragmented £914 1.87 0.74 2a - Unfragmented £537 1.16 0.57 2b - Fragmented £804 1.77 0.83 3a - Unfragmented £20 0.19 0.05 3b - Fragmented £59 0.48 0.21
34
Data from The Scottish Government‟s Rural Payments and Inspections Division 35
Standard Output represents the estimated farm-gate worth of crops and animals without taking any account of the costs incurred in production (for more details see: http://www.gov.scot/Publications/2013/06/5219/12 ). 36
Standard Labour Requirements represent the notional amount of labour required by a holding to carry out all of its agricultural activity; it is used as a measure of farm size.
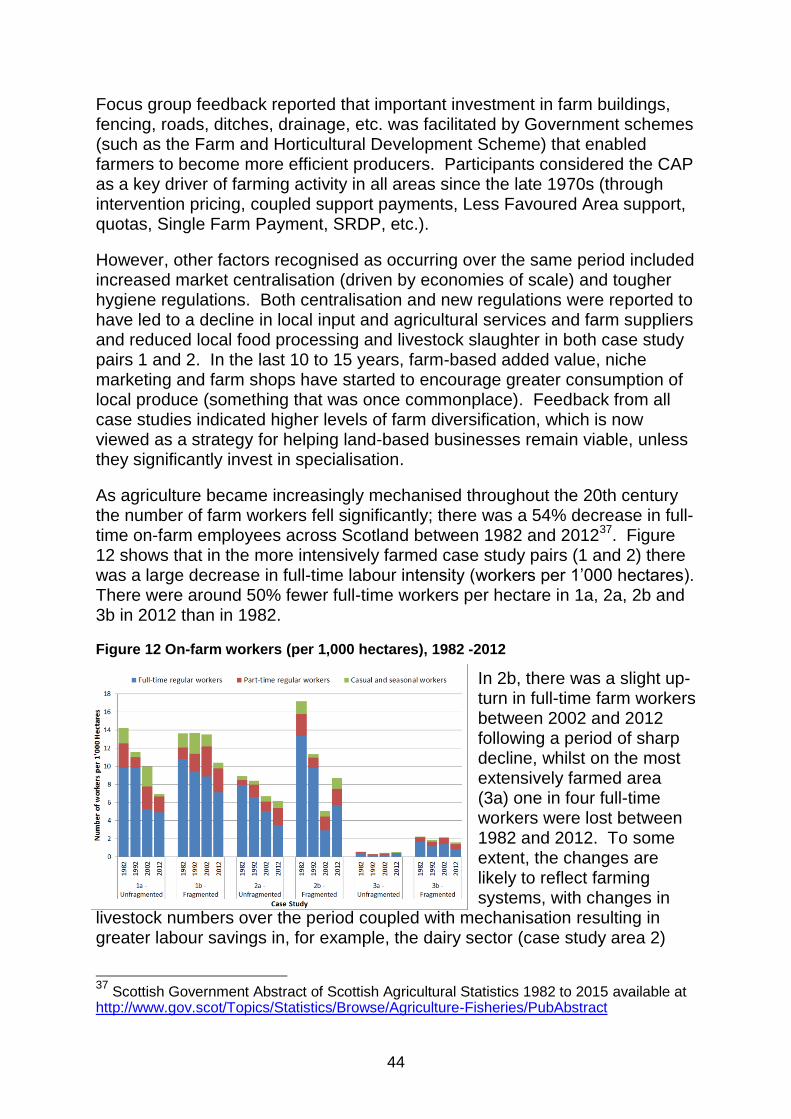
44
Focus group feedback reported that important investment in farm buildings, fencing, roads, ditches, drainage, etc. was facilitated by Government schemes (such as the Farm and Horticultural Development Scheme) that enabled farmers to become more efficient producers. Participants considered the CAP as a key driver of farming activity in all areas since the late 1970s (through intervention pricing, coupled support payments, Less Favoured Area support, quotas, Single Farm Payment, SRDP, etc.).
However, other factors recognised as occurring over the same period included increased market centralisation (driven by economies of scale) and tougher hygiene regulations. Both centralisation and new regulations were reported to have led to a decline in local input and agricultural services and farm suppliers and reduced local food processing and livestock slaughter in both case study pairs 1 and 2. In the last 10 to 15 years, farm-based added value, niche marketing and farm shops have started to encourage greater consumption of local produce (something that was once commonplace). Feedback from all case studies indicated higher levels of farm diversification, which is now viewed as a strategy for helping land-based businesses remain viable, unless they significantly invest in specialisation.
As agriculture became increasingly mechanised throughout the 20th century the number of farm workers fell significantly; there was a 54% decrease in full-time on-farm employees across Scotland between 1982 and 201237. Figure 12 shows that in the more intensively farmed case study pairs (1 and 2) there was a large decrease in full-time labour intensity (workers per 1‟000 hectares). There were around 50% fewer full-time workers per hectare in 1a, 2a, 2b and 3b in 2012 than in 1982.
Figure 12 On-farm workers (per 1,000 hectares), 1982 -2012
In 2b, there was a slight up-turn in full-time farm workers between 2002 and 2012 following a period of sharp decline, whilst on the most extensively farmed area (3a) one in four full-time workers were lost between 1982 and 2012. To some extent, the changes are likely to reflect farming systems, with changes in
livestock numbers over the period coupled with mechanisation resulting in greater labour savings in, for example, the dairy sector (case study area 2)
37
Scottish Government Abstract of Scottish Agricultural Statistics 1982 to 2015 available at http://www.gov.scot/Topics/Statistics/Browse/Agriculture-Fisheries/PubAbstract
45
compared to the hill sheep sector (case study area 3). It is clear that full-time employees have not been substituted by part-time employees or casual labour in the case studies, but feedback from all the focus groups pointed to the growing importance of agricultural contractors in undertaking farm work.
In addition to farm workers, the focus group respondents reported that in the unfragmented case studies there has been a significant decline in the number of estate workers over the study period, which has had noticeable social impacts locally (school and shop closures, etc.), although it has freed up tied housing for private rental or sale. Estates (1a, 3a) have increasingly relied on a network of contractors (self-employed) for land and property maintenance, meaning that there are fewer year-round land-based jobs than there once were, and there has been a loss of connection with land management within the local resident population.
Outwith agriculture, the focus groups reported that urban-based economic development and centralisation of public services has led to a general lack of industry and small businesses within the case studies. In all areas (including those with large population increases – 1a and 1b), the fieldwork reiterated the decline in local shops, trades and services provision over time, particularly as a result of improved population mobility, the rise of internet shopping (particularly from supermarkets, commuters shopping elsewhere, populations change, etc.). In both 3a and 3b, it was noted that there had been a significant rise in tourism-related enterprises (caravan sites, self-catering accommodation, recreational sport activities, etc.) capitalising on demand from visitors to these popular, scenic areas. In 3a, it was noted that the estate was considered a major driver for the diversification of the local tourism industry, which has led to positive local outcomes.
While investment in an area was generally seen as positive (e.g. creating jobs, enhancing the local built environment), concerns were raised in 3b about one larger tourism venture having repeatedly experienced financial difficulties and being sold on multiple occasions, with knock-on effects for local jobs, housing, etc. Participants in 3b also reminisced enthusiastically about times when there was more „affordable‟ tourism that brought annual visitors who would integrate with the local community and local social events.
In all case studies, the sale of former estate housing and sale of buildings for conversion to housing (all) or industrial development (1a, 1b, 2a) was seen as an important driver of change. The sale of these assets led to different outcomes based on location, with use for second homes or tourism accommodation being important in the more peripheral case studies whilst land sales for housing development were more important in the more accessible locations (1a, 1b), and liquidising assets for some landowners.

46
High-Quality Jobs
Figure 13 Employment status of 16-74 year olds. 1991 – 2011
Using extracts from the population census, Figure 13 shows the employment status of all working-age people in each case study between 1991 and 2011. Similar patterns can be observed in case studies 1a and 1b, with a dip in full-time employees in 2001. 1a (unfragmented) had a higher rate of self-
employment compared to 1b, which had a slight increase in part-time employment between 2001 and 2011. It would appear that in case study pair 1, the overall higher level of economic activity has been influenced by the proximity of a large urban area (population over 125,000). In case study pair 2, it is noticeable that full-time employment declined by about 5% in both areas, whilst part-time employment grew by 6-7%. 2b had a greater, and growing, reliance on self-employment than 2a, and it is noticeable that in 2b there was a high level (43% in 2011) of economic inactivity where retirees accounted for 60% of those economically inactive, possibly due to its more remote location. In case study area 3, both areas followed similar patterns, with a higher level of self-employment in 3b.
Changing demography, centralisation of services and business, loss of industry, and loss of transport links (rail in most case studies) all played a part in the changing employment structure in the case studies. The focus groups recalled that outwith farming and estate work there were periods during the 20th century when skilled workers were employed in many of the case studies (e.g. industrial works in 1a, 1b, 2a; military in 2a; renewable energy developments in 3a and 3b; mining, 3b).
Using data from the population census38, Figure 14 compares sectoral employment across the case studies in 2001 and 2011. The influence of the rapidly expanding towns in 1b (fragmented) is apparent, as there was a very low level of employment in agriculture, forestry and fishing compared to 1a. In case study pair 2, the difference in agricultural, forestry and fishing employment is significant, with only 5% in 2a (which contains part of an urban area) compared to about 30% in 2b (which is a more remote agricultural
38
The industrial classifications used in each of the 1991, 2001, 2011 population census differ it was still possible to make meaningful comparisons for 2001 and 2011 for key sectors.
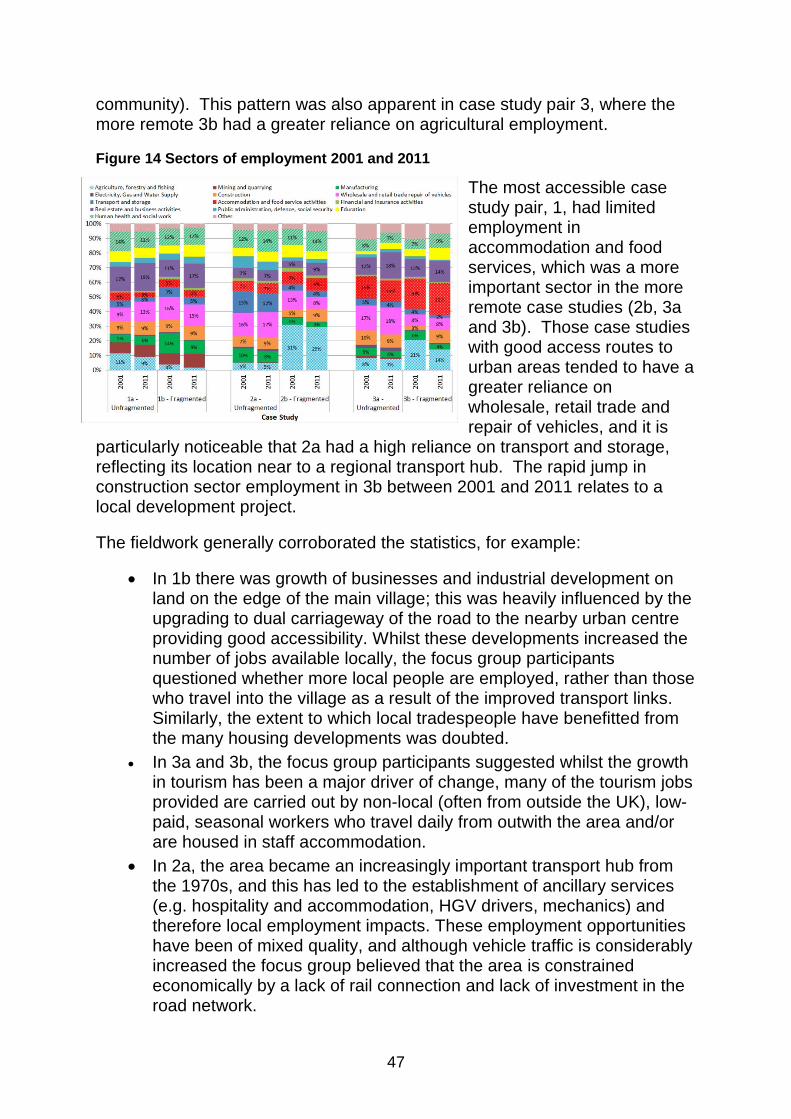
47
community). This pattern was also apparent in case study pair 3, where the more remote 3b had a greater reliance on agricultural employment.
Figure 14 Sectors of employment 2001 and 2011
The most accessible case study pair, 1, had limited employment in accommodation and food services, which was a more important sector in the more remote case studies (2b, 3a and 3b). Those case studies with good access routes to urban areas tended to have a greater reliance on wholesale, retail trade and repair of vehicles, and it is
particularly noticeable that 2a had a high reliance on transport and storage, reflecting its location near to a regional transport hub. The rapid jump in construction sector employment in 3b between 2001 and 2011 relates to a local development project.
The fieldwork generally corroborated the statistics, for example:
In 1b there was growth of businesses and industrial development on land on the edge of the main village; this was heavily influenced by the upgrading to dual carriageway of the road to the nearby urban centre providing good accessibility. Whilst these developments increased the number of jobs available locally, the focus group participants questioned whether more local people are employed, rather than those who travel into the village as a result of the improved transport links. Similarly, the extent to which local tradespeople have benefitted from the many housing developments was doubted.
In 3a and 3b, the focus group participants suggested whilst the growth in tourism has been a major driver of change, many of the tourism jobs provided are carried out by non-local (often from outside the UK), low-paid, seasonal workers who travel daily from outwith the area and/or are housed in staff accommodation.
In 2a, the area became an increasingly important transport hub from the 1970s, and this has led to the establishment of ancillary services (e.g. hospitality and accommodation, HGV drivers, mechanics) and therefore local employment impacts. These employment opportunities have been of mixed quality, and although vehicle traffic is considerably increased the focus group believed that the area is constrained economically by a lack of rail connection and lack of investment in the road network.

48
People
In all case studies, population change was seen as a key driver of change. Focus group participants did not intimate that they believed land ownership factors were a significant contributory factor in driving demographic change, rather suggesting that changes occurred naturally as a result of wider economic and societal changes (mechanisation, urbanisation, counter-urbanisation, commuting, etc.). Similar demographic changes to those observed in wider rural Scotland (Thomson: 2010, 2012) were reported by participants, particularly the issue of an aging population: although it was not always seen negatively, with examples given (1a) of increased local volunteering from a highly skilled group (similar to findings reported by Woolvin and Skerratt, 2012). All case studies suffer from out-migration of young adults as they seek education and employment opportunities (as reported for wider rural Scotland by Atterton and Brodie, 2014). However, it was noted that businesses now struggle to recruit young workers in most of the case studies, instead being reliant on transient / migrant labour.
Population census data suggests39 that the fragmented case studies were each more likely to have experienced population growth between 1991 and 2011 than their unfragmented counterparts. Over this period, the population of case study 1a declined by about 18%, whilst in 2a it was static, and in 3a there was modest (4%) growth compared to the more fragmented case studies where there was a 63% population increase in 1b, a 14% increase in 2b and a 13% increase in 3b. The working age population (16-74 years) changed by a similar proportion to the total population in each case study.40
However, these changes fall within the range of diverse patterns of demographic change that rural communities across Scotland have experienced (Thomson and Carson, 2014). Furthermore the influence of land ownership on population growth is unlikely to be simple or direct. For example, population growth reflects both employment and housing opportunities. The latter may be affected by the willingness of landowners to release land for new housing, but also by existing residents' and planning authorities' willingness to accept housing (re-developments) or indeed to agree on how the existing housing stock should be allocated. Equally, the preferences of potential residents with respect to different types and quality of housing affects demand in any particular location. Given general declines in land-based employment, job creation to retain and/or attract residents is more likely to be driven by business (or public-sector) developments not reliant on land per se, and/or by developments in (and good transport connections to) nearby urban areas. Hence, again, more detailed information on places of work and occupation of residents would be required.
39
There is an element of uncertainty due to changes in output area statistics boundaries. 40
Working-age population changes: 1a, -17%; 1b, +60%; 2a, 0%; 2b, +9%; 3a, +5%; 3b, +14%.

49
Figure 15 Population structure, 1991 to 2011
Figure 15 highlights ageing populations in all case studies with the exception of 1b (which has been influenced by commuters and growth of the main village). Over the period 1991 to 2011, only 1b and 3b (both fragmented) maintained the proportion of school children. All areas had an increase in the over 65 year old grouping, and,
with the exception of 1b, had a rise in the proportion of 45-64 year olds. Again, with the exception of 1b, the proportion of 25-44 year olds fell in all case studies (by 8% in 2a and 3a), meaning that there are fewer younger workers available in each area. In the more remote case studies (2 and 3), the focus group commented that there have been fewer young workers available over the last 40 years, and that there is now an expectation that 16-24 year olds leave the area to attend further / higher education or to seek employment opportunities. These demographic patterns are largely representative of the general population structure of accessible rural areas (case study pair 1) and more remote locations (case study pairs 2 and 3) as well as regional demographic patterns (Thomson 2010, 2012; Thomson and Carson, 2014).
Society
Good-quality, affordable homes
It was considered by the focus groups that the quality of housing standards in all case studies has improved dramatically over the study period, particularly in the last 40 to 50 years. The introduction of electricity, phones, insulation, central heating, modern appliances, etc. in most households, coupled with the a reduction in over-crowding of housing were reported as having helped in significantly improving the quality of life of householders, although it was acknowledged by respondents that the pace of improvement has often been at the behest of the landlord, whether private or public.
The focus groups each revealed how there was some housing investment by local authorities in the 1930s to 1960s. This was followed by the introduction of the Right to Buy initiative in the 1980s, that led to increased private housing ownership and reduced social housing stock.
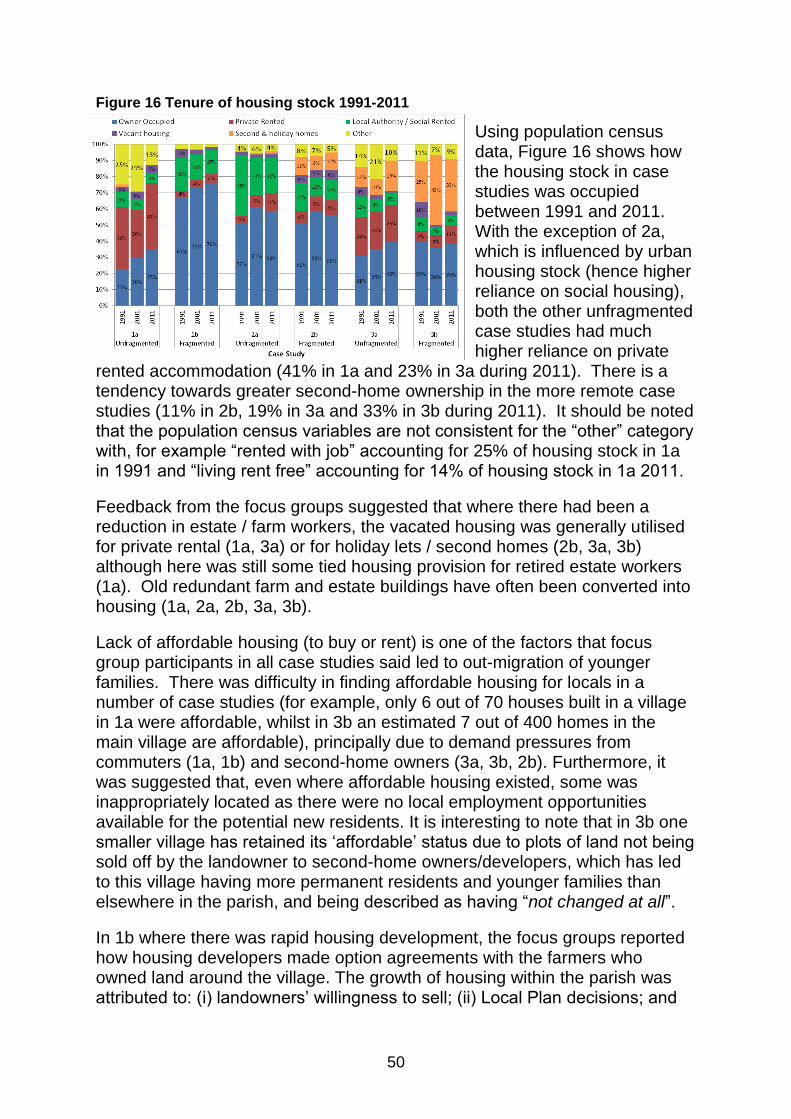
50
Figure 16 Tenure of housing stock 1991-2011
Using population census data, Figure 16 shows how the housing stock in case studies was occupied between 1991 and 2011. With the exception of 2a, which is influenced by urban housing stock (hence higher reliance on social housing), both the other unfragmented case studies had much higher reliance on private
rented accommodation (41% in 1a and 23% in 3a during 2011). There is a tendency towards greater second-home ownership in the more remote case studies (11% in 2b, 19% in 3a and 33% in 3b during 2011). It should be noted that the population census variables are not consistent for the “other” category with, for example “rented with job” accounting for 25% of housing stock in 1a in 1991 and “living rent free” accounting for 14% of housing stock in 1a 2011.
Feedback from the focus groups suggested that where there had been a reduction in estate / farm workers, the vacated housing was generally utilised for private rental (1a, 3a) or for holiday lets / second homes (2b, 3a, 3b) although here was still some tied housing provision for retired estate workers (1a). Old redundant farm and estate buildings have often been converted into housing (1a, 2a, 2b, 3a, 3b).
Lack of affordable housing (to buy or rent) is one of the factors that focus group participants in all case studies said led to out-migration of younger families. There was difficulty in finding affordable housing for locals in a number of case studies (for example, only 6 out of 70 houses built in a village in 1a were affordable, whilst in 3b an estimated 7 out of 400 homes in the main village are affordable), principally due to demand pressures from commuters (1a, 1b) and second-home owners (3a, 3b, 2b). Furthermore, it was suggested that, even where affordable housing existed, some was inappropriately located as there were no local employment opportunities available for the potential new residents. It is interesting to note that in 3b one smaller village has retained its „affordable‟ status due to plots of land not being sold off by the landowner to second-home owners/developers, which has led to this village having more permanent residents and younger families than elsewhere in the parish, and being described as having “not changed at all”.
In 1b where there was rapid housing development, the focus groups reported how housing developers made option agreements with the farmers who owned land around the village. The growth of housing within the parish was attributed to: (i) landowners‟ willingness to sell; (ii) Local Plan decisions; and

51
(iii) demand due to rising population. The route of the road development was important in determining where the housing development took place, and was not driven by landowners.
Figure 17 Average house price 1993-201141
Figure 17 shows how rapid house price inflation affected both case study areas 1 and 3. Case study 1a saw a 245% increase and 1b a 375% increase between 1993 and 2011, with 3a having 280% growth and 3b 350% growth over the period. In case study pair 2, both areas experienced more modest (170-180%)
growth in house prices. Focus group participants commented that in 1a and 1b competition from commuters has led to this rapid growth in house price (despite developments increasing supply), whilst in 3a and 3b it was considered that this inflation was driven by demand for second homes in a picturesque area. Similar patterns have been reported for other accessible and more remote locations across Scotland (Thomson, 2012).
Table 8 shows the difference in housing type between case studies. Case study 2a (unfragmented) had the highest proportion (75%) of lower value housing (Council Tax bands A to C) in 2011; this is influenced by some urban housing being part of the study area. 2b had slightly lower proportions of bands A to C housing, with a third of the housing stock classed as bands D and E. Both areas in case study pair 1 had only 20% lower value housing in 2011, with both dominated (80%) by housing in bands D-H, and focus group participants stressed that this was due to the large number of new-build homes targeted at high-income earners. Both areas in case study pair 3 were broadly similar, with more than half their housing stock in bands D to H. Housing stock turnover42 figures show no discernible pattern, although 1b and 3b (both fragmented) had greater turnover in 2011 than the other areas (influenced by housing developments and village growth in 1b, and by second homes in 3b).
41
Data extracted from www.sns.gov.uk. Residential property transactions are recorded by Registers of Scotland. 42
Proportion of housing stock sold in any single year.
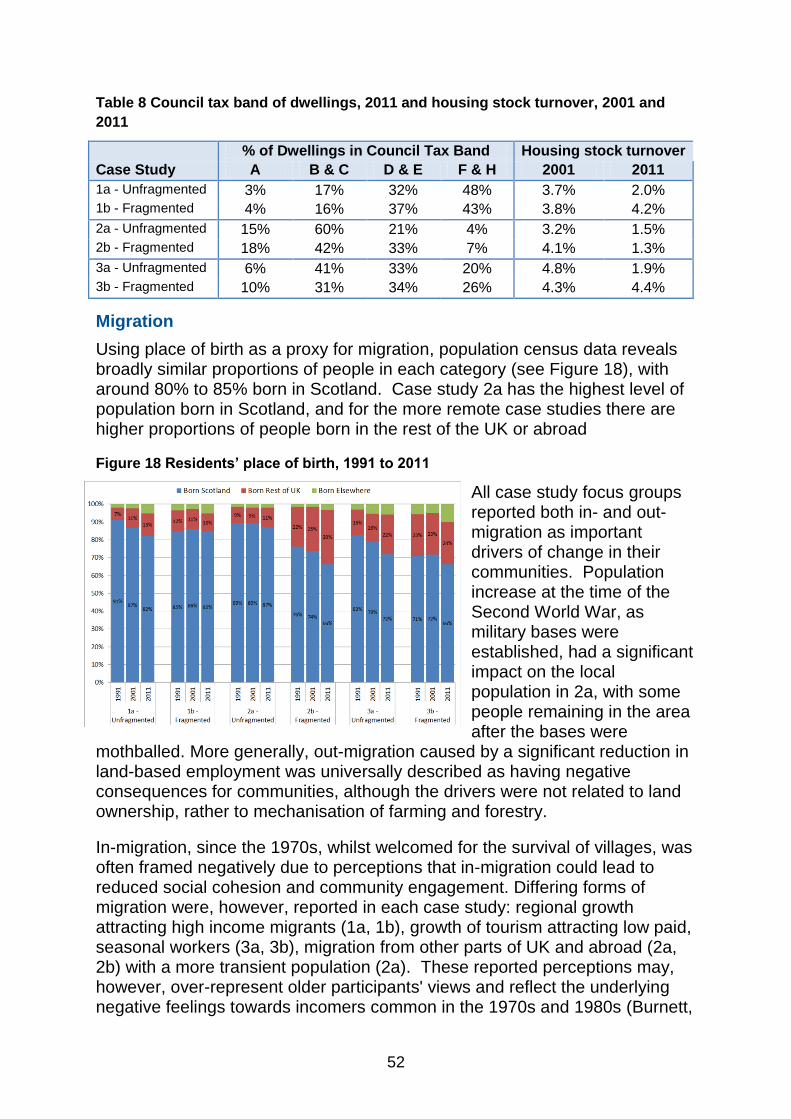
52
Table 8 Council tax band of dwellings, 2011 and housing stock turnover, 2001 and
2011
% of Dwellings in Council Tax Band Housing stock turnover
Case Study A B & C D & E F & H 2001 2011
1a - Unfragmented 3% 17% 32% 48% 3.7% 2.0%
1b - Fragmented 4% 16% 37% 43% 3.8% 4.2%
2a - Unfragmented 15% 60% 21% 4% 3.2% 1.5%
2b - Fragmented 18% 42% 33% 7% 4.1% 1.3%
3a - Unfragmented 6% 41% 33% 20% 4.8% 1.9%
3b - Fragmented 10% 31% 34% 26% 4.3% 4.4%
Migration
Using place of birth as a proxy for migration, population census data reveals broadly similar proportions of people in each category (see Figure 18), with around 80% to 85% born in Scotland. Case study 2a has the highest level of population born in Scotland, and for the more remote case studies there are higher proportions of people born in the rest of the UK or abroad
Figure 18 Residents’ place of birth, 1991 to 2011
All case study focus groups reported both in- and out-migration as important drivers of change in their communities. Population increase at the time of the Second World War, as military bases were established, had a significant impact on the local population in 2a, with some people remaining in the area after the bases were
mothballed. More generally, out-migration caused by a significant reduction in land-based employment was universally described as having negative consequences for communities, although the drivers were not related to land ownership, rather to mechanisation of farming and forestry.
In-migration, since the 1970s, whilst welcomed for the survival of villages, was often framed negatively due to perceptions that in-migration could lead to reduced social cohesion and community engagement. Differing forms of migration were, however, reported in each case study: regional growth attracting high income migrants (1a, 1b), growth of tourism attracting low paid, seasonal workers (3a, 3b), migration from other parts of UK and abroad (2a, 2b) with a more transient population (2a). These reported perceptions may, however, over-represent older participants' views and reflect the underlying negative feelings towards incomers common in the 1970s and 1980s (Burnett,

53
1998) and/or the lack of acknowledgement of the impact of wider societal change, including the changed circumstances and dynamics of family life (e.g. Hickman et al., 2009)."
Community Activities and Spaces
Schools: Issues relating to schools were raised in all case study discussions, although with different outcomes in 1b where there was rapid population growth. In 1b, the population influx since the 1970s put pressure on the local primary school, with issues of over-crowding (which reappeared during the phase of housing development over the last decade). A new school was completed in the 2000s that was apparently „full on day one‟ with a second new primary school currently under construction. In case study 1a, the focus group explained that the landowner had fought against the amalgamation of the primary schools in the two main villages as he felt it would change the character of the villages and affect the type of in-migrants to the area. The school rolls in 1a have now expanded and the schools appear to be more sustainable. In contrast to this, other case studies have seen closure of most primary schools in smaller villages (e.g. three out of four closed in 2b), with subsequent consequence in that the area has become less attractive for young families, which means recruitment of appropriate staff has been more difficult.
Transport: All case study focus groups (with the exception of 1b) discussed a reduction in public transport (bus service decline and railway station closures) as having negative impacts on their communities (particularly for young and elderly people)43, whilst acknowledging that the rise in car ownership has led to improvements in the quality of life for individuals able to travel greater distances for work, shopping, leisure activities, etc. However, there was generally an underlying tone that the car, and greater mobility of residents, was a key contributory factor in the demise of local shops, services and in community cohesion. Increased volumes of road traffic were considered negatively from a social and environmental perspective (particularly where local roads were used as „rat-run‟ shortcuts - 1a, 1b or increased volume of heavy goods vehicles – 2a), although welcomed from a business perspective with regard to tourism (2b, 3a, 3b) and freight (2a).
Services and facilities: A concern in some case studies was the reduction in availability of local health care provision, through loss of local doctors and nurses (1a, 1b, 2a) due to centralisation of services and improved population mobility. This was reported to have had negative impacts on the sense of community in the area, as well as losing lynchpins of the community – well
43
This is a sentiment across much of rural Scotland, and the two objective of the Scottish Rural Parliament Action Plan 2015-2016 are: (1) “Improved communication between transport operators and with communities regarding transport developments and efforts to integrate timetables, with opportunities for communities to challenge changes to services” and (2) “Improved support for community transport initiatives”

54
known, highly educated and trusted professionals. It was felt by participants that this has led to older people moving away from the area as their health starts to decline, in order to seek closer health care. These concerns follow Hall and Skerratt (2010), who highlighted that attracting health care professionals to some more remote locations is problematic and that accessibility to doctors and pharmacies is already difficult for some elderly residents, particularly when they do not have access to private transport. These and other issues concerning healthcare provision in rural areas were acknowledged by the Scottish Government through the publication of Delivering for Remote and Rural Healthcare (2007)44 – a vision of how to deliver a sustainable health care service across rural Scotland. It should be noted that there was no connection made, by focus group participants, between the loss of these services and landownership factors.
In some case studies (1a, 1b), the village halls are largely owned and maintained by the local authority but the closure of village halls in many villages across 3a was considered a major barrier to locals socialising and gathering, as there is often now a lack of community spaces. Whilst not reported as directly linked to land ownership, the demise of local shops, banks and tradesmen were reported as a negative trend in all case studies, although it was acknowledged that increased mobility, shorter drive times, changed shopping patterns, internet shopping, etc. have had positive impacts on local residents‟ quality of life. Yet despite these positive societal developments remote rural households can still face 10-40% higher costs to reach minimum acceptable living standards (Hirsch et al., 2013) and high delivery costs for internet purchases and high heating costs (Sutherland, 2015).
There is considerable coverage of the issues in delivering acceptable broadband services to much of rural Scotland (Sutherland, 2015; Ashmore, et al., 2015), and whilst there was some complaints about poor connectivity speed from case study participants, many commented on how the internet and broadband had improved the quality of life of local residents and also led to business opportunities.
Community Cohesion: Whilst overall service and facility provision has decreased in most case studies (local shops, post offices, schools, church, village halls, etc.) the large influx of residents in case study pair 1 has meant that some shops (1a, 1b) and the local church (1a) have been maintained, providing services to the whole community. Focus group participants in most case studies emphasised that there were now fewer community social functions than in the past, driven by modern technology (television, internet, etc.) and improved mobility. There was also an underlying sentiment that in-migration has had a negative impact on community cohesion and identity, due in part to people now not knowing each other, but also to less engagement in
44
www.gov.scot/resource/doc/222087/0059735.pdf

55
community life from incomers (particularly when they were not working locally). This sentiment was characterised by the statement that “It’s not as community-minded as it was, because we are getting people who just commute, and don’t join in with the local activities.” However, again, it should be acknowledged that the focus group sentiments may be influenced by the embedded negative attitudes of older, longer term, „local‟ participants towards incomers, and that such attitudes may not be shared universally by all parts of a community (Burnett, 1998; Atterton, 2012; Bosworth and Atterton, 2012).
In 1b it appears that the main village has grown beyond a critical point, and that concerns surrounding residents integrating and community cohesion have lessened as there is greater acceptance that it has grown into a commuter town, although there remains a challenge in getting volunteer support for clubs, youth groups, etc. In 3b, where there has been a growth in second-home ownership, it was notable that in the focus group distinctions were made between „long-term, permanent residents‟ and „second home/holiday home owners‟, highlighting a real lack of integration between these two sub-communities (as characterised by Burnett, 1998), which had been more integrated in the past.
Community engagement and assets: The role of land management „factors‟ was considered important when there is an absentee landowner, and it was felt by some participants that factors do not always attempt to get “a feel for the community”; this can lead to them being unwilling to engage in or lead on community initiatives.
In 2b the former estate owners had gifted to the community land which is used for parks, but also for the site of a Community Association enterprise that generates about £25,000 per annum for the community. In 3b, a community group has taken ownership of a hill farm and developed several affordable homes for rent through renovation of farm buildings (through the Rural Empty Properties Grant scheme) and a community/public hire facility has also been built, hosting musical events, etc. Additionally in 3b, the community benefits from income from a nearby wind energy development that allows investment in community projects and activities, and has “helped to keep local groups going”. In 1b, it was discussed that despite the growing wealth of the community, as a result of industrial developments and in-migration of wealthy commuters, able to afford executive-style new housing, the village itself had not significantly benefited from perceived local wealth, other than through donations to fund-raising initiatives. Nonetheless, two local businesses were praised for being „community-minded‟, through the donation of land for community activities.
These issues highlight that it is the benevolence and motivations of individuals with access to land and capital (whether large or small) that are important in delivering community benefits where there is a lack of provision. Where scale of ownership has been preserved, local estates remain a background feature

56
for some residents, while being more relevant and important for others (e.g. tenant farm families).
Governance: In a number of the case studies the participants expressed different degrees of dissatisfaction and disappointment about the impacts that centralised local government has had (3a, 3b). Local Authorities were described as “remote and separate”, and as “operating an urban-suburban model, which does not understand the needs of rural areas” (3b).
Community Outdoor Benefits
Local agricultural and horticultural shows, equestrian events and highland games were considered locally important events, that can bring the community together and which stimulate high levels of volunteering. Often the estates / farms host these events, providing community and visitor access to their land.
Most of the communities explained how residents use the privately owned land for recreational access whether fragmented or not, although there were some focus group complaints about barriers being erected on private estate roads. A wide range of recreation activities and events were mentioned across the case studies, including: bowling, golf, football, rugby; informal walking and cycling; boating; fishing; festivals; shows; highland games; informal camping; dog walking, etc. In 1b, there were concerns that a consequence of the rapid expansion of the town is that there is limited green space for recreation activities / space for children to play.
Environment
In all case studies, the focus group participants felt that the local environment and landscapes had not changed considerably, in nature, over the last 50 years, and that where it had (2b, 3a) this was due to forestry planting or housing development (1a and 1b). It was considered in case study areas 1 and 2 (where there is better-quality farmland) that the long-term intensification of agriculture has resulted in farm landscape changes through changed cropping patterns, and emphasis on silage production in livestock areas. The recent de-coupling of agricultural payments, increased support for environmental measures, and greater (or threatened) environmental regulation has increased land mangers‟ recognition of the potential pollution effects from their activities and is reported to have led to changing local land management practices. At a landscape scale, removal of stane dykes (1b), the erection of feed stores and processing buildings (2a), alongside new-build housing (all), were noted as having impacts. In 3a some respondents felt that that the local community had little say in local land use decisions due to the control that the estate had over large amounts of the locality.

57
Public Benefits from Environment
Figure 19 Agricultural land use 1982-2012
Using data from the June Agricultural Census (JAC)45, Figure 19 shows how agricultural land is used in each of the case studies. This reveals broadly similar land uses within the case study pairs. In case study pair 1, about 30% to 40% of the farmland is used for cropping, with 40% to 45% used for pasture and a relatively small proportion of
rough grazing (with some recent planting of farm woodland in the rough grazing area). In case study pair 2, there is very little cropping land with about 45% to 50% of farmland used as pasture and 50% to 60% as rough grazing. Paired case study 3 is largely dominated by rough grazing, with only small amounts of pasture and cropping land.
Feedback from the focus groups revealed few changes to farming systems in the mountainous case studies (case study pair 3), where the focus remains on beef and sheep production, albeit under more mechanised systems than in the past. However, in paired case study 1 there have been more significant changes, particularly to the types of crops grown (e.g. moves out of potatoes and turnips, winter barley introduced) and changed emphasis towards crops from cattle as a result of the introduction of CAP in the 1970s and the switch of dairy farms to beef. In case study pair 2, there has also been some switching from dairy to beef whilst the remaining dairy farms have significantly specialised and intensified, with greater stocking densities: on some farms indoor feeding means increased silage cutting, whilst on others grazing-based systems has required on-farm infrastructure investment.
Analysis of agri-environmental payments undertaken for the Ex-post Evaluation of the Scotland Rural Development Programme (2000-2006) was reassessed to reveal agri-environmental scheme (Environmentally Sensitive Area (ESA) Scheme, the Farm Woodland Premium Scheme and the Rural Stewardship Scheme) uptake46 in each case study.47 Table 9 shows the
45
Data provided by The Scottish Government‟s Agricultural Census Agricultural Census Analysis Team of Rural and Environment Science and Analytical Services. 46
There was very limited uptake of Countryside Premium Scheme, Farm Business Development Scheme and Farm Woodland Scheme. 47
http://ec.europa.eu/agriculture/rur/countries/uk/scot/ex_post_en.pdf

58
average annual number of payments and amount paid over the life of the Scotland Rural Development Programme (2000-2006) for various schemes.
Table 9 Agri-environment scheme claimants and payments, 2000-2006
Case Study
Annual Average 2000-2006
Environmentally Sensitive Area
Farm Woodland Premium Scheme
Rural Stewardship Scheme
Annual Total Claimants Annual Total Claimants Annual Total
Claimants
1a - Unfragmented N/A N/A £27,550 3.4
1b - Fragmented N/A N/A £717 1.7 £6,114 3.0
2a - Unfragmented £39,274 8.6 £24,741 9.0
2b - Fragmented £16,348 2.2 £1,821 2.2 £9,456 3.7
3a - Unfragmented £72,452 13.4 £10,249 5.5 £46,487 6.2
3b - Fragmented £85,939 19.2 £5,474 5.5 £11,610 4.5
Focus group participants suggested that farming has become much more environmentally aware than in the past, and whilst participation in agri-environmental schemes can benefit farm profitability, farmers increasingly understand the intrinsic (i.e. non- monetary) importance of protecting / enhancing habitats and species. This drive, and changed societal interests in habitat and species protection, has meant that there are now more people engaged in land-based work with an environmental focus (3b) such as on environmental reserves, ranger services, etc.
Healthy environment
Table 10 shows the number and area of key environmental designations within each case study and these environmental designations may restrict land management practices to some extent.
As a relatively intensive agricultural area in case study pair 1, it is perhaps unsurprising that very little land is so designated. In case study 2a there is a higher proportion of the land (31%) designated as a Special Site of Scientific Interest (SSSI) and Special Protection Area (SPA) than in its paired case study 2b (4% SSSI and only 2.5% Special Area of Conservation (SAC)) due, in part, to the former having more upland (rough grazing) habitats. Both case studies 3a and 3b have a number of environmental designations, e.g. 21 SSSIs covering nearly 20% of 3a and 8 SSSIs covering 15% of the land in 3b. Without further investigation into the condition of individual designated areas, it is difficult to make conclusions about the impact of land ownership scale, fragmentation, or historic land management practices on environmental designations (and hence condition) of the land in the case studies.

59
Table 10 Proportion of case study covered by selected environmental designations,
201448
Case Study Designation
SSSI SAC SPA
1a- Unfragmented 0.4% (1) - - 1b - Fragmented - - -
2a - Unfragmented 31.5% (3) - 31.3% (2) 2b - Fragmented 4.4% (1) 2.5% (3) -
3a - Unfragmented 19.2%(21) 22.2%(5) 39.1%(3) 3b - Fragmented 15.1%(8) 22.7% (2) -
Using SEPA‟s interactive River Basin Management Planning website49, water quality was assessed for each case study, as shown in Table 11. It should be noted that water body condition is influenced by a number of factors, and that water abstractions and flow regulations for renewable energy companies have an influence on status, particularly in case study pair 3, whereas in the more intensively farmed case study pairs 1 and 2 diffuse pollution is the primary cause of a „less than good‟ water body classification. With so few observations, it is difficult to derive any conclusions, but in both case study areas 1 and 2 the fragmented case studies have marginally higher water quality.
Table 11 Water bodies classified as less than good, 2015
Loch River Case Study Less than good Total Less than good Total
1a - Unfragmented 1 1 6 6 1b - Fragmented 0 0 2 3
2a - Unfragmented 3 3 6 8 2b - Fragmented 2 2 4 8
3a - Unfragmented 1 6 12 28 3b - Fragmented 0 3 12 21
While the development investment in case studies was generally considered by focus groups as positive (e.g. creating jobs, enhancing the local built environment), concerns were raised about potential new developments having a negative environmental impact (3b, 1a, 1b), and, in particular, issues around sewerage service provision had been a restricting factor for some housing developments (1a, 1b). The sewerage (and industrial effluent) problem in 1b had led to pollution problems in a local loch, and to regulatory restrictions until the problem was resolved.
48
Data source: extracted from SNH datasets. © Scottish Natural Heritage. Contains Ordnance Survey data © Crown copyright and database right (2016) 49
http://gis.sepa.org.uk/rbmp/Data_Download.aspx# data extracted January 2016
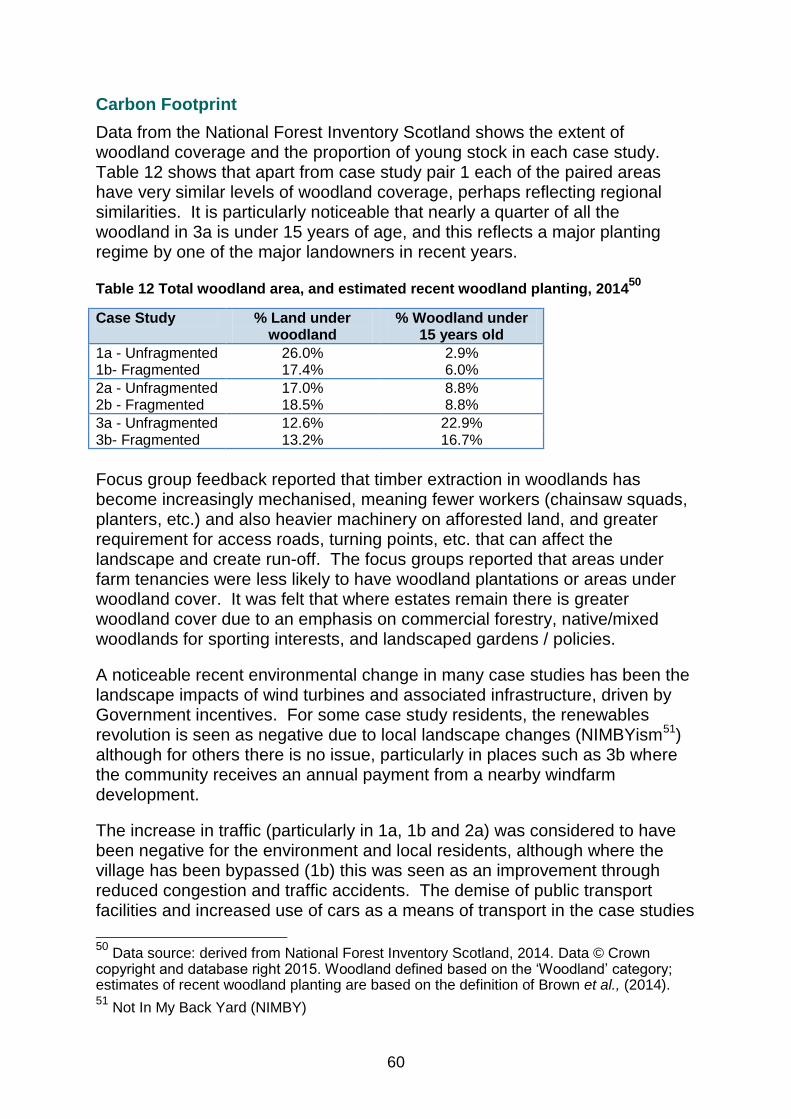
60
Carbon Footprint
Data from the National Forest Inventory Scotland shows the extent of woodland coverage and the proportion of young stock in each case study. Table 12 shows that apart from case study pair 1 each of the paired areas have very similar levels of woodland coverage, perhaps reflecting regional similarities. It is particularly noticeable that nearly a quarter of all the woodland in 3a is under 15 years of age, and this reflects a major planting regime by one of the major landowners in recent years.
Table 12 Total woodland area, and estimated recent woodland planting, 201450
Case Study % Land under woodland
% Woodland under 15 years old
1a - Unfragmented 26.0% 2.9% 1b- Fragmented 17.4% 6.0%
2a - Unfragmented 17.0% 8.8% 2b - Fragmented 18.5% 8.8%
3a - Unfragmented 12.6% 22.9% 3b- Fragmented 13.2% 16.7%
Focus group feedback reported that timber extraction in woodlands has become increasingly mechanised, meaning fewer workers (chainsaw squads, planters, etc.) and also heavier machinery on afforested land, and greater requirement for access roads, turning points, etc. that can affect the landscape and create run-off. The focus groups reported that areas under farm tenancies were less likely to have woodland plantations or areas under woodland cover. It was felt that where estates remain there is greater woodland cover due to an emphasis on commercial forestry, native/mixed woodlands for sporting interests, and landscaped gardens / policies.
A noticeable recent environmental change in many case studies has been the landscape impacts of wind turbines and associated infrastructure, driven by Government incentives. For some case study residents, the renewables revolution is seen as negative due to local landscape changes (NIMBYism51) although for others there is no issue, particularly in places such as 3b where the community receives an annual payment from a nearby windfarm development.
The increase in traffic (particularly in 1a, 1b and 2a) was considered to have been negative for the environment and local residents, although where the village has been bypassed (1b) this was seen as an improvement through reduced congestion and traffic accidents. The demise of public transport facilities and increased use of cars as a means of transport in the case studies
50
Data source: derived from National Forest Inventory Scotland, 2014. Data © Crown copyright and database right 2015. Woodland defined based on the „Woodland‟ category; estimates of recent woodland planting are based on the definition of Brown et al., (2014). 51
Not In My Back Yard (NIMBY)
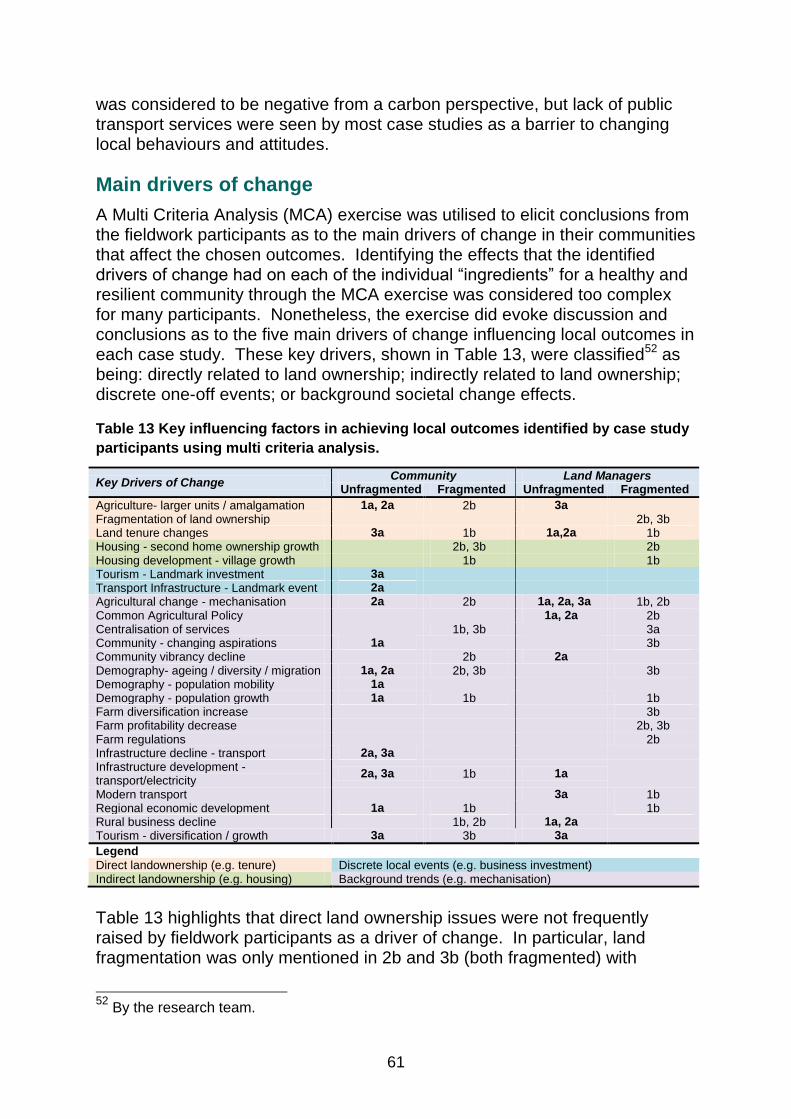
61
was considered to be negative from a carbon perspective, but lack of public transport services were seen by most case studies as a barrier to changing local behaviours and attitudes.
Main drivers of change
A Multi Criteria Analysis (MCA) exercise was utilised to elicit conclusions from the fieldwork participants as to the main drivers of change in their communities that affect the chosen outcomes. Identifying the effects that the identified drivers of change had on each of the individual “ingredients” for a healthy and resilient community through the MCA exercise was considered too complex for many participants. Nonetheless, the exercise did evoke discussion and conclusions as to the five main drivers of change influencing local outcomes in each case study. These key drivers, shown in Table 13, were classified52 as being: directly related to land ownership; indirectly related to land ownership; discrete one-off events; or background societal change effects.
Table 13 Key influencing factors in achieving local outcomes identified by case study
participants using multi criteria analysis.
Key Drivers of Change Community Land Managers
Unfragmented Fragmented Unfragmented Fragmented
Agriculture- larger units / amalgamation 1a, 2a 2b 3a
Fragmentation of land ownership
2b, 3b Land tenure changes 3a 1b 1a,2a 1b Housing - second home ownership growth
2b, 3b
2b
Housing development - village growth
1b
1b Tourism - Landmark investment 3a
Transport Infrastructure - Landmark event 2a
Agricultural change - mechanisation 2a 2b 1a, 2a, 3a 1b, 2b Common Agricultural Policy
1a, 2a 2b
Centralisation of services
1b, 3b
3a Community - changing aspirations 1a
3b
Community vibrancy decline
2b 2a
Demography- ageing / diversity / migration 1a, 2a 2b, 3b
3b Demography - population mobility 1a
Demography - population growth 1a 1b
1b
Farm diversification increase
3b Farm profitability decrease
2b, 3b
Farm regulations
2b Infrastructure decline - transport 2a, 3a
Infrastructure development - transport/electricity
2a, 3a 1b 1a
Modern transport
3a 1b Regional economic development 1a 1b
1b
Rural business decline
1b, 2b 1a, 2a
Tourism - diversification / growth 3a 3b 3a
Legend
Direct landownership (e.g. tenure) Discrete local events (e.g. business investment) Indirect landownership (e.g. housing) Background trends (e.g. mechanisation)
Table 13 highlights that direct land ownership issues were not frequently raised by fieldwork participants as a driver of change. In particular, land fragmentation was only mentioned in 2b and 3b (both fragmented) with
52
By the research team.
62
changes in land tenure arrangements and amalgamation of units (including all of the unfragmented case studies, 1a, 2a, 3a) being seen as a driver of change. Indirect land ownership drivers, through second home ownership (remote: 2b, 3b) or housing development (accessible: 1b), were prevalent as perceived drivers of change in each of the fragmented case studies. There were very few discrete local events that were considered important drivers of change, but, where these had occurred, the impacts were considered to be quite significant. The majority of the drivers of change identified were therefore general societal changes, such as mechanisation of farming and forestry, CAP support, demographic change, and infrastructural developments. It was particularly interesting that the community focus groups did not consider the background farm-level drivers (e.g. CAP, farm profitability) as important drivers of change in the wider community, suggesting that they now consider agriculture to be peripheral to community success.
63
Conclusions Land ownership scale is one of a myriad of factors that influence the economic, social and environmental development of rural communities. The complexity of ownership motivations, societal, policy and economic interactions in driving community development means that it is too complex to conclude that scale of land ownership is a significant factor in the sustainable development of communities.
The influence of landownership scale
A mix of policy (e.g. taxation, CAP, land use planning), economic (e.g. returns to land, industrial/business performance, recessions, depreciation) and social (owner objectives, demographic change, community aspirations) factors combine in unique ways for each landowner that can lead to the maintenance of scale of ownership or drive fragmentation. This mix of landowner motivations alongside the multitude of other factors driving change mean that it is too complex to disaggregate land ownership scale effects in the determination of local outcomes. That said, in some case studies land ownership scale was seen as enabling owners an element of control over some outcomes (environment, land use, housing, etc.), and that ownership change and fragmentation offered opportunities to a number of existing farm tenants to develop their business further.
However, even where fragmentation had occurred, the current owners of farms in one case study (E4) could not conclude that the ownership change and fragmentation had actually led to positive outcomes for the wider rural communities in their area, despite the clear individual benefits derived with fragmentation of land ownership being described as the most important driver of change from their families‟ perspectives.
Historic fragmentation of large land holdings generally resulted in the emergence of a wide range of sizes of land holdings, from houses with a small paddock to small estates. As agriculture has become increasingly mechanised and businesses have sought economies of scale, evidence from the fieldwork suggests that, as within the tenancy sector, there has been considerable (re)amalgamation of units in the last 50 years.
The quantitative data does suggest that there is currently greater agricultural intensity in those case studies where fragmentation occurred, but this needs to be interpreted cautiously since agricultural performance is determined by a multitude of factors and standard (average) output coefficients may over-estimate (e.g. for smaller farms) or under-estimate (e.g. for larger farms) actual output levels.
June Agricultural Census data also suggests that there are many more minor holdings in existence in the fragmented case studies compared to the

64
unfragmented case studies. However, caution is required as these figures are heavily influenced by case study 1b where a high number of privately owned small holdings were created from the main estate break up in the early part of the 20th century, and its accessible to a major urban area and has witnessed high demand for land and housing from an influx of commuters over the last 40 years.
The quantitative data also suggests that there has been greater population growth in the case studies where fragmentation occurred, but the influence of land ownership on population growth is unlikely to be simple or direct. Population growth reflects both employment and housing opportunities, and is reliant not only on the release of land for development but also on existing residents' and planning authorities' willingness to accept developments. Moreover, general declines in land-based employment means that job creation to retain and/or attract residents is more likely to be driven by business (or public sector) developments not reliant on land per se and/or by developments in (and good transport connections to) nearby urban areas. Hence, again, more detailed information on places of work and occupation of residents would be required to arrive at any firm conclusions on the effect of land ownership scale.
In the last 20 years, there has been considerable rhetoric about the scale of land ownership and how it may impact on the development of local communities. Overall, the evidence suggests that scale of land ownership, and land ownership change, can have an influence on the sustainable development of rural communities, but that it is only one of many drivers of change.
Drivers of Change
This research has highlighted that changes to scale of land ownership is only one of a complex set of interacting factors that drive change in the social, economic and environmental development of rural communities. There was a wide range of land ownership scales and degrees of land ownership fragmentation within the selected case studies and different local community development pathways that have resulted in quite different local sustainable development outcomes. Whilst it therefore may be tempting to conclude that the different local outcomes were related to land ownership factors, the research findings confirm that it is the interactions of other factors (as per the “Other Factors Framework”) that have a very strong bearing on local development.
The key historical (and current) forces of change in the case studies were often reported by participants as not being directly related to land ownership, instead being driven by a range of general socio-economic factors: regional economic growth, mechanisation, reduced land based workforce, mobility of people, housing developments, tourism growth, infrastructure,

65
communications, commuters, second homes, ageing populations, improved standards of living, etc.
Economic Change
The quality of communication networks was acknowledged to be vitally important, with poor transport linkages and slow broadband speeds commonly cited as hampering realisation of business aspirations. Where communications networks had been upgraded, they were credited with encouraging development, although relief roads to reduce local congestion could also reduce passing trade. Historically, the arrival of mains electricity was recalled as transformative. Similarly, renewable energy projects – hydro schemes in the past, wind farms more recently – were viewed as bringing jobs and revenue streams to local communities.
Other large-scale developments were also recalled as positive influences on businesses, jobs and working populations, for example military bases, mines, factories and port facilities – although if such enterprises closed the subsequent loss of jobs (some well-paid, high-quality, others less so) was difficult to recover from. The presence of large-scale employers was also acknowledged to raise potential problems of integration of employees with the local community.
Land-based businesses, particularly farms, were acutely aware of the direct influence of public-sector activities on business viability, for example reliance on the CAP and its domestic predecessors in terms of support payments and capital grants, or the role of the Forestry Commission in establishing and maintaining tree planting. The negative effect on employment of mechanisation in both agriculture and forestry was acknowledged, but accepted as necessary for competitiveness. Similar views were expressed about the increasing use of contractors for land-based work, by estate owners and smaller businesses alike.
Other businesses and wider community interests occasionally acknowledged land-based policy influences (including renewable energy), but more commonly focused on other public policy spheres. In particular, centralisation of health and education services was perceived as illustrative of local authorities‟ lack of understanding of rural needs and to be undermining long-term economic viability of some communities by limiting the attractiveness of living and working in such areas. The influence of policies on communications and other infrastructure was also mentioned.
The rise of supermarkets and, more recently, internet shopping was also widely viewed as a negative influence. Many local retailers had closed, compounding the loss of public services, with knock-on effects for local employment. Where retailers were still present, this was in some cases attributable to overall population growth through significant in-migration
66
(facilitated by road connections supporting commuting), or to serving tourism markets.
More generally, tourism was identified as a major contributor to economic development, offsetting declining employment in primary sectors. However, there was recognition that many tourism-related jobs are relatively low-skill and low-pay. Moreover, many are filled by non-local workers travelling in to work and/or staying in staff accommodation, and therefore not becoming part of the local community. Similar sentiments were expressed about the participation of tourists in community events, with a shift to high-end tourism apparently exacerbating this relative to previous eras. Some large landowners have actively supported tourism activities, either directly or through encouraging tenants to diversify.
Separately, whilst tourists were acknowledged to helpfully boost demand for various types of local business, the impact of tourism accommodation on local housing and land markets was noted. In particular, the diversion of scarce housing for self-catering and/or second-home purposes was viewed as a significant impediment to retaining an active local population. In some cases, expansion by large accommodation providers (e.g. hotels, caravan parks) was out-competing aspiring locals seeking affordable housing or even housing plots. Where large landowners had resisted opportunities to enter into tourism accommodation or to sell properties for second homes, the retention of affordable rented housing was appreciated, and had helped to keep local working populations. A scarcity of affordable housing or housing plots was also attributed to (semi-urban) local authorities lacking an understanding of rural needs and failing to engage with locals – although the cost of servicing rural plots was also acknowledged to be high.
Land-based businesses referred more spontaneously to land tenure issues and to the possible effects of ownership scales, both in terms of the trend over time towards increased enterprise size and also landlord-tenant relationships. The availability of land to rent or buy for farm expansion was seen as a constraint on expansion, and some landlords were perceived to discourage diversification and to under-invest in capital improvements. However, other landlords were praised for seeking to support tenants and the wider community in realising development opportunities. In several cases, key individuals, including estate landlords but also other property-owning entrepreneurs and professionals, were perceived as exerting significant influence over local development through their control of key plots of land and access to capital plus established networking relationships and familiarity with the planning system.
Societal Change
As with the economy, described social changes across the case study parishes were attributed to a mix of discrete local events and more diffuse
67
trends. For example, the loss of public transport (e.g. trains, buses), the closure of local shops (e.g. post office, grocers) and services (e.g. school, banks, doctors) were commonly cited as identifiable events weakening community vitality. Equally, wider trends such as declining church attendances, increasing car ownership (with tighter drink-driving laws) and greater reliance on multimedia entertainment were also commonly cited as negative influences on community cohesion and participation, as people had many more social alternatives than in the past.
Such factors were generally regarded as making rural areas less attractive to live and work in, contributing to declining and ageing rural populations. Conversely, the advent of mobile phone and broadband coverage was viewed as supporting community developments. Equally, improved local recreational opportunities and funding derived from an increasing variety of tourism/heritage projects plus from renewable energy developments were also viewed positively. Where populations had grown through in-migration, community cohesion was typically perceived by participants to have declined, although similar historical episodes were cited as evidence that this was not necessarily only a recent or current phenomenon. Notwithstanding often rather gloomy perspectives from fieldwork participants, the dramatic increase in living standards over the past 50 years was acknowledged. It is acknowledged that historical focus of the research led to sampling bias in the fieldwork participants - towards the older, longer term residents. These participants were therefore more likely to have positive memories of the past and be negative towards changes that have occurred than if there were more younger people and new residents participating.
Patterns of land ownership were not generally regarded as significant in determining social outcomes relative to other factors. However, two influences were identified. First, in some cases, large landowners played an active community role through support for and participation in local projects and events (e.g. funding of some community activities and provision of land for agricultural shows). Second, the right-to-buy policy for local authority housing and the sale of former agricultural/estate houses for private ownership were commonly perceived as reducing the availability of affordable housing in many areas, with second-home ownership further undermining the ability of rural workers to reside locally.
Environmental Change
Whereas reported economic and social developments comprised a mix of positive and negative changes, environmental changes were more uniformly perceived as improvements. For example, woodland planting and increased conservation/heritage activities were generally welcomed. Environmental designations, aspects of the CAP, and forestry grants and taxes were identified as key drivers of such changes, although the role of earlier incarnations of the CAP in removing dykes and hedges was also noted.
68
Infrastructure instalments (e.g. renewable energy, pylons) were acknowledged as impairing some landscapes, as were natural disasters such as widespread (storm) wind-throw of woodland and moorland fires. The renovation (or removal) of disused farm buildings was viewed as enhancing landscapes. The arrival of mains water, street lighting and traffic-calming measures were viewed as enhancing environmental health.
Land ownership was mentioned only infrequently in relation to environmental quality, noting the potential for large landowners to coordinate across wider areas but also for absentee landlords to neglect some aspects of land management.
Methodological considerations
The methodological approach developed through this research has proven that each of the frameworks (case study selection, outcomes and other factors) can be used as tools to assess sustainable development pathways and outcomes in comparative studies of rural areas. Whilst this study focused on six case study parishes under private land ownership it was specified that the project should not examine community or crofting ownership of land, thereby excluding large parts of the Highlands and Islands of Scotland. However, there is scope to extend the methodology to examine differences in local outcomes from different ownership types (private, community, crofting, charity, etc.), across different models of estate based land management (new conservation based model versus traditional sporting and mixed estates) or across different geographies (e.g. local authorities, Local Action Groups).
Whilst requiring some background knowledge of estate ownership and geography the utilisation of GIS in the case study selection process enabled an impartial and scientific approach to arrive at pairs of case studies that were broadly comparable physically but had different land ownership patterns.
In addition, the other frameworks developed describe the types of economic, social and environmental outcomes characterising sustainable rural development and identify factors other than land ownership that also affect development. Whilst the process of collating historical information was often problematic (due to boundary changes, data consistency and data availability) and the processes of recruiting case study participants (with latent knowledge of change factors) difficult, the methodical approach worked well in enabling comparative analysis of the case studies.
There is scope to use the methodology in longer term studies to monitor the effects of changing scale of land ownership on the development pathway of local communities. A baseline position could be established for areas under control of large landowners where fragmentation is occurring, or has recently occurred, with replicates of the study conducted every five years to monitor longer term changes associated with fragmentation. Indeed this approach

69
need not be limited to where land ownership fragmentation occurs but could be used to assess any major change in a location that is predicted to have major social, economic or environmental outcomes (e.g. road by-pass, establishment or closure of major employers, housing developments, land use change).

70
Appendix 1: Policy factors (1900-1980) and
policy timeline (1900-2014) affecting
Scottish land ownership
Policy Factors53
Pre-First World War
Following repeal of the Corn Laws and the “Golden Age” of agriculture in the mid-19th century, agricultural depression prompted government efforts to strengthen farm tenants‟ rights but also to make it easier for ownership to change by simplifying the legal processes for selling land (thereby greatly reducing legal costs) and relaxing the obligations to maintain existing family ownership of land. In addition, taxation of land ownership was increased before and after the turn of the century, most notably with the introduction of estate duty payable on an owner‟s death, a move widely interpreted as prompting the fragmentation of large land holdings and hence changes in ownership. Separately, and echoing the development of state-owned crofting estates54 some efforts were made to acquire and equip public smallholdings for rent outwith the Crofting Counties (of Argyll, Caithness, Inverness, Ross & Cromarty, Sutherland, Orkney and Shetland).
The First World War and the 1920s
Reliance on agricultural imports under a laissez faire trade policy left the UK exposed to food shortage risks at the outbreak of the First World War, and led to overt government intervention in agriculture to increase production. This took the form of compulsory expansion and improvement of cultivated areas coupled with guaranteed prices, leading to a surge in agricultural prosperity and land values for the first time in several decades. Many landowners sought to realise sudden capital gains, with a reduced agricultural rate of Estate Duty and capped rent rises providing further motivation to sell land. Tenants wishing to continue farming in situ were often faced with no choice other than to purchase farmland when their landlord sold, with changes to the tax assessment of tenants‟ income also favouring a switch to owner-
53
A number of key references were drawn upon throughout the policy review, notably: Leneman (1989); Tracy (1989); Lloyd (1992); Northfield (1979); SNH (2009); Scottish Affairs Committee (2014 and 2015); Land Reform Review Group (2014); Thomson et al., (2014). To maintain the narrative flow, only a few pieces of legislation are named explicitly and, given the complexity of the subject, no attempt was made to quantify influences, merely to identify them. 54
This process followed the establishment of the Congested Districts Board and was continued by the Board (later Department) of Agriculture for Scotland established in 1912 (Hunter, 2013).

71
occupation: this marks the beginning of the shift away from a predominantly tenant farming which has continued to the present day (Thomson et al., 2014).
The abrupt abandonment of guaranteed prices (the “great betrayal”) via the Corn Production (Repeal) Act of 1921 ushered in another prolonged agricultural depression and an enduring distrust of government amongst landowners and farmers. Tenants‟ rights were further strengthened, exemption (initially partial, and then complete) was granted from paying business rates, and product Marketing Boards (e.g. for milk) were introduced, but agriculture remained depressed until the onset of World War Two.
Separately, explicit support for farmland ownership rather than renting was provided in the form of favourable credit for the improvement and purchase of agricultural land, although the Board of Agriculture also used Treasury funding to expand pre-war actions to directly purchase and equip smallholdings to rent to (particularly) returning servicemen through the Land Settlement (Scotland) Act 1919. State-ownership of land was extended more significantly through creation of the Forestry Commission in 1919 (with some land used to create smallholdings, later more often just housing, for rent).
The Second World War and the Immediate Post-War Years
War-time intervention in agriculture was again a combination of direct control by government together with a range of guaranteed prices, livestock headage payments and capital grants (e.g. for land conversion to arable, fertiliser applications and drainage) intended to increase production. These measures were subsequently enshrined in the 1947 Agriculture Act, and, although there was some evolution of specific measures, essentially defined British agricultural policy until the 1970s.
As agricultural prosperity rose, so did land values – prompting some landowners to realise capital gains and (despite some regulatory controls on land speculation) some external investors to move into farmland as an asset class. The latter were also encouraged by depressed real returns on other assets (e.g. equities and gilts) plus generous tax allowances for maintenance costs and capital expenditure as well as tax-free capital gains on land improvement. Tenants‟ rights and freedoms were again strengthened, notably in terms of rent reviews and security of tenure – both of which contributed to the emergence of the vacant possession premium55 and helped sitting-tenants to buy farms with credit secured against an asset that would immediately gain in capital value, further reinforcing the decline in tenanted land.
Separately, the 1947 Town and Country Planning (Scotland) Act established the foundation of modern land use planning policy, breaking with the previous tradition of ownership alone effectively determining development rights (earlier
55
Where land sold as vacant attracted a considerable purchase price premium compared to sales with a sitting (secure) tenant.

72
attempts at development zoning had been little used since local authorities were required to compensate landowners for constraints). A Development Gains Tax was introduced on windfall gains arising from the granting of planning permission, but various tax reliefs were available in relation to farmland. The National Parks and Access to the Countryside Act 1949 introduced powers to acquire and manage public land to create National Nature Reserves (NNRs), to be exercised by the Countryside Commission for Scotland (later the Nature Conservancy Council Scotland and then Scottish Natural Heritage).
The 1950s, 1960s and 1970s
The lower agricultural rate of Estate Duty introduced after World War I was confirmed in 1949 at 45% of the normal rate. This resulted in capital switching from other assets into farmland, a trend reinforced in the 1960s by changes to the obligations on investment trustees regarding their ownership of different asset classes, leading to increased interest in land ownership by a range of financial institutions. Capital Gains Tax was introduced in the 1960s, partly with the intention of capturing an element of land speculation windfalls. However, a number of reliefs were available in relation to land, including roll-over relief which can inflate land values by recycling development gains back into farmland. Primogeniture was abolished as the basis for inheritance in 1964.
UK accession to the European Community and adoption of the Common Agricultural Policy (CAP) in 1973 coincided with high rates of inflation, volatile global markets for agricultural commodities, an oil crisis, and poor returns on other asset classes. Agriculture initially prospered, and land values rose sharply as individuals and institutions sought to acquire land. But in 1974 the boom ended abruptly, and land prices fell rapidly as (particularly) institutions divested themselves of recently acquired farmland, much of it tenanted. Yet demand for farmland recovered and by the end of the decade land values reached boom levels again.
Perceived loopholes in and widespread (legal) avoidance of Estate Duty prompted its replacement with a Capital Transfer Tax in the mid-1970s, initially including abandonment of agricultural reliefs. Ultimately however these reliefs were retained, albeit confined to “active farmers” in the form of Agricultural (and Business) Relief and thus not available to landlords (unlike Estate Duty reliefs). This change contributed to landlords seeking to take land in hand or otherwise to qualify as active farmers through (e.g.) partnership arrangements with tenants. In addition, echoing the earlier Development Gains Tax, a Development Land Tax was introduced in 1976 specifically to capture a share of windfall gains from non-agricultural developments on former farmland. This was levied at 60%-80% and attracted no roll-over relief.

73
Separately, the policy of encouraging local government to acquire and equip land for smallholdings had quietly petered out by the 1950s (In England, it had effectively ended before 1930), partly due to pressure on funding but also recognition that the trend of rising farm size56 was rendering small holdings uneconomic and was leading to wide-spread absenteeism of tenants (often family successors of the original tenants). In the 1970s, smallholder tenants on public land (including Forestry Commission land) were given the right-to-buy at a discount relative to the market value. Many took up this opportunity, but subsequently sold on again - thereby shifting ownership from public to private hands unrelated to previous tenants.
Policy influences in the 1980s and 1990s
At the start of the 1980s the Capital Transfer Tax, was extended to agricultural landlords, but was subsequently abolished in the mid-1980s, to be replaced by Inheritance Tax – effectively recreating the earlier Estate Duty and its options for (legal) avoidance via tax planning. Development Gains Tax was abolished in the mid-1980s, with farmland sales once again subject to (lower) Capital Gains Tax with various reliefs. However, food surpluses (e.g. “butter mountains”) and budgetary pressures were forcing a shift in the way the Common Agricultural Policy (CAP) operated, causing uncertainty during the 1980s over how guaranteed prices would be set and how production quotas would operate. This led to expectations of lower returns to farming plus lower rates of capital gains, and demand for farmland eased as investment interests turned elsewhere (including more favourably taxed forestry, although scope for gaining advantage by switching between tax schedules was removed in 1988). The existing exemption from business rates for agricultural land was extended to sporting estates in the mid-1990s.
An urban property boom in the late 1980s maintained farmland prices for small holdings, particularly in accessible areas. Similarly, roll-over relief from development sales underpinned land markets in some areas. However, farmland values dipped again in the 1990s as the economy moved into recession, the property boom ended, and the nature of CAP support began to change significantly. Ownership and management of NNRs was extended to “approved bodies” – Non-Governmental Organisations such as the National Trust for Scotland and Royal Society for the Protection of Birds Scotland - acting under concordats with Scottish Natural Heritage (SNH) and agri-environmental measures, such as Environmentally Sensitive Areas, became more commonplace.
56
Reflecting rising incomes in the economy more generally, but also economies of scale driven by technological change which itself was promoted by government in terms of R&D expenditure, advisory services and grant aid.

74
Policy influences since 2000
Since 2000, the CAP evolved radically, with a series of successive reforms (the latest in 2014) marking a switch away from “coupled” payments linked to output production towards (Pillar I) “decoupled” payments linked only to land area but subject to various land management compliance requirements. This switch was accompanied by (Pillar II) grants to support a range of rural development policy objectives, including agricultural modernisation but also agri-environmental improvements and rural community development. At the same time, other regulatory constraints emerged in relation to the environment, for example under the Nitrates and Water Framework Directives but also in relation to, for example, landowners‟ health and safety obligations and public liability responsibilities. Consequently, farming has had to adjust to a range of different (multi-functional) societal demands for non-market goods and services at the same time as becoming more market-orientated in terms of commodity production. Unsurprisingly, many farms are under financial pressure, and more structural change is anticipated.
However, at the present time, demand for farmland and sporting estates remains high, and values are at record levels, reflecting both an eagerness amongst existing farmers to expand as-and-when neighbouring land becomes available, and external interests seeking tax-efficient and/or lifestyle investments. The financial crash of 2008 led to some land sales (e.g. of the Co-operative Group farms), but persistently low interest rates and low economic growth have maintained demand for land. Given the relatively slow turnover of farmland and the levels of profitability of agriculture, capital inflows from other sectors are more than sufficient to maintain high land values despite low agricultural returns. UK government plans to sell off large amounts of Forestry Commission land were aborted in 2010 in the face of public opposition, but promotion of renewable energy (particularly on-shore windfarms, and also small-scale hydroelectric schemes through the Renewable Obligation and the Feed-In Tariff) has introduced another policy dimension into rural land ownership issues.
Policy Timeline
1800s
Agricultural Holdings (Scotland) Act 1883 – introduced principles of security of tenure and tenants‟ rights to compensation for improvements made or damage incurred.
Finance Act 1894 – introduced Estate Duty, with sliding scale levying higher rates on greater wealth.
1900-1950
Finance Act 1907 – introduced differential treatment of earned and unearned income, including a surtax on farm rental income.
75
Small Landowners (Scotland) Act 1911 – facilitated the creation and equipping of smallholdings by the (new) Board of Agriculture on both public and private land (mirroring earlier Crofting legislation, but also 1907 legislation in England).
Defence of the Realm Act 1916 – gave Government powers to prescribe agricultural use of private land
Small Holding Colonies Acts 1916 – strengthened ambitions to create and equip smallholdings, primarily for returning military servicemen.
Corn Production Act 1917 – introduced guaranteed prices (via deficiency payments) for some arable crops but also prevented landlords increasing rents (plus, although not in Scotland, first introduced agricultural wages boards to set minimum wages).
Corn Production (Amendment) Act 1918 – reaffirmed Government powers previously established under the Defence of the Realm Act for directing agricultural use of private land.
Small Holding Colonies (Amendment) Act 1918 – increased the hectarage to be acquired for purposes of the Act.
Income Tax Act 1918 – increased farm tenants‟ liability for income tax from previous 1/3 of annual rent to twice annual rent.
Finance Act 1919 – introduced lower Estate Duty rates for agricultural land.
Forestry Act 1919 – created the Forestry Commission.
Land Settlement (Scotland) Act 1919 - strengthened compulsory purchase powers to promote aims of the Small Holding Colonies Acts 1916 and 1918
Agriculture Act 1920 – modified price guarantees under the Corn Production Act, with a four-year period of notice required if they were to end (also continued Government powers of prescribing agricultural land use).
Corn Production Acts (Repeal) Act 1921 – notwithstanding the supposed four-year period of notice required, abolished price guarantees with immediate effect although limited one-off compensation payments were made to farmers; ended Government prescriptions of agricultural land use (also abolished the wages boards).
Agricultural Holdings (Scotland) Act 1923 – further strengthened tenants‟ rights with respect to compensation for improvements made or damage incurred plus set-out dispute resolution procedures; made tenants‟ bequeathing of leases possible (subject to landlord agreement).
The Agricultural Credit Act of 1923 – introduced credit co-operatives to help finance the purchase and/or improvement of farmland
Finance Act 1925 – introduced higher Estate Duty rates.
The Rating and Valuation (Apportionment) Act 1928 –established basis for ratings reliefs, including for agriculture.
76
Agriculture Credits (Scotland) Act 1929 – established basis for an Agricultural Securities Corporation to provide soft loans to purchase and/or improve farmland.
Small Landholders and Agricultural Holdings (Scotland) Act 1931 – amendments to previous smallholder legislation.
Emergency Powers (Defence) Act 1939 – introduced Defence Regulations, including Government direction of production on private agricultural land and protection for farm tenants against eviction
Income Tax Act 1945 – introduced reliefs for maintenance of farmhouses and cottages
Town and Country Planning Act 1947 – removed owner‟s automatic right to develop land and introduced a Development Gains Tax on planning gain/betterment value.
Agriculture Act 1947 – established basis for guaranteed prices (via deficiency payments), headage payments, capital grants, advisory services and research and development funding.
Agriculture (Scotland) Act 1948 – further strengthened tenants‟ rights, clarified principles of good husbandry, amended Government powers to acquire/equip land and to offer soft loans.
Agricultural Holdings (Scotland) Act 1949 – consolidated parts of the Agricultural Holdings (Scotland) Act 1923, the Small Landholders and Agricultural Holdings (Scotland) Act 1931 and the Agriculture (Scotland) Act 1948; remained basis for tenancies until 1991, including principles of succession and security of tenure.
Finance Act 1949 – formalised Estate Duty for agricultural land at 45% of normal rate
National Parks and Access to the Countryside Act 1949 – introduced powers for public acquisition and management of land to create National Nature Reserves.
1950-2000
Valuation and Rating (Scotland) Act 1956 – formally removed agricultural land from the valuation roll
Land Drainage (Scotland) Act 1958 – introduced subsidised drainage of farmland
Trustee Investments Act 1961 – altered obligations on trustee in relation to choosing and acquiring different types of assets
Finance Act 1962 – introduced Capital Gains Tax
Succession (Scotland) Act 1964 – removed primogeniture as basis for inheritance.
The Countryside (Scotland) Act 1967 – gave Countryside Commission for Scotland powers to acquire land
1970s Forestry Commission policy of selling smallholdings and housing to tenants or incomers.

77
1970s Department of Agriculture and Fisheries, Scotland policy of selling smallholdings to tenants.
1973 UK accession to European Economic Community – switch of agricultural support from deficiency payments to intervention buying and tariff barriers.
Nature Conservancy Council Act 1973 – gave Nature Conservancy Council power to hold land
Finance Act 1975 – replaced Estate Duty with Capital Transfer Tax, favouring “active” farmers rather than landlords.
1975/6 Less Favoured Areas under CAP – defined disadvantaged land eligible for livestock headage payments.
Wildlife and Countryside Act 1981 – established “approved bodies” for holding NNRs
Agriculture Act 1986 – introduced Environmentally Sensitive Areas
Finance Act 1986 – replaced Capital Transfer Tax with Inheritance Tax, maintaining/reviving various agricultural reliefs.
Local Government Finance Act 1988 – reaffirmed agricultural exemptions from business rates
Finance Act 1988 – removed scope for switching schedules to avid tax on planting trees
Agricultural Holdings (Scotland) Act 1991 – introduced new, shorter duration tenancies plus pre-emptive right to buy for some tenants.
Natural Heritage (Scotland) Act 1991 – compulsory purchase powers granted to SNH
1992 MacSharry reform of CAP – reduction in guaranteed prices offset by introduction of direct payments (e.g. headage premia, with associated quotas) plus “accompanying measures” e.g. agri-environment schemes (although UK Environmentally Sensitive Areas and management agreements on designated sites pre-dated this).
Local Government (Scotland) Act 1994 – removed sporting estates from the valuation roll.
2000-present
2000 Agenda 2000 reforms of the CAP – formalisation of Pillar I and Pillar II structure of funding.
2003 Fischler reforms of CAP – decoupling of Pillar support and strengthening of Pillar II, introduction of cross-compliance.
Agricultural Holdings (Scotland) Act 2003 – introduced new, shorter duration tenancies, greater freedom to diversify and pre-emptive right to buy for some tenants.
Land Reform (Scotland) Act 2003 – abolished feudal tenure, introduced Community Right to Buy.
Nature Conservation (Scotland) Act 2004 – extended land acquisition (by agreement or compulsory purchase) to land of scientific interest, not just NNRs
78
The Public Services Reform (Agricultural Holdings) (Scotland) Order 2011 – amended lease duration and timing of conversions under the Agricultural Holdings (Scotland) Act 2003.
Agricultural Holdings (Amendment) (Scotland) Act 2012 – amended definitions of “near relative” and adjusted processes for rent reviews.
2013 CAP reform – obligatory move away from historic basis for decoupled payments, accompanied by splitting of funding between Basic and Green payment (also introduction of “active farming” criteria).
2014 Land Reform Review Group report – proposes more radical policy measures, including explicit constraints on landowner nationality and legal form plus limits to scale of ownership.
Community Empowerment (Scotland Act) 2015 – introduced a new right to buy for communities over neglected and derelict land, providing it is in the interest of achieving sustainable development.
Land Reform Bill (published June 2015) – setting out provisions for land reform including reintroduction of sporting rates, changes to agricultural holdings legislation, extension of community rights to buy to urban areas, powers to force sale if barrier to sustainable development, creation of a Scottish Land Reform Commission and Tenant Farming Commissioner, encouraging better information and greater transparency on the ownership of land, extension of the Scottish Land Fund, etc.
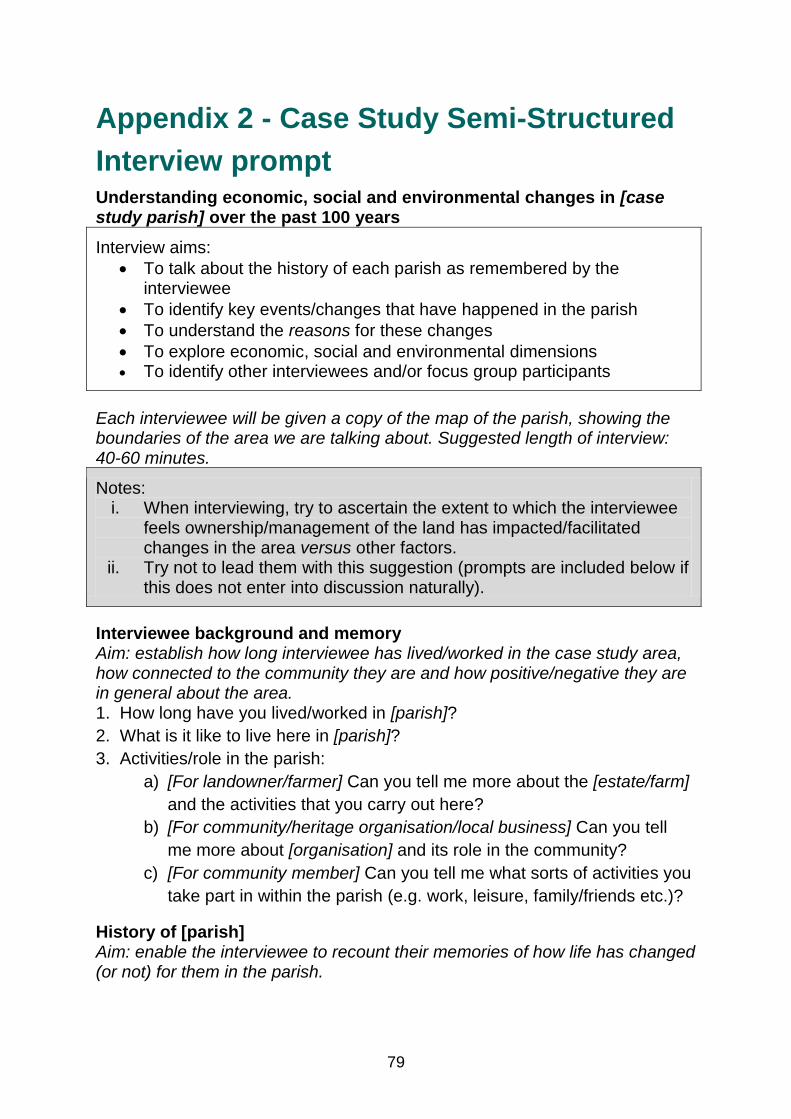
79
Appendix 2 - Case Study Semi-Structured
Interview prompt Understanding economic, social and environmental changes in [case study parish] over the past 100 years
Interview aims:
To talk about the history of each parish as remembered by the interviewee
To identify key events/changes that have happened in the parish
To understand the reasons for these changes
To explore economic, social and environmental dimensions To identify other interviewees and/or focus group participants
Each interviewee will be given a copy of the map of the parish, showing the boundaries of the area we are talking about. Suggested length of interview: 40-60 minutes.
Notes: i. When interviewing, try to ascertain the extent to which the interviewee
feels ownership/management of the land has impacted/facilitated changes in the area versus other factors.
ii. Try not to lead them with this suggestion (prompts are included below if this does not enter into discussion naturally).
Interviewee background and memory
Aim: establish how long interviewee has lived/worked in the case study area, how connected to the community they are and how positive/negative they are in general about the area. 1. How long have you lived/worked in [parish]?
2. What is it like to live here in [parish]?
3. Activities/role in the parish:
a) [For landowner/farmer] Can you tell me more about the [estate/farm]
and the activities that you carry out here?
b) [For community/heritage organisation/local business] Can you tell
me more about [organisation] and its role in the community?
c) [For community member] Can you tell me what sorts of activities you
take part in within the parish (e.g. work, leisure, family/friends etc.)?
History of [parish] Aim: enable the interviewee to recount their memories of how life has changed (or not) for them in the parish.

80
4. We would like to understand what things have changed in [parish] over the
past 100 years. You needn‟t think that far back but can you spend a few
minutes talking about your memories of the area when you moved here,
compared to now?
a) Do you feel that [parish] is a better or worse place to live/work now
than in the past?
Identifying key events and understanding why they happened 5. Can you pinpoint any particular changes/events in the time you have been
here (or before) that have led to positive changes in the local economy,
community or environment?
[Prompts: for example, a business setting up, changes to local services such as schools, changes in housing, infrastructure, new footpaths, etc. NB. Prompts can be tailored for each case study, based on profile data.]
6. Why do you think these positive changes happened?
[Prompts: for example, change in land ownership, change in funding, etc.]
a) [Only for landowner] Are any of these positive changes related
directly to the management of this estate?
7. Can you pinpoint any particular changes/events in the time you have been
here (or before) that have led to negative changes in the local economy,
community or environment?
[Prompts: for example, demographic change/community decline, changes in businesses, changes to local services such as schools, changes in housing, flooding, etc.]
8. Why do you think these negative changes happened?
[Prompts: for example, change in land ownership, change in funding, etc.]
a) [Only for landowner] Are any of these negative changes related
directly to the management of this estate?
Impacts of the changes on our outcomes Aim: to understand how these positive and negative changes impact on the ten outcomes we have identified. 9. We have identified nine „ingredients‟ that make a „healthy‟ and
„resilient/thriving‟ rural community. Thinking about the key events/changes
we‟ve just talked about, can you expand on how you think these changes
have impacted on any of these? [Prompts: see list below – use visual cards to help to jog people’s memories. Aim here is
to allow for some clarification of earlier points in relation to the ingredients and for
additional points to be added which are specific to the list below.]
Nine ingredients for a healthy and resilient/thriving community:

81
1. High-quality jobs 2. Successful businesses 3. Enough people 4. Good-quality, affordable homes 5. Opportunities for outdoor recreation [prompt: how much uptake of these
opportunities] 6. Community activities and spaces 7. Communication between different parts of the community [prompt: land
managers] 8. Healthy environment [prompts: clean water, healthy soils and biodiversity]
9. Reduced carbon footprint [prompts: energy usage, recycling]
Other contacts and follow-up 10. We are planning to invite a selection of community members, local
businesses and land managers to three separate focus groups to discuss
these changes in more detail. Would you be interested in attending the
[community/business/land manager] one?
11. Are there any other individuals in the community that you are aware of
that might be well-placed to discuss these topics in an interview, or as a
participant in a focus group?
[Let them know focus groups dates/times]

82
Appendix 3 – Focus Group Schedule Understanding economic, social and environmental changes in [case study parish] over the past 100 years Focus group length: 2 hours. Schedule NB. List of equipment/objectives can be found after the following table.
Time Duration Activity Steps
10.00 15 mins A: Orientation exercise
A1: Registration and tea/coffee (hand out consent form, feedback form, list of „ingredients‟ and MCA sheet) A2: Add post-it notes of „Top three changes in the parish in the last 50 years‟ to the wall
10.15 10 mins B: Project introduction
B1: Short PowerPoint presentation - introduce project and focus group aims, introduce nine „ingredients‟ for a healthy community (displayed on wall)
10.25 40 mins C: Timelines Q: What has happened in the parish? C1: Present and explain the timeline – blank sheet with graphs from data dotted around as prompts – will talk through economic, social and environmental changes (5 mins) C2: Facilitate discussion around the timeline – either facilitator adds post-it notes when suggestions are made, or participants welcome to add their own (35 mins)
11.05 15 mins D: Key changes
Q: What were the most important changes? D1: Identify and discuss the most important local changes that impacted on the nine ingredients for a healthy community (suggestions from the floor, listed on flip chart 15 mins)
11.15 10 mins Break
11.25 30 mins E: MCA exercise
Q: What have been the impacts of these changes? E1: Explain exercise – show on flip chart – participants fill in the five changes on their own sheet (10 mins) E2: Participants work individually to show direction and strength of change (20 mins)
11.55 5 mins F: Closing F1: Final questions F2: Outline of next steps and outputs (one slide max) F3: Feedback forms
Exercise objectives
A: Orientation exercise Participants meet each other and begin to discuss key events that have happened in the parish.
B: Project introduction Participants understand aims of the project and see an overview of data collected for the parish, including key changes identified in interviews. Present nine „ingredients‟ for a healthy/thriving community and the wider factors which may have influenced the community (other factors framework).
C: Timelines Timeline to help participants identify events that influenced economic,

83
environmental and social changes. Capture discussion that relates to how events and changes have influenced the ingredients for a healthy community.
D: Key changes Discuss links between the changes which emerged from Exercise C. Identify important events that have influenced the nine ingredients over time. Identify most significant local changes to be evaluated.
E: MCA exercise Understand how changes have influenced the nine „ingredients‟. Specific objectives: (i) evaluate relative influence of important changes on economic, social and environmental conditions (ingredients); (ii) assess how significant land ownership patterns have been relative to other events and changes; and (iii) record qualitative information as to why group/individuals evaluate impacts in the way they do.
Equipment required
A: Orientation exercise
Sign-up sheet
Large map of parish, large post-it notes, pens
B: Project introduction Laptop, projector and screen, presentation (max. 6 slides)
C: Timelines Timeline sheet
„Ingredients‟ to show on wall
Flip chart for facilitator to record discussion
Large post-it notes and pens
D: Key changes Flip chart paper and stand
E: MCA exercise Flip chart for demonstration
MCA exercise handouts
MCA matrix for wall
F: Closing Final outputs presentation (one slide max)
Feedback forms

84
Appendix 4 - Case Study Selection
Altitude / topography
Elevation statistics for each of the 31 option parishes were calculated from elevation data, and Figure 20 reveals the minimum, maximum, range and mean elevations by parish. The findings show broadly similarities between the parishes within each geographic set.
Figure 20: Elevation Statistics for Option Parishes - anonymised
Land Capability for Agriculture
The Macaulay Land Capability for Agriculture (LCA) classification57 was assessed for every parish using an improved hybrid LCA layer.58 The proportion of total land in each LCA category is provided for each parish in Figure 21, where:
LCA 1 is land capable of producing a very wide range of crops
LCA 2 is land capable of producing a wide range of crops
LCA 3 is land capable of producing a moderate range of crops
LCA 4 is land capable of producing a narrow range of crops
57
http://www.macaulay.ac.uk/explorescotland/lcfa2.html 58
The hybrid LCA layer combines the 1:50,000 scale LCA mapping in the lowlands and the 1:250,000 scale in the highlands. Improvements to the positions of the coastline and water bodies were made using Ordnance Survey MasterMap Topography Layer data in previous work.

85
LCA 5 is land capable of use as improved grassland
LCA 6 is land capable of use as rough grazing
LCA 7 is land of very limited agricultural value
The LCA analysis helped identify, within the geographic sets, which parishes were closely similar in terms of land capability proportions (remembering that the selection process aims to match unfragmented and fragmented land ownership parishes within sets).
Figure 21: LCA Area (as % of Parish) for Option Parishes - Anonymised
Land Cover of Scotland (LCS88)
The option parishes were analysed using the Land Cover Scotland 1988 (LCS88)59 data using two different grouping levels of LCS88 classes:
A 29-category classification used in the LCS88 label field.
A 10-category classification developed by the James Hutton Institute60 that was considered more appropriate for this project.
Using the 10-category LCS88 list, Figure 22 shows the proportion of each category of land cover for all parishes. This helped to ensure that the parishes selected were not significantly different in the types of land use that
59
http://www.macaulay.ac.uk/explorescotland/lcs_mapformat.html 60
Dave Miller, GIS Specialist at the James Hutton Institute.
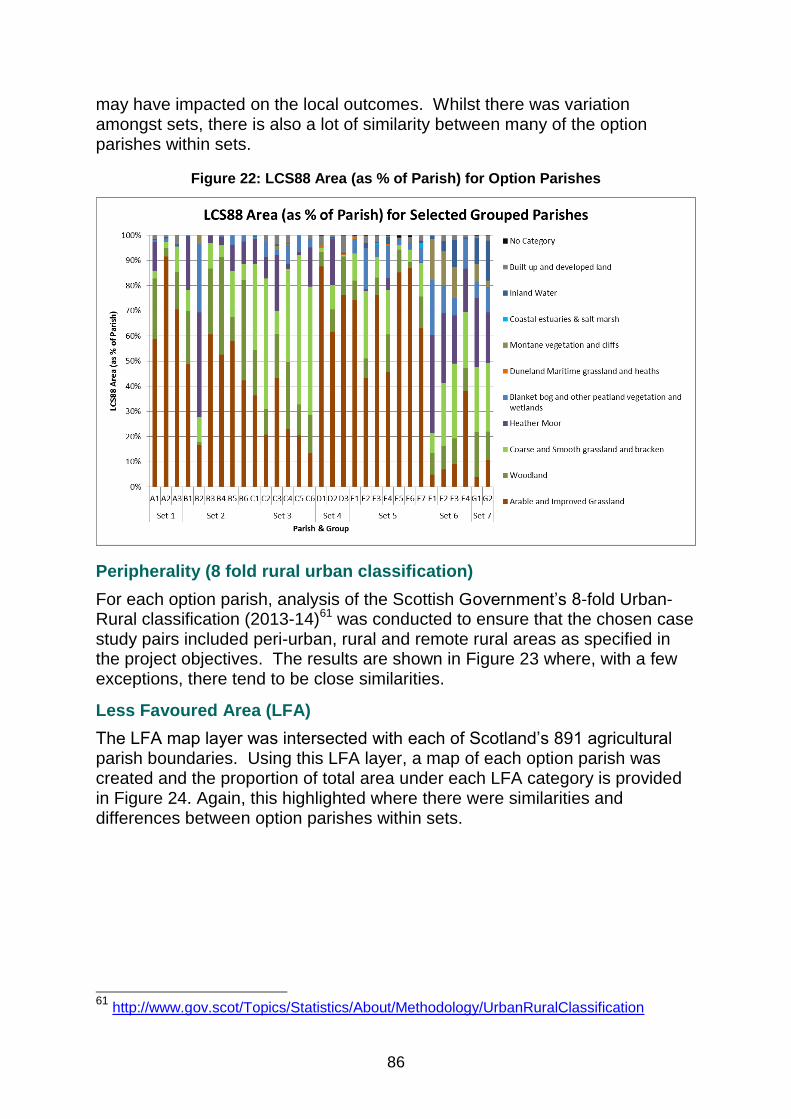
86
may have impacted on the local outcomes. Whilst there was variation amongst sets, there is also a lot of similarity between many of the option parishes within sets.
Figure 22: LCS88 Area (as % of Parish) for Option Parishes
Peripherality (8 fold rural urban classification)
For each option parish, analysis of the Scottish Government‟s 8-fold Urban-Rural classification (2013-14)61 was conducted to ensure that the chosen case study pairs included peri-urban, rural and remote rural areas as specified in the project objectives. The results are shown in Figure 23 where, with a few exceptions, there tend to be close similarities.
Less Favoured Area (LFA)
The LFA map layer was intersected with each of Scotland‟s 891 agricultural parish boundaries. Using this LFA layer, a map of each option parish was created and the proportion of total area under each LFA category is provided in Figure 24. Again, this highlighted where there were similarities and differences between option parishes within sets.
61
http://www.gov.scot/Topics/Statistics/About/Methodology/UrbanRuralClassification

87
Figure 23: Urban-Rural Classification (2013-2014) area as % of Parish for Option
Parishes
Figure 24 : LFA Area (as % of Parish) for Option Parishes

88
Agricultural Holdings
The number of agricultural holdings within each option parish was extracted from the Scottish Government‟s June Agricultural Census62. Figure 25 shows that within sets 1, 2 and 3 there were quite large differences in the number of agricultural holdings between some parishes, that may be a legacy of different ownership structures.
Figure 25: Count of Agricultural Holdings (2014) for Option Parishes - Anonymised
62
http://www.gov.scot/Topics/Statistics/Browse/Agriculture-Fisheries/PubFinalResultsJuneCensus

89
Appendix 5 – Land ownership scale
factors Table 14 Factors influencing scale of land ownership
Factor Effect on Ownership Scale
Inheritance Tax /
Death Duties
Death duties led to the sale of land holdings with many ending up fragmented in
the first half of the 20th century. Some neighbouring landowners may have
used the opportunity to expand their existing holding.
Inheritance Tax
Agricultural /
Forestry Relief
Inheritance tax relief can limit the need for some owners to sell land / buildings
(fragmentation) to pay tax dues.
Capital Gains Tax Capital gains tax can reduce the gain from development sales that may reduce
capital from reinvestment into land and buildings. Capital gains tax can reduce
land value inflation from roll over relief.
Capital Gains Tax
Rollover Relief
This means more capital gain is available for reinvestment into agriculture /
forestry that can increase scale of ownership and can lead to land value
inflation.
Income tax relief
including
Sideways Tax
Relief
The Income Tax treatment of forestry until 1988 allowed owners effectively to
switch between two bases of taxation. „Schedule B‟ was most advantageous
when woodland was generating revenue from timber sales as it taxed woodland
income on the basis of modest annual values, whereas „Schedule D‟ was more
advantageous during periods of expenditure because it allowed claims for loss
relief on planting and other management expenditure. The resulting losses
could be set off against any other income (loss relief). This led to significant
investment into forestry land purchase and plantation during the 1980s.
Sideways tax relief also provides opportunity to offset profits made elsewhere
against losses in agriculture (or vice versa) providing farm made profit in last 5
years
Interest rates /
Alternative
Investment Yields
Mid 1980s saw very high interest rates. High interest rates can restrict those
borrowing money to enter the land market - especially new entrants, tenants,
etc. In recent years land and estates have been marketed to investors as being
high yielding assets and investors‟ access to large amounts of capital may have
reduced the fragmentation of land holdings through the investment in whole
units
Common
Agricultural
Policy support
(PI)
CAP payments are capitalised into land values. This means land becomes
expensive and acts as a barrier to entry for non-land holders. There is a limited
pool of people able to benefit from the CAP meaning there is likely to be a more
limited demand for larger land areas being sold. Years of CAP receipts allow
existing CAP recipients to out-bid many non-CAP recipients in purchase of and
particularly if they aim to expand in order to benefit from economies of scale /
scope or to provide a start in farming for children.
Forestry Forestry grants have been in existence for considerable time and some planting
grants have been particularly attractive. Large scale plantings / re-plantings
can be easier to co-ordinate, have lower per unit cost / and yield greater climate
change benefits. Forestry Commission purchases of land led to some
fragmentation of land holdings over time (mostly pre-1970s).
Succession Scottish succession laws do not require land to be equally split between
siblings as per the Napoleonic Code and heritable and moveable property are
treated differently under law (this means that if land is left under bequeath to an
individual others have no claim on that yet children and spouses have a legal
right to the moveable assets. Until 1964 Succession Act the law of
primogeniture held and entailment (abolished fully through the Abolition of
Feudal Tenure (Scotland) Act 2000) made sure landed holdings were

90
safeguarded from fragmentation in situations of bankruptcy, insanity, etc
Divorce Improved divorce settlement has meant there is greater likelihood of sale of
asset, and fragmentation, in cases of divorce.
Gift Gifts to family members can lead to fragmentation as parcels of land holding
are split off
Debts Landed holdings may be sold to pay financial debts. In order to pay Lloyds
insurance losses in the 1980s and 1990s many „Names‟ had to sell off landed
holdings to cover their share of payments (e.g. Lord Kimball sold the 19,000
hectare Altnaharra estate). Thus external debts can lead to sales of land and
fragmentation.
Lotting of land
holdings
Land agents will often suggest the sale of land in 'lots' to maximise potential
sale value to the owner (particularly accessible / better quality holdings). By
doing so sellers can access a much wider range of purchasers who may be
willing under the Scottish system to bid-up the value of the "lot" depending on
their interest in it. On more sporting type properties / poorer land capability the
holding may be sold in its entirety as there is greater value as a whole (maintain
scale). Some owners are insistent that their land be marketed as a whole unit
due to sentiment. Existing owner motivations / sentiment play an important role
during the sale of land.

91
Appendix 6 – Case study change timelines Table 15 Drivers of economic change in case studies identified by fieldwork participants, 1910-2015
Time period
1a - Unfragmented 1b - Fragmented 2a - Unfragmented 2b - Fragmented 3a - Unfragmented 3b -- Fragmented
1910 -1945
- Estate bought using wealth from international industry and resource extraction.
- New buildings erected (e.g. gate lodges) and farm building renovations made.
- Modernisation programme for estate houses and church and erection of buildings, village hall, etc .
- About 200 people, employed by main estate.
- 1 million trees planted.
- Estate sold house plots with one acre of land and byre for cow/pigs.
- Main estate sold and broken up.
- Modernisation on farms; No longer need horsemen.
-
- Royal Air Force airfield established.
- Influx of soldiers and industry in WWII.
- Some transfer of estate land to military use.
- 30-40 farms sold off on one estate.
- Another estate sold a farm between the wars due to death duties.
- At its height in 1930s, one of the estates employed roughly 14 gardeners and 14 foresters.
- Development of large scale hydro schemes brought lots workers to the area.
- Estate split up – lots of small owner-occupied farms emerged.
- Local boat service ended.
- Forestry Commission acquired land.
1945 – 1965
- Government scheme to convert dairy farms.
- Mechanisation of farming. - Government grants for
draining, liming, amalgamation, buildings.
- Large plant hire business established.
- Forestry sector was large employer.
- Reduced number of tenancies. Some farm amalgamation with some going to in-hand management.
- Reduction of numbers of estate workers on main estate.
- Forestry planting with much diminished „squad‟
- Local abattoir relocated - Advent of mechanisation. - Local sawmill in operation. - Closure of large
engineering works. - Farms getting bigger
through amalgamation. - Industrial businesses
investing in land, but companies didn‟t farm themselves.
- Wages increase and high employment.
- Main village train station closed; loss of employment.
- Withdrawal of troops and closure of military/transit camps.
- Local village used as military decommissioning area (ceased early 1960s, infrastructure dismantled).
- Industrial development. - Main estate sold off
outlying areas of land due to death duties.
- Farm rents reduced due to low farm incomes.
- Reduced investment in tenant farms.
- Mechanisation and modernisation of agriculture.
- Amalgamation of a number of smaller farms.
- Local railway closed Forestry planning started Returns from sheep farming were poor.
- Large hydro developments brought lots employment.
- Large-scale, local hydro development brought many people to the area - descendants of the workers can still be found in the area today
- Local mine opened nearby, bringing people to the area for work.

92
- Local restaurant established.
- Reduced farm and estate workers.
1965-1980
- Significant population reduction in 60s.
- Many village services lost: (e.g. doctor, post office, petrol station, police, pub, bus, butchers, chemist).
- Farm amalgamations and loss of families. Disappearance of dairy industry in area, related to over-production.
- Regional economy growth in late 70s leading to long-term influx of people.
- Conversion of redundant farm buildings to housing.
- Estate employment decline.
- Rising farm rents, but farm size also increased.
- Income to estate from wayleaves and quarry.
- Major infrastructure development brought in population/workers who used local facilities and businesses.
- Start of long period of regional economic growth driven by key sector.
- Major house builder develops on former farms capitalising on demand from nearby urban area (commuters).
- Employment moving off farm.
- Number of shops dramatically decreasing; increasing use of cars and supermarket.
- Food processing facility built.
- Amalgamation of livestock farms (economies of scale).
- Local agri-food processing and feed mill facilities centralised to single location nearby.
- Decline in on farm added value and local use of products.
- Government (capital) support for capital investment on farms.
- Reduction/closure of SMEs in area (linked to car ownership and major retailers)
- Major transportation hub opened.
- Tourism development (caravan parks and gardens)
- Development of main estate house.
- Continued decline in estate employment.
- Three primary schools closed.
- Decline in sheep numbers.
- Mechanisation of agriculture.
- Introduction of CAP. - Local agri-food
processing facilities centralised to single location: more distant.
- Closure of local service / provision businesses.
- Loss of jobs associated with railway.
- Increase in tourism, and caravan park opened.
- New road development bypassing villages: reduced passing trade (causing shop closures) but improved local environmental quality.
- Mechanisation of forestry and agriculture.
- Amalgamation of small farms.
1980-1995
- Coach business began. - Hotel closed; building
bought from estate and pubs all closed.
- Bus service stopped due to improved private transport.
- Fewer people working on farms – and most farmers also work off farm.
- Bank, estate owned garage and petrol station close.
- Farm tenants offered more
- Gamekeepers removed – no official shoots.
- Arrival of CAP led to changed farm economics and crops.
- Development of local agricultural market business to become important employer.
- Food processing business closed with loss of 20 jobs.
- Abattoir closure, decline in local use of farm produce.
- CAP influence . - Increased farm rents
with some limited investment in tenancies.
- Small number of tenant farms sold open market
- Increasing intensification of agriculture.
- Machinery and engineering businesses closed down
- CAP payments and declining farm-gate prices influencing farming.
- One major farm business employed 55 workers (only 10 now).
- Supermarket established in nearby urban area.
- Tourism business opened (e.g. caravan park).
- Reduction in Forestry Commission workers.
- Increase in level of self-employment.
- Tourism continued to grow in importance.
- Shift towards "luxury" tourism, with first local timeshare/holiday let development opened.
- Decline in local authority employment.
- Fish farm opened. - Increase in tourism
employment.
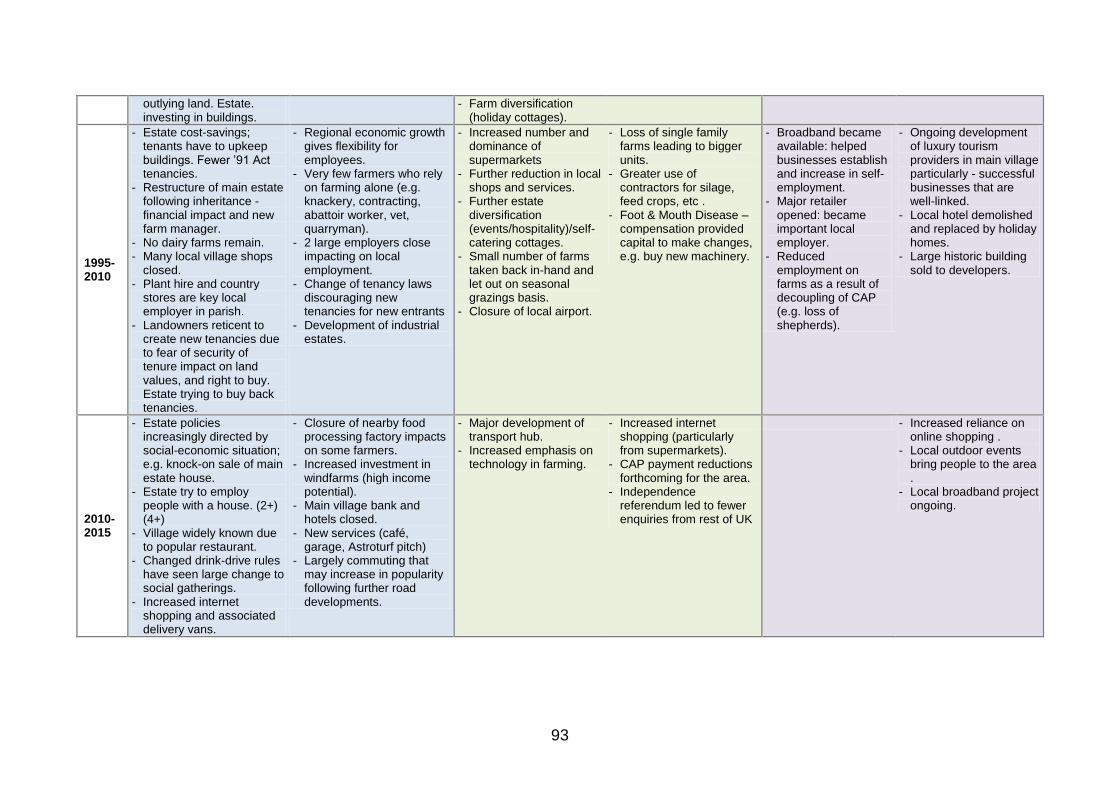
93
outlying land. Estate. investing in buildings.
- Farm diversification (holiday cottages).
1995-2010
- Estate cost-savings; tenants have to upkeep buildings. Fewer ‟91 Act tenancies.
- Restructure of main estate following inheritance - financial impact and new farm manager.
- No dairy farms remain. - Many local village shops
closed. - Plant hire and country
stores are key local employer in parish.
- Landowners reticent to create new tenancies due to fear of security of tenure impact on land values, and right to buy. Estate trying to buy back tenancies.
- Regional economic growth gives flexibility for employees.
- Very few farmers who rely on farming alone (e.g. knackery, contracting, abattoir worker, vet, quarryman).
- 2 large employers close impacting on local employment.
- Change of tenancy laws discouraging new tenancies for new entrants
- Development of industrial estates.
- Increased number and dominance of supermarkets
- Further reduction in local shops and services.
- Further estate diversification (events/hospitality)/self-catering cottages.
- Small number of farms taken back in-hand and let out on seasonal grazings basis.
- Closure of local airport.
- Loss of single family farms leading to bigger units.
- Greater use of contractors for silage, feed crops, etc .
- Foot & Mouth Disease – compensation provided capital to make changes, e.g. buy new machinery.
- Broadband became available: helped businesses establish and increase in self-employment.
- Major retailer opened: became important local employer.
- Reduced employment on farms as a result of decoupling of CAP (e.g. loss of shepherds).
- Ongoing development of luxury tourism providers in main village particularly - successful businesses that are well-linked.
- Local hotel demolished and replaced by holiday homes.
- Large historic building sold to developers.
2010-2015
- Estate policies increasingly directed by social-economic situation; e.g. knock-on sale of main estate house.
- Estate try to employ people with a house. (2+) (4+)
- Village widely known due to popular restaurant.
- Changed drink-drive rules have seen large change to social gatherings.
- Increased internet shopping and associated delivery vans.
- Closure of nearby food processing factory impacts on some farmers.
- Increased investment in windfarms (high income potential).
- Main village bank and hotels closed.
- New services (café, garage, Astroturf pitch)
- Largely commuting that may increase in popularity following further road developments.
- Major development of transport hub.
- Increased emphasis on technology in farming.
- Increased internet shopping (particularly from supermarkets).
- CAP payment reductions forthcoming for the area.
- Independence referendum led to fewer enquiries from rest of UK
- Increased reliance on online shopping .
- Local outdoor events bring people to the area .
- Local broadband project ongoing.

94
Table 16 Drivers of societal change in case studies identified by fieldwork participants, 1910-2015
Time period
1a - Unfragmented 1b - Fragmented 2a - Unfragmented 2b - Fragmented 3a - Unfragmented 3b -- Fragmented
1910 -1945
- Young Farmers Association established and still buoyant.
- Wife of landowner donated land for use by agricultural show (unclear whether ownership transferred or use rights). Part of showground also owned by local authority.
- Village school extended due to pupils from outlying areas; old school building then demolished in 2006.
- Local pipe band established.
- Local authority investment in housing in wider area.
- Sports facilities (football pitches etc.) established (retained after troop withdrawal).
- Local bowling green to lost to development.
- Poor housing conditions. - High number of children
per family.
- Closure of local piers that supported boat service.
1945 – 1965
- Regular farmers‟ dances in village hall.
- Strong Women‟s Rural Institute membership (40 compared to 14 today)
- Television arrived.
- Housing development built for agricultural workers, plus council houses.
- Residential street developed on farmland (originally estate land, then owner-occupier farms).
- Allotments established in main village.
- Start of counter urbanisation.
- Loss or local rail line. - Village school closed. - Further local authority
housing improvements post-war.
- Some housing on estate land left to go derelict due to declining estate workforce.
- Increased in-migration to wider area.
- Gradual decline in community events/groups.
- Post-war housing improvements.
- Sheep numbers declined and mechanisation drove decline in number of farmers which led to in population decline and closure of 3 primary schools.
- Population growth as a result of local hydro and mine developments.
1965-1980
- School closed in one village.
- Lack of demand for bus service due to increased car ownership led to much reduced public transport service.
- Parish village received street lighting.
- Church was a community hub (concerts, activities) with big congregation (now
- Housing and industrial developments.
- „Them and us‟ (local or outsider) attitude evolved.
- Three small housing developments in main village.
- House price inflation. - Regular farmers‟ dinner
dances. - New housing
development by local
- Further decline in community groups/events (and services)
- Increased car ownership led to less dependency on local services.
- Reduction in farmers wives working on farms as need for secondary income grew.
- Increased private home ownership (much
- Birth control and changing view on family size led to population decline..
- Television caused decline in social events .
- Church of Scotland closures reduces community activity.
- Decline in local railway services (closure of stations).
- Agriculture mechanised, which led young people to leave when they reached working age causing population decline.
- End of local van service that brought domestic supplies and food to residents.
- Lively campsite in main village which 'grew' the community in the

95
much reduced). - First council housing
development built in one village.
- Both doctor and school head teachers no longer live in the village.
- Country police stations closed.
- Large proportion of estate housing privately rented or provided to retired Employees.
developer. - Councillors/Council is
now removed from village, therefore community lost its „voice‟.
- Importance of nearby town swimming pool noted and influence on young people living in main parish village; facility retained and expanded.
through the „Right to Buy‟ of local authority housing stock).
- Some tied estate housing changed to private rentals.
- Increased recreational development and improvements ,
summer months, with lots of interaction between visitors and locals.
- Local shop, petrol station and post office closed in one village - impact on community as "served as a social meeting place, particularly for older people."
1980-1995
- Council house developments in two parish villages.
- Police station closed, but no impact due to low level of crime.
- Mobile phones arrived, but don‟t work in one village (and similar issues with broadband more generally).
- Housing development in one parish village; new homeowners „created own sense of community‟.
- Main parish village expansion, due to lack of regional development and village being in commuting distance.
- Rapid house price inflation (fuelled by external demand and limited supply).
- Arrival of computers; younger generation „not encouraged outside‟.
- Land for playing fields donated by local developer.
- Large housing development with „no greenspace‟ that changed the spirit of the village.
- Village church closure. - Estate main house
development. - Farm cottage sales
leading to changing demographic (retirees and second home owners).
- In-migration led to broader range of backgrounds / viewpoints.
- Increase in tourism and demand for/number of holiday cottages and incomers.
- Property spike in 1980s began to introduce incomers to the area as sales were more lucrative. Workers cottages converted into holiday homes.
- Rapid growth in tourism sector lead to population decline.
- Depopulation had negative impact on community cohesion (also related to television and internet, access, and accessibility to larger urban areas for shopping, etc.)
- Peripheral primary schools closed and all children travelled to school in main village
- Local Forestry Commission office closed.
- Regular local dances and other social events ended.
- Community group took ownership of hill farm and begin work to set up renewable energy initiatives, housing and business opportunities.
- Conversion of campground to other accommodation.
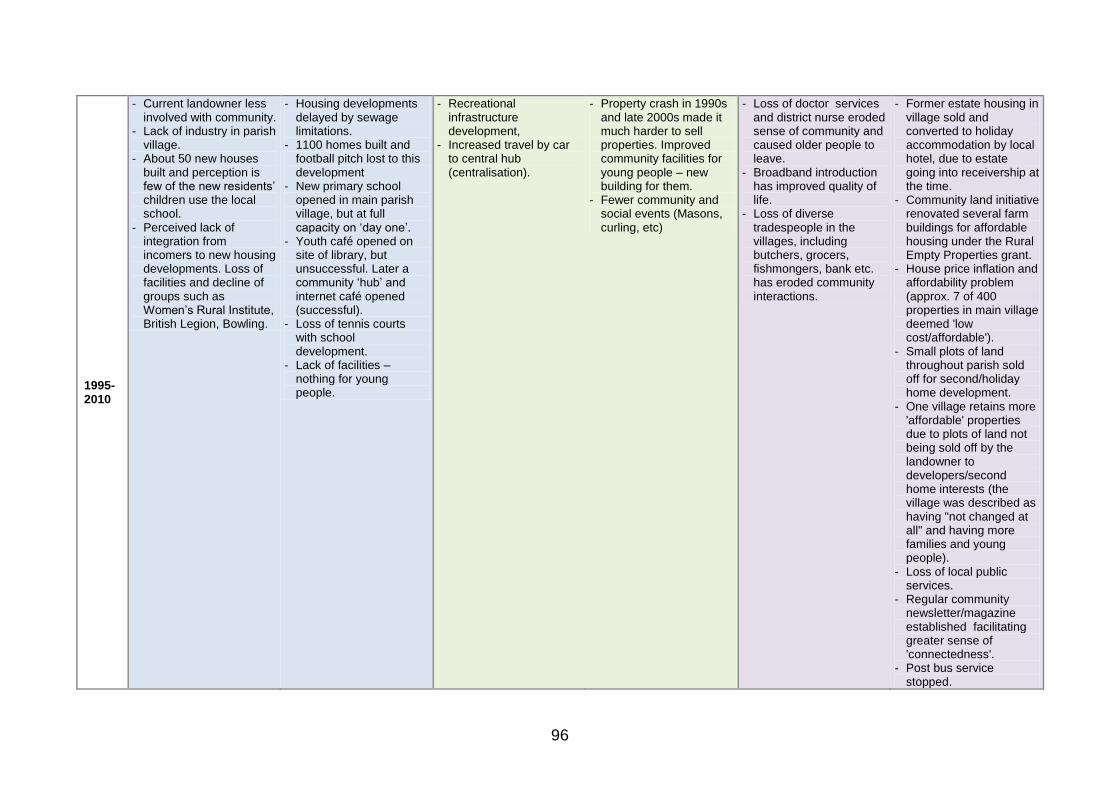
96
1995-2010
- Current landowner less involved with community.
- Lack of industry in parish village.
- About 50 new houses built and perception is few of the new residents‟ children use the local school.
- Perceived lack of integration from incomers to new housing developments. Loss of facilities and decline of groups such as Women‟s Rural Institute, British Legion, Bowling.
- Housing developments delayed by sewage limitations.
- 1100 homes built and football pitch lost to this development
- New primary school opened in main parish village, but at full capacity on „day one‟.
- Youth café opened on site of library, but unsuccessful. Later a community „hub‟ and internet café opened (successful).
- Loss of tennis courts with school development.
- Lack of facilities – nothing for young people.
- Recreational infrastructure development,
- Increased travel by car to central hub (centralisation).
- Property crash in 1990s and late 2000s made it much harder to sell properties. Improved community facilities for young people – new building for them.
- Fewer community and social events (Masons, curling, etc)
- Loss of doctor services and district nurse eroded sense of community and caused older people to leave.
- Broadband introduction has improved quality of life.
- Loss of diverse tradespeople in the villages, including butchers, grocers, fishmongers, bank etc. has eroded community interactions.
- Former estate housing in village sold and converted to holiday accommodation by local hotel, due to estate going into receivership at the time.
- Community land initiative renovated several farm buildings for affordable housing under the Rural Empty Properties grant.
- House price inflation and affordability problem (approx. 7 of 400 properties in main village deemed 'low cost/affordable').
- Small plots of land throughout parish sold off for second/holiday home development.
- One village retains more 'affordable' properties due to plots of land not being sold off by the landowner to developers/second home interests (the village was described as having "not changed at all" and having more families and young people).
- Loss of local public services.
- Regular community newsletter/magazine established facilitating greater sense of 'connectedness'.
- Post bus service stopped.

97
2010-2015
- Main estate house sold and new owner spent money on house and said they would like to be involved in community but this has not happened and they have blocked access to house grounds.
- Poor mobile phone and internet access has negative impact on quality of life and business opportunities.
- Estate still supports agricultural show which generates significant volunteering (80+ people), particularly from younger generation.
- New houses in one village, including affordable houses for local youngsters.
- Closure of local tourism attraction within parish; now lying empty and Council paying maintenance costs.
- Community café part funded by council; closed after funding cuts. Premises now used for groups with learning disabilities to get back to work.
- Improved internet facilities increasing small businesses and working from home.
- Second new school being built.
- - Compensatory payments to community from windfarm.
- Village „in Bloom‟ voluntary group established
- Local Authority initiative to encourage community control of assets.
- Community Council re-established in main urban centre.
- Fewer affordable houses being built since economic downturn coupled with lack of available development land.
- Tightening of drink-drive laws has led to decline in people going out to bars/restaurants for evening meals.
- Local tourist association start running local events/activities.
- Negative impact of online shopping on local businesses.
- Community benefited financial from local wind development (shared between community councils in the parish and neighbouring parishes) that has enabled environmental and community projects.
- Local participation decline - community council struggles to find new members.
- Changing community dynamic overall - lack of integration between second home/holiday owners and long-term permanent residents.
- Community aspect in general described as "missing" with "get togethers no longer happening, apart from through the school"
- Concerns about long-term future of the primary school as it is considered a "lynchpin" for maintaining local services.
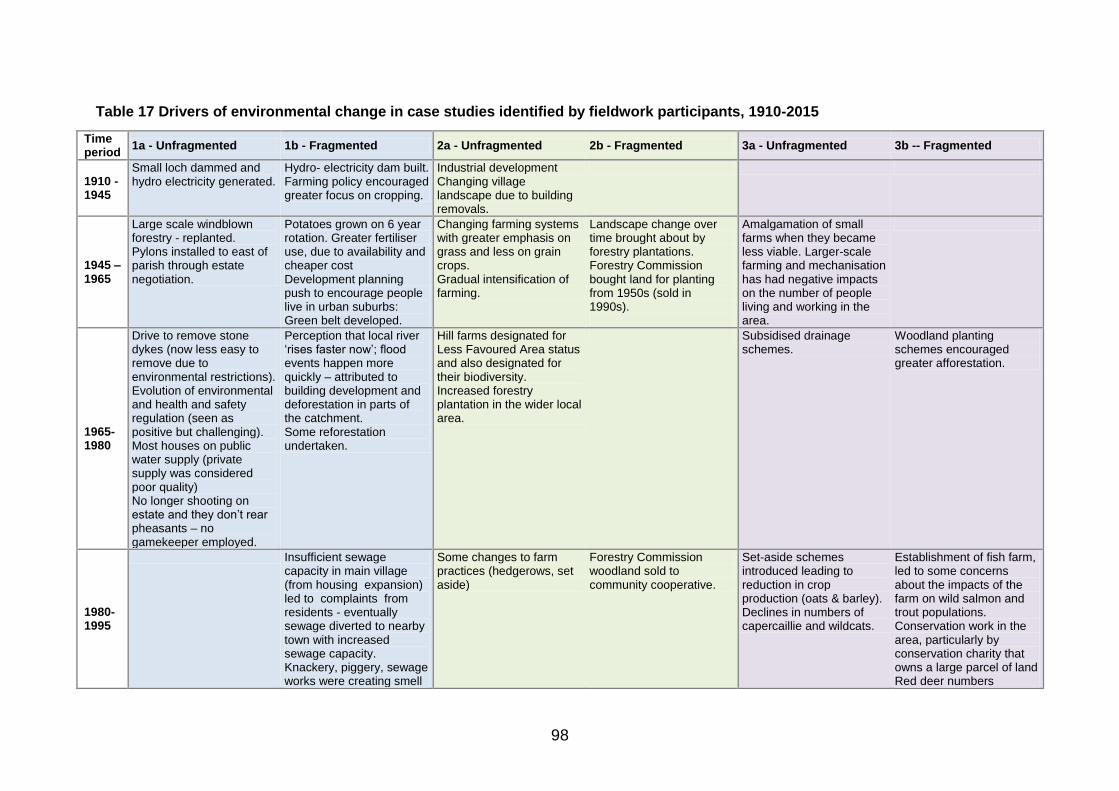
98
Table 17 Drivers of environmental change in case studies identified by fieldwork participants, 1910-2015
Time period
1a - Unfragmented 1b - Fragmented 2a - Unfragmented 2b - Fragmented 3a - Unfragmented 3b -- Fragmented
1910 -1945
Small loch dammed and hydro electricity generated.
Hydro- electricity dam built. Farming policy encouraged greater focus on cropping.
Industrial development Changing village landscape due to building removals.
1945 – 1965
Large scale windblown forestry - replanted. Pylons installed to east of parish through estate negotiation.
Potatoes grown on 6 year rotation. Greater fertiliser use, due to availability and cheaper cost Development planning push to encourage people live in urban suburbs: Green belt developed.
Changing farming systems with greater emphasis on grass and less on grain crops. Gradual intensification of farming.
Landscape change over time brought about by forestry plantations. Forestry Commission bought land for planting from 1950s (sold in 1990s).
Amalgamation of small farms when they became less viable. Larger-scale farming and mechanisation has had negative impacts on the number of people living and working in the area.
1965-1980
Drive to remove stone dykes (now less easy to remove due to environmental restrictions). Evolution of environmental and health and safety regulation (seen as positive but challenging). Most houses on public water supply (private supply was considered poor quality) No longer shooting on estate and they don‟t rear pheasants – no gamekeeper employed.
Perception that local river „rises faster now‟; flood events happen more quickly – attributed to building development and deforestation in parts of the catchment. Some reforestation undertaken.
Hill farms designated for Less Favoured Area status and also designated for their biodiversity. Increased forestry plantation in the wider local area.
Subsidised drainage schemes.
Woodland planting schemes encouraged greater afforestation.
1980-1995
Insufficient sewage capacity in main village (from housing expansion) led to complaints from residents - eventually sewage diverted to nearby town with increased sewage capacity. Knackery, piggery, sewage works were creating smell
Some changes to farm practices (hedgerows, set aside)
Forestry Commission woodland sold to community cooperative.
Set-aside schemes introduced leading to reduction in crop production (oats & barley). Declines in numbers of capercaillie and wildcats.
Establishment of fish farm, led to some concerns about the impacts of the farm on wild salmon and trout populations. Conservation work in the area, particularly by conservation charity that owns a large parcel of land Red deer numbers

99
nuisance that took time to resolve. Proximity to local hill with ranger service and paths seen to encourage walking. Domestic mains gas installed.
increasing.
1995-2010
Barrier to stop traffic through the estate (used as a rat run) Greater issues with litter. „Right to roam‟ means many more passing by with their dogs.
Neolithic dwelling discovered on farm land that restricts management options for farmer. Traffic increased before further new houses built, especially during peak times (pre-bypass). Village bypass significantly reduce traffic throughput.
Increased wetlands on unmanaged areas on farms Slurry stores installed in some areas Some reinstatement of cropping (oats etc.) Biomass boilers on some properties (incentives) and biomass cropping Long distance paths development) Tree diseases resulting in felling of certain species/areas and reduction in replanting of Larch
Coupled livestock support removed – led to lower grazing pressures. Diversification of farming businesses needed to remain viable
Local heritage attraction opened. Historical landscape project led to architectural heritage and cultural heritage outcomes. Steady increase in vehicles - many narrow roads overused by cars and larger vehicles. Concerns about ongoing safety and environmental impact. Increased wild camping on with lots of rubbish being left. Landowners clear up.
2010-2015
Forestry planting. Although no estate gamekeeper the sporting rights were sold meaning sport shooting still occurring. Pursued idea of nature reserve on estate.
Increased traffic and noise/pollution from lorries and cars, Greening of the CAP.
Steadings no longer tidied, buildings not white washed, drains and ditches not cleared - due to fewer employees on farms so only the farming/production is done with less activity relating to countryside management being carried out.
Visitor centre at popular outdoor location remained open during winter months – positive effect on tourism and outdoor activities Perception of few opportunities for entrant farmers due to wider economic challenges facing farming.
Continued development pressure, particularly for "upper-end, architecturally interesting" properties on lower altitudes sites, with "good views". There has been a significant increase in the number of buildings in the parish, particularly in the main village. More conservation-related jobs than previously, through management of National Nature Reserve owned by conservation charity. Endeavours to set up community allotments.

100
Appendix 7 – Case study agricultural data
tables Table 18 Agricultural Holding Size Distribution, 1982 to 2012 (JAC)
Ha 1a - Unfragmented
Ha
1b - Fragmented
1982 1992 2002 2012
1982 1992 2002 2012
<5 9 6 2 3
<5 55 57 56 59 5-20 9 8 9 6
5-20 19 17 24 19
21-50 8 4 5 4
21-50 17 17 11 10 51-100 18 14 14 13
51-100 11 8 5 4
101-500 2 5 6 8
101-500 8 8 10 10 >500 1 1 1 1
>500
Total 47 38 37 35
Total 110 107 106 102
Ha 2a - Unfragmented
Ha
2b - Fragmented
1982 1992 2002 2012
1982 1992 2002 2012
<5 3 4 9 10
<5 5 5 5 8 5-20 3 6 5 6
5-20 2 1 3 6
21-50 10 9 7 4
21-50 7 9 7 7 51-100 13 14 13 11
51-100 12 9 8 9
101-500 18 18 15 16
101-500 21 27 27 24 >500 7 6 6 6
>500 3 2 1 2
Total 54 57 55 53
Total 50 53 51 56
Ha 3a - Unfragmented
Ha
3b - Fragmented
1982 1992 2002 2012
1982 1992 2002 2012
<5 5 5 7 9
<5 16 15 11 12 5-20 5 8 9 9
5-20 10 7 12 15
21-50 10 8 7 7
21-50 3 6 9 13 51-100 3 4 3 3
51-100 4 6 9 5
101-500 10 12 12 9
101-250 9 8 9 9 >500 12 13 12 11
251-500 7 7 10 12
Total 45 50 50 48
Total 49 49 60 66
Ha Unfragmented
Ha
Fragmented
1982 1992 2002 2012
1982 1992 2002 2012
<5 17 15 18 22
<5 76 77 72 79 5-20 17 22 23 21
5-20 31 25 39 40
21-50 28 21 19 15
21-50 27 32 27 30 51-100 34 32 30 27
51-100 27 23 22 18
101-500 30 35 33 33
101-500 38 43 46 43 >500 20 20 19 18
>500 10 9 11 14
Total 146 145 142 136
Total 209 209 217 224

101
Table 19 Agricultural land ownership and use distribution, 1982 to 2012 (JAC)
Case Study Year % land rented
% land owned
% land seasonally rented-in
% land in crops /fallow / setaside
% land in grass
% land in rough
grazing
% land in farm woodland
Total cattle
Total sheep
1a - Unfragmented
1982 99% 1% 7% 42% 48% 8%
3,703 5,160
1992 99% 1% 34% 42% 43% 13%
3,718 6,253
2002 95% 5% 12% 46% 38% 11% 2.4% 3,366 2,236
2012 82% 18% 10% 34% 50% 5% 8.3% 3,567 9,246
1b - Fragmented
1982 9% 91% 16% 32% 43% 18% 5.1% 4,541 1,151
1992 11% 89% 11% 31% 46% 16% 4.1% 3,648 991
2002 19% 81% 23% 28% 52% 15% 3.6% 4,320 1,990
2012 14% 86% 28% 31% 50% 7% 3.0% 4,156 1,595
2a - Unfragmented
1982 70% 30% 1% 8% 29% 62% 0.3% 7,984 18,344
1992 74% 26% 2% 5% 34% 56% 3.5% 8,296 24,172
2002 80% 20% 4% 8% 37% 53% 0.5% 7,861 21,208
2012 69% 31% 2% 9% 39% 45% 5.3% 6,789 18,701
2b - Fragmented
1982 35% 65% 2% 5% 45% 47% 2.1% 8,099 19,451
1992 21% 79% 2% 3% 45% 49% 1.6% 8,676 26,739
2002 16% 84% 6% 3% 50% 41% 2.4% 6,326 19,449
2012 20% 80% 36% 2% 61% 25% 4.3% 7,334 18,737
3a - Unfragmented
1982 23% 77% 0% 0% 3% 97% 0.2% 2,154 34,851
1992 27% 73% 0% 0% 3% 96% 0.3% 2,351 36,575
2002 34% 66% 3% 0% 4% 90% 1.8% 3,035 36,218
2012 22% 78% 8% 0% 4% 90% 3.0% 2,029 31,560
3b - Fragmented
1982 23% 77% 0% 1% 10% 88% 1.4% 1,719 40,057
1992 35% 65% 1% 0% 9% 88% 1.7% 1,582 42,740
2002 19% 81% 2% 0% 7% 89% 2.6% 1,656 40,661
2012 8% 92% 2% 1% 12% 73% 5.9% 1,312 36,644
All Unfragmented
1982 31% 69% 0% 3% 7% 89% 0.2% 13,841 58,355
1992 35% 65% 2% 2% 8% 89% 0.6% 14,365 67,000
2002 43% 57% 4% 3% 11% 81% 1.7% 14,262 59,662
2012 31% 69% 7% 3% 11% 80% 3.6% 12,385 59,507
All Fragmented
1982 25% 75% 3% 6% 24% 68% 2.0% 14,359 60,659
1992 28% 72% 3% 5% 24% 69% 1.9% 13,906 70,470
2002 18% 82% 5% 4% 23% 69% 2.7% 12,302 62,100
2012 11% 89% 12% 4% 27% 56% 5.2% 12,802 56,976

102
Table 20 Proportion of holdings by land ownership and land use, 1982 to 2012 (JAC)
Case Study Year Number
of Holdings
% holdings renting
% holdings owning
% holdings renting
seasonally
% holdings with crops /fallow /
setaside
% holdings with rough
grazing
% holdings with farm woodland
% holdings with cattle
% holdings with sheep
1a - Unfragmented
1982 47 98% 4% 13% 15% 85% 96% 43% 0%
1992 38 92% 11% 8% 21% 79% 95% 53% 0%
2002 37 89% 19% 19% 41% 70% 92% 43% 5%
2012 35 89% 26% 14% 31% 63% 97% 37% 17%
1b - Fragmented
1982 110 8% 94% 19% 7% 51% 87% 55% 20%
1992 107 10% 93% 21% 7% 47% 88% 48% 19%
2002 106 6% 97% 22% 8% 35% 87% 38% 18%
2012 102 5% 98% 23% 9% 31% 79% 40% 21%
2a - Unfragmented
1982 54 78% 24% 6% 11% 70% 98% 46% 17%
1992 57 75% 32% 7% 19% 42% 96% 46% 19%
2002 56 71% 34% 13% 27% 45% 89% 41% 20%
2012 53 58% 47% 13% 15% 45% 87% 47% 11%
2b - Fragmented
1982 50 30% 78% 4% 10% 46% 96% 64% 36%
1992 53 26% 81% 9% 17% 38% 98% 66% 26%
2002 52 15% 88% 29% 27% 19% 100% 52% 35%
2012 56 14% 89% 23% 30% 23% 88% 55% 38%
3a - Unfragmented
1982 45 60% 47% 20% 4% 49% 84% 80% 16%
1992 50 60% 48% 26% 18% 22% 90% 76% 30%
2002 50 50% 60% 26% 22% 8% 78% 70% 50%
2012 48 38% 75% 23% 19% 10% 71% 67% 56%
3b - Fragmented
1982 49 31% 84% 18% 2% 39% 80% 69% 37%
1992 49 24% 86% 20% 12% 22% 80% 61% 41%
2002 60 10% 95% 37% 15% 17% 63% 62% 35%
2012 66 12% 97% 26% 14% 18% 68% 61% 38%
All Unfragmented
1982 146 79% 25% 12% 10% 68% 93% 55% 11%
1992 145 74% 32% 14% 19% 45% 94% 58% 18%
2002 143 69% 39% 19% 29% 38% 86% 52% 27%
2012 136 59% 51% 17% 21% 38% 84% 51% 29%
All Fragmented
1982 209 19% 88% 15% 7% 47% 88% 61% 28%
1992 209 18% 89% 18% 11% 39% 89% 56% 26%
2002 218 9% 94% 28% 14% 26% 83% 48% 27%
2012 224 9% 96% 24% 16% 25% 78% 50% 30%
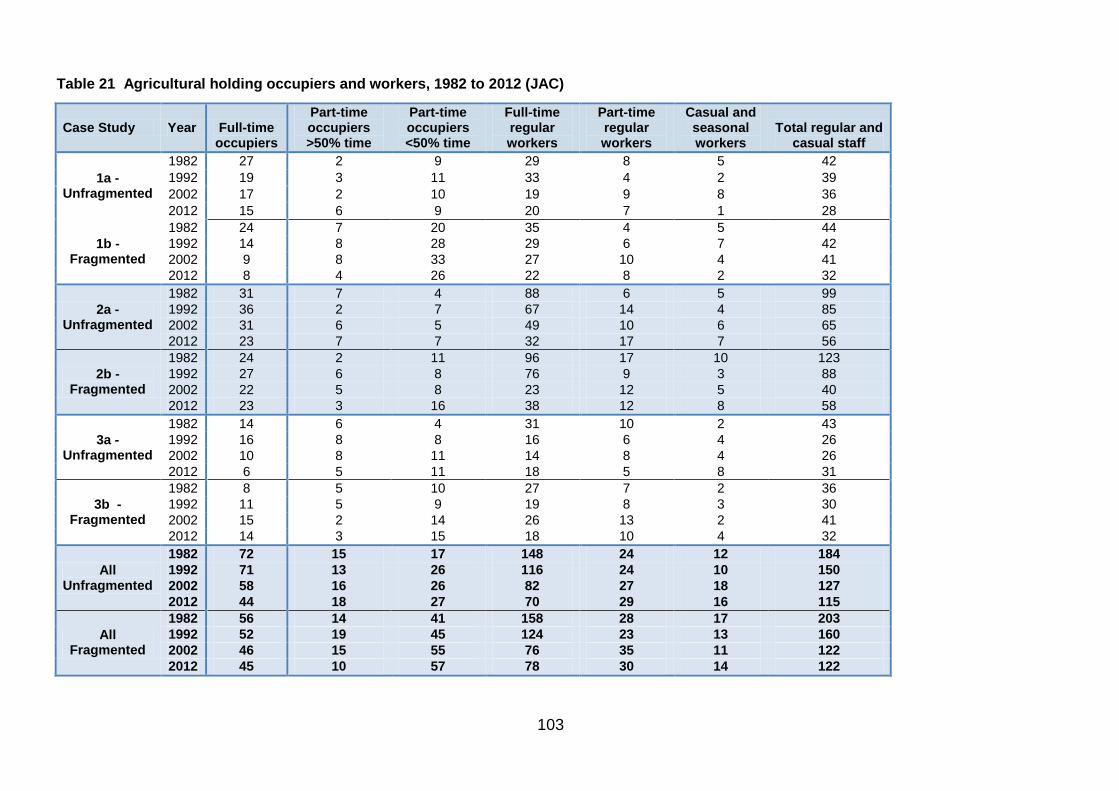
103
Table 21 Agricultural holding occupiers and workers, 1982 to 2012 (JAC)
Case Study Year Full-time occupiers
Part-time occupiers >50% time
Part-time occupiers <50% time
Full-time regular workers
Part-time regular workers
Casual and seasonal workers
Total regular and casual staff
1a - Unfragmented
1982 27 2 9 29 8 5 42
1992 19 3 11 33 4 2 39
2002 17 2 10 19 9 8 36
2012 15 6 9 20 7 1 28
1b - Fragmented
1982 24 7 20 35 4 5 44
1992 14 8 28 29 6 7 42
2002 9 8 33 27 10 4 41
2012 8 4 26 22 8 2 32
2a - Unfragmented
1982 31 7 4 88 6 5 99
1992 36 2 7 67 14 4 85
2002 31 6 5 49 10 6 65
2012 23 7 7 32 17 7 56
2b - Fragmented
1982 24 2 11 96 17 10 123
1992 27 6 8 76 9 3 88
2002 22 5 8 23 12 5 40
2012 23 3 16 38 12 8 58
3a - Unfragmented
1982 14 6 4 31 10 2 43
1992 16 8 8 16 6 4 26
2002 10 8 11 14 8 4 26
2012 6 5 11 18 5 8 31
3b - Fragmented
1982 8 5 10 27 7 2 36
1992 11 5 9 19 8 3 30
2002 15 2 14 26 13 2 41
2012 14 3 15 18 10 4 32
All Unfragmented
1982 72 15 17 148 24 12 184
1992 71 13 26 116 24 10 150
2002 58 16 26 82 27 18 127
2012 44 18 27 70 29 16 115
All Fragmented
1982 56 14 41 158 28 17 203
1992 52 19 45 124 23 13 160
2002 46 15 55 76 35 11 122
2012 45 10 57 78 30 14 122
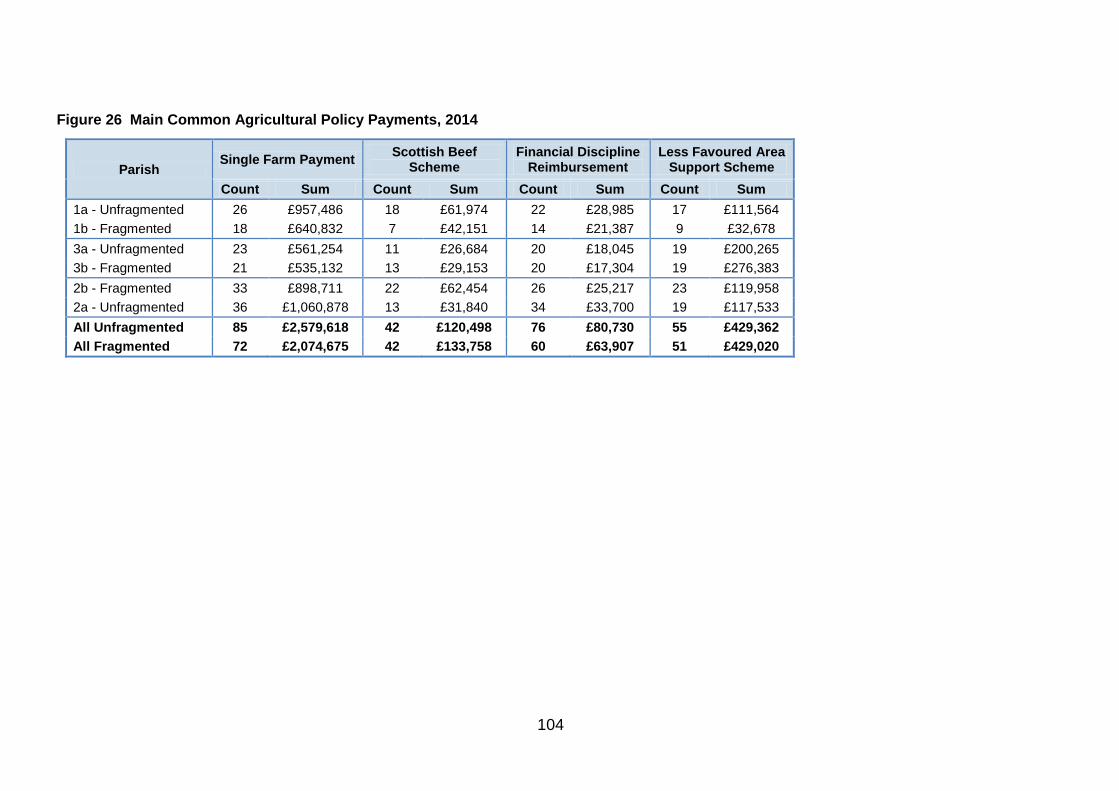
104
Figure 26 Main Common Agricultural Policy Payments, 2014
Parish Single Farm Payment
Scottish Beef Scheme
Financial Discipline Reimbursement
Less Favoured Area Support Scheme
Count Sum Count Sum Count Sum Count Sum
1a - Unfragmented 26 £957,486 18 £61,974 22 £28,985 17 £111,564
1b - Fragmented 18 £640,832 7 £42,151 14 £21,387 9 £32,678
3a - Unfragmented 23 £561,254 11 £26,684 20 £18,045 19 £200,265
3b - Fragmented 21 £535,132 13 £29,153 20 £17,304 19 £276,383
2b - Fragmented 33 £898,711 22 £62,454 26 £25,217 23 £119,958
2a - Unfragmented 36 £1,060,878 13 £31,840 34 £33,700 19 £117,533
All Unfragmented 85 £2,579,618 42 £120,498 76 £80,730 55 £429,362
All Fragmented 72 £2,074,675 42 £133,758 60 £63,907 51 £429,020

105
Appendix 8 - References Allen, D. and Leuck, D. (2003) The nature of the farm: Contracts, risk, and organization in agriculture. MIT Press.
Armstrong, A. S. and Mather, A. S. (1983) Land ownership and Land Use in the Scottish Highlands. Department of Geography, University of Aberdeen.
Ashmore, F.H., Farrington, J.H. and Skerratt, S. (2015) Superfast Broadband and Rural Community Resilience: Examining the Rural Need for Speed. Scottish Geographical Journal 2015 Vol. 131, Issue 3-4 pp265-278.
Atterton, J. (2007) The „Strength of Weak Ties‟: Social Networking by Business Owners in the Highlands and Islands of Scotland, Sociologia Ruralis, 2007, 47, 3.
Atterton, J and Brodie, E (2014) Young People Contributing to a Vibrant Rural Scotland. In: Skerratt, S., Atterton, J., Brodie, E., Carson, D., Heggie, R., McCracken, D., Thomson, S. and Woolvin, M. (2014) Rural Scotland in Focus 2014, Edinburgh: Rural Policy Centre, SRUC, Scotland's Rural College.
Best, R. H. and Ward, J. T. (1956) The garden controversy: a critical analysis of the evidence and arguments relating to the production of food from gardens and farmland. Studies in rural land use, rept. no. 2, Dept. of Agricultural Economics, Wye College.
Bosworth, G. and Atterton, J. (2012) Entrepreneurial In-migration and Neoendogenous Rural Development, Rural Sociology, 2012, 77, 2.
Brown, I., Castellazzi, M., Feliciano, D. (2014) Comparing Path Dependence and Spatial Targeting of Land Use in Implementing Climate Change Responses. Land 3(3) pp. 850-873.
Burnett, K. A. (1998). Local heroics: reflecting on incomers and local rural development discourses in Scotland. Sociologia Ruralis, 38(2), 204-224.
Cahill, K. (2001). Who Owns Britain: the hidden facts behind land ownership in the UK and Ireland. Canongate, Edinburgh. 464 pp.
Callander, R. (1987) „A Pattern of Land ownership in Scotland, with particular reference to Aberdeenshire‟. 1st Edition. Haughend Publications, Finzean.
Callander, R.,(1986) „Background paper: The Law of the Land‟. In: Hulbert, J. (Ed.) „Land: Ownership and Use‟. Andrew Fletcher Society, Longforgan, Dundee. pp 1-11.
Callander, R.,(1998) „How Scotland is Owned‟. Canongate, Edinburgh.
Callander, R.F. (1987) A Pattern of Land ownership in Scotland. Haughend Publications, Aberdeen.

106
Clark, G. (1981) „Some secular changes to land ownership in Scotland‟. Scottish Geographical Magazine 97: 27-36.
Copus, A.; Hopkins, J. (2015). Mapping Rural Socio-Economic Performance. Report for Rural Communities Team, Food Drink and Rural Communities Division, The Scottish Government.
Cramb, A. (2000) „Who owns Scotland now? The use and abuse of private land‟, Mainstream, Edinburgh.
Davies, A. , Bryce, R. and Redpath, S. (2013). Use of Multicriteria Decision Analysis to Address Conservation Conflicts. Conservation Biology 27: 936-944.
Dewar, D. (1998). Land Reform for the 21st Century. The 1998 John McEwen Memorial Lecture. Perth, A. K. Bell Library.
Glass, J.H., Price, M.F., Warren, C.R. and Scott, A.J. (2013). Lairds, Land and Sustainability: Scottish perspectives on upland management. Edinburgh University Press.
Hall, C. and Skerratt, S. (2010) What is the future for Scotland‟s rural infrastructure and access to services? In: Skerratt, S., Hall, C., Lamprinopoulou, C., McCracken, D., Midgley, A., Price, M., Renwick, A., Revoredo, C., Thomson, S., Williams, F. and Wreford, A. (2010), Rural Scotland in Focus 2010, Edinburgh: Rural Policy Centre, Scottish Agricultural College.
Harrison, A. et al. (1981) Factors influencing ownership, tenancy, mobility and use of farmland in the United Kingdom. Information on Agriculture Report No. 74, Commission of the European Communities, Brussels.
Hickman, M., Crowley, H., & Mai, N. (2008). Immigration and social cohesion in the UK. York: Joseph Rowntree Foundation.
Higgins, P., Wightman, A., MacMillan, D. (2002) Sporting Estates and Recreational Land Use in the Highlands and Islands of Scotland. Economic and Social research Council.
Hindle, R., Thomson, S., Skerratt, S., McMorran, R. and Onea, P. (2014) Economic Contribution of Estates in Scotland: An Economic Assessment for Scottish Land and Estates.
Hirsch, D., Bryan, A., Davis, A. and Smith, N (2013) A Minimum Income Standard for Remote Rural Scotland. A report for Highlands and Islands Enterprise.
Home, R. (2009). „Land ownership in the United Kingdom: Trends, preferences and future challenges‟. Land Use Policy 26 (1), S103–S108.
Hunter, J. (2013) Scottish land reform to date: By European standards, a pretty dismal record. Available at: http://www.communitylandscotland.org.uk/wp-content/uploads/2014/06/Land-Reform-History.-Jim-Hunter.pdf

107
Hunter, J.,Peacock, P.,Wightman, A. and Foxley, M. (2014) 432:50 – Towards a comprehensive land reform agenda for Scotland. A Briefing Paper for the House of Commons Scottish Affairs Committee.
Kerr, G. (2004) The Contribution and Socio-Economic Role of Scottish Estates. A Scottish Agricultural College report.
Land Reform Policy Group (1998). Identifying the Problems. Edinburgh, The Stationary Office.
Land Reform Policy Group (1999). Recommendations for Action. Edinburgh, The Stationary Office.
Land Reform Review Group (2014) The Land of Scotland and the Common Good - Final Report Land Reform Review Group.
Lawry, S., Samii, C., Hall, R., Leopold, A., Hornby, D., and Mtero, F. (2014). The impact of land property rights interventions on investment and agricultural productivity in developing countries: A systematic review, Campbell Systematic Reviews 1.
Leneman, L. (1989a) Land Settlement in Scotland after World War I. The Agricultural History Review. Vol. 37, No. 1 pp. 52-64
Leneman, L. (1989b) Fit for Heroes? Land Settlement in Scotland After WWI. Aberdeen University Press.
Lloyd, T. (1992) Present Value Models of Agricultural Land Prices in England and Wales. University of Nottingham.
Lorimer, H. (2000). Guns, Game and the Grandee: The Cultural Politics of Deerstalking in the Scottish Highlands. Cultural Geographies, 7(4): 403-431.
MacGregor, B. (1993). Land Tenure in Scotland: The 1993 John McEwen Memorial Lecture. Perth, Rural Forum.
MacGregor, B. D. (1988) Owner motivation and land use on landed estates in the north-west Highlands of Scotland. Journal of Rural Studies. 4, 4, p. 389-404 16 p.
MacGregor, B. D. and Stockdale, A. (1994): Land use change on Scottish Highland estates. Journal of Rural Studies 10(3): 301-9.
Macleod, C., Braunholtz-Speight, T., Macphail, I., Flyn, D., Allen, S. and Macleod, D. (2010). „Post Legislative Scrutiny of the Land Reform (Scotland) Act 2003‟. Final Report, September 2010.
MacMillan, D. C., Leitch, K., Wightman, A. and Higgins, P. (2010). „The management and role of Highland sporting estates in the early 21st Century: the owner‟s view of a unique but contested form of land use‟. Scottish Geographical Journal 126 (1), pp. 24–40.

108
Mather, A. S. (1985) The rise and fall of government-assisted land settlement in Scotland. Land Use Policy 2(3), 217-24.
Maxwell, J. and Birnie, R. (2005). „Multi-purpose management in the mountains of Northern Europe – policies and perspectives‟. In: Thompson, D. B. A., Price, M. F. and Galbraith, C. A. (eds), Mountains of Northern Europe: Conservation, Management, People and Nature. TSO Scotland, Edinburgh, pp. 227–38.
McEwen, J. (1977) „Who Owns Scotland?: a study in land ownership‟. EUSPB, Edinburgh.
McKee, A., Warren, C., Glass, J. and Wagstaff, P. (2013). „The Scottish Private Estate‟. In: Glass, J., Price, M., Warren, C. and Scott, A. (eds. ) Lairds, Land and Sustainability: Scottish perspectives on upland management. Edinburgh University Press, pp. 63-85.
Mendola, M. and Simtowe, F. (2015) The Welfare Impact of Land Redistribution: Evidence from a Quasi-Experimental Initiative in Malawi World Development Vol. 72, pp. 53–69.
Millman, R. (1969) „The Marches of the Highland Estates. ‟ Scottish Geographical Magazine, 85: 172 – 181.
Millman, R. (1970) 'The Landed Estates of Northern Scotland'. Scottish Geographical Magazine, 86: 186 – 203.
Munton, R. (2009) Rural land ownership in the United Kingdom: changing patterns and future possibilities for land use Land Use Policy (2009), p. 26.
Northfield Committee (1979) Report of the Committee of Inquiry into the Acquisition and Occupancy of Agricultural Land. Cmnd 7599. HMSO, London.
Pillai, A. (2010). „Sustainable Rural Communities? A legal perspective on the community right to buy‟. Land Use Policy 27, pp. 898–905.
Scottish Affairs Committee (2014 and 2015) Eighth Report of Session 2013-14, Land Reform in Scotland: Interim and Final Reports.
Scottish Government (2014) A Consultation on the Future of Land Reform in Scotland.
Scottish Government (2015) Abstract of Scottish Agricultural Statistics 1982 to 2014.
Scottish Government Rural and Environment Science and Analytical Services (2012) Overview of Evidence on Land Reform in Scotland. Rural and Environmental Science and Analytical Services, Scottish Government. http://www.gov.scot/Publications/2012/07/3328/0
Scottish Natural Heritage (2009) SNH Heritage Land: Towards a land ownership policy and rationalisation of SNH‟s land holding. SNH, Inverness.
109
Sheppard, S. and Meitner, M. (2005). Using multi-criteria analysis and visualisation for sustainable forest management planning with stakeholder groups. Forest Ecology & Management 207: 171-187.
Skerratt, S., Atterton, J., Brodie, E., Carson, D., Heggie, R., McCracken, D., Thomson, S. and Woolvin, M. (2014) Rural Scotland in Focus 2014, Edinburgh: Rural Policy Centre, SRUC, Scotland's Rural College.
Slee, B., Blackstock, K, Brown, K., Dilley, R., Cook, P., Grieve, J. and Moxey, A. (2008). Monitoring and evaluating the effects of land reform on rural Scotland – a scoping study and impact assessment. Scottish Government Social Research, Edinburgh. 210 pp.
Swinnen, J., Ciaian, P. and d‟Artis, K (2008) Study on the Functioning of Land Markets in the EU Member States under the Influence of Measures Applied under the Common Agricultural Policy. Centre for European Policy Studies report to EU Commission, Directorate-General for Agriculture and Rural Development contract 30-CE-0165424/00-86
Sutherland, D. (1968) „The Landowners‟, Anthony Blond, London.
Sutherland, F. (2015) Remotely Excluded: Barriers Facing Scotland's Rural Consumers. Citizens Advice Scotland.
Thomson, S. (2010) How is Scotland‟s rural population changing? In: Skerratt, S., Hall, C., Lamprinopoulou, C., McCracken, D., Midgley, A., Price, M., Renwick, A., Revoredo, C., Thomson, S., Williams, F. and Wreford, A. (2010), Rural Scotland in Focus 2010, Edinburgh: Rural Policy Centre, Scottish Agricultural College.
Thomson, S. (2012) How have Scotland‟s rural population, economy and environment changed since the 2010 report? In: Skerratt, S., Atterton, J., Hall, C., McCracken, D., Renwick, A., Revoredo-Giha, C., Steinerowski, A., Thomson, S., Woolvin, M., Farrington, J, and Heesen, F. (2012), Rural Scotland in Focus 2012, Edinburgh: Rural Policy Centre, Scottish Agricultural College.
Thomson, S. and Carson, D. (2014) How Scotland‟s population, economic activity and housing needs are changing. In: Skerratt, S., Atterton, J., Brodie, E., Carson, D., Heggie, R., McCracken, D., Thomson, S. and Woolvin, M. (2014) Rural Scotland in Focus 2014, Edinburgh: Rural Policy Centre, SRUC, Scotland's Rural College.
Thomson, S., Moxey, A. and Butler, A. (2104) Scottish Agricultural Tenure Evidence Review. Scottish Government, Edinburgh.
Tracy, M. (1989) Agriculture in Western Europe: Challenge and Response 1880 - 1990, 3rd edition, Granada, St. Albans.
Warren, C. R. and McKee, A. (2011). „The Scottish Revolution? Evaluating the impacts of post devolution land reform‟. Scottish Geographical Journal 127 (1), pp. 17–39.

110
Warren, C. (2009). Managing Scotland‟s Environment. Edinburgh, Edinburgh University Press.
Wightman, A. (1996). Who Owns Scotland. Edinburgh, Canongate.
Wightman, A. (2001). „Land Reform Draft Bill Part II – Community Right-to-Buy‟. Caledonia Briefing No. 3. Caledonia Centre for Social Development.
Wightman, A. (2013) The Poor had no Lawyers: Who owns Scotland and how they got it. Birlinn, Edinburgh. 448 pp.
Woolvin, M. and Skerratt, S. (2012) The third sector and civil society in rural Scotland: present and future? In: Skerratt, S., Atterton, J., Hall, C., McCracken, D., Renwick, A., Revoredo-Giha, C., Steinerowski, A., Thomson, S., Woolvin, M., Farrington, J, and Heesen, F. (2012), Rural Scotland in Focus 2012, Edinburgh: Rural Policy Centre, Scottish Agricultural College.

researchsocial
© Crown copyright 2016You may re-use this information (excluding logos and images) free of charge in any format or medium, under the terms of the Open Government Licence. To view this licence, visit http://www.nationalarchives.gov.uk/doc/open-government-licence/or e-mail: [email protected] we have identified any third party copyright information you will need to obtain permission from the copyright holders concerned.
The views expressed in this report are those of the researcher anddo not necessarily represent those of the Scottish Government orScottish Ministers.
This document is also available from our website at www.gov.scot.
ISBN: 978-1-78652-092-0
E-book in EPUB formatISBN: 978-1-78652-312-9 (EPUB)
E-book in MOBI format ISBN: 978-1-78652-313-6 (MOBI)
The Scottish GovernmentSt Andrew’s HouseEdinburghEH1 3DG
Produced for the Scottish Government by APS Group ScotlandPPDAS66866 (06/16)Published by the Scottish Government, June 2016
Social Research seriesISSN 2045 6964ISBN 978-1-78652-092-0EPUB 978-1-78652-312-9MOBI 978-1-78652-313-6
Web and Print Publicationwww.gov.scot/socialresearch
PPDAS66866 (06/16)