the impact of covid-19 on uk online usage
TRANSCRIPT

The impact of Covid-19
on UK online usage
Julie Forey
Key changes April-May 2020

Summary: May 2020
Source: Comscore MMX Multi-Platform, Adults 18+, Apr & May 2020, UK
MMX Multi-Platform includes desktop browsing, desktop video streams, smartphone browsing & apps, tablet browsing & apps
• Following consecutive increases for time online in March and April, average time per person declined slightly in May – by 8
mins among adults. However, adults still spent 28 more minutes online in May compared to January.
• Many categories which were negatively impacted in March and April are showing signs of recovering in terms of visitor
numbers. Careers, property, maps, automotive and many retail categories experienced uplifts in May and even travel sites
halted their decline as people started to explore holiday options.
• Conversely, many categories which benefitted from Covid-19, in particular news lost a big proportion of the audience they
gained. This was particularly the case for the politics, technology and financial news publications which had done so well in
March and April.
• Food retail remained high despite a slight decline in visitors to the online supermarkets. Fast food & food delivery brands
increased audiences as restaurants remained closed. Sports retailers continued to do well – particularly those selling cycles
and cycle equipment. Online Home & DIY stores gained audience between April and May and online clothing outlets also
witnessed uplifts. Argos also added 1.3 million visitors between April and May and department stores began to recover.
• The automotive category also added audience between April and May – fuelled most by sites offering automotive classifieds
and information.

Time online
Key changes: Jan-May 2020
• Average time online peaked in April, surpassing 4 hours per day
• Between Jan & April, adults spent an extra 37 mins online per day
• Time dropped back slightly in May –average daily time online was down by 8 mins compared to April

Average time spent online per day by demos Jan-May 2020Time online decreased slightly in May after peaking in April
Source: Comscore MMX Multi-Platform, Adults 18+, Jan - May 2020, UK
MMX Multi-Platform includes desktop browsing, desktop video streams, smartphone browsing & apps, tablet browsing & apps
HR:MN
03:26
04:1003:55
03:4003:30
02:39
03:10
03:41
03:14
03:4704:02
05:04
04:2804:16
04:00
03:16
03:48
04:17
03:49
04:27
03:54
04:54
04:30
04:0903:53
03:01
00:00
03:39
04:09
00:00
03:38
04:24
18+ 18-24 25-34 35-44 45-54 55+ Males: 18+ Females:18+
Children:No
Children:Yes
Jan-20 Apr-20 May-20

Category recap
Jan-Apr 2020

Categories negatively impacted: Jan-Apr 2020

Major growth categories: Jan-Apr 2020

May: all categories
Key changes: Apr - May 2020
• Signs of recovery for many sectors which were most negatively impacted in March & April
• Sectors which benefitted starting to lose the audience they gained
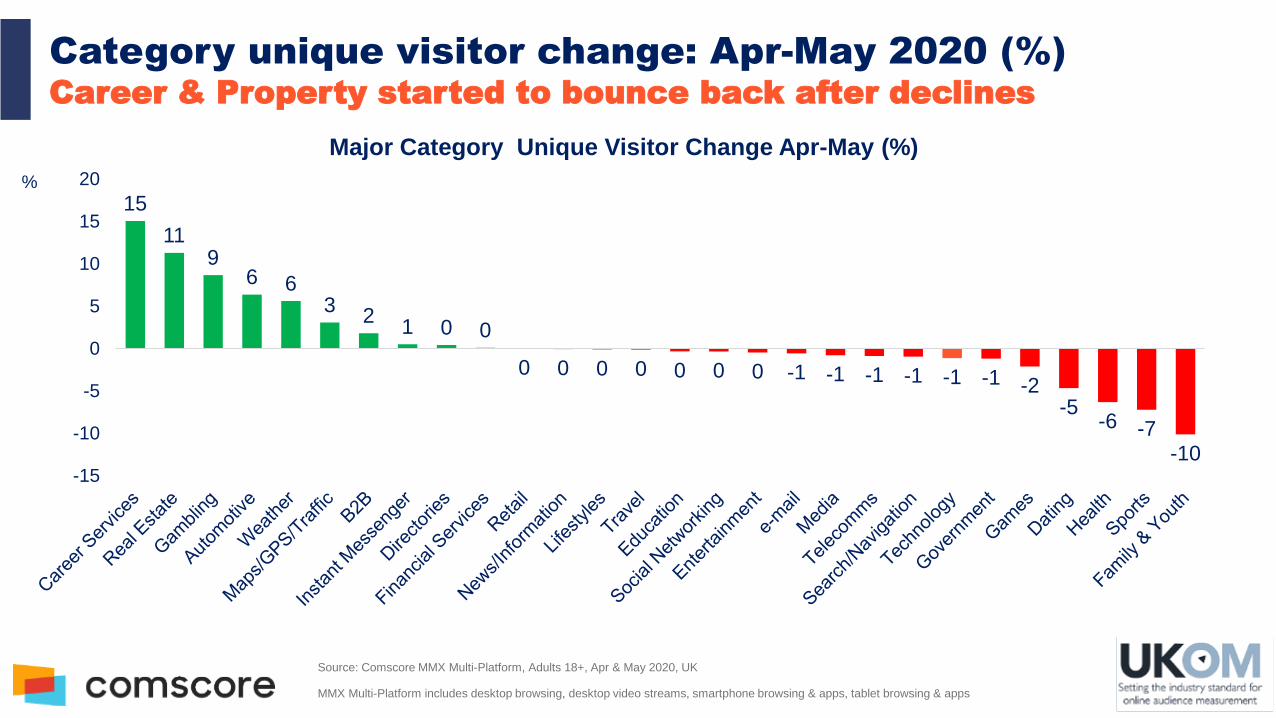
Category unique visitor change: Apr-May 2020 (%)Career & Property started to bounce back after declines
%
Source: Comscore MMX Multi-Platform, Adults 18+, Apr & May 2020, UK
MMX Multi-Platform includes desktop browsing, desktop video streams, smartphone browsing & apps, tablet browsing & apps
15
119
6 63
21 0 0
0 0 0 0 0 0 0 -1 -1 -1 -1 -1 -1 -2-5
-6 -7-10
-15
-10
-5
0
5
10
15
20
Major Category Unique Visitor Change Apr-May (%)

Category unique visitor change: Jan-May 2020 (millions)Evidence that many hard-hit sectors are starting to recover?
-1.0
-1.0
-1.1
-2.3
-2.6
-3.2
-3.9
-4.8
-5.5
-6.2
-6.4
-9.9
-10.6
-12.9
-13.4
1.8
1.8
0.4
3.0
1.0
3.7
1.4
2.8
1.4
0.9
0.5
0.3
0.5
0.4
1.2
Retail: Apparel
Gambling
Job Search
Career Services - All
Autos Manufacturer
Career Resources
Autos Information
Real Estate
Automotive - All
Maps/GPS/Traffic
Airlines
Hotel/Resort & Home Sharing
Ground/Cruise
Online Travel Agents
Travel - Information
Jan-Apr 2020 (millions) Apr-May 2020 (millions)
Source: Comscore MMX Multi-Platform, Adults 18+, Jan-May 2020, UK
MMX Multi-Platform includes desktop browsing, desktop video streams, smartphone browsing & apps, tablet browsing & apps

Category unique visitor change: Jan-May 2020 (millions)Growth categories lose customers gained during the Covid peak
Source: Comscore MMX Multi-Platform, Adults 18+, Jan -May 2020, UK
MMX Multi-Platform includes desktop browsing, desktop video streams, smartphone browsing & apps, tablet browsing & apps
April-May UV decline (millions) Jan-April UV Growth (Millions)
2.9
3.0
3.1
3.1
3.2
3.5
3.7
4.7
5.2
5.3
5.4
5.7
6.5
7.5
7.8
0.0
-0.8
-5.8
-0.5
-4.9
-1.9
0.0
-4.8
-2.7
-1.6
-4.9
-1.3
-2.3
-6.1
-6.5
Flowers/Gifts/Greetings
Games - All
Beauty/Fashion
Retail: Food/Grocery
Entertainment - News
Entertainment - Music
Home/Architecture
Health - Information
Family & Youth
Kids
Lifestyles - Food
Gaming Information
Politics
Business/Finance News
Technology News

Category time online change: Apr-May 2020 (%)
Property, maps, automotive all experienced uplifts
Source: Comscore MMX Multi-Platform, Adults 18+, Apr & May 2020, UK
MMX Multi-Platform includes desktop browsing, desktop video streams, smartphone browsing & apps, tablet browsing & apps
63
37 34
23 2013 12 12 10 8 7 6 5 3 3 2 2 2 0
-1 -2 -5 -6 -7 -8 -8 -8 -11 -14-20
0
20
40
60
80
100

Category unique visitor change: Jan-May 2020 (Millions)Categories which have continued to grow or decline
Source: Comscore MMX Multi-Platform, Adults 18+, Jan - May 2020, UK
MMX Multi-Platform includes desktop browsing, desktop video streams, smartphone browsing & apps, tablet browsing & apps
5.5
2.7
1.1
1.5
1.6
1.5
0.8
0.9
-0.6
-0.8
-0.5
-1.4
-1.7
-6.2
1.9
1.8
2.2
1.3
0.5
0.5
0.9
0.4
-0.3
-0.4
-1.0
-0.3
-0.1
-0.4
-8.0 -6.0 -4.0 -2.0 0.0 2.0 4.0 6.0 8.0 10.0
Weather
Retail:Home Furnishings
Retail:Sports/Outdoor
Department Stores/Malls
Business to Business
Retail: Health Care
Retail: Fragrances/Cosmetics
Retail: Consumer Electronics
Car Transportation
Dating
Financial Services & Advice
Coupons/Incentives
Retail: Jewellery/Luxury Goods
Retail: Tickets
Unique Visitor Change (Millions)
Jan-April
April-May

Growth categories
Apr-May 2020
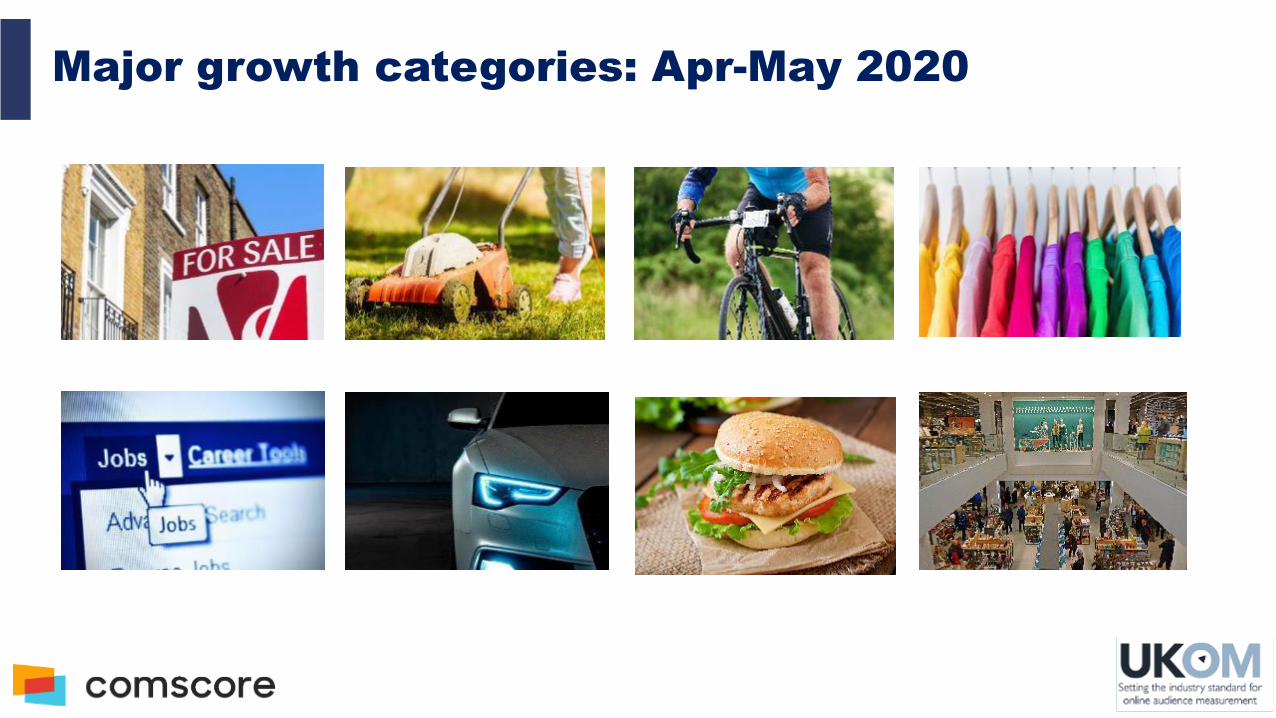
Major growth categories: Apr-May 2020

Careers: Apr-May 2020
Source: Comscore MMX Multi-Platform, Adults 18+, Jan – May 2020, UK
MMX Multi-Platform includes desktop browsing, desktop video streams, smartphone browsing & apps, tablet browsing & apps
Real Estate Jan-20 Apr-20 May-20Total Unique Visitors (m) 22.4 20.1 23.1
% Reach 49.8 44.3 51.0
Total Minutes (m) 840 420 476
Average Mins per Visitor 37.5 20.9 20.6
• Career Services added over 3million visitors between Apr and
May, the highest audience in 2020. However, total minutes
online and average minutes per visitor were low compared to
pre Covid-19 levels
• Indeed fuelled the increase by adding 3.7 million unique
visitors, an increase of 40% in the last month
12.2
9.4
13.1
Indeed
Unique Visitors
Jan-20 Apr-20 May-20

Real Estate: Apr-May 2020
Source: Comscore MMX Multi-Platform, Adults 18+, Jan – May 2020, UK
MMX Multi-Platform includes desktop browsing, desktop video streams, smartphone browsing & apps, tablet browsing & apps
Real Estate Jan-2020 Apr-20 May-20Total Unique Visitors (m) 29.2 24.4 27.1% Reach 64.8 53.7 59.8Total Minutes (MM) 1,197 723 1,175Average Mins per Visitor 41.1 29.7 43.4
• After losing 4.8m visitors between Jan and April, the real
estate category picked up in May, adding 2.8m.
16.80
5.73
2.02
0.96
0.67
0.21
19.35
6.83
2.61
1.32
0.94
0.44
Rightmove Sites
Zoopla Property Group
ONTHEMARKET.COM
Gumtree.com - Flat &Houses
Flatshare Ltd
PURPLEBRICKS.CO.UK
Unique Visitors (Millions)
Apr-2020 May-2020

Retail home: Apr-May 2020
Source: Comscore MMX Multi-Platform, Adults 18+, Jan – May 2020, UK
MMX Multi-Platform includes desktop browsing, desktop video streams, smartphone browsing & apps, tablet browsing & apps
Real Estate Jan-20 Apr-20 May-20Total Unique Visitors (m) 19.8 22.5 24.3% Reach 44.0 49.7 53.6Total Minutes (m) 297 465 510Average Mins per Visitor 15.0 20.6 21.0
6.8
3.7
3.4
2.5
9.1
0.7
4.3
4.8
8.7
5.4
4.3
3.2
9.6
1.1
4.7
5.2
DIY.COM
DUNELM.COM
IKEA
TOOLSTATION.COM
Wayfair
MADE.COM
HOMEBASE.CO.UK
WICKES.CO.UK
Unique Visitors (Millions)
Apr-2020 May-2020
• Home & DIY Retail has continued to grow month-on month
during the crisis. Visitors grew by 9% between April and May

Retail: sport/outdoor Apr-May 2020
Source: Comscore MMX Multi-Platform, Adults 18+, Jan – May 2020, UK
MMX Multi-Platform includes desktop browsing, desktop video streams, smartphone browsing & apps, tablet browsing & apps
* Halfords not listed in Sport/Outdoor Category but added for comparison due to ‘Cycle’ focus.
Real Estate Jan-2020 Apr-20 May-20Total Unique Visitors (m) 11.3 12.4 14.7% Reach 25.1 27.4 32.3Total Minutes (MM) 126 148 183Average Mins per Visitor 11.1 11.9 12.5
• Sport and outdoor retail has continued to grow month-on
month. Visitors grew by 18% between April and May - cycle
retailers contributed strongly.
4.58
2.82
4.33
0.75
0.87
0.07
0.30
0.02
0.55
5.57
3.67
5.16
1.10
1.18
0.34
0.50
0.20
0.69
JDSPORTS
Halfords
SPORTSDIRECT
GOOUTDOORS
Decathlon Group
REGATTA
TREDZ
MERLINCYCLES
EVANSCYCLES
Unique Visitors (Millions)
Apr-2020 May-2020
*

Retail: apparel Apr-May 2020
Source: Comscore MMX Multi-Platform, Adults 18+, Jan – May 2020, UK
MMX Multi-Platform includes desktop browsing, desktop video streams, smartphone browsing & apps, tablet browsing & apps
Real Estate Jan-2020 Apr-20 May-20Total Unique Visitors (m) 26.6 25.6 27.4% Reach 59.2 56.5 60.4Total Minutes (MM) 1,008 954 1,217Average Mins per Visitor 37.8 37.2 44.4
• The top 20 online clothing retails all experienced an uplift in
visitors in May, after the sector lost 2 million visitors between
Jan and March.
3.8
2.6
2.4
0.8
3.6
2.1
2.4
2.5
4.8
3.4
3.2
1.6
4.2
2.8
3.0
3.0
NEXT Group
MandMDirect Sites
She In Group
RIVERISLAND.COM
ASOS Plc
New Look Retailers
Nike
Adidas Group
Unique Visitors (Millions)
Apr-2020 May-2020

Automotive: Apr-May 2020
Source: Comscore MMX Multi-Platform, Adults 18+, Jan – May 2020, UK
MMX Multi-Platform includes desktop browsing, desktop video streams, smartphone browsing & apps, tablet browsing & apps
Real Estate Jan-20 Apr-20 May-20Total Unique Visitors (m) 27.31 21.84 23.23
% Reach 60.7 48.2 51.3
Total Minutes (m) 1,418 635 849
Average Mins per Visitor 51.9 29.1 36.5
• Growth between April and May came more from sites offering
automotive classifieds & information rather than manufacturers
5.9
2.2
2.0
1.1
0.1
7.3
3.1
2.5
1.5
0.4
Auto Trader
Gumtree.com - Motors
CarGurus
Cox Automotive
CARDEALERMAGAZINE.CO.UK
Unique Visitors (Millions)
Apr-2020 May-2020

Department stores: Apr-May 2020
Source: Comscore MMX Multi-Platform, Adults 18+, Jan – May 2020, UK
MMX Multi-Platform includes desktop browsing, desktop video streams, smartphone browsing & apps, tablet browsing & apps
Real Estate Jan-20 Apr-20 May-20Total Unique Visitors (m) 27.0 28.5 29.8
% Reach 60.1 62.9 65.6
Total Minutes (m) 645 760 834
Average Mins per Visitor 23.9 26.7 28.0
• The audience increased by 2.8 million between April and May
– Argos was a major contributor to growth after adding 1.3m
16.3
1.7
6.4
4.6
6.9
17.6
2.4
7.0
5.2
7.3
Argos
MATALAN
Marks&Spencer
BMSTORES
John Lewis
Unique Visitors (Millions)
Apr-2020 May-2020

Retail – Food (fast food*): Apr-May 2020
Source: Comscore MMX Multi-Platform, Adults 18+, Jan – May 2020, UK
MMX Multi-Platform includes desktop browsing, desktop video streams, smartphone browsing & apps, tablet browsing & apps
• Although, visitors to grocery stores declined by 0.5m between
April and May, fast food and food delivery continued to grow.
0.6
3.1
0.5
9.0
0.7
0.6
3.8
1.8
4.1
1.4
9.4
1.0
0.8
3.9
KFC
UBEREATS
MCDONALDS
Just-Eat Group
Hello Fresh
NANDOS
Deliveroo Sites
Unique Visitors (Millions)
Apr-2020 May-2020
Real Estate Jan-20 Apr-20 May-20Total Unique Visitors (m) 12.4 13.7 14.6
% Reach 27.6 30.3 32.3
Total Minutes (m) 264 341 390
Average Mins per Visitor 21.3 25 27
* Custom group above includes Top 8 fast food properties/media titles listed in Comscore by Unique visitors, 18+.

Growth brands & apps
Key changes: Apr-May 2020

Properties adding MOST unique visitors: Apr-May 2020Property, home & weather feature most in the top 20
Source: Comscore MMX Multi-Platform, Adults 18+, Apr & May 2020, UK
MMX Multi-Platform includes desktop browsing, desktop video streams, smartphone browsing & apps, tablet browsing & apps
3.73 3.57
2.55
1.97 1.83 1.81 1.80 1.67 1.58 1.54 1.53 1.371.20 1.16 1.10
Additional 18+ Unique Visitors (Millions): April to May 2020
• Axel Springer’s uplift is largely a result of Upday
• Braun contributed mostly to P&Gs uplift, adding 1.5m

Mobile apps adding MOST unique visitors: Apr-May 2020
No longer the huge uplifts experienced in March and April
Source: Comscore MMX Multi-Platform, Adults 18+, Apr & May 2020, UK
MMX Multi-Platform includes desktop browsing, desktop video streams, smartphone browsing & apps, tablet browsing & apps *Worldometers.info web domain has replaced the ‘FreeStar’ property in this analysis as Worldometers was driving the growth
1.8
1.21.1
0.90.8 0.8
0.5 0.5 0.4 0.4 0.4 0.4 0.4 0.4 0.4
Additional 18+ Unique Visitors (Millions): April to May 2020


About Comscore
Comscore (NASDAQ: SCOR) is the trusted partner for planning,
transacting and evaluating media across platforms. With a data
footprint that combines digital, linear TV, over-the-top and theatrical
viewership intelligence with advanced audience insights, Comscore
allows media buyers and sellers to quantify their multiscreen behavior
and make business decisions with confidence. A proven leader in
measuring digital and set-top box audiences and advertising at scale,
Comscore is the industry’s emerging, third-party source for reliable
and comprehensive cross-platform measurement. To learn more
about Comscore, please visit www.Comscore.com
Stay connected
Comscoreinc
@ComscoreEMEA
Comscore-inc

About UKOM
UKOM’s objective is to set and oversee the delivery of a credible industry
standard for digital audience measurement. That means quantifying
audiences in terms of people, not browsers or machines.
UKOM’s governance structure involves all sides of the industry, to ensure that Comscore
services meet our collective needs fully and fairly.
The whole UK media industry is involved in setting and overseeing UKOM standards
through its Technical and Commercial Committees, and the UKOM Board.
UKOM and Comscore work to an agreed process for product approval, from agreeing
concepts, to approved data publication, and continuous assessment.
Find out more at:
www.ukom.uk.net/