the impact of climate change on wind power production …€¦ · the impact of climate change on...
TRANSCRIPT
The impact of climate change on wind power production in Scotland
L. M. Miu School of GeoSciences, University of Edinburgh, UK
Abstract
Climate-forced changes in atmospheric circulation patterns can pose challenges to the development of an efficient wind energy industry. The predicted shifts in circumpolar storm tracks and pressure gradients have a significant effect on local wind resource availability, and impact the wind energy industry in a time of crucial expansion. This study uses Scotland as a case study to model the impact of the SRES A1B climate change scenario on current wind resource availability and wind power potential at two wind farms: Gordonbush (NE Scotland) and Dun Law (SE Scotland). The results predicted an increase of wind resource availability at Gordonbush, and a decrease at Dun Law, leading to corresponding changes in net annual electricity production: a 31.7% increase at Gordonbush and a 31.8% decrease at Dun Law by the year 2040. The majority of observed changes can be attributed to climate-forced changes in atmospheric circulation patterns; however, this research also shows the impact of turbine specifications and site characteristics on the vulnerability of wind power production to climate change. Further work is needed to establish a robust relationship between large-scale climate forcing and local wind resource availability, and to integrate this relationship into the assessment framework of on-shore wind farms around the world. Keywords: climate change, wind energy, atmospheric circulation, storm tracks, vulnerability.
1 Introduction
1.1 The impact of climate change on atmospheric circulation patterns
Recent modelling of global climate change (GCC) scenarios highlights distinctive impacts of temperature changes on atmospheric circulation patterns. These impacts are primarily related to changes in the atmospheric radiative budget
www.witpress.com, ISSN 1743-3541 (on-line) WIT Transactions on Ecology and The Environment, Vol 206, © 2015 WIT Press
doi:10.2495/ESS140211
Energy and Sustainability V: Special Contributions 239

(Reichler [1]; Cohen and Barlow [2]), but also in regional drivers such as sea-surface temperature (SST) and Arctic ice extent (Cohen and Barlow [2]; Harvey et al. [3]). Climate-forced changes in these drivers can have an indirect effect on position and activity of storm tracks and pressure systems, leading to changes in local weather patterns (Cohen and Barlow [2]). Climate-forced increases in the global radiative budget have dramatic implications for the large-scale pressure gradients driving atmospheric circulation (Rogers [4]), liable to cause changes in meridional storm tracks (Rogers [4]; Reichler [1]). Indeed, the modelling of various emissions scenarios reproduced a strong intensification and a pole-ward shift of the main Northern Hemisphere storm tracks (Kushner et al. [5]; Lorenz and DeWeaver [6]; Pryor et al. [7]; Pryor and Barthelmie [8]; Reichler [1]; Woollings et al. [9]; Harvey et al. [3]). Similarly, Southern hemisphere storm tracks have been shown to intensify in response to emissions scenarios, (Harvey et al. [3]). Other findings suggest that storm track shifts are caused by ‘tropical widening’, a phenomenon largely associated with radiative effects such as increased GHG concentrations (Lu et al. [10]). Other climate-driven changes such as SST increases and extratropical eddy activity have been proposed as explanations for the storm track shifts (Lorenz and DeWeaver [6]; Reichler [1]; Chen and Held [11]). Over the European continent, simulated climate change also caused an intensification of mid-latitude cyclone activity and a weakening of the Mediterranean wind field (Christensen et al. [12]; Pryor and Barthelmie [8]; Harvey et al. [3]). Although a large level of uncertainty remains, even small-scale shifts in the position of the North Atlantic storm track can significantly alter regional climates (Reichler [1]). Changes in the radiative balance also impact the temperature and humidity structures of air masses (Reichler [1]), and may cause changes in local air flow patterns.
1.2 Implications for global wind power production
1.2.1 Northern Europe In Northern Europe, climate forcing under the SRES A2 emissions scenario indicated a direct impact of the storm track shift on regional wind resource availability (fig. 1, Christensen et al. [12]), predicting increased wind speeds in northern Europe and reduced wind speeds in southern Europe. Other simulations predict variations in regional wind energy and wind power density consistent with these wind speed changes (Pryor and Barthelmie [8]; Pryor et al. [13]). The predicted increase in mean wind speed over northern Europe was also associated with an increase in extreme wind speeds (Pryor and Barthelmie [8]; STOWASUS-2001 Group [14]; Fischer-Bruns et al. [15]; Stone et al. [16]). High wind loads caused by extreme wind speeds can have a negative impact on the lifetime of wind turbine components (Manwell et al. [17]). In extreme cases, gale-force wind speeds directly impact the turbine integrity, causing significant economic losses, particularly to small wind farms.
www.witpress.com, ISSN 1743-3541 (on-line) WIT Transactions on Ecology and The Environment, Vol 206, © 2015 WIT Press
240 Energy and Sustainability V: Special Contributions

Figure 1: Simulated changes in mean 10-m level wind speed between 1961–1990 and 2071–2100, under the SRES A2 scenario. Source: Christensen et al. [12].
1.2.2 The UK and Ireland The UK and Ireland are both predicted to suffer slight changes in wind speed by the year 2050. The findings of Cradden [18] showed small changes (±5%) in UK mean annual wind speed by 2081–2100 under the SRES A2 scenario. Changes in mean wind speed were predicted to be more significant over the winter season than the summer season, but following a consistent spatial pattern, which predicted that northern and western Scotland were likely to suffer the most dramatic changes in annual wind speed. In Ireland, Gleeson et al. [19] found that annual wind speed decreased by between 0 and 1% for A1 and A2 scenarios, respectively. Wind energy was predicted to increase in winter and decrease in summer by the year 2050.
1.2.3 The US In the continental US, the findings of Breslow and Sailor [20] show a reduction in wind speed of up to 5% by the years 2050 and 2100, equivalent to a potential loss in national wind power generation of 30–40%. The results of this study highlight the sensitivity of wind power generation to small changes in wind speed, and place an important question mark on the risks of wind power production (Pryor et al. [13]).
www.witpress.com, ISSN 1743-3541 (on-line) WIT Transactions on Ecology and The Environment, Vol 206, © 2015 WIT Press
Energy and Sustainability V: Special Contributions 241
1.2.4 Brazil Simulated changes in the Brazilian climate predicted an overall improvement of the wind energy resource. Pereira de Lucena et al. [21] found that mean wind speed would increase by at least 5% by the year 2100, with the north-eastern region experiencing increases of over 20%, under the SRES A2 and B2 scenarios. Their findings also predicted an increase in the frequency of high wind speeds in coastal areas, forecasting a favourable outlook for offshore wind project development. Pereira et al. [22] also found a slight improvement of the Brazilian wind resource under the SRES A1B forcing scenario, particularly in the north-eastern area, where some regions were predicted to see a doubling of wind power density from historical values.
1.3 Implications for global wind power production and the Scottish context
The findings outlined above have profound implications for the long-term outlook of the global wind resource, which is of major importance to current onshore wind energy development. As is the case for all modern industry sectors, adaptation to climate change impacts on wind power production becomes of vital importance (IPCC [23]). Furthermore, climate change as an external factor must be viewed as an external factor, and considered in the feasibility analysis of large-scale wind energy projects. The Scottish wind energy industry is one of the fastest-growing in the world, supported by a naturally favourable climate of persistent high-speed winds. This industry is one of the major contributors to the achievement of the Scottish Government’s 2020 renewable energy target. The high sensitivity of wind energy prices introduces a new element of economic dependence on the reliability of the wind resource.
2 Case study: on-shore wind farms in Scotland
The purpose of this study is to assess the vulnerability of the Scottish wind resource to climate change, under the IPCC SRES A1B scenario of rapid economic growth with a balanced mix of renewable and non-renewable energy use (Nakicenovic and Swart [24]). Two Scottish wind farms were used as case studies to observe the magnitude of this vulnerability, and whether the latter differed between sites.
2.1 Materials and methods
Two wind farms in eastern Scotland: the Gordonbush wind farm (58°3'37.3"N, -3°57'21.5"), operating 35 Repower MM82/2050 turbines, with a total nominal capacity of 71.75 MW and an estimated annual output of 180 GWh, and the Dun Law wind farm (55°48'26.9"N, -2°51'37"), operating 26 Vestas V47/660 turbines, with a total nominal capacity of 17.1 MW and an estimated annual output of 17 GWh. Mean wind speed at 10 m a.g.l and wind direction were used to quantify the availability of the wind resource. These key wind statistics were modelled by
www.witpress.com, ISSN 1743-3541 (on-line) WIT Transactions on Ecology and The Environment, Vol 206, © 2015 WIT Press
242 Energy and Sustainability V: Special Contributions
the HadCM3 General Circulation Model (GCM) for a reference climate (baseline scenario), covering the years 1971–1990 and a future climate, covering the years 2020-2039, under the forcing of the SRES A1B GCC scenario. The results of the GCC projections were dynamically downscaled to a 25 x 25 km resolution, using the HadRM3 Regional Climate Model (RCM) (UK Met Office Hadley Centre [25]), and the data for the two grid cells corresponding to the wind farm locations were extracted. To reduce bias, the delta method was applied: percentage differences between modelled baseline and projected wind statistics were applied to historical data provided by the UK Met Office (UK Met Office Hadley Centre [25]). Additional variables were derived from the two key wind statistics: mean wind speed at hub height, inter-annual wind speed variability (% of annual wind speed), Weibull scale (m/s) and shape parameters (determining short-term wind speed variability), wind energy density (W/m2), extractable wind power (megawatts, MW) and net annual electricity production (AEP) (Gigawatt-hours, GWh). These additional statistics were derived using equations such as the vertical wind profile law, Betz’s law of wind energy conversion (Bergey [26]), power coefficient equations, vector scaling and the Pythagorean Theorem. Resulting values for wind statistics were extrapolated to actual wind farm areas and wind turbines, using WaSP (Wind Atlas Analysis and Application Program) v.8, and meteorological station and turbine data provided by the School of GeoSciences database. WaSP was also used to calculate the net AEP for each wind farm, in the baseline and projected scenarios.
2.2 Results
2.2.1 Wind speed at 10 m a.g.l At Gordonbush, annual mean wind speed was predicted to increase by 0.63%, while Dun Law saw a more dramatic decrease of 2.73% from baseline values.
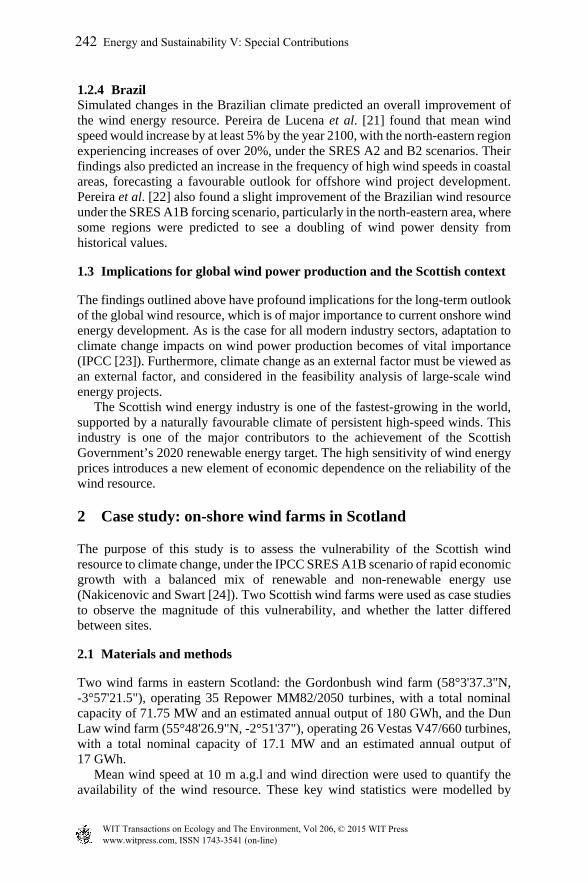
2.2.2 Wind speed at hub height Annual mean wind speed was predicted to increase by 0.09 m/s at Gordonbush, and decrease by 0.2 m/s at Dun Law (figs 2 and 3).
Figure 2: Predicted deviations in wind speed at hub height for Gordonbush.
0
5
10
15
20
Wind Speed (ms‐1) Baseline
Projected
www.witpress.com, ISSN 1743-3541 (on-line) WIT Transactions on Ecology and The Environment, Vol 206, © 2015 WIT Press
Energy and Sustainability V: Special Contributions 243
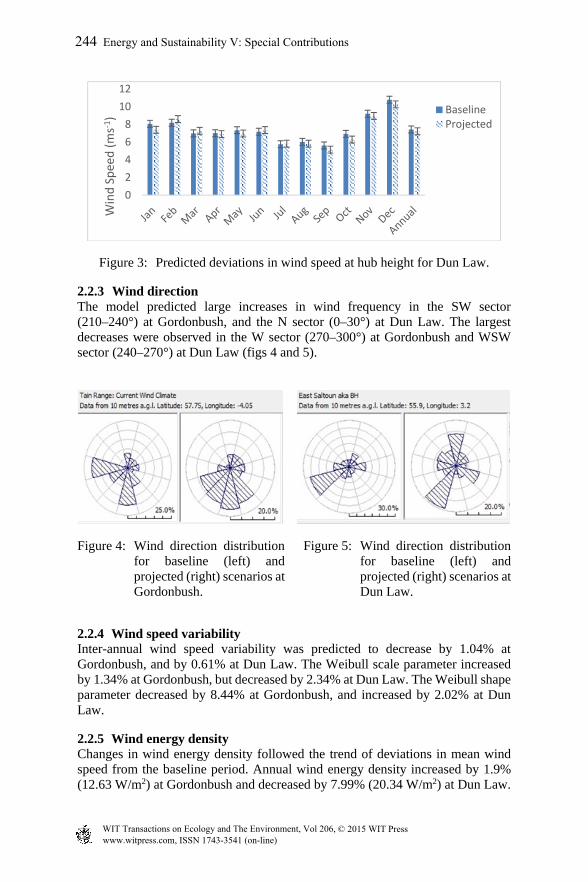
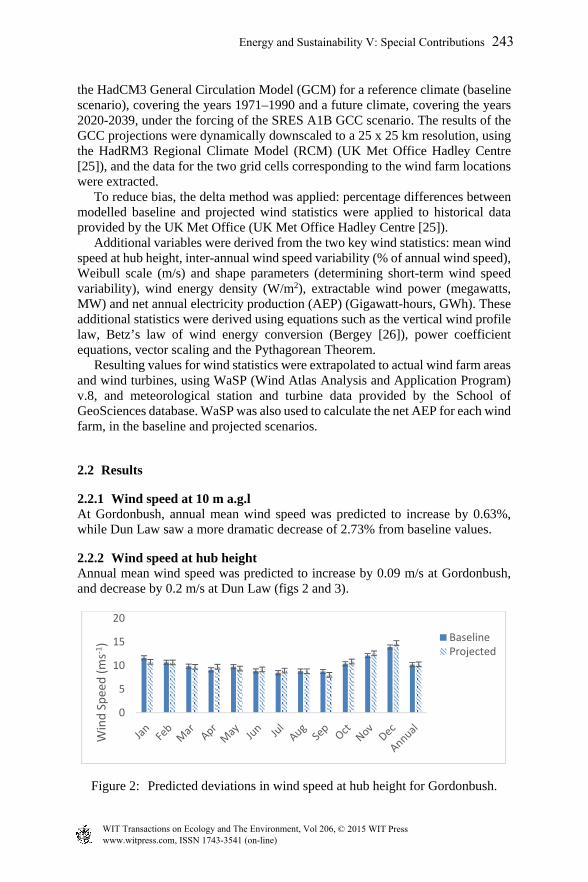
Figure 3: Predicted deviations in wind speed at hub height for Dun Law.
2.2.3 Wind direction The model predicted large increases in wind frequency in the SW sector (210–240°) at Gordonbush, and the N sector (0–30°) at Dun Law. The largest decreases were observed in the W sector (270–300°) at Gordonbush and WSW sector (240–270°) at Dun Law (figs 4 and 5).
Figure 4: Wind direction distribution for baseline (left) and projected (right) scenarios at Gordonbush.
Figure 5: Wind direction distribution for baseline (left) and projected (right) scenarios at Dun Law.
2.2.4 Wind speed variability Inter-annual wind speed variability was predicted to decrease by 1.04% at Gordonbush, and by 0.61% at Dun Law. The Weibull scale parameter increased by 1.34% at Gordonbush, but decreased by 2.34% at Dun Law. The Weibull shape parameter decreased by 8.44% at Gordonbush, and increased by 2.02% at Dun Law.
2.2.5 Wind energy density Changes in wind energy density followed the trend of deviations in mean wind speed from the baseline period. Annual wind energy density increased by 1.9% (12.63 W/m2) at Gordonbush and decreased by 7.99% (20.34 W/m2) at Dun Law.
0
2
4
6
8
10
12
Wind Speed (ms‐1)
BaselineProjected
www.witpress.com, ISSN 1743-3541 (on-line) WIT Transactions on Ecology and The Environment, Vol 206, © 2015 WIT Press
244 Energy and Sustainability V: Special Contributions
2.2.6 Extractable wind power The deviations in annual extractable wind power were nearly identical to those observed for wind energy density, with Dun Law suffering a decrease (2.69%) and Gordonbush a slight increase (1.9%) from baseline values. Overall, Gordonbush and Dun Law were predicted to lose extractable wind power in 7 and 8 out of 12 months, respectively.
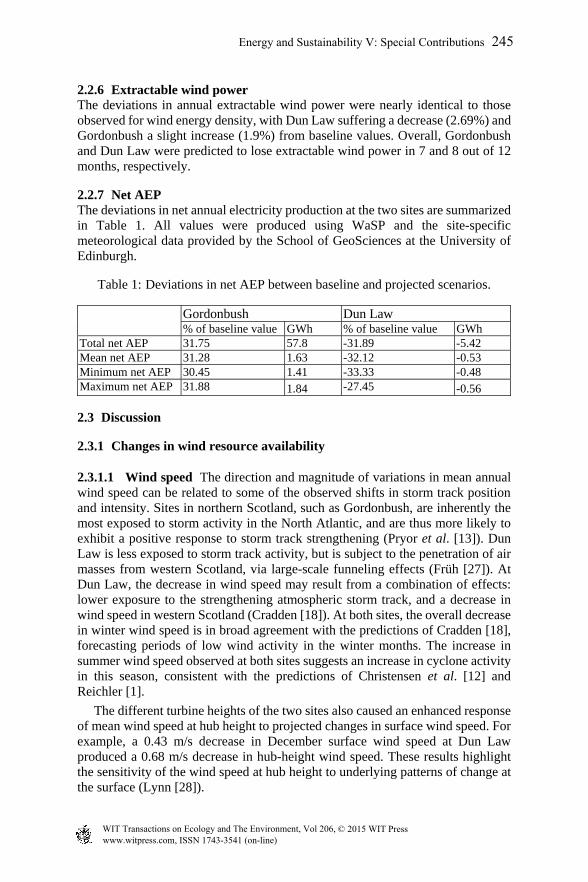
2.2.7 Net AEP The deviations in net annual electricity production at the two sites are summarized in Table 1. All values were produced using WaSP and the site-specific meteorological data provided by the School of GeoSciences at the University of Edinburgh.
Table 1: Deviations in net AEP between baseline and projected scenarios.
Gordonbush Dun Law % of baseline value GWh % of baseline value GWh
Total net AEP 31.75 57.8 -31.89 -5.42 Mean net AEP 31.28 1.63 -32.12 -0.53 Minimum net AEP 30.45 1.41 -33.33 -0.48 Maximum net AEP 31.88 1.84 -27.45 -0.56
2.3 Discussion
2.3.1 Changes in wind resource availability
2.3.1.1 Wind speed The direction and magnitude of variations in mean annual wind speed can be related to some of the observed shifts in storm track position and intensity. Sites in northern Scotland, such as Gordonbush, are inherently the most exposed to storm activity in the North Atlantic, and are thus more likely to exhibit a positive response to storm track strengthening (Pryor et al. [13]). Dun Law is less exposed to storm track activity, but is subject to the penetration of air masses from western Scotland, via large-scale funneling effects (Früh [27]). At Dun Law, the decrease in wind speed may result from a combination of effects: lower exposure to the strengthening atmospheric storm track, and a decrease in wind speed in western Scotland (Cradden [18]). At both sites, the overall decrease in winter wind speed is in broad agreement with the predictions of Cradden [18], forecasting periods of low wind activity in the winter months. The increase in summer wind speed observed at both sites suggests an increase in cyclone activity in this season, consistent with the predictions of Christensen et al. [12] and Reichler [1].
The different turbine heights of the two sites also caused an enhanced response of mean wind speed at hub height to projected changes in surface wind speed. For example, a 0.43 m/s decrease in December surface wind speed at Dun Law produced a 0.68 m/s decrease in hub-height wind speed. These results highlight the sensitivity of the wind speed at hub height to underlying patterns of change at the surface (Lynn [28]).
www.witpress.com, ISSN 1743-3541 (on-line) WIT Transactions on Ecology and The Environment, Vol 206, © 2015 WIT Press
Energy and Sustainability V: Special Contributions 245
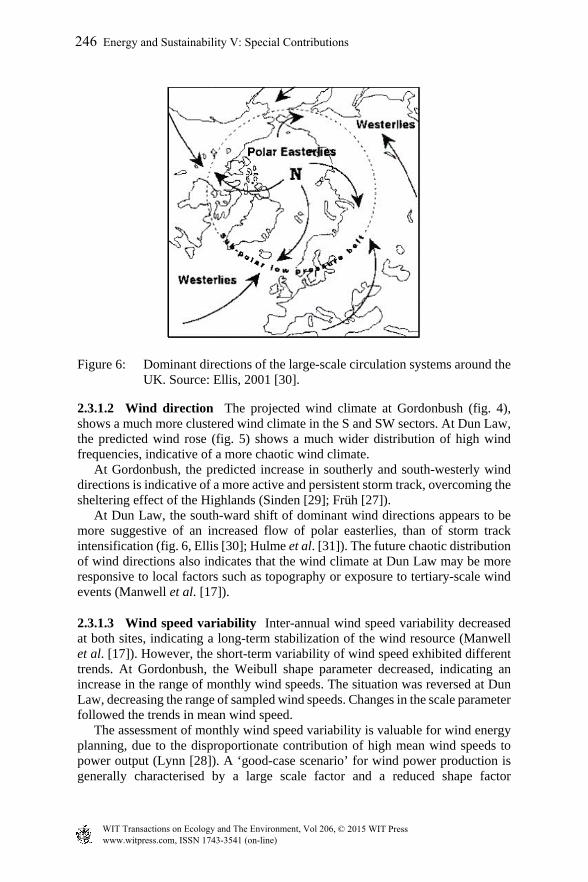
Figure 6: Dominant directions of the large-scale circulation systems around the UK. Source: Ellis, 2001 [30].
2.3.1.2 Wind direction The projected wind climate at Gordonbush (fig. 4), shows a much more clustered wind climate in the S and SW sectors. At Dun Law, the predicted wind rose (fig. 5) shows a much wider distribution of high wind frequencies, indicative of a more chaotic wind climate. At Gordonbush, the predicted increase in southerly and south-westerly wind directions is indicative of a more active and persistent storm track, overcoming the sheltering effect of the Highlands (Sinden [29]; Früh [27]). At Dun Law, the south-ward shift of dominant wind directions appears to be more suggestive of an increased flow of polar easterlies, than of storm track intensification (fig. 6, Ellis [30]; Hulme et al. [31]). The future chaotic distribution of wind directions also indicates that the wind climate at Dun Law may be more responsive to local factors such as topography or exposure to tertiary-scale wind events (Manwell et al. [17]).
2.3.1.3 Wind speed variability Inter-annual wind speed variability decreased at both sites, indicating a long-term stabilization of the wind resource (Manwell et al. [17]). However, the short-term variability of wind speed exhibited different trends. At Gordonbush, the Weibull shape parameter decreased, indicating an increase in the range of monthly wind speeds. The situation was reversed at Dun Law, decreasing the range of sampled wind speeds. Changes in the scale parameter followed the trends in mean wind speed. The assessment of monthly wind speed variability is valuable for wind energy planning, due to the disproportionate contribution of high mean wind speeds to power output (Lynn [28]). A ‘good-case scenario’ for wind power production is generally characterised by a large scale factor and a reduced shape factor
www.witpress.com, ISSN 1743-3541 (on-line) WIT Transactions on Ecology and The Environment, Vol 206, © 2015 WIT Press
246 Energy and Sustainability V: Special Contributions

(Munteanu et al. [32]). The observed changes in the Weibull parameters predict a long-term stabilization of the magnitude of the wind resource, forecasting a positive outlook for the productivity of Gordonbush, and a negative outlook for Dun Law.
2.3.2 Changes in wind power potential
2.3.2.1 Wind energy density The deviations in annual wind energy density were similar to the trends observed in mean wind speed at hub height. Wind energy density at Dun Law suffered a more dramatic change, with the percentage decrease in annual wind energy density being nearly 4 times the magnitude of the increase observed at Gordonbush. All deviations in seasonal and monthly wind energy density had a larger magnitude than corresponding deviations in mean wind speed. Together, these findings highlight the dominant effect of variations in mean wind speed in determining changes in wind energy density at both sites. They also highlight the sensitivity of wind energy density to small changes in mean wind speed. The vulnerability of wind energy density to changes in wind speed is an important component of long-term wind power potential, while its dependence on turbine hub height may influence decisions on the design and installation of wind turbines.
2.3.2.2 Extractable wind power The changes in annual extractable wind power were very similar to those in wind energy density at both sites. However, at Gordonbush, some of the changes in mean monthly wind speed at hub height were sufficiently large to force a change in the turbine power coefficients themselves. In particular, an 18.2% decrease in the December mean power coefficient forced a 2.7% decrease in extractable wind power, although wind energy density was predicted to increase in this month. Even when the power coefficients of the two turbine types were normalized to the hypothetical Betz limit (0.59), the magnitude of change in extractable wind power was larger for Repower MM82/2050 turbines than for Vestas V47/660. In particular, turbines with a larger rotor diameter are more sensitive to changes in the wind energy density, but also more efficient and in higher demand due to an escalation in the need for wind energy conversion efficiency (Lantz et al. [33]). This relationship introduces yet another design element into the response of extractable wind power to changes in wind energy density.
2.3.2.3 Net AEP and economic implications Both wind farms were predicted to suffer large changes in their net AEP, amounting to 57.4 GWh at Gordonbush and 5.42 GWh at Dun Law. In economic terms, these deviations are currently equivalent to an increase of annual gross profit of £95,284 at Gordonbush, and a decrease of £22,742 at Dun Law, by the year 2040 (Committee on Climate Change [34]). Actual economic implications are likely to be smaller, due to future decreases in electricity prices for on-shore wind power (predicted to drop from 8.3p/kWh to 6.3p/kWh by 2030) and variations in energy costs due to predicted changes in wind speed (estimated at a maximum 30% increase for a 10% reduction
www.witpress.com, ISSN 1743-3541 (on-line) WIT Transactions on Ecology and The Environment, Vol 206, © 2015 WIT Press
Energy and Sustainability V: Special Contributions 247

in wind speed, and a maximum 15% decrease for a 10% increase in wind speed) (Committee on Climate Change [34]; Cradden [18]).
3 Conclusion and recommendations
The wind resource availability of the study sites was impacted in different ways by climate forcing under the SRES A1B scenario. While some of the findings were consistent with predicted changes in the North Atlantic storm track, others suggested the interference of local-scale factors in determining future trends in wind speed and wind direction. Turbine design played an important role in determining the sensitivity of the two sites to changes in the wind resource, with higher, more powerful wind turbines being more sensitive to changes in mean wind speed. However, the uncertainty of wind resource estimation is still significant, due to downscaling errors. Further research on the response of atmospheric circulation to climate change, as well as the refining of RCM predictions and increased data accessibility, are the key to developing a transferrable methodology of impact assessment for the wind resource. The analysis of the Scottish wind industry’s long-term reliability must take into account the potential impacts of climate change, as well as the options for adaptation. Its wind energy industry becomes another victim in the case for robust assessment of local-scale effects of climate change. Scotland and other frontrunners in development of one of the world’s most popular forms of renewable energy must review their planning and assessment frameworks for wind power production, and explore options for mitigation and adaptation to a potential reduction in energy security.
References
[1] Reichler, T., Changes in the atmospheric circulation as indicator of climate change (Chapter 7). Climate change: Observed impacts on planet Earth, ed. Letcher, T.M. 2009, Elsevier BV: Netherlands, pp. 145-164, 2009.
[2] Cohen, J. & Barlow, M., The NAO, the AO, and Global Warming: How Closely Related? Journal of Climate, 18, pp. 4498-4513, 2005.
[3] Harvey, B.J., Shaffrey, L.C., Woollings, T.J., Zappa, G. & Hodges, K.I., How large are projected 21st century storm track changes? Geophysical Research Letters, 39, L18707, 2012.
[4] Rogers, J. C., North Atlantic storm track variability and its association to the North Atlantic Oscillation and climate variability of northern Europe. Journal of Climate, 10(7), pp. 1635-1647, 1997.
[5] Kushner, P.J., Held, I.M., & Delworth, T.L., Southern-hemisphere atmospheric circulation response to global warming. Journal of Climate, 14, pp. 2238-2249, 2001.
[6] Lorenz, D. J., & DeWeaver, E. T., Tropopause height and zonal wind response to global warming in the IPCC scenario integrations. Journal of Geophysical Research: Atmospheres 112(D10), pp. 119-130, 2007.
www.witpress.com, ISSN 1743-3541 (on-line) WIT Transactions on Ecology and The Environment, Vol 206, © 2015 WIT Press
248 Energy and Sustainability V: Special Contributions
[7] Pryor, S. C., Schoof, J. T., & Barthelmie, R. J., Climate change impacts on wind speeds and wind energy density in northern Europe: empirical downscaling of multiple AOGCMs. Climate Research, 29, pp. 183-198, 2005.
[8] Pryor, S. C. & Barthelmie, R. J, Climate change impacts on wind energy: A review. Renewable and sustainable energy reviews, 14(1), pp. 430-437, 2010.
[9] Woollings, T., Gregory, J.M., Pinto, J.G., Reyers, M. & Brayshaw, D.J, Response of the North Atlantic storm track to climate change shaped by ocean-atmosphere coupling. Nature Geoscience 5, pp. 313-317, 2012.
[10] Lu, J., Deser, C., & Reichler, T., Cause of the widening of the tropical belt since 1958. Geophysical Research Letters, 36(3), L03803, 2009.
[11] Chen, G. & Held, I. M, Phase speed spectra and the recent poleward shift of Southern Hemisphere surface westerlies. Geophysical Research Letters, 34(21), pp. 805-810, 2007.
[12] Christensen, J.H., Hewitson, B., Busuioc, A., Chen, A., Gao, X., Held, I., Jones, R., Kolli, R.K., Kwon, W.-T., Laprise, R., Magaña Rueda, V., Mearns, L., Menéndez, C.G., Räisänen, J., Rinke, A., Sarr, A. & Whetton, P., Climate Change 2007: Working Group 1: The Physical Science Basis (Chapter 11), eds. Solomon, S., D. Qin, M. Manning, Z. Chen, M. Marquis, K.B., Averyt, M. Tignor & H.L. Miller, Contribution of Working Group I to the Fourth Assessment Report of the Intergovernmental Panel on Climate Change. Cambridge University Press: Cambridge, United Kingdom and New York, NY, USA. pp. 847-940, 2007.
[13] Pryor, S. C., Barthelmie, R. J., & Kjellström, E., Potential climate change impact on wind energy resources in northern Europe: analyses using a regional climate model. Climate Dynamics, 25(7-8), pp. 815-835, 2005.
[14] STOWASUS-2001 Group, STOWASUS Final Report, Danish Meteorological Institute publication: Copenhagen, 2001.
[15] Fischer-Bruns, I., Von Storch, H., González-Rouco, J. F., Zorita, E., Modelling the variability of midlatitude storm activity on decadal to century time scales. Climate Dynamics, 25(5), pp. 461-476, 2005.
[16] Stone, D. A., Weaver, A. J., & Stouffer, R. J., 2001. Projection of climate change onto modes of atmospheric variability. Journal of Climate, 14(17), 3551-3565.
[17] Manwell, J. F., McGowan, J.G. & Rogers, A.L., Wind Energy Explained: Theory, Design and Application. John Wiley & Sons: Chichester, 2002.
[18] Cradden, L.C., Impact of climate change on wind energy generation in the UK. Thesis (PhD), University of Edinburgh: Edinburgh, 2010.
[19] Gleeson, E., McGrath R. & Treanor M., Ireland’s climate: the road ahead. Met Éireann: Dublin, 2013.
[20] Breslow, P. B., & Sailor, D. J., Vulnerability of wind power resources to climate change in the continental United States. Renewable Energy 27(4), pp. 585-598, 2002.
www.witpress.com, ISSN 1743-3541 (on-line) WIT Transactions on Ecology and The Environment, Vol 206, © 2015 WIT Press
Energy and Sustainability V: Special Contributions 249
[21] Pereira de Lucena, A.F., Szklo, A.S., Schaeffer, R. & Dutra, R.M., The vulnerability of wind power to climate change in Brazil. Renewable Energy 35(5), pp. 904-912, 2010.
[22] Pereira, E. B., Martins, F. R., Pes, M. P., da Cruz Segundo, E. I. & Lyra, A. D. A., The impacts of global climate changes on the wind power density in Brazil. Renewable Energy 49, pp. 107-110, 2013.
[23] Intergovernmental Panel on Climate Change (IPCC), Climate Change 2013: The Physical Science Basis (Chapter 11). Contribution of Working Group I to the Fifth Assessment Report of the Intergovernmental Panel on Climate Change eds. Stocker, T.F., Qin, D., Plattner, G.-K., Tignor, M., Allen, S.K., Boschung, J., Nauels, A., Xia, Y., Bex, V., Midgley, P.M., Cambridge University Press: Cambridge, 2013.
[24] Nakicenovic, N., & Swart, R., Emissions Scenarios: A Special Report of Working Group III of the Intergovernmental Panel on Climate Change. Cambridge University Press: Cambridge, 2002.
[25] UK Met Office Hadley Centre, HadRM3-PPE-UK Model Data. http://badc.nerc.ac.uk/view/badc.nerc.ac.uk__ATOM__dataent_12178667495226008.
[26] Bergey, K. H., The Lanchester-Betz limit (energy conversion efficiency factor for windmills). Journal of Energy, 3(6), pp. 382-384, 1979.
[27] Früh, W. G., Long-term wind resource and uncertainty estimation using wind records from Scotland as example. Renewable Energy 50, pp. 1014-1026, 2013.
[28] Lynn, P. A., Onshore and Offshore Wind Energy: An Introduction, John Wiley & Sons: Chichester, 2011.
[29] Sinden, G., Characteristics of the UK wind resource: Long-term patterns and relationship to electricity demand. Energy Policy, 35(1), pp. 112-127, 2007.
[30] Ellis, N., Changes in the Scottish climate: meteorological observations over the last century and future scenarios for Scotland. Scottish Natural Heritage: Information and Advisory Note 149, 2001.
[31] Hulme, M., Crossley, J. & Lu, X., An exploration of regional climate change scenarios for Scotland, The Scottish Executive Central Research Unit: Edinburgh, 2001.
[32] Munteanu, I., Bratcu, A. I., Cutululis, N. A., & Ceanga, E., Optimal control of wind energy systems: towards a global approach, Springer: Netherlands, 2008.
[33] Lantz, E., Wiser, R., & Hand, M., IEA Wind Task 26: The Past and Future Cost of Wind Energy, Work Package 2, Report No. NREL/TP-6A20-53510, National Renewable Energy Laboratory: Golden, CO., 2012.
[34] Committee on Climate Change, The Renewable Energy Review, Committee on Climate Change: London, 2011.
www.witpress.com, ISSN 1743-3541 (on-line) WIT Transactions on Ecology and The Environment, Vol 206, © 2015 WIT Press
250 Energy and Sustainability V: Special Contributions