the impact of cctv: fourteen case...
TRANSCRIPT

The impact of CCTV: fourteencase studies
Home Office Online Report 15/05
Martin Gill Angela SpriggsJenna Allen Javier ArgomanizJane Bryan Patricia JessimanDeena Kara Jonathan KilworthRoss Little Daniel SwainSam Waples
The views expressed in this report are those of the authors, not necessarily those of the Home Office (nor do theyreflect Government policy).

The impact of CCTV: fourteen case studies Martin Gill Angela Spriggs Jenna Allen Javier Argomaniz Jane Bryan Patricia Jessiman Deena Kara Jonathan Kilworth Ross Little Daniel Swain Sam Waples
Online Report 15/05

ii
Contents Executive summary iii Introduction 1
Miscellaneous areas 2 City Outskirts 2 Hawkeye 5 City Hospital 8 Urban centres 10 South City 10 Shire Town 12 Market Town 14 Borough Town 16 Residential areas 17 Northern Estate 17 Westcap Estate 20 Eastcap Estate 21 Dual Estate 23 Southcap Estate 27 Borough 28 Deploy Estate 30
Conclusion 34 References 37
Tables 1. City Outskirts – change in crime rates one year after installation 4
2. Hawkeye – change in vehicle crime rates in the target and control areas one 6 year after installation 3. Hawkeye – changes in vehicle crime in high, medium and low risk car parks 7 4. City Hospital – change in overall crime and specific crimes in the target and 9 control areas six months after installation 5. South City – change in overall crime, fear of crime and crime types one year after 11 CCTV installation 6. Shire Town – change in overall crime, fear of crime and crime types one year after 13 CCTV installation 7. Market Town – change in overall crime, fear of crime and crime types one year after 15 CCTV installation 8. Borough Town – change in overall crime, fear of crime and crime types one year after 17 CCTV installation 9. Northern Estate – change in overall crime, fear of crime and crime types one year 19 after CCTV installation

iii
10. Westcap Estate – change in overall crime, fear of crime and crime types one year 21 after CCTV installation 11. Eastcap Estate – change in overall crime, fear of crime and crime types one year 22 after CCTV installation 12. Dual Estate – change in overall crime, fear of crime and crime types one year after 25 CCTV installation (Area A) 13. Dual Estate – change in overall crime, fear of crime and crime types one year after 26 CCTV installation (Area B) 14. Southcap Estate – change in overall crime, fear of crime and crime types one year 28 after CCTV installation 15. Borough – change in overall crime and targeted offences since installation in 30 Borough 16. Deploy Estate – change in overall crime and targeted offences one year after 32 CCTV installation 17. Summary of main findings in each case study 34
Figures 1. City Outskirts – comparison of crime trends in the target, buffer and division 3 2. Hawkeye – changes in crime levels against number of car parks with CCTV 6 3. City Hospital – comparison of crime trends in target, buffer and division 9 4. South City – recorded crime trends in the target, buffer and division 11 5. Shire Town – recorded crime trends in the target, buffer and division 13 6. Market Town – recorded crime trends in the target, buffer and control 15 7. Borough Town – recorded crime trends in the target, buffer and control 16 8. Northern Estate – recorded crime trends in the target, buffer and control 18 9. Northern Estate – the influence of burglary on total relevant crime 19 10. Eastcap Estate – recorded crime trends in the target, control, buffer and division 22 11. Dual Estate – recorded crime trends in the target, buffer and control 24 12. Dual Estate – crime trends in Areas A and B 24 13. Southcap Estate – recorded crime trends in the target and control 27 14. Borough – recorded crime trends in target, buffer and division 29 15. Deploy Estate – recorded crime trends in the target, control, buffer and division 31

iv
Executive summary
The following outlines the main findings from fourteen CCTV systems1 evaluated as part of a National Evaluation of CCTV (see Gill et al, 2005), describing the nuances behind each system. Each CCTV system defined its own objectives, although all the evaluated systems had two broad aims: to reduce crime and the fear of crime.
The findings of each area are shown below:
City outskirts Forty-seven cameras were added to an existing city centre system, extending it into adjacent residential and industrial areas, and linking it with a hospital system. Following its installation, recorded crime decreased by 28 per cent and this decrease was statistically significantly greater than the control, suggesting that CCTV could have impacted on crime in this area. Acquisitive crimes decreased, whilst more spontaneous offences showed an increase. Worry about being a victim of crime also reduced. A number of confounding factors occurred during the evaluation period, which could partially explain the decrease in crime and worry about crime.
Hawkeye Six hundred and forty-six cameras were installed in 60 public transport car parks in London, 58 of which were subject to evaluation. Vehicle crime saw a statistically significant 73 per cent decrease following camera installation. Car parks experienced different levels of crime and those with a high and medium level of risk of crime suffered statistically significant 80 per cent and 62 per cent decreases, whereas low risk car parks showed a non-statistically significant 37 per cent decrease. The sharp decrease in crime demonstrated a deterrent effect. The police were also provided with evidence allowing them to arrest known offenders, showing that the system also worked by detection. The car parks all had a high level of coverage (all but two achieving 100 per cent coverage) and the majority were self-contained, with the entrances and exits covered by the cameras.
City Hospital Sixty-seven cameras were installed in and around this Accident and Emergency hospital, nine of which were installed in the parking areas, and these form the focus of the evaluation. Crime rates were low before the implementation of CCTV, and a non-significant reduction in the overall level of crime after CCTV implementation was primarily caused by a reduction in vehicle crime. Although the cameras may have deterred vehicle crime, this reduction may also be attributed to other crime reduction measures.
South City Fifty-one cameras extended an existing city centre CCTV scheme. Crime reduced in the intervention area, but this was non-significant and reflected a general trend across the division, rather than any specific impact of CCTV. The number of public order incidents increased and this could be attributed to increased reporting of incidents by the control room. Although fear of crime reduced after CCTV was implemented, the findings suggested that this was not caused by the presence of cameras, but other crime reduction measures operating in the area.
1 The names of each system have been anonymised to protect the identity of the projects subject to evaluation. The exception is Hawkeye; a number of distinguishing features render any attempts to anonymise this project futile. Details of each project can be found in the main text

v
Shire Town Twelve new cameras were installed in a town centre. There was an overall decrease in recorded crime following the installation of CCTV, but these were non-significant and could be attributed to fluctuating crime trends experienced across the division as a whole. Worry about being a victim of crime decreased, but at the same rate as in the control area.
Market Town Two new cameras were added to an existing seven camera system in this town centre, and all were monitored from a new control room. There was an overall increase in recorded crime following the installation of CCTV, but this could be attributed to random fluctuations experienced across the division as a whole.
Borough Town Forty cameras were installed on eight poles in this borough town, extending an existing system. Following their installation, overall crime remained unchanged, and any change in individual offences was attributed to changing local crime trends and other initiatives operating in the area, one of which possibly caused displacement into the target area, thus increasing crime.
Northern Estate Eleven cameras were installed in a small residential area in the north of England. Following their installation, overall crime showed a non-significant reduction, which could not be attributed to CCTV. However, there was a noticeable reduction in burglary, which was shown to have displaced into areas outside the cameras’ viewshed. Feelings of safety increased in comparison to the control area.
Westcap Estate Eight cameras were installed in an inner city residential estate. After the installation of CCTV, there was a statistically significant reduction in worry about being a victim of crime. Although there was a high level of awareness of the cameras, the presence of cameras did little to reassure residents. A reduction in reported victimisation most likely accounted for the decrease in worry about crime.
Eastcap Estate Ten cameras were installed in a small residential area. Following their installation, overall crime levels increased in line with the control, although reductions in specific targeted offences, especially vehicle crime, suggest a deterrent effect. Fear of crime levels remained unchanged.
Dual Estate
This system covered two discrete residential areas of different sizes, and a main road. The residential areas form the focus of the evaluation, both of which had five cameras installed. Recorded crime reduced in the small residential area (Area A), which had a high level of camera coverage, and there was a high level of awareness of the cameras. However, small numbers of crimes were involved. Conversely, crime increased in the larger residential area (Area B), which had just six per cent of coverage. Hotspot coverage of the shopping parade saw a 49 per cent decrease in shoplifting in this area. Worry about being a victim of crime reduced in both areas, significantly so in Area B compared to the control area.
vi
Southcap Estate One hundred and forty-eight cameras were installed in an inner city residential area, covering a number of residential blocks, and installed over a number of months. Recorded crime saw an increase in the areas covered for the longest period. The overall increase consists of a rise in violence against the person, which can be accounted for by a change in Home Office counting rules. Worry about being a victim of crime reduced in the target area, but at a similar rate as the control area.
Borough This redeployable system consisted of eight cameras, which could be installed anywhere within the borough, on any streetlighting column. During the evaluation period, there were 22 deployments varying in length from two weeks to several months. Recorded crime increased across the target, buffer and division area following the installation of CCTV. The scheme did not appear to achieve its aim of tackling sporadic crime hot spot areas, as crime increased in the target areas at a higher rate than the division. The presence of the cameras initially reassured local residents, but these positive effects reduced when youths realised the cameras were on auto-pan, thus were no longer deterred by their presence.
Deploy Estate
This redeployable2 system of eleven cameras on nineteen poles covered five discrete areas. Taken as a whole, crime increased following its installation, accounted for largely by the increase in criminal damage in one part of the area covered. This could be attributed in part to a number of acts of vandalism against the cameras themselves. The proportion of individuals who worried about being a victim of crime was largely unchanged in both surveyed areas before and after CCTV installation.
2 Redeployable systems are where cameras can be moved to different locations, and remain fixed for certain periods of time; in this case, the eleven cameras can be deployed on any of the nineteen poles.

1
Introduction Fourteen CCTV systems throughout England were evaluated as part of the National Evaluation of CCTV, as detailed in the report ‘Assessing the Impact of CCTV’ (see Gill et al, 2005). Briefly, this involved the following:
• a process evaluation of each CCTV system;
• a analysis of the technical characteristics of each system;
• a in-depth evaluation of operation of each control room;
• a measure of change in recorded crime rates and the fear of crime;3
• a cost effectiveness analysis.
In theory, this provided a unique opportunity to assess the impact of CCTV and the contexts within which it works best. In practice, it presented a challenge. Although all systems had a common characteristic (CCTV), each was unique, lending further support to the assertion that CCTV should not be discussed as if it were a single measure (Gill et al, 2005).
This uniqueness was reflected in the impact of each system. Where the main report provided details of some general patterns in outcomes, these were difficult to identify and did limited justice to the nuances behind each system. Most importantly, each had specific objectives and this analysis allows one to assess whether these have been achieved. Most had two broad aims in common: to reduce crime and the fear of crime. Some schemes targeted specific offences, and some projects had more far-reaching ideas, such as regenerating the town centre or decreasing the number of empty properties in an area. Some described how the system might achieve a reduction in crime, citing increased detection and deterrence as secondary objectives.
Second, it allows a detailed analysis of the mechanisms behind each system. If there was a reduction in crime, what can be said about the way that CCTV worked to produce this reduction? If there was an increase in crime, can anything be said about the way that worked? What does the time series analysis convey about the way that a system worked? Have confounding factors been taken into consideration? Where the level of crime in the target area was too low to provide statistically significant results, does that mean that nothing can be said about the way that the system worked, or whether it worked at all?
Furthermore, while overall crime patterns lead one to the inevitable conclusion that CCTV was not very effective, it says nothing about the reasons behind this, and the general crime patterns in the area before and after CCTV.
This report describes the findings in each area, looking at the minutiae behind each system. Its purpose is not to provide the evidence from which patterns can be identified, but rather the opposite. It provides depth and detail. Hence the reader is encouraged to look at each individual case study as just that. However, there comes a word of caution. Although the report provides an opportunity to draw tentative conclusions from small changes in crime, it must be borne in mind that there were a limited number of instances where the changes were statistically significant and in fact, all changes might be attributed to chance rather than to any characteristic of the system. In addition more detailed information on three separate schemes (South City, Hawkeye and Northern Estate) can be found in online reports (Gill et al, 2005c, Gill et al, 2005d and Gill et al, 2005e respectively). These reports have been produced to provide additional insights for CCTV systems located in city centres, car parks and residential areas.
3 The methodology used is described in ‘Technical Annex: Methods used in Assessing the Impact of CCTV’ (Gill et al, 2005b).

2
The study uses an analysis of police recorded crime statistics, public attitude surveys and control room data to assess whether objectives were met. The discussion also takes into account the characteristics of each scheme that determined success or failure. Systems are ordered according to their location, based on the following:
• those systems that were installed across a range of different types of area, such as car parks, hospitals and light industrial areas, as was described in the main report, CCTV worked most effectively in this environment;
• those installed in town centres;
• those installed in residential areas.
Miscellaneous areas City Outskirts
The City Outskirts system comprised 47 pan, tilt and zoom5 (PTZ) cameras, which extended both the existing city centre and hospital systems, and provided 68 per cent coverage of the target area. This included a residential area, an arboretum, a hospital and a light industrial area.
Objectives
The objectives were to increase arrests of local offenders by extending surveillance into an area used as an escape route from the city centre, and to address a range of crime problems experienced in this area. In particular, the scheme was intended to address fear of crime, drug offences, violence against the person, burglary, theft, prostitution and vehicle crime.
Has it worked?
Following the installation of CCTV, overall crime in the target area showed a statistically significant fall of 28 per cent relative to the division as a whole, which showed a 1 per cent decline.
5 Pan, tilt and zoom cameras are those which can be moved both horizontally and vertically and have a variable focal length so that it can be made to focus on both close and distant objects in any direction.

3
Figure 1: City Outskirts – comparison of crime trends in the target, buffer and division
Figure 1 shows the crime trends in the target area relative to the division and the buffer area, also displaying the date of installation of camera poles and the live date of the system. Six months before poles were erected in the target area, the entire division experienced a large increase in crime, coinciding with the introduction of new Home Office counting rules.6 Three months before the poles were erected, crime levels began to decline across the division, but in the target area the downward trend accelerated markedly after the poles were erected. By the time the cameras went fully live, crime levels in the target area had fallen below their pre-peak levels, though on the general reducing trend of pre-peak values, whereas in the buffer area and the division as a whole, crime levels remained high. The figure also shows that crime in the target area remained on a pronounced downward trend right to the end of the analysis period, whereas in the whole division rates appeared to stabilise.
Greater scrutiny of the time series trends suggest that the ‘significant’ change in crime levels should be treated with caution. There was a large increase in recorded crime in the target area in the year preceding CCTV installation, and the level reverted to its earlier trend at the end of the series. Furthermore, divisional crime began to fall before the introduction of CCTV, whereas crime in the target area began to fall somewhat later, indicating that the large effect size is not necessarily attributable to CCTV.
Table 1 below shows changes in overall crime, fear of crime and targeted offences within the target and divisional area one year after installation.
6 The pattern of crime changes in the relevant police force preclude the adjustment of crime levels to take into account changes in counting rules (Simmons et al 2003).

4
Table 1: City Outskirts – change in crime rates one year after installation
Objective: to reduce...
Target absolute change
Target change (%)
Division absolute change
Division change (%)
Is this significant?
Relative effect size
Confidence limits
Overall crime 1,526 – 1,098
-28 37,838 – 37,594
-1 Yes 1.38 1.13 - 1.63
Burglary 161-131 -19 7,164 – 6,442
-10 No 1.11 0.73 - 1.48
Drug offences 44-45 2 799 - 730 -9 No 0.89 0.42 - 1.36
Sexual offences 18-17 -6 374-391 5 No 1.11 0.35 - 1.87
Theft (not including vehicle crime)
568-329 -42 9129-8,610
-6 Yes 1.63 1.19 - 2.01
Vehicle crime 279-126 -55 6,993 – 6,412
-8 Yes 2.03 1.35 - 2.73
Violence against the person
176-224 27 4,955 – 6,234
26 No 0.99 0.66 - 1.32
Fear of crime* NA -14 NA NA NA – no control
NA NA
*Data from public attitude survey: worry about being a victim of crime
CCTV appears to have produced significant falls in the rates of vehicle crime (55%) and theft (42%), and therefore to have met two of its specific objectives. A fall of 19 per cent in burglary rates fell short of statistical significance. Outside the specific objectives, there was also a 14 per cent decline in criminal damage, although this was non-significant.
However, confounding factors may have affected two of the observed results. During the peak in crime levels, changes in parking regulations reduced the number of potential target vehicles and consequently the opportunities for vehicle crime. At about the same time, an anti-burglary initiative was carried out in the target area and part of the buffer area, which may have contributed to the reduction in burglary.
The rise in violence against the person was similar to the divisional increase and reflects the national trend; CCTV appears not to have impacted appreciably on this offence. There was no change in the number of drug offences in the target area, but a small increase relative to the division. This could reflect a failure of the system to address drug-related crime, although it is possible that a greater number of offences came to the attention of the police as a result of CCTV presence. The system was installed in a known drugs hotspot and the police carried out a number of special operations targeted at known drug dealers in the area. A major drugs den was closed down in the target area, and crime mapping in this spot shows a significant fall in drugs offences, theft and robbery.
The new CCTV system was supported by improvements in lighting in November 2002, which coincided with the decrease in crime levels. A further two potential confounding factors; major renovation works to the arboretum (March 2003) and the establishment of a visual communication link between the control room and the police (April 2003), occurred immediately after the system went live. However, by this time crime levels were already levelling out, and CCTV may still be credited with the earlier effect on crime levels in the area.
Crime in a third of a mile buffer area immediately surrounding the target area fell by nine per cent, and this indicates possible diffusion of benefits of the CCTV scheme. However, crime levels in a further concentric ring increased by seven per cent, suggesting a potential displacement effect. However, this could also be attributed to other initiatives in the target area and surrounding buffer zone.

5
The public attitude survey suggests fear of crime reduced by 14 percentage points during the time of the evaluation, although it is unlikely that this could be attributed solely to the CCTV system. Those who were aware of the system’s existence were slightly more likely to worry about being a victim of crime than those who were not. Again, other confounding factors could have explained the decrease in the fear of crime and almost certainly contributed to it. There was a reduction in the number of people avoiding particular sections of the target area, for example, a reduction in the number of people who did not visit the arboretum, where major renovation works had begun. The reduction in worry about crime was likely to be the result of reported victimisation. Those who were victimised were more likely to be worried about crime; this relationship was shown to be significant (<.01).
It is also of interest that, while recorded crime levels showed a decrease of 28 per cent, the quantity of incidents reported by public attitude survey respondents increased by 11 per cent. The survey was carried out on a section of the total target area, but when recorded crime levels for the survey area were measured they still showed a decrease of 20 per cent. A breakdown in the reported incident types revealed that harassment levels increased by 12 per cent in the post-CCTV survey, and because the recorded crime figures do not include harassment as a category, this begins to explain the increase in reported victimisation in comparison with the decrease in recorded crime. It also suggests that although more significant crimes have been reduced, the low level crimes have not.
Factors helping performance
The bulk of the observed reduction in crime occurred between the time at which installation works began and the live date of the system, suggesting that the installation works provided a deterrence to local offenders, which was sustained, although not increased, following the installation of the cameras. The initial impact was dramatic.
It is unlikely that the system led to increased detection of crime through immediate arrest, as operators found it difficult to pursue targets and therefore to direct officers to them. Suspects were frequently lost because of obstructions caused by foliage and the operators’ lack of expertise and local geographical knowledge. Finally, the relationship with the police precluded the immediate deployment of police resources, and operators did not often call the police to obtain a response.
It is possible that some crimes could have been detected through provision of evidence to the police about known offenders leading to increased arrests. An average of eight tapes per month were passed on to the police. However, interviews with the police suggest that the quality of the evidence provided was poor.
Hawkeye
Hawkeye comprised the installation of 646 static cameras across 60 public transport car parks in London, of which 556 cameras in 587 car parks were evaluated. In each car park the cameras provided 95-100 per cent coverage. They were installed across the car parks over a period of 17 months.
Objectives
The system objectives were to reduce vehicle crime and fear of crime. No attempt was made to measure the latter.8
7 For which consistent crime data were available. 8 It was impracticable to measure change in fear of crime for two main reasons: some car parks were fitted with cameras before the evaluation period began; and it was not possible to identify suitable car parks prior to the implementation period (taking into account relative victimisation levels) because crime levels were not available.

6
Has it worked?
Across all car parks, vehicle crime levels showed a substantial reduction following the installation of CCTV. Table 2 shows the change in overall crime and targeted offences within the target area one year after installation.
Table 2: Hawkeye – change in vehicle crime rates in the target and control areas one year after installation
Objective: to reduce...
Target absolute change
Target change (%)
Control absolute change9
Control change (%)
Is this significant?
Relative effect size
Confidence intervals
Vehicle crime 794 - 214
-73 12,590-11,335
-10 Yes 3.34 2.86 – 3.91
Vehicle crime levels for a period of one year prior to installation10 were 73 per cent greater than those for a period of one year following full implementation of the system. This reduction, in fact, contributed to a 45 per cent reduction in vehicle crime in the London Underground area as a whole, according to the 2002/03 British Transport Police (BTP) Annual Statistics Report.11 BTP recorded vehicle crime outside the scheme stayed constant at approximately 450 crimes per year. In the absence of a suitable control for the Hawkeye system, the changes in vehicle crime were compared with the changes in BTP–recorded vehicle crime for England (excluding London Underground). A statistically significant decrease in vehicle crime within the target area was found.
Figure 2 shows the level of crime mapped against the number of car parks which were live at any one time. It shows a steady decrease in crime as car parks became live, suggesting that the reduction in vehicle crime could be attributed to the installation of CCTV.
Figure 2: Hawkeye – changes in crime levels against number of car parks with CCTV
9 Hawkeye control figures were based upon vehicle crime for England (excluding London Underground). See, http://www.btp.police.uk/documents/AnnualStatistics02-03.pdf 10 (Dec 00-Nov 01) representing a period before cameras were installed in any car parks. 11 http://www.btp.police.uk/documents/AnnualStatistics02-03.pdf

7
There were large discrepancies in the size of the crime problems across the 58 car parks. Some suffered virtually no crime even before CCTV was installed, whereas others suffered a high level. Therefore, the car parks were divided into high12, medium13 or low risk14 based on the size of the crime problem before CCTV was installed. Table 3 below shows the change in each type of car park.
Table 3: Hawkeye – changes in vehicle crime in high, medium and low risk car parks
Type of car park
Target absolute change
Target change (%)
Control absolute change
Control change (%)
Is this significant?
Relative effect size
Confidence intervals
High risk 555-111 -80 12,590-11,335
-10 Yes 4.5 3.65-5.55
Medium risk 190-72 -62 12,590-11,335
-10 Yes 2.38 1.8-3.14
Low risk 49-31 -37 12590-11335
-10 No 1.42 0.9-2.25
The reduction in vehicle crime was greater (80%) for those car parks that had the highest ratio of crimes per parking space before the cameras were installed, and this was statistically significant. These tended to be the larger car parks, which suffered greater absolute levels of crime.
Medium and low risk car parks showed smaller, but nevertheless marked decreases (62% and 37% respectively). However, in low risk car parks, this was not significant. These tended to consist of fewer spaces and suffered small absolute levels of crime prior to installation. Hence a 37 per cent reduction in crime represents a decrease from only 49 to 31 offences in a year across all 21 low risk car parks.
Looking at the types of crime separately, the category with the largest reduction was criminal damage to vehicles (82%) followed by theft from motor vehicles (72%) and theft of motor vehicles (67%). Numbers for the ‘taking without consent’ category were negligible (less than 10 for the whole after period).
These reductions can be attributable to the CCTV systems rather than potential confounding factors, such as resurfacing, fencing and lighting upgrades, as the latter were generally implemented after the system went live and when the general crime level was already low.
Factors helping or hindering performance
The CCTV system operated through a mixture of detection and deterrence. A large number of offences were detected by provision of photographic evidence about (known) prolific offenders known to the police, leading to their subsequent arrest and prosecution. Interviews with Vehicle Squad police officers indicated that a few prolific offenders were responsible for several offences and the new CCTV system provided additional evidence, which allowed multiple offences to be attributed to one offender, thus increasing the detection rate.
Control room records showed that during the period of the evaluation 14 pieces of evidence per month were provided to the police, which related to a significant proportion of the 4415 crimes per month experienced in the car parks. Interviews with police suggested that the majority of images were of good enough quality to be of assistance. Further evidence that the use of CCTV footage increased the detection of crime was provided by the police detection
12 0.24-1.48 offences per space in the year preceding CCTV installation 13 0.8-0.23 crimes per space in the year preceding CCTV installation 14 0-0.7 crime per space in the year preceding CCTV installation. 15 Based on pre-installation figures.

8
rate for criminal offences, which increased from 9 per cent in 2001-02 to 27 per cent in 2003-0416.
However, the detection effect can account for only a proportion of the total reduction in crime. The operators were keen, but there were not many screens for viewing images from all the cameras and, since car parks were not that busy, viewing them was very routine and even boring. It is likely, therefore, that the system also worked through deterrence. The cameras were of box design, were clearly visible, and there was clear signage at the entrance to each car park. Furthermore, there was 95-100 per cent coverage of the car parks, and it would be very apparent to offenders that they could not easily avoid the cameras’ gaze.
City Hospital
The City Hospital system consisted of 67 cameras, with 9 PTZ cameras situated in the external grounds of a hospital. The nine cameras were subject to evaluation as they addressed the principal objective of the system; to reduce vehicle crime. The external cameras covered 76 per cent of the target area.
Objectives
The main objective of the system was to assist the police in reducing vehicle crime in the hospital grounds and adjacent streets, and to reduce the number of incidents of anti-social behaviour and burglary. A further objective was to safeguard patients and staff, and to reduce their fear of crime.
Has it worked?
Comparing levels of change of crime levels one year before and one year after CCTV installation showed a 37 per cent reduction from 41 to 26 offences. When this period was shortened to six months, there was a 33 per cent decrease from 18 to 12 offences, although this was non-significant compared with the division.17
Figure 3 shows the crime trends in the target area over time in the target18, division and buffer area. It can be seen that although there is decrease in crime in the target area, this trend began prior to the installation of cameras and levelled off once the cameras were installed, before increasing again.
16 Statistics provided to the fieldworker. 17 However, this should be treated with caution, there was a huge difference in the internal variation and in the number of offences between the division and the target area, which made the results unreliable. 18 Smoothed data has also been presented for the target area. The high variation within the data obscures any trends that may be present; smoothing helps identify these. The smoothed data are based upon but does not represent the actual data.

9
Figure 3: City Hospital – comparison of crime trends in target, buffer and division
Table 4 highlights the changes in overall crime and targeted offences in the target area six months19 before and after the installation of CCTV.
Table 4: City Hospital – change in overall crime and specific crimes in the target and control areas six months after installation
Objective: To reduce...
Absolute target change
Target change (%)
Absolute control change
Control change (%)
Is this significant?
Relative effect size
Confidence intervals
Overall crime 18 - 12 -33 5,202 –
4,889 -6 No 1.4 0 - 3.41
Burglary 3 - 6 100 1545 –
1,209 -22 NA NA NA
Vehicle Crime 12 – 3 -75 1,201 –
1,486 24 NA NA NA
Violence against the person
0 - 1 NA 524 - 488 -7 NA NA NA
It is immediately apparent that crime rates were low before CCTV was installed; therefore any conclusions must be made with caution. Notwithstanding this, the results revealed that vehicle crime was reduced by 75 per cent (12 to 3 offences) in the six months after the cameras were installed and this decrease accounted for the reduction in total crime. However, the small sample sizes make it difficult to draw valid conclusions from the data concerning the effect of CCTV20 on any other offences such as burglary and violence against the person.
It is unlikely that the cameras alone produced any potential impact. CCTV was erected alongside a new perimeter fence and improved lighting, and the combined effect could have acted as an effective deterrent to offenders. The fencing limited easy access to the site by the
19 Crime data were available for this period. 20 Hence NA in Table 4. For the remainder of this report where the sample is less than 30 in either the before or after periods in the target area NA is quoted.

10
six main gates. Cameras were pole–mounted at each gate and were highly visible. The new lighting improved visibility across the majority of the site, again acting as a deterrent.
Moreover, the reduction in crime could be attributed solely to other confounding factors as would be suggested by the downward trend in crime levels beginning before CCTV was installed. Local police conducted two high profile operations consisting of the distribution of leaflets and posters warning people of the dangers of vehicle crime. These began in March 2002, which was before the peak in crime, but gathered momentum. In May 2003, the police mounted a high visibility operation, the effect of which could have produced the peak.
Factors helping or hindering performance
The system is only being evaluated for its deterrent effect, as the system was not fully operational during the time of the evaluation due to delays in implementation. The cameras were in position by the end of March 2003, but they were only partially monitored from August 2003, within the police control room. The police only monitored the area when directed by police radio or through a rolling brief displayed on a personal computer. It was never monitored from the local authority control room, as was first envisaged. As it was not monitored effectively, the scheme did not increase reporting of offences from control room activities. Neither did it increase reporting of offences by members of the public as the help-points and panic alarms did not become operational during the evaluation period.
The police had limited access to the recorded images as data sharing protocols had not been finalised between the Hospital Trust and the police. As a result, the police were not able to effectively use footage from the system to investigate offences.
Urban centres South City
Fifty-one PTZ cameras were linked to an existing 16-camera system. The new cameras extended the existing scheme from the retail areas to the main entertainment areas in the city centre, and provided 72 per cent coverage of the target area.
Objectives
The operational objectives of the project were to assist the police and other relevant agencies in detecting, deterring and preventing crime, particularly alcohol-related offences, and the reduction in fear of crime.
Has it worked?
Crime in the target area was reduced by ten per cent in the year after the cameras were installed, and by 12 per cent within the division as a whole. Figure 4 shows the crime trends in the target, division and buffer areas before and after the scheme became operational. Both target and division showed similar crime trends: a steady decrease in crime months before the system began implementation, stabilising at a lower level in the period after the cameras went live. This suggests that overall reduction in crime is due more to general trends than to any specific impact of the cameras.

11
Figure 4: South City – recorded crime trends in the target, buffer and division
Table 5 below shows the change in overall crime, fear of crime and targeted offences in the target area and division one year after the installation.
Table 5: South City - change in overall crime, fear of crime and crime types one year after CCTV installation
Objective: to reduce...
Absolute target Change
Target change (%)
Absolute division change
Division change (%)
Is this significant?
Relative effect size
Confidence limits
Overall crime 5,106 – 4,584
-10 77,530 – 68,432
-12 No 0.98 0.83 - 1.13
Criminal damage
360 - 288 -20 10,343 – 11,036
7 Yes 1.33 1.25 - 1.43
Drug offences 16 - 34 113 700– 964 38 No 0.65 0.18-1.12 Public order offences
58 - 95 64 163 - 200 23 No 0.75 0.4 - 1.10
Shoplifting 119 - 148 24 3,431 – 3,561
4 No 0.83 0.44 – 1.23
Vehicle crime 1,641 - 972 - 41 17,825 – 12,912
-28 No 1.22 0.84 - 1.64
Violence against person
497 - 660 33 7,620 – 10,512
38 No 1.04 0.79 - 1.28
Fear of crime* NA -6 (day) / -8 (night)
NA NA Yes** NA NA
* Data from Public Attitude Survey: Worry about being a victim of crime ** Significant reduction between first and second stage surveys. Vehicle crime dropped by 41 per cent compared to a 28 per cent fall across the division, but the difference was not statistically significant. This change could mainly be attributed to a reduction in vehicle offences in car parks not covered by the cameras under evaluation.

12
Analysis of other individual crime categories revealed that a number of changes followed the divisional trend, including violence against the person (up by a third) and public order offences (up by nearly two-thirds). The larger increase of public order offences opposed to violence against the person may be the result of ambiguity amongst the operators and police when recording the type of offence. However, a third offence, which could be deemed to be alcohol-related in town centres, criminal damage, dropped by a fifth and this was statistically significantly different from the division’s seven per cent increase. While the CCTV cameras may have contributed to this fall, it could also be attributed to the presence of city centre wardens who started patrolling the target area three months after the scheme went live.
Other initiatives operating in the area have impacted on specific crime categories. Drug offences increased by 74 per cent compared to a 38 per cent rise in the division and although again this was not statistically significant and the numbers were small. The increase in reported drug offences can be linked to two police operations tackling drug related offences in the target area.
Interestingly, rates of shoplifting increased by 24 per cent following the introduction of CCTV compared to a four per cent increase in the division area. The CCTV system, alongside the use of Retail Radio begins to explain this increase as it enhances the operator’s ability to track offenders, thus increasing the chances of apprehension.
According to the figures emerging from the surveys, the proportion of respondents who worried about being a victim of crime while visiting the city centre during daylight and after dark reduced significantly, by six and eight percentage points. The proportion of people who said they avoid places in the city centre also fell by nine percentage points and the proportion of people reporting feeling unsafe when moving around the area fell by six percentage points. These are positive results, but CCTV was at best a contributory factor. As evidence, only 20 per cent of the respondents considered that ‘with CCTV, the level of crime has generally got lower’ and just 17 per cent agreed that CCTV was making a difference in the places visited within the city centre.
In all, 65 per cent of the survey respondents knew about the cameras and they were as worried of being victims of crime as those who were unaware of the system. A more plausible explanation for the reduction in fear of crime may be that the police actively tackled aggressive begging in the city centre. Other factors such as city centre wardens, police operations to tackle drug offences and street robbery may have influenced the reduction in fear of crime.
Factors helping or hindering performance
Although the scheme has had no overall impact on the total number of recorded crimes in the target area, it may have increased reporting of public order offences. This could be caused by a monitoring bias in the control room, which causes operators to pay particular attention to the bars and clubs at night.
Two other factors could account for the increase in recorded public order offences. First, a police officer stationed in the control room on a Friday and Saturday night was able to generate a rapid police response to incidents. The operators and police officers were able to work together with officers in the target area, particularly at busy weekend periods between 20.00 and 04.00. The police also had access to the digitally stored images at their station and were able to download images to help them identify and apprehend offenders, particularly those committing assault, robbery, and public order offences.
Shire Town
Shire Town is a town centre with alcohol-related crime problems. It was covered by a new twelve PTZ camera system, which provided 76 per cent coverage of the target area.
Aims and Objectives
The objectives of the systems were to reduce alcohol-related crime and disorder, shoplifting and vehicle crime, and also to reduce the fear of crime amongst users of the area.

13
Has CCTV worked?
The target area crime level decreased by four per cent, while the division experienced a three per cent increase, in the twelve months following installation of CCTV. However, neither the decrease in crime in Shire Town nor the difference between the target and the division were statistically significant. Figure 5 shows the crime trends in the target area relative to the division and the buffer area, also displaying the date of installation of camera poles and the live date of the system. It reveals a steady trend in recorded crime over time in both the target and the division areas.
Figure 5: Shire Town – recorded crime trends in the target, buffer and division
Table 6 shows the change in overall crime, fear of crime and targeted offences within the target and divisional area one year after installation.
Table 6: Shire Town – change in overall crime, fear of crime and crime types one year after CCTV installation
Objective: To reduce...
Absolute change
Target change (%)
Division absolute change
Division change (%)
Is this significant?
Relative effect size
Confidence limits
Overall crime 352 - 338 -4 19052 - 19701
3 No 1.08 0.81 - 1.33
Criminal damage 74 - 48 -35 4217 - 4422
5 No 1.62 0.91 - 2.33
Public order 12 - 10 -17 86 - 105 22 NA NA NA
Shoplifting 69 – 87 26 823 - 848 3 No 0.82 0.25 - 1.38
Vehicle crime 42 - 53 26 4072 - 3827
-6 No 0.74 0.31 - 1.18
Violence against person
44 - 32 -27 2660 - 3588
35 No 1.85 0.93 - 2.78
Fear of crime* NA -3 (day) / -12 (night)
NA -1(day) / -13 (night)
NA 0.81 (night)
0.49 - 1.33(night)
*Data from public attitude survey: worry about being a victim of crime

14
The data reveals that alcohol-related offences showed a decrease (public order (-17%); violence against the person (-27%); and criminal damage (-35%). Vehicle crime and shoplifting both experienced a 26 per cent increase. However, none of the results were statistically significant. Furthermore, the numbers in each category are relatively small and the patterns of change contradict both national trends and those in other systems; for instance, violent crime decreases, whereas premeditated crime, such as vehicle crime increased. Therefore, the changes witnessed could be attributed to random factors, rather than to any characteristic of the CCTV system.
With regard to fear of crime, it can be seen that there was a reduction in the proportion of respondents that worry about being a victim of crime during the day and the night. However, this could not be attributed to the CCTV system for two reasons. First, the reductions were in line with similar reductions in the control area. Second, those individuals who were aware of the cameras were marginally more likely to worry about crime than those who were not. The reduction in fear of crime could be attributed to levels of victimisation, as 56 per cent of those who were victimised worried about crime at night compared with only 18 per cent of those who were not victimised. There is a statistically significant (<.01) relationship between reported victimisation and worry about crime.
Factors helping or hindering performance
Although the findings should be treated with caution, the possible decrease in overall crime suggests that the system might have acted as a deterrent, although no reduction in premeditated offences, such as vehicle crime was shown.
Any increases in crime could potentially be explained by increased reporting of incidents to the police. The control room has connections with Retail Radio, which brings shoplifting to the attention of the control room.
Market Town
The Market Town system consisted of nine cameras seven existing cameras, of which four had replacement lenses, and two newly introduced cameras. They were monitored from the same new control room as the Shire Town cameras. None of the cameras had previously been monitored consistently.
Objectives
The objectives of the system were to reduce alcohol-related crime and disorder, retail crime, vehicle crime, and also to reduce the fear of crime amongst users of the area.
Has it worked?
Market Town experienced an 18 per cent increase in overall crime, which was higher than the three per cent increase in the division. The differences between the target and division areas were non-significant. However, examination of crime trends shows that this could be attributable to random fluctuation of crime levels. Figure 6 shows the crime trends in the target area relative to the division and the buffer area, showing the live date of the system.

15
Figure 6: Market Town – recorded crime trends in the target, buffer and division.
Table 7 shows the change in overall crime and targeted offences within the target and divisional areas one year after installation.
Table 7: Market Town – change in overall crime, fear of crime and crime types one year after CCTV installation
Objective: To reduce...
Target absolute change
Target change (%)
Control absolute change
Division change (%)
Is this significant?
Relative effect size
Confidence limits
Overall crime 245 - 290 18 19,052 - 19701
3 No 0.87 0.68 - 1.09
Criminal damage
34 - 51 50 4,217 – 4,422
5 Yes 0.7 0.42 - 0.98
Public order 15 - 36 140 86 - 105 22 Yes 0.51 0.07 - 0.95
Shoplifting 47 - 35 -26 823 - 848 3 No 1.38 0.37 - 2.39
Vehicle crime 15 - 11 -27 4,072 – 3,827
-6 NA NA NA
Violence against person
47 - 75 60 2,660 – 3,588
35 No 0.85 0.46 - 1.23
Examination of individual crimes showed that while falls in shoplifting (26%) and vehicle crime (27%) were measured, there were large increases in alcohol-related offences, such as public disorder, personal violence and criminal damage.
Factors helping or hindering performance
Overall, the CCTV system had little impact on crime. As it was a predominantly existing system, there was little potential for deterrence.
Increases in alcohol-related crime could be attributed to increased reporting of incidents by control room operators to the police. Operators were proactive in passing information from the control room. However, a similar mechanism would be anticipated for retail crime, as there was a good relationship between the control room and Retail Radio, and this is not shown. It is possible that positive news reports about the new system in March and April 2003 deterred

16
shoplifting and vehicle crime, and this had a stronger impact on shoplifting levels than increased reporting.
Borough Town
Forty cameras (32 static and 8 PTZ) were installed in a town centre as an extension to a previous system, providing approximately 70 per cent coverage of the target area.
Objectives
The system aimed to reduce the incidence of alcohol- and drug-related public disorder, juvenile disorder and theft, through increased deterrence, the effective deployment of police and the production of footage as evidence.
Has it worked?
While general crime in the target area remained unchanged a year after the cameras were installed (335 offences from 334 a year before), the control area, an adjacent zone in Borough Town covered by an older, stable system, experienced an increase of 13 per cent. The difference between the target and control is not statistically significant. Figure 7 shows the crime trends in the target area relative to the control and the buffer areas.
Figure 7: Borough Town - recorded crime trends in target, buffer and control
Table 8 shows the change in overall crime and targeted offences within the target and control areas one year after installation.

17
Table 8: Borough Town – change in overall crime and targeted crime one year after installation
Objective: To reduce...
Target absolute change
Target change (%)
Control absolute change
Control change (%)
Is this significant?
Relative effect size
Confidence limits
Overall crime 334 - 335 0.3 549 - 619 13 No 1.12 0.81 - 1.43
Criminal damage
68 - 44 -35 94 - 88 -6 No 1.45 0.58 - 2.32
Drug offences
6 - 9 50 10 - 12 20 NA NA NA
Public order 1 -2 100 5 - 9 80 NA NA NA
Shoplifting 80 - 90 13 129 - 64 -50 Yes 0.44 0.2 - 0.68
Theft 182 - 173 -5 274 - 244 -11 No 0.94 0.57 - 1.31
Violence against person
29 - 43 48 109 - 166 52 No 1.03 0.54 - 1.51
The table indicates that the increase in violence against the person and drug offences, as well as the reduction in overall theft, coincide with similar changes in the control area, suggesting that the changes were not due to CCTV.
Particularly interesting patterns were identified for criminal damage and retail crime, the latter being statistically significant from the control area. Shoplifting increased by 13 per cent in the target area, but saw a 50 per cent reduction in the control area. It is unlikely that CCTV increased reporting of this offence, as local businesses had little awareness of the cameras, and a lack of proactive monitoring meant that the police were not being directed to more offences. Instead, it is likely to be the result of the newly introduced Retail Radio system within the control area, which could be causing displacement of shoplifting offences into the target area. The presence of community wardens within the target area could explain the large decrease in criminal damage relative to the control area.
Factors helping or hindering performance
The data suggest that the Borough Town system had little or no impact on the targeted offences, as most changes in crime could be attributed to general crime trends in line with the control area and other initiatives operating in the area.
The system was ineffective as a tool for detection because there was a lack of proactive monitoring of the target area within the control room (just nine incidents monitored over 44 hours), and a lack of retrospective use (an average of just two tapes seized per month).
Residential areas Northern Estate
Eleven PTZ cameras were installed in a residential area. CCTV covered approximately 87 per cent of the estate.

18
Objectives
The system aimed to reduce fear of crime and reduce the incidence of burglary, criminal damage, vehicle crime and juvenile disorder, through increased deterrents, the effective deployment of the police and the production of useable footage as evidence.
Has it worked?
Pre-CCTV, the estate’s crime levels were higher than the national and borough average. Between April 2000 and March 2001, burglary was a particular problem (130.621 per thousand population compared to the national average of 7.6 and borough rate of 8.7), and made up 34 per cent of all crime on the estate.
Overall, crime levels in the target area saw a ten per cent decrease (from 112 offences in the year preceding CCTV to 101 in the year following), whereas the control area experienced a 21 per cent increase in crime. The reduction in crime in the target area, and the difference between the target and control area, are not statistically significant. Figure 8 shows the crime trends in the target area relative to the control and the buffer area, also displaying the date of installation of camera poles and the live date of the system. This shows a downward trend in the target area before the cameras were installed. The large variation in the general level of crime in the target area can be observed, showing that any difference after installation would be difficult to relate to CCTV. The wild fluctuations in crime trends in different areas could be attributed to a range of extraneous factors.
Figure 8: Northern Estate – recorded crime trends in the target, buffer and control
Table 9 shows the change in overall crime, fear of crime and targeted offences within the target and control area one year after installation.
21 This high number could partly be attributed to the small population covered by the cameras, such that a small change in crime could produce a large change in crime rates.

19
Table 9: Northern Estate - change in overall crime, fear of crime and crime types one year after CCTV installation
Objective: To reduce...
Target absolute change
Target change (%)
Control absolute change
Control change (%)
Is this significant?
Relative effect size
Confidence limits
Overall crime 112 - 101 -10 73 - 88 21 No 1.34 0.78 - 1.9
Burglary 38-20 -47 13 - 26 100 No 3.8 0.66 - 6.78
Criminal damage
28-29 4 31 - 27 -13 No 0.84 0.15 - 1.53
Vehicle crime
7-11 57 2 - 6 200 NA NA NA
Fear of crime*
NA -3 NA -7 No 0.98 0.55 - 1.74
*Data from public attitude survey: worry about being a victim of crime
Analysis of the target area crime rates per offence category showed that burglary reduced by 47 per cent (where the control experienced a 100% increase), and although the low numbers make a time series analysis of burglary unreliable, unlike total crime, this decrease occurred following the installation of CCTV and remained low in comparison to general crime, which gradually increased once the cameras were installed (see Figure 9). The reduction in burglary accounted for the decrease in the total number of police recorded crimes, which were reduced from 112 in the year before CCTV was installed to 101 in the year following. This suggests that, although CCTV had no overall effect on crime, it influenced burglary, which was one of its main objectives.
Figure 9: Northern Estate – the influence of burglary on total relevant crime

20
The rise in criminal damage represents a rise of just one offence and the rise in vehicle crime represents just four offences; therefore, the small numbers render analysis of these crimes inconclusive.
Interestingly, although there was a decrease in recorded crime following the installation of CCTV, there was a 31 per cent increase in reported incidents according to the public attitude survey. This can be partly attributed to the 13 per cent increase in reported incidents of harassment, a category that is not included within the recorded crime statistics. Small numbers within the remaining victimisation categories mean that any change in levels before and after are exaggerated, thus further explaining the large increase in reported victimisation levels. This suggests an overall decrease in higher level crimes, but an increase in lower level crimes such as harassment, indicating that CCTV had no effect on low level crime.
Worry about being a victim of crime was found to have decreased more within the control area (-7%) than the target area (-3.2%). However, more people felt safer on the estate following CCTV (8% increase in the target compared to a 1% decrease in the control). This suggests that CCTV played a part in bringing about an increase in feelings of safety.
Qualitative evidence22 suggests voids (empty properties) have successfully been reduced from approximately 15-20 per cent to 0.5 per cent.
Factors helping or hindering performance
It can be suggested that the cameras successfully played a part in deterring burglary on the estate, but had little effect on overall crime.
The substantial reductions in burglary suggested that potential offenders were deterred from committing this offence. This could be due to the high visibility and density of cameras, combined with regular publicity of successful arrests made by the cameras. Also, the cameras were positioned to specifically deal with burglary (for example, covering all communal entrances/exits to the flats).
There is noticeable spatial displacement into the inner ring (one-third of a mile) of the buffer zone. The 47 per cent reduction in burglary accounted for a reduction of 13 crimes. The inner ring of the buffer zone experienced an increase in burglary of 11 per cent, accounting for exactly 13 crimes, suggesting these crimes were displaced from the target area. There were no significant confounding factors that could explain these findings.
Westcap Estate
Twelve PTZ cameras were installed in a residential area.
Objectives
The objective of the scheme was principally to reassure the residents on the estate and less emphasis was put on an actual reduction in crime.23
Has it worked?
Table 10 reveals the change in fear of crime levels after the installation of CCTV.
22 Provided by project staff. 23 Recorded crime data were not available for this project.

21
Table 10: Westcap Estate - change in fear of crime and reported victimisation levels following installation of CCTV Objective: to reduce...
Target change (%)
Control change (%)
Is this significant?
Relative effect size
Confidence intervals
Fear of crime* -8 11 Yes 1.71 1.13 - 2.59 Fear of crime** 2 11 No 0.79 0.6 - 1.04 % point change in reported victimisation
-10 4 No 1.46 0.96 – 2.22
*Worry about being a victim of crime **Feelings of safety
The public attitude survey showed a statistically significant reduction in worry about being a victim of crime in the target area when compared with the control area. However, this reduction was unlikely to be due to the presence of the cameras. Those who were aware of the cameras were 19 per cent more likely to be worried about crime than those who were unaware, suggesting that the presence of the cameras did not reduce worry about being a victim of crime. This is supported by the finding that, pre-CCTV, 81 per cent thought that CCTV would reduce crime, whilst only 55 per cent thought it had done so one year after full operation.
The reduction in worry about being a victim of crime was more likely the result of reduced levels of reported victimisation. There was a ten percentage point reduction in the proportion of respondents who reported being a victim of crime in the target area after the installation of CCTV, compared to a four percentage point increase in the control area. This was non-significant. There were statistically significant reductions in reported levels of victimisation for the theft of and from vehicles, property damage, and harassment associated with people using or dealing in drugs. Pearson’s Chi Square revealed that there was a statistically significant (<.01) relationship between reported victimisation and worry about crime.
Eastcap Estate
Ten PTZ cameras were installed alongside improved streetlighting in a residential area. CCTV provided approximately 32 per cent coverage of the estate.
Objectives The system aimed to reduce the fear of crime and reduce the incidence of burglary, vehicle crime and drug-related activity, through increased deterrents, the effective deployment of police resources and the production of useable footage as evidence.
Has it worked? Overall, recorded crime levels in the target area increased by two per cent, and by five per cent in the control area. Neither the rise in crime in the target area, nor the difference between the target and control area, are statistically significant. Similarly there was a 15 per cent increase in reported victimisation levels. Figure 10 shows the crime trends in the target area relative to the control and the buffer areas as well as the division, also displaying the date of installation of camera poles and the live date of the system. These show a seasonal fluctuation in recorded crime levels in the target area, and a steady peak following installation, showing that CCTV had no apparent impact on crime.

22
Figure 10: Eastcap Estate – recorded crime trends in the target, control, buffer and division
Table 11 shows the change in overall crime, fear of crime and targeted offences within the target and control area one year after installation.
Table 11: Eastcap Estate - change in overall crime, fear of crime and crime types one year after CCTV installation Objective: to reduce...
Absolute change
Target change (%)
Control absolute change
Control change (%)
Is this significant?
Relative effect size
Confidence limits
Overall crime 450 - 460 2 130 - 137 5 No 1.03 0.62 - 1.44
Burglary 58 - 36 -38 27 - 19 -30 No 1.13 0.15 - 2.12
Drug offences
19 - 14 -26 10 - 16 60 NA NA NA
Vehicle crime
77 - 69 -10 27 - 29 7 No 1.2 0.26 - 2.14
Fear of crime*
NA 6 NA 7 NA 0.92 0.7 - 1.22
*Data from public attitude survey: feelings of safety24
A breakdown in the target area crime rates per offence category revealed that burglary reduced by 38 per cent. However, the reduction in burglary follows general crime trends that were also experienced within the control area, suggesting that CCTV had no impact on its reduction.
Vehicle crime decreased by ten per cent in the target area (against an increase of 7% - representing two offences - in the control), suggesting that potential offenders were deterred from committing this crime. Geographic Information System (GIS) mapping supports this view, indicating that vehicle crime was deterred, yet internally displaced into areas of the
24 The Eastcap Estate survey did not include the question related to levels of ‘worry about being a victim of crime’; as a result, feelings of safety must be used as the measure of fear of crime.

23
estate not covered by the cameras. Crime mapping revealed that vehicle crime saw a decrease of 38 per cent within the 100 metres surrounding the cameras (within camera range), representing an absolute reduction of 23 offences. Within the target area, but out of range of the cameras, there was a 94 per cent increase in vehicle crime (15 offences).
Vehicle crime was deterred, where burglary was not, because the cameras were positioned to provide full coverage of the streets where cars are parked, but little or no coverage of the rear of properties, from which burglaries are predominantly committed.
CCTV does not appear to have reduced fear of crime. Feelings of safety increased by six per cent, but by a similar amount to the control area. This could be the result of there being no noticeable reduction in crime on the estate. More likely is the fact that the residents rarely see the cameras moving; therefore they are led to believe that either the cameras do not work, or that they are not being watched.
Factors helping or hindering performance
The system was ineffective as a tool for detection because there was a lack of proactive monitoring of the target area within the control room (just six incidents monitored over a twelve-week sample period), and a lack of retrospective use (just ten tapes seized during this same twelve-week period).
Dual Estate
Fourteen cameras were installed in two separate residential areas (one large in size and the other small) on the outskirts of the city centre, and along a main road.
Objectives
The objectives of the cameras installed in the residential areas were to reduce the fear of crime, criminal damage and anti-social behaviour by immediate deployment of police to the scene of an offence. Those along the main road aimed to track offenders from the nearby town centre to surrounding areas.
Has it worked?
Overall, crime rose by four per cent in the target area, whereas it fell by 19 per cent in the control area. Figure 11 shows the crime trends in the target area relative to the control and the buffer area, also displaying the date of installation of camera poles and the live date of the system. This shows no discernible change over time.

24
Figure 11: Dual Estate – recorded crime trends in the target, buffer and control
However, the crime patterns behaved differently in each area; see Figure 12. The number of crimes along the main road was negligible, and in practice showed that these cameras were rarely monitored. The pattern of crime in each residential area behaved differently and is worthy of further comment. These are discussed below.
Figure 12: Dual Estate - crime trends in Areas A and B
While Area A experienced a 32 per cent decrease in crime levels, (and a 68 percentage point decrease in reported victimisation), Area B experienced an eight per cent increase in recorded crime (compared with a two percentage point decrease in reported victimisation). The numbers of crimes per month in Area A are so small that any variation could be attributable to random variations. There were no major confounding factors operating in either area, which could have influenced crime levels.

25
Area A
Table 12 shows the change in overall crime, fear of crime and targeted offences within the target and control area one year after installation.
Table 12: Dual Estate - change in overall crime, fear of crime and crime types one year after CCTV installation (Area A)
Objective: to reduce...
Absolute change
Target change (%)
Control absolute change
Control change (%)
Is this significant?
Relative effect size
Confidence limits
Overall crime 31 - 21 -32 464 - 378 -19 No 1.2 0.36 - 2.05
Criminal damage
14 – 10 -29 194 - 132 -32 NA NA NA
Public order 3 – 5 67 3 - 5 67 NA NA NA
Violence against person
4 –5 25 39 - 52 33 NA NA NA
Fear of crime*
NA -10 NA 4
*Data from public attitude survey: worry about being a victim of crime
Although in Area A the majority of offences (all except violence and public order) decreased, once again their numbers are far too small to accurately attribute this to a real change due to CCTV.
Similarly, the public attitude survey revealed that worry about being a victim of crime reduced compared to an increase in the control area, however the numbers were too small to accurately measure a significant difference. Interestingly, reported victimisation reduced by 68 percentage points post-CCTV and there was shown to be a significant relationship (<.01) between reported victimisation and worry about crime. This finding suggests that worry about crime was reduced in the target area as a result of the substantial reduction in reported victimisation, rather than the sheer presence of the cameras.
Factors helping or hindering performance
The reduction in Area A is mostly likely to have occurred through deterrence, brought about by the high visibility of cameras and their concentration. Ninety–seven per cent of the residents were aware of the cameras. Furthermore, it had a high level of camera density (173 cameras per km2) making it difficult for potential offenders to avoid their gaze.
Area B
Table 13 shows the change in overall crime, fear of crime and targeted offences within the target and control areas one year after installation.
26
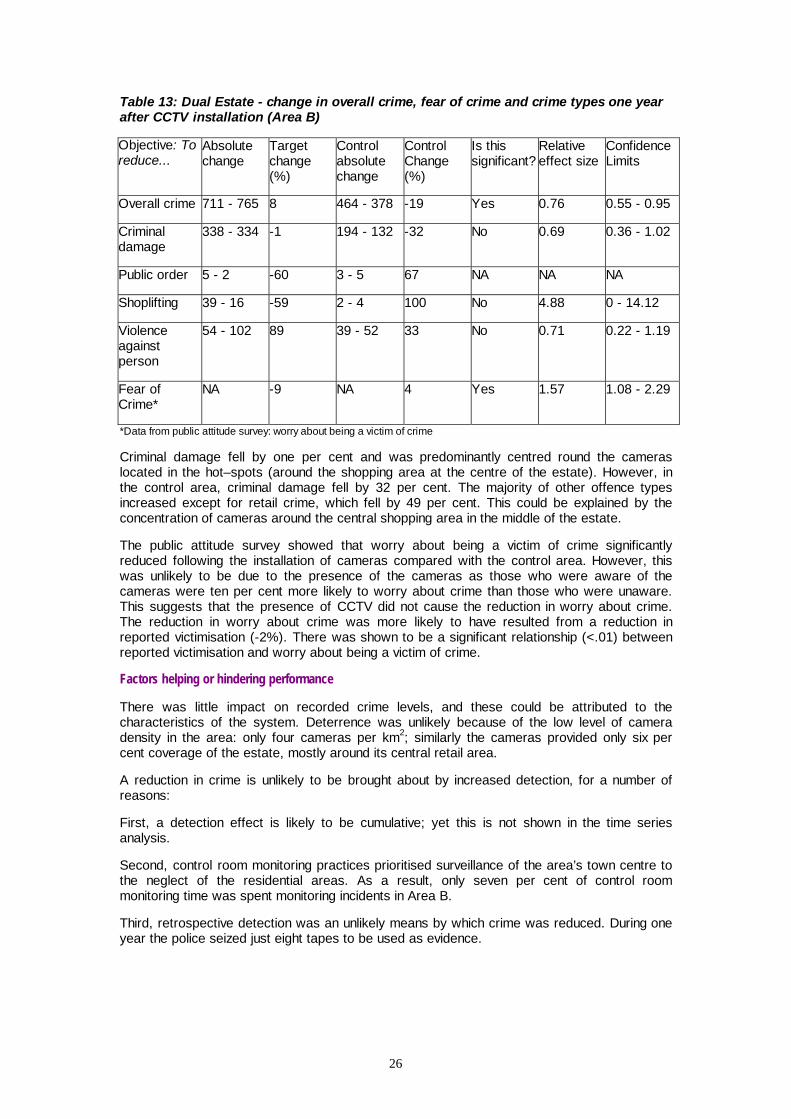
Table 13: Dual Estate - change in overall crime, fear of crime and crime types one year after CCTV installation (Area B)
Objective: To reduce...
Absolute change
Target change (%)
Control absolute change
Control Change (%)
Is this significant?
Relative effect size
Confidence Limits
Overall crime 711 - 765 8 464 - 378 -19 Yes 0.76 0.55 - 0.95
Criminal damage
338 - 334 -1 194 - 132 -32 No 0.69 0.36 - 1.02
Public order 5 - 2 -60 3 - 5 67 NA NA NA
Shoplifting 39 - 16 -59 2 - 4 100 No 4.88 0 - 14.12
Violence against person
54 - 102 89 39 - 52 33 No 0.71 0.22 - 1.19
Fear of Crime*
NA -9 NA 4 Yes 1.57 1.08 - 2.29
*Data from public attitude survey: worry about being a victim of crime
Criminal damage fell by one per cent and was predominantly centred round the cameras located in the hot–spots (around the shopping area at the centre of the estate). However, in the control area, criminal damage fell by 32 per cent. The majority of other offence types increased except for retail crime, which fell by 49 per cent. This could be explained by the concentration of cameras around the central shopping area in the middle of the estate.
The public attitude survey showed that worry about being a victim of crime significantly reduced following the installation of cameras compared with the control area. However, this was unlikely to be due to the presence of the cameras as those who were aware of the cameras were ten per cent more likely to worry about crime than those who were unaware. This suggests that the presence of CCTV did not cause the reduction in worry about crime. The reduction in worry about crime was more likely to have resulted from a reduction in reported victimisation (-2%). There was shown to be a significant relationship (<.01) between reported victimisation and worry about being a victim of crime.
Factors helping or hindering performance
There was little impact on recorded crime levels, and these could be attributed to the characteristics of the system. Deterrence was unlikely because of the low level of camera density in the area: only four cameras per km2; similarly the cameras provided only six per cent coverage of the estate, mostly around its central retail area.
A reduction in crime is unlikely to be brought about by increased detection, for a number of reasons:
First, a detection effect is likely to be cumulative; yet this is not shown in the time series analysis.
Second, control room monitoring practices prioritised surveillance of the area’s town centre to the neglect of the residential areas. As a result, only seven per cent of control room monitoring time was spent monitoring incidents in Area B.
Third, retrospective detection was an unlikely means by which crime was reduced. During one year the police seized just eight tapes to be used as evidence.

27
Southcap Estate
One hundred and fourty-eight PTZ cameras were installed in a residential area, providing coverage of 73 per cent of the estate.
Objectives
The system aimed to reduce fear of crime and the incidence of drug offences and offences against the person, through increased deterrence and detection.
Has it worked?
Due to late and varied implementation dates, post-CCTV crime data for the entire target area spans just four months. However, it was possible to obtain ten months post-CCTV data for one third of the estate (Areas C and D), as the system became operational in that area first. As a result, all analysis that follows pertains to Areas C and D of the estate.
Six months after the system went live, overall crime in Area C and D increased by 14 per cent from the six months pre-CCTV. During these months, crime in the control area reduced by 13 per cent. The control area25, however, has been rendered an unreliable comparison area (nb, in terms of crime) as crime decreased at a faster rate in the control than the target area leading up to, and beyond, the implementation period (see Figure 13).
Figure 13: Southcap Estate – recorded crime trends in the target and control26
Table 14 shows the change in overall crime, fear of crime and targeted offences within Areas C and D and the control area six months after installation.
25 The suitability of the control area is in question, as shown in Figure 13. It shows that crime trends substantially differ between the target and control, rendering comparisons problematic. 26 A buffer area was inappropriate for this project because there was a relatively high-density crime area immediately outside the target area, which would have hidden any potential displacement / diffusion of benefit effects.

28
Table 14: Southcap Estate - Change in overall crime, fear of crime and crime types one year after CCTV installation
Objective: to reduce...
Area C/D absolute change
Area C/D change (%)
Control absolute change
Control change (%)
Is this significant?
Relative effect size
Confidence limits
Overall crime
160 - 182 14 529 - 458 -13 Yes 0.76 0.56 - 0.96
Drug offences
7 - 11 57 16 - 17 6 NA NA NA
Violence against the person
42 - 59 40 98 - 124 27 No 0.9 0.33 - 1.47
Fear of Crime*
NA -2 NA -4 No 1.04 0.75 - 1.45
*Data from public attitude survey: worry about being a victim of crime
In no offence category did crime trends in the target area differ significantly from those in the control area.
In terms of fear of crime, the public attitude survey revealed that there was a two per cent reduction in worry about becoming a victim of crime in the target area, compared to a four per cent reduction in the control area. This suggests that the cameras had little or no effect on fear of crime levels. Worry about being a victim of crime was significantly related to reported victimisation, suggesting that the reduction in worry about crime was the direct result of victimisation rather than the presence of the cameras.
Factors helping or hindering performance
The data revealed that there was an overall increase in crime following the introduction of CCTV, accounted for mainly by the large increase in violence against the person (40%). This increase could be explained in a number of ways. A general pattern emerged, whereby violence within the target area increased dramatically during the summer months of 2001, 2002 and 2003 in comparison to the winter months. Therefore, as the data included predominantly summer months (Jun 2003-Nov 2003), an expected rise in violence would be expected.
Criminal damage was the only relevant crime to have shown a reduction (-36%) in Areas C and D. As there was just a one per cent reduction in criminal damage in the control area, there is a suggestion that CCTV is playing a part in deterring criminal damage in the target area. However, in May 2003 (coinciding with the operational date of camera areas C and D), a Youth Inclusion Project began in the target area, specifically targeting a reduction in youth crime through encouraging 9 to 15 year-olds off the street. This may have contributed to the reduction in criminal damage.
Borough
This scheme comprised eight redeployable cameras, capable of being deployed anywhere within the Borough. The redeployable cameras provided temporary surveillance in outlying areas where fixed CCTV was not financially viable. During the evaluation period the cameras were deployed on 22 occasions and for periods of between two weeks and fourteen months.
Objectives
The main objective for this scheme was to contribute to the Borough Police’s Public Reassurance Agenda. The presence of CCTV provided a visible sign of police response to complaints from the public. Another objective was to assist the police in tackling sporadic

29
crime hotspots in Borough, not previously covered by CCTV, by providing a rapid deployment to crime hot–spot areas.
Has it worked?
Crime in the Borough region was lower than the national average for all offence types except sexual offences, which was greater by 0.1 crimes per 1,000 population. For total crime, there was an average of 24 crimes per month (n = 36) in the target area (100 metres from each camera) with a total of 257 crimes occurring the year preceding implementation. Time series shows crime levels to remain fairly constant in the ‘before’ period for the divisional data (see Figure 14 below). The rise in crime in both the buffer and target areas is limited to a number of marked peaks in the 12 months following the intervention but then falls back to the pre-intervention values. This could best be attributed to a change unconnected to CCTV.
Figure 14: Borough - recorded crime trends in target, buffer and division
After implementation, a rise in crime levels was seen across the board in all target, buffer and division areas (see figure 14). Table 15 shows the change in overall crime and targeted offences within the target and division areas one year after installation. The table reveals that crime increased by 73 per cent in the target and by 12 per cent in the division area, marking a significantly better performance by the division as a whole. The same pattern occurred for incidents, which increased by 43 per cent in the target area and only six per cent in the division.

30
Table 15: Borough - change in overall crime and targeted offences since installation in Borough
Objective: To reduce...
Absolute target change
Target change (%)
Absolute division change
Division change (%)
Is this significant?
Relative effect size
Confidence Limits
Overall crime 257 - 444 73 8,250 – 9,225
12 Yes 0.65 0.57 - 0.73
Burglary 27 - 49 81 1,448 – 1,559
8 Yes 0.59 0.29 – 0.9
Criminal damage
82-183 123 2,179 – 2,330
7 Yes 0.48 0.30 - 0.6
Vehicle crime 42 – 73 74 1,754 – 1,773
1 Yes 0.58 0.31 - 0.86
Violence against the person
35 - 44 25 785 – 1,270
62 No 1.29 0.16 - 2.42
The increases in a number of crime categories are not in line with trends in the divisional data. CCTV has not been effective at reducing crime in any of the crime categories. Only in violence against the person was there a positive result (an increase of 25% in the target area compared with a 62% rise in the divisional data).
Factors helping or hindering performance
The cameras were implemented in crime hot–spot areas and did not reduce crime in the target areas. This could be attributed to their use. They were usually deployed singularly, so little overall effect could be observed, although on a couple of deployments two cameras were installed. Furthermore, it is not being used as a rapid deployment system as billed; the majority of deployments last several months. In addition, the number of deployments in the first year was low: 22 separate deployments over 14 months.
Also, the system experienced severe technical and monitoring difficulties. The cameras could transmit data via the mobile phone network. However, viewing live footage from the cameras proved problematic: footage was slow to transfer, and there was a time lag of up to three seconds between the camera capturing the image, and seeing the image on screen. There was also a lag time in the telemetry, making the cameras difficult to control remotely. The system was not user-friendly for real-time monitoring due to the time lag, and was only monitored between seven and thirty hours a month. This effectively made the system reactive, and the police made limited use of the recorded images. They accessed the recorded images approximately 300 times and useful footage was available on only four occasions.
The focus group with local residents showed that, initially, the cameras reduced fear of crime and local residents reported that the crime problems were displaced from the target area. As the focus group respondents commented, the problems returned when the youths realised the cameras were on auto-pan and the police were not responding to the images. This reduced the residents’ positive feelings about CCTV, which were further tainted by the fact that they knew the cameras were a temporary measure, as reported in the local media.
Deploy Estate
The Deploy Estate system made use of redeployable cameras in five discrete areas within a residential area. These were three residential areas, a residential shopping parade and a

31
railway station. Eleven cameras were installed on nineteen poles and were moved around in response to crime problems.
Objectives
The system aimed to reduce car crime, criminal damage, anti-social behaviour (in particular youth disorder), graffiti and fly tipping through prevention and detection. It was also hoped that CCTV would help reduce fear of crime and resolve harassment and intimidation problems among residents.
Has it worked?
Recorded crime rates in the one year before and after CCTV was installed showed a 21 per cent increase, while there was a small increase in the control area (3%). The difference between the target and control areas was not statistically significant. Therefore, the system does not appear to have met its overall objective to reduce crime.
Figure 15 shows the crime trends in Deploy Estate’s target areas as a whole as well as the control and buffer areas. It shows no substantial change in crime levels leading up to implementation, and there is an upward trend in crime rates during and following the installation of CCTV. However, the target area levels increased after CCTV was installed.
Figure 15: Deploy Estate – recorded crime trends in the target, control, buffer and division
Table 16 shows the change in overall crime, fear of crime and targeted offences within the target and control areas one year after installation. There were disparities between the changes in crime rates across the five evaluation areas, but the absolute numbers of crimes were too small to discern any individual crime patterns. The overall changes in crime rates across the five areas are mostly determined by changes in Area E, which was by far the largest area.

32
Table 16: Deploy Estate - change in overall crime and targeted offences one year after CCTV installation
Objective: to reduce...
Target absolute change
Target change (%)
Control absolute change
Control change (%)
Is this significant?
Relative effect size
Confidence limits
Overall crime 760 - 917 21 534 - 548 3 No 0.85 0.63 - 1.07
Criminal damage
296 - 456 54 153 - 136 -11 Yes 0.58 0.35 - 0.81
Burglary 81 - 62 -23 64 - 104 63 No 2.12 0 - 4.54
Vehicle crime 164 - 152 -7 107 - 95 -11 No 0.96 0.58 - 1.33
Violence against person
110 - 118 7 120 - 118 -2 No 0.92 0.53 - 1.3
Public order 17 - 19 12 13 - 23 77 NA NA NA
Fear of crime (Area E)*
NA -3 NA -4 No 1.05 0.68 - 1.62
Fear of crime (Area F)*
NA 0.4 NA -4 No 0.95 0.61 - 1.49
*Data from public attitude survey: worry about being a victim of crime
Across the target areas, there was a significant increase in criminal damage following the installation of CCTV, mostly due to crime patterns in Area E. The year before the cameras were installed there was an average of 13 criminal damage offences a month in this area. This rose to an average of 29 offences per month following installation of CCTV, with a peak of 58 offences per month.
A proportion of criminal damage could be accounted for by damage to the cameras themselves. The cameras were installed in a highly sensitive area and several were vandalised.
The target area experienced a reduction in burglary (24%), which was not mirrored in the control area, where burglary rates increased (although the difference between target and control areas was not statistically significant).
The public attitude survey was carried out in two of the evaluation areas (Areas E and F) and a control area. There was no significant change in fear of crime in the target area compared to the control area. In Area E, there was a three per cent decrease in worry about crime, which was the same as in the control area. In Area F, there was no change in the level of worry about crime. These findings suggest that CCTV had little or no impact on fear of crime levels.
Factors helping or hindering performance
CCTV has had little effect on crime and the fear of crime. The system was not monitored in a way that would increase the number of detections of crime brought about through immediate deployment of police resources to scenes of crime and the subsequent arrest of offenders.
A number of control room factors also reduced the effectiveness of the scheme. The control room study showed that, collectively, the target areas were monitored for only 2.6 per cent of the total time it was operational. Operators were unable to pursue offenders from one area to another, because the cameras did not interlink. Also, there were gaps in camera coverage in the most significant crime areas. A potential camera location in Area E in the centre of a hot

33
spot was ignored because the camera was likely to be vandalised. In addition, the control room operators had very little knowledge of the location of the cameras and even less of the crime problems existing in those areas.
If an offence was not spotted by the operator it was unlikely that it would be caught on tape, as the cameras did not pan on automatic tour and only moved when the operators were actively controlling them. Consequently, the cameras would have to be pointing in the right direction for the crime to be caught. Good quality footage was recorded in daytime only, as the images at night were of poor quality.
There are several ways in which CCTV might have deterred offenders. One is simply through the cameras’ presence on the estate, leading offenders to estimate the risk of detection as a result of CCTV as too great. However, any such effect was likely to have been reduced by the low density of cameras. Even where cameras were present, it was relatively easy for offenders to evade being captured by CCTV simply by moving to another part of the estate. In addition, the cameras were not housed in domes, but were box-shaped. This made it much easier for the offender to monitor where the cameras were pointing, and consequently, calculate how likely they were to be captured on CCTV. Given that the cameras rarely moved, because they were not set on auto-tour and were rarely actively used by the control room operators, the risk to offender was reduced even more. It is quite plausible that offenders chose to offend ‘behind the camera’s back’, and consequently the cameras had not had a major deterrent effect.

34
Conclusion This report explored the impact of CCTV on crime and the fear of crime in fourteen individual systems. Each CCTV system displayed unique characteristics, which highlights the complexity in determining how CCTV operates as a single entity. Whilst most systems revealed little overall effect on crime levels, there were a number of small-scale impacts that were explored. Some of these represent successes, which are worthy of comment.
Table 17 below summarises the main findings from the case studies. It shows the changes of note in each area, highlighting changes in overall crime and in any individual crime types, which could be attributed to CCTV. It provides some information about the mechanisms by which CCTV could have worked and assesses whether CCTV could potentially have increased the reporting of crime. It also highlights where there was some evidence of geographical displacement. However, it is important to reiterate that few results were statistically significant, and most could be explained by random variations in crime, or other confounding factors. Overall, just two schemes, City Outskirts and Hawkeye, can be said to have experienced a statistically significant reduction in recorded crime relative to the control area, and only in the latter it is plausible that the role of CCTV was a significant factor in this reduction.
Table 17: Summary of main findings in each case study
Scheme Overall levels of crime and specific categories CCTV affected
Change in levels of crime
Could CCTV have significantly impacted on change in levels of crime? Mechanism
Confounding factors occurring during the evaluation period
Evidence of crime movements
Did CCTV reduce fear of crime?
Overall Crime
Reduced Yes – partially by deterrence along with confounding variables. But could also be explained by changes in recording practices.
Anti-burglary project, improved lighting, arboretum renovated
None
Vehicle crime
Reduced Yes – deterrence Changes in parking regulations
None
City Outskirts
Theft Reduced Yes – deterrence None None
No
Hawkeye Vehicle crime
Reduced Yes – deterrence and detection
Resurfacing, fencing and lighting upgrades
None NA
Overall crime
Reduced Inconclusive small sample
Police operations, poster and leaflet crime prevention campaign
None City Hospital
Vehicle crime
Reduced Yes – partially along with Confounding variables
Police operations, poster and leaflet crime prevention campaign
None
NA

35
Overall crime
Increased No – similar trend in control.
Police operations, community wardens
None
Criminal damage
Reduced Yes – deterrence, along with confounding variables
Community wardens
None
Retail crime
Increased Yes – increased reporting
None None
South City
Public order
Increased Yes – increased reporting
Police operations
None
No
Overall crime
Reduced No – similar trend in control.
Community wardens
None
Retail crime
Increased No – similar trend in control.
None None
Criminal damage
Increased Yes – increased reporting
None None
Public order
Increased Yes – increased reporting
None None
Shire Town
Violence against the person
Increased Yes – increased reporting
None None
NA
Overall crime
Increased No – similar trend in control.
Community wardens and car park schemes set up.
None
Criminal damage
Increased Yes – increased reporting
None None
Public order
Increased Yes – increased reporting
None None
Market Town
Violence against the person
Increased Yes – increased reporting
None None
N/A
Borough Town
Overall crime
No change No – similar trend in control.
Community wardens
None N/A
Overall crime
Yes No – crime reducing before CCTV installed
None Yes – spatial displacement to buffer zone
Northern Estate
Burglary Yes Yes – deterrence None Yes – patial displacement to buffer zone
Yes
Westcap Estate
N/A N/A N/A N/A N/A Yes *
Overall crime
No No – similar trend in control
None Yes – internal displacement
Eastcap Estate
Vehicle crime
Yes Yes – deterrence None Yes – internal displacement
No
Dual Estate
Overall crime
Increased No – similar trend in control
None None Yes*
Dual Estate (Area A)
Overall crime
Decreased Yes but small sample
None None Yes *
Crime Increased No None None Dual Estate (Area B)
Retail crime
Decreased Yes – deterrence None None Yes*

36
Southcap Estate
Overall crime
Increased No – similar trend in control.
Youth inclusion project
N/A No
Borough Overall crime
Increased No – poor operational use of the system
None Yes – spatial displacement
NA
Deploy Estate
Overall crime
Increased No None None No
So, although just two systems demonstrated a statistically significant reduction in recorded crime, there were pockets of ‘successful’ CCTV operation, mostly, but not always, relating to particular types of crime.
• There was a large, but non-significant reduction in crime in Area A, which had a high camera density.
• Recorded shoplifting increased in three out of the four urban centres under evaluation, and in at least two cases this could be attributed to the presence of a successful Retail Radio system bringing offences to the attention of the police.
• Recorded public order incidents increased in South City and Market Town; again the control room activities could have led to increased reporting to the police.
• Area B showed a substantial decrease in shoplifting around the shopping area; in the absence of Retail Radio, the CCTV system could have acted as a deterrent.
• Northern Estate and Eastcap Estate showed a reduction in burglary and vehicle crime respectively, and in both cases these offence types accounted for the greatest proportion of offences in these areas. In both cases there was evidence of spatial displacement to areas not covered by the cameras.
On the other hand, where there were initial suggestions of success, any measured change in crime following CCTV installation could not always be attributed to CCTV once confounding factors and random fluctuations were taken into account. Even where simple before/after comparisons showed a significant change, investigation of the time series trends showed that the changes in crime could be attributed to changes in crime levels independent of the CCTV system. In City Outskirts, peaks and troughs in crime levels could be attributed to changes in police recording practices.
Similarly, a system’s area of operation could have benefited from a number of other initiatives that may share the credit for the observed success. Again, there were a number of other initiatives occurring in the target area in City Outskirts that could have impacted on the significant reductions in overall crime. Similarly, while City Hospital showed a decrease in vehicle crime, this could be explained by other initiatives in the area, as the time series trends revealed that the decrease began before CCTV was installed, particularly at a time when it was subject to a range of police initiatives addressing vehicle crime.
Overall, the impact of CCTV has been variable. Elsewhere (Gill et al, 2005) we have emphasised the variety of issues that impacts on CCTV working. In short, it is important to remember that the characteristics of areas and the crime problems generated in them varies considerably, and the suitability of CCTV will depend, at the very least, on the nature of those problems, the presence of other measures, and the commitment and skills of management and staff to making CCTV work. The belief that CCTV alone can counter complex social problems is unrealistic in the extreme. At best CCTV can work alongside other measures to generate some changes, but it is no easy panacea, and there is a lot still to be learnt about how to use it to best effect.

37
References • Gill, M., Spriggs, A. (2005a) Assessing the Impact of CCTV. Home Office Research
Study. London: Home Office.
• Gill, M., Spriggs, A., Argomaniz, J., Bryan, J., Waples, S., Allen, J., Kara, D., Kilworth, J., Little, R., Smith, P., Swain, D. and Jessiman, P. (2005a) Technical: Methods Used in Assessing the Impact of CCTV, Home Office Online Report, London: Home Office.
• Gill, M., Swain, D., Spriggs, A., Allen, J., Argomaniz, J. and Waples, S. (2005c) Assessing the Impact of CCTV – The South City Case Study, Home Office Online Report, London: Home Office.
• Gill, M., Little, R., Spriggs, A., Allen, J., Argomaniz, J. and Waples, S. (2005d) Assessing the Impact of CCTV – The Hawkeye Case Study, Home Office Online Report, London: Home Office.
• Gill, M., Allen, J., Spriggs, A., Argomaniz, J. and Waples, S. (2005e) Assessing the Impact of CCTV – The Northern Estate Case Study, Home Office Online Report, London: Home Office.
• Simmons, J. and Dodd, T. (2003) Crime in England and Wales 2002/2003. Home Office Statistical Bulletin. London: Home Office, July 2003.
Websites:
http://www.btp.police.uk/documents/AnnualStatistics02-03.pdf

Produced by the Research Development and Statistics Directorate, HomeOffice
This document is available only in Adobe Portable Document Format (PDF)through the RDS website
http://www.homeoffice.gov.uk/rds
Email: [email protected]
ISBN 1 84473 572 9 Crown copyright 2005