the impact of canadian floriculture imports on the u.s. floriculture industry bruce w. smith center...
TRANSCRIPT

The Impact of Canadian Floriculture
Imports on the U.S. Floriculture Industry Bruce W. Smith
Center for Regional DevelopmentDepartment of Geography
Bowling Green State UniversityBowling Green, Ohio 43403
Neil ReidUrban Affairs Center
Department of Geography and PlanningThe University of Toledo
Toledo, Ohio 43606
Michael C. CarrollCenter for Regional Development
Department of EconomicsBowling Green State University
Bowling Green, Ohio 43403
Presented to the Annual Meeting of the Association of American Geographers, San Francisco, California, April 17-21, 2007

Presentation Outline
• Purpose
• Economic Context
• Canadian Competition
• Causes of Growing Canadian Imports
• Conclusions

Purpose
• Describe changing pattern of Canadian floriculture imports into the U.S.
• Identify the context and causes of those changes.

Industry Definition

Floriculture Production Definition
• Floriculture Production
• NAICS Code 111442
• establishments primarily engaged in growing and/or producing floriculture products such as
– cut flowers– bedding plants– hanging baskets– house plants

Economic Context

Top Agricultural Products Sold by Market Value, 2002
0
10,000,000
20,000,000
30,000,000
40,000,000
50,000,000
Catt
le &
calv
es
Gra
ins,
oil
seed
s,
dry
bean
s,
& d
ryp
eas
Po
ult
ry &
eg
gs
Mil
k &
oth
er
dair
y p
rod
ucts
fro
m c
ow
s
Nu
rsery
,g
reen
ho
use,
flo
ricu
ltu
re,
&so
d
Fru
its,
tree
nu
ts,
&b
err
ies
U.S
. D
ollars
Source: USDA, 2003

Top U.S. Floriculture Producing States,2004
• The top two producing states are California (20.5%) and Florida (16.5%)
• No other state has over 5% of national production
FloridaCaliforniaMichiganTexasOhioOther
Source: USDA, 2005

FloricultureA Growing Market
• Per household consumption of floriculture products increased from $44 to $54 between 1992 and 2004
• This represents an increase of 22.7%
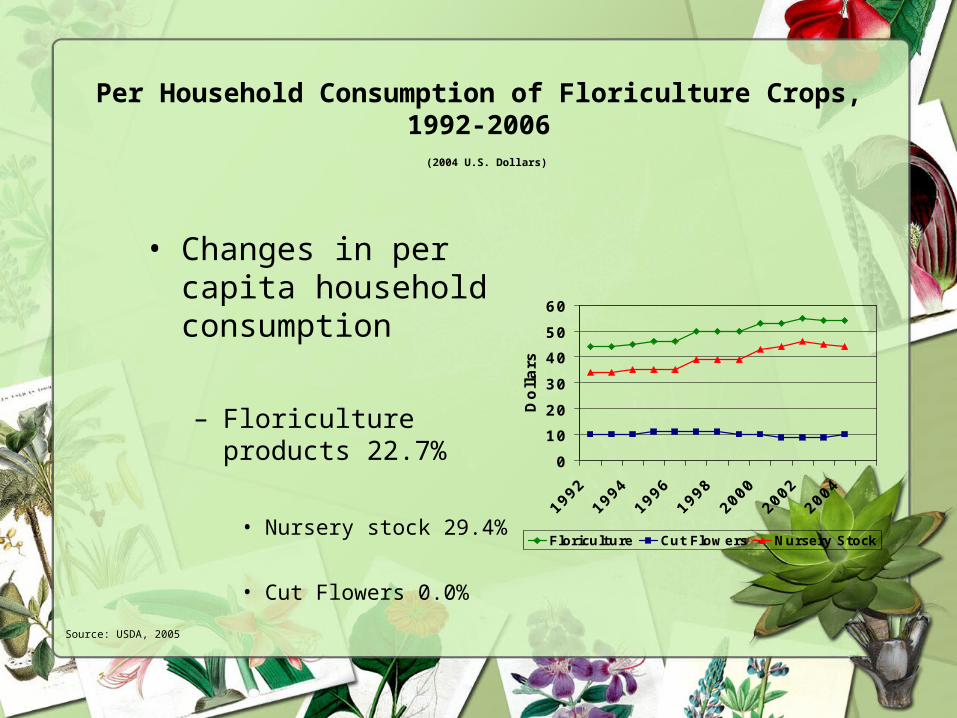
Per Household Consumption of Floriculture Crops, 1992-2006 (2004 U.S. Dollars)
• Changes in per capita household consumption
– Floriculture products 22.7%
• Nursery stock 29.4%
• Cut Flowers 0.0%
0
10
20
30
40
50
60
Do
llars
Floriculture Cut Flowers Nursery Stock
Source: USDA, 2005

Floriculture Average Sales Per Acre,1993-2004
0
20000
40000
60000
80000
100000
120000
19
93
19
94
19
95
19
96
19
97
19
98
19
99
20
00
20
01
20
02
20
03
20
04
Sale
s p
er
Acre
($
)<$100,000 sales >$100,000 sales All growers
Change1993-2004
Grower Type
Number Percent
All Growers $5,149 6.5%
<$100,000 sales
-$12,382 -28.9%
>$100,000 sales
$8,311 9.7%
Source: USDA, 2005

U.S. Floriculture Imports
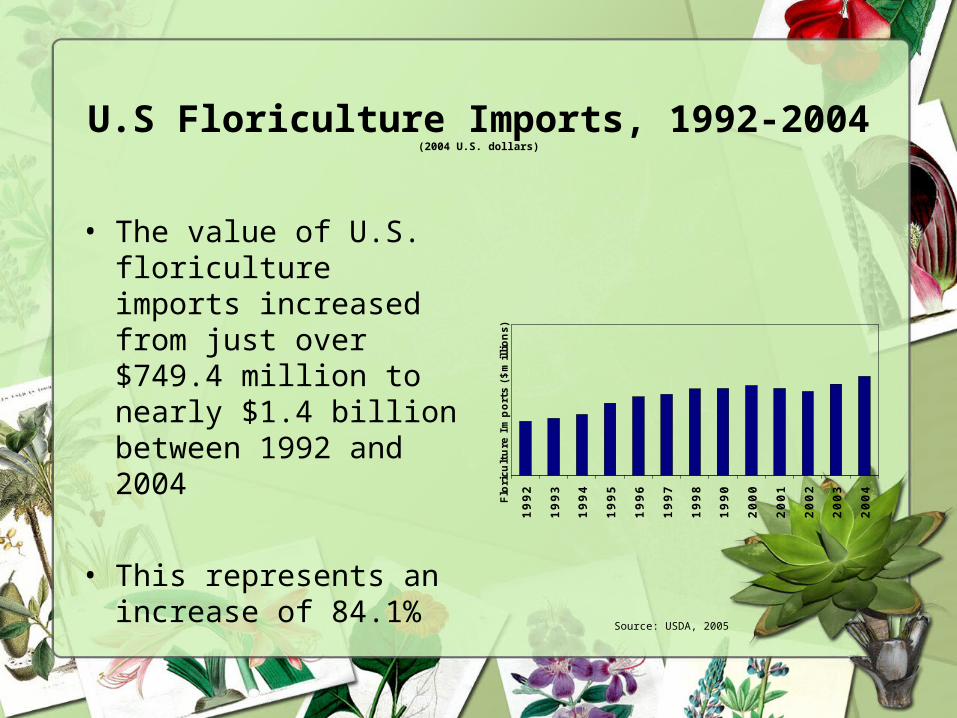
U.S Floriculture Imports, 1992-2004(2004 U.S. dollars)
• The value of U.S. floriculture imports increased from just over $749.4 million to nearly $1.4 billion between 1992 and 2004
• This represents an increase of 84.1%
19
92
19
93
19
94
19
95
19
96
19
97
19
98
19
90
20
00
20
01
20
02
20
03
20
04
Flo
ricu
ltu
re I
mp
ort
s ($
million
s)
Source: USDA, 2005
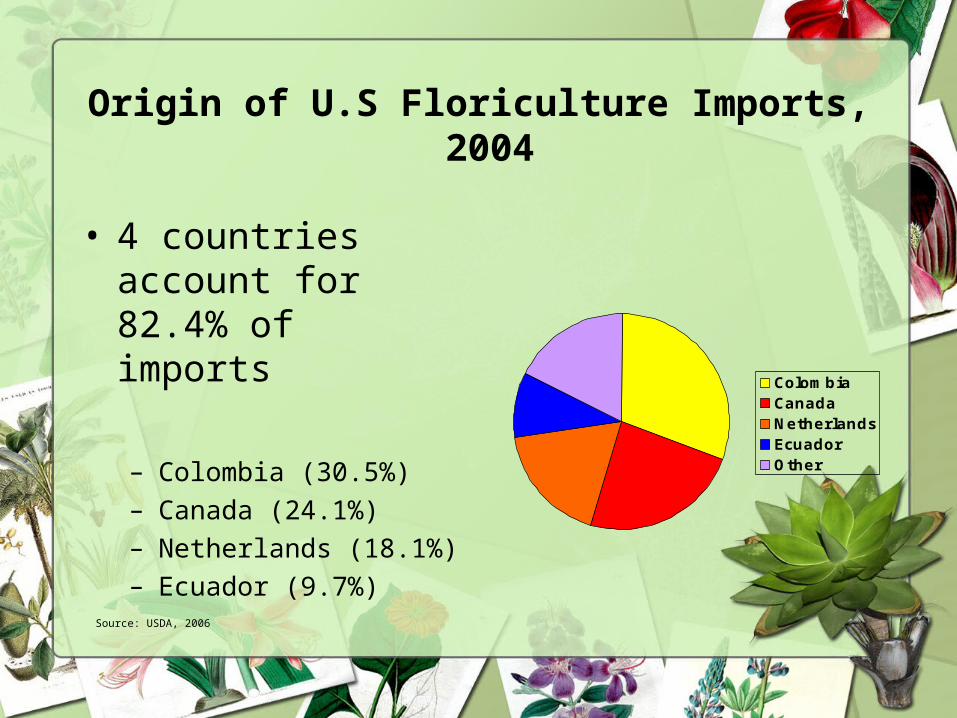
Origin of U.S Floriculture Imports, 2004
• 4 countries account for 82.4% of imports
– Colombia (30.5%)– Canada (24.1%)– Netherlands (18.1%)– Ecuador (9.7%)
ColombiaCanadaNetherlandsEcuadorOther
Source: USDA, 2006
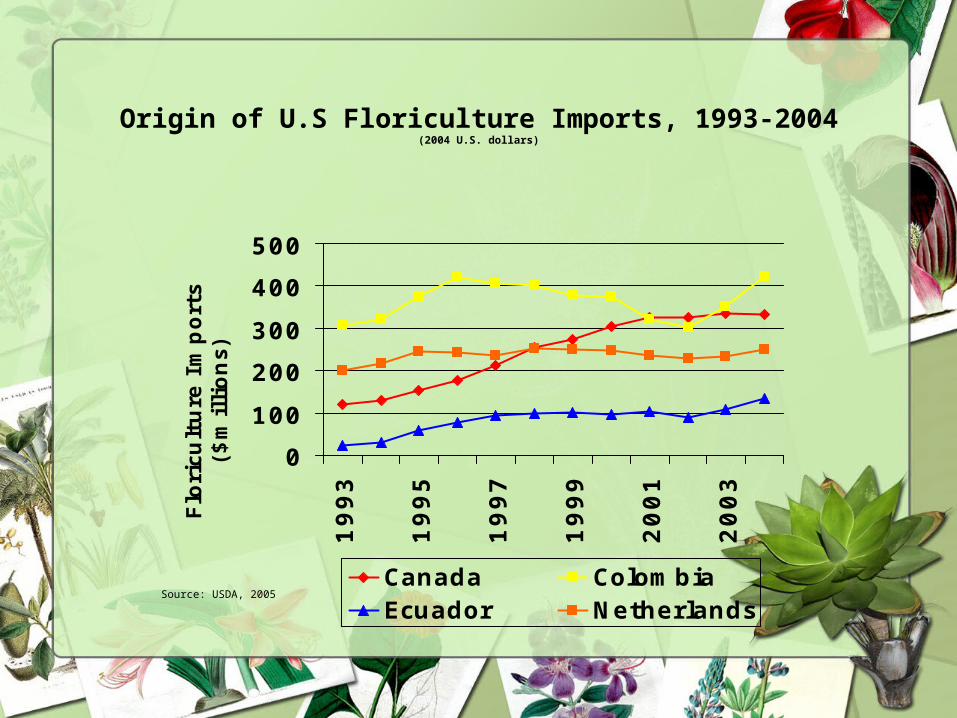
Origin of U.S Floriculture Imports, 1993-2004(2004 U.S. dollars)
0
100
200
300
400
500
19
93
19
95
19
97
19
99
20
01
20
03
Flo
ricu
ltu
re I
mp
ort
s ($
million
s)
Canada ColombiaEcuador Netherlands
Source: USDA, 2005

Cut Flowers and Nursery Stock Share of U.S. Imports, 1992-2004
0
1020
30
40
5060
70
1992
1994
1996
1998
2000
2002
2004
Perc
enta
ge o
f Im
port
s
Cut Flowers Nursery StockSource: USDA, 2005
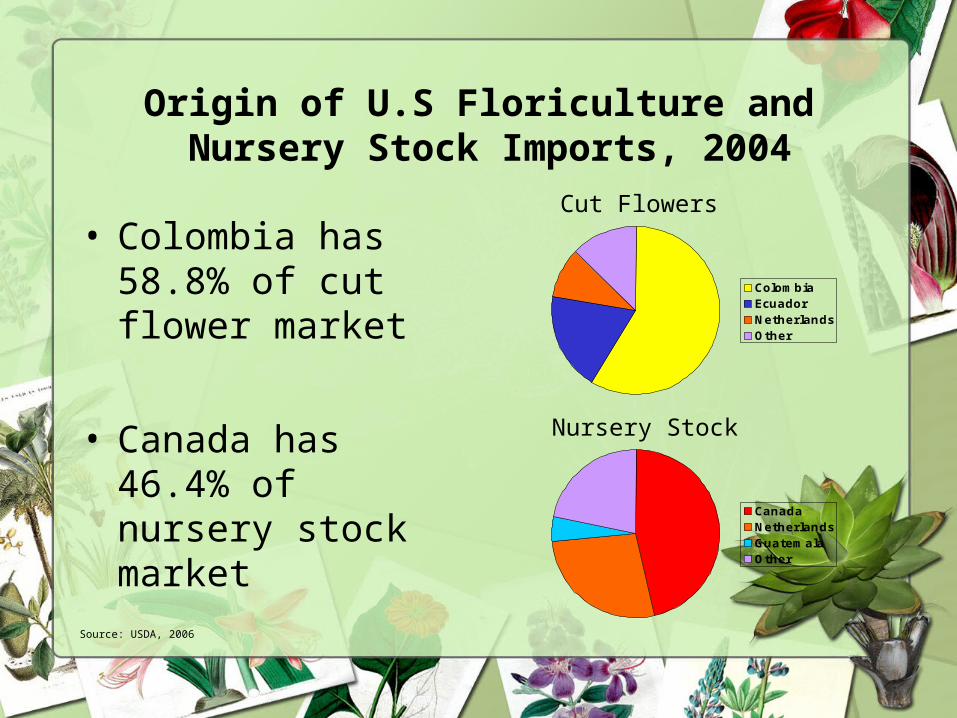
Origin of U.S Floriculture and Nursery Stock Imports, 2004
• Colombia has 58.8% of cut flower market
• Canada has 46.4% of nursery stock market
ColombiaEcuadorNetherlandsOther
CanadaNetherlandsGuatemalaOther
Source: USDA, 2006
Cut Flowers
Nursery Stock

Canadian Competition

Canada-U.S Floriculture Trade,1992-2004
• Canada’s trade surplus with the U.S. in floriculture products increased from $1.5 million to $35.3 million
0
10000000
20000000
30000000
40000000
50000000
60000000
70000000
19
92
19
93
19
94
19
95
19
96
19
97
19
98
19
99
20
00
20
01
20
02
20
03
20
04
$U
S
CAN>US US>CAN
Source: Industry Canada 2006

Imports by State*
*States accounted for 64% of US total in 2004.
0
2,000
4,000
6,000
8,000
10,000
12,000
14,000
1992 1993 1994 1995 1996 1997 1998 1999 2000 2001 2002 2003 2004
1,00
0's
of U
S D
olla
rs New York
Michigan
Washington
Massachusetts
Maine
New Jersey

Exports by Province*
0
10,000
20,000
30,000
40,000
50,000
60,000
70,000
1992
1993
1994
1995
1996
1997
1998
1999
2000
2001
2002
2003
2004
1,00
0's
of D
olla
rs Total
Ontario
British Columbia
New Brunsw ick
Quebec
*Provinces accounted for 96% of total in 2004.

Changing Import Patterns

Causes of Growing Canadian Imports
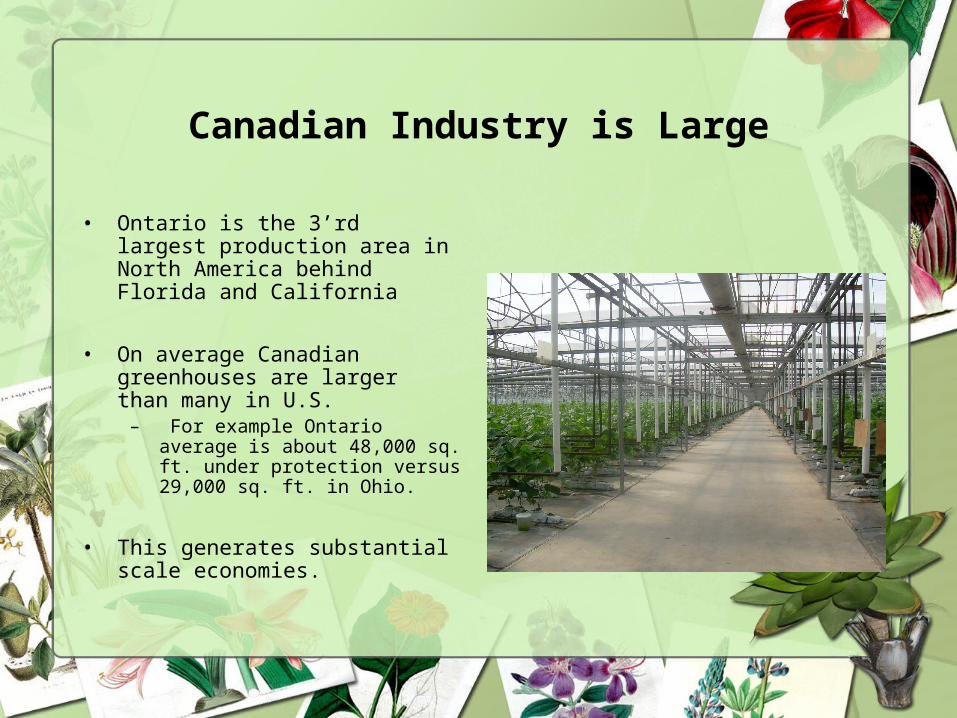
Canadian Industry is Large
• Ontario is the 3’rd largest production area in North America behind Florida and California
• On average Canadian greenhouses are larger than many in U.S.
– For example Ontario average is about 48,000 sq. ft. under protection versus 29,000 sq. ft. in Ohio.
• This generates substantial scale economies.

Southern Ontario
• Good location.
• 50% of U.S. urban population within 8 hour drive.

U.S. Growers
A grower invested little profits back into the family business. He was complacent. He had halfhearted promotions and short hours. The greenhouse layout, lighting, displays and merchandising were virtually unchanged since construction. He was slow to incorporate new trends and follow customers’ changing needs and preferences.”
Greenhouse Product News, 2006

Canadian Ownership
“The Ontario Greenhouse Alliance’s vision is to provide an infrastructure and approach that will integrate all the current resources and future potential of the Ontario greenhouse stakeholders into a community and international marketplace presence, with the synergy and standards to be a world leader in greenhouse operations”
The Ontario Greenhouse Alliance
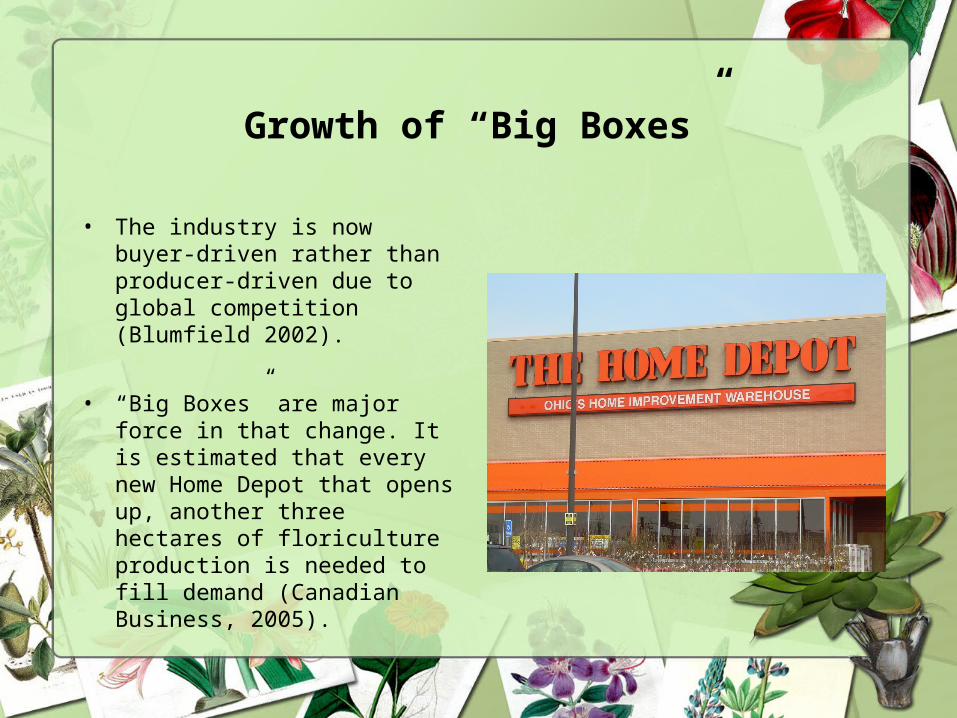
Growth of “Big Boxes”
• The industry is now buyer-driven rather than producer-driven due to global competition (Blumfield 2002).
• “Big Boxes” are major force in that change. It is estimated that every new Home Depot that opens up, another three hectares of floriculture production is needed to fill demand (Canadian Business, 2005).

Growth of Home Depot
0
500
1000
1500
2000
25001
97
9
19
81
19
83
19
85
19
87
19
89
19
91
19
93
19
95
19
97
19
99
20
01
20
03
20
05
Sto
re N
um
be
rs

Growth of “Big Box” Retailers

Conclusions

Market Segmentation
• Growers are increasingly being segmented into those producing for the big chain stores, and those who direct market or sell to independent garden centers.
• Canadian imports are major competitor in the “big box” market.
Impact of Competition
• Northwest Ohio greenhouse industry
– Next 5 years
• 40% - industry less profitable
• 15% planning to downsize or close
Source: Grower Survey 2004

Continued Import Growth
• Continued growth of Canadian imports can be expected.
• Those imports are a major driver in moving the industry to being a buyer-driven supply chain and fostering the transition of the industry from a “cottage industry” to a large-scale commercial agricultural industry.

Trade Barriers
• In contrast to other industries, NAFTA has had little impact on this trade.
• Instead currency exchange rates and border issues related to Homeland Security seem to be more influential.
Acknowledgements
• This research is funded by the following grants from the U.S. Department of Agriculture:
– CSREES 2003-06230
– CSREES 2004-06222
– CSREES 2005-06269