the impact of assessment delivery method on student
TRANSCRIPT

The Impact of Assessment Delivery Method on Student Achievement in Language Arts
Alisa Elaine Seidelman B.S. University of Missouri, 2006 M.S. University of Missouri, 2007
E.S. University of Central Missouri, 2009
Submitted to the Graduate Department and Faculty of the School of Education of Baker University in
partial fulfillment of the requirements for the degree
Doctor of Education In
Educational Leadership
September 2014
Copyright 2014 by Alisa Elaine Seidelman

ii
Committee Members
Major Advisor

iii
Abstract
The purpose of this study was to determine to what extent there was a difference
in student achievement, as measured by the Acuity Language Arts Diagnostic
assessment, between students using a paper/pencil or a computer-based delivery method.
The researcher also examined to what extent the difference in student achievement was
affected by gender, minority status, and socioeconomic status. A quantitative research
design was used in this study.
The population of interest was upper elementary students in the state of Missouri.
The sample for the study included approximately 650 fifth and sixth grade students from
Mill Creek Upper Elementary during the 2011-2012 school year. At the time of this
study, Mill Creek Upper Elementary was a school in the Belton School District located
south of Kansas City, Missouri. The dependent variable was the students’ Language Arts
score from the Acuity Language Arts Diagnostic assessment. Four independent grouping
variables included the assessment delivery method (paper/pencil or computer-based) as
well as the demographics of gender (male/female), minority status (minority/non-
minority) and socioeconomic status (low SES/non-low SES).
Findings revealed a statistically significant difference did exist between the sixth
grade males and sixth grade females when taking the computer-based assessment. The
mean achievement score for the sixth grade males on the computer-based assessment was
more than 10% lower than the mean achievement score for the sixth grade females.
Although a statistically significant difference did exist between the sixth grade males and
sixth grade females on the computer-based assessment, the same did not hold true for
fifth grade male and fifth grade female study participants or for sixth grade male and

iv
sixth grade female participants who took the paper/pencil assessment. Additionally, a
relationship between assessment delivery method and minority and socioeconomic status
was not statistically significant. This research supports the comparability of paper/pencil
and computer-based assessments but encourages those analyzing achievement data to
continue to disaggregate the data by the demographics of gender, minority, and
socioeconomic status.

v
Acknowledgements
I wish to convey my deepest and most heartfelt appreciation to all of those who
supported me on this doctoral journey.
To my parents, Marion and Brad Baker, who never placed limits on my
educational aspirations. Your encouragement and support from a very young age
instilled in me that I had the ability to accomplish any goal I set for myself. Furthermore,
your constant modeling of hard work, dedication to faith and family, and service to others
is what initially led me to teach.
To my advisor, Dr. Verneda Edwards, for your commitment to my completion of
the Baker Ed D. program. You have such a supportive nature and encouraging spirit.
Your swift feedback throughout this process was motivating.
My sincerest thanks to Ms. Peg Waterman and Dr. Susan Rogers. The time and
effort you put into helping this work become a finished product is deeply appreciated.
Peg, you helped me understand statistics as much as anyone could. I would also like to
thank Dr. Rhonda Hardee for giving of her time to serve on my committee.
To Carrie Rolling for teaching me so much about the writing process and for the
friendship we developed I am grateful. The way that you give selflessly of yourself to
others makes this world a better place. I have learned so much from you.
To my son, Clayton, you have been my inspiration to complete the last leg of this
doctoral journey. Because of your warm smile, your infectious giggles, and your many
first-year milestones, Mommy worked harder to complete this document so I can spend
more time with you. My prayer for you as you grow up is that you will value education

vi
and come to realize your fullest potential. There are no limits to what you can achieve.
Mommy loves you more than you will ever know.
Most importantly, to my husband and best friend, Craig, your unending love and
support made all of this possible. You never doubted me for a minute, nor did you ever
complain about picking up some extra chores around the house when I was busy writing.
Your encouragement and compassion makes me want to be a better person. I love you.
Last, I give praise and thanks to God for blessing me with the aspiration and
perseverance needed to attain this goal. It is through Him that all things are possible.

vii
Table of Contents
Abstract .............................................................................................................................. iii
Acknowledgements ............................................................................................................. v
Table of Contents .............................................................................................................. vii
List of Tables ...................................................................................................................... x
Chapter One: Introduction .................................................................................................. 1
Background ............................................................................................................. 4
Statement of the Problem ........................................................................................ 9
Purpose of Study ................................................................................................... 11
Significance of Study ............................................................................................ 11
Delimitations ......................................................................................................... 12
Assumptions .......................................................................................................... 12
Research Questions ............................................................................................... 13
Definition of Terms ............................................................................................... 15
Overview of Methods .......................................................................................... 18
Organization of the Study ..................................................................................... 19
Chapter Two: Review of Literature .................................................................................. 20
Historical Perspective on Assessments ................................................................. 20
Computer-Based Testing and Implications for Schools ....................................... 28
Computer-based delivery methods ........................................................... 29
Advantages of computer-based assessments for schools .......................... 31
Disadvantages of computer-based assessments for schools ..................... 36
The Impact of Computer-Based Testing for Students .......................................... 39

viii
Student anxiety .......................................................................................... 40
Student motivation .................................................................................... 43
Demographics and Their Impact on Testing ......................................................... 46
Summary ............................................................................................................... 50
Chapter Three: Methods ................................................................................................... 51
Research Design .................................................................................................... 51
Population and Sample ......................................................................................... 51
Sampling Procedures ............................................................................................ 52
Instrumentation ..................................................................................................... 52
Measurement ............................................................................................. 55
Validity and reliability .............................................................................. 56
Data Collection Procedures ................................................................................... 59
Data Analysis and Hypothesis Testing ................................................................. 61
Limitations ............................................................................................................ 66
Summary ............................................................................................................... 67
Chapter Four: Results ....................................................................................................... 68
Hypothesis Testing ................................................................................................ 68
Summary ............................................................................................................... 77
Chapter Five: Interpretation and Recommendations ....................................................... 79
Study Summary ..................................................................................................... 79
Overview of the problem .......................................................................... 80
Purpose statement and research questions ................................................ 81
Review of the methodology ...................................................................... 81

ix
Major findings ........................................................................................... 82
Findings Related to the Literature ......................................................................... 82
Conclusions ........................................................................................................... 86
Implications for action .............................................................................. 86
Recommendations for future research ...................................................... 87
Concluding remarks .................................................................................. 88
References ............................................................................................................. 89
Appendices .......................................................................................................... 104
Appendix A. Maximum Annual Household Income Eligible for Free and Reduced
Priced Meals ................................................................................. 105
Appendix B. Baker University IRB Application ................................................ 107
Appendix C. Belton School District Approval Letter ......................................... 112
Appendix D. Baker University IRB Approval Letter ......................................... 114
Appendix E. Acuity Research Synopsis Prepared for Alisa Seidelman ............. 116

x
List of Tables
Table 1. Gender Data for the Belton School District 2011-2012 ....................................... 6
Table 2. Minority Status Data for the Belton School District 2011-2012 .......................... 7
Table 3. Socioeconomic Status (SES) Data for the Belton School District 2011-2012 ..... 8
Table 4. Descriptive Statistics for the Results of the Test for H1 (Fifth Grade
Students) .............................................................................................................. 70
Table 5. Descriptive Statistics for the Results of the Test for H2 (Fifth Grade
Students) ............................................................................................................ 71
Table 6. Descriptive Statistics for the Results of the Test for H3 (Fifth Grade
Students) ............................................................................................................ 72
Table 7. Descriptive Statistics for the Results of the Test for H4 (Fifth Grade
Students) ............................................................................................................ 73
Table 8. Descriptive Statistics for the Results of the Test for H5 (Sixth Grade
Students) ............................................................................................................ 75
Table 9. Descriptive Statistics for the Results of the Test for H6 (Sixth Grade
Students) ............................................................................................................ 76
Table 10. Descriptive Statistics for the Results of the Test for H7 (Sixth Grade
Students) ........................................................................................................... 77
Table 11. Descriptive Statistics for the Results of the Test for H8 (Sixth Grade
Students) ........................................................................................................... 78

1
Chapter One
Introduction
Since the 1980s, researchers have looked at the differences between the delivery
of paper/pencil and computer-based testing. Bunderson, Inouye, and Olsen (1989)
reviewed twenty-three studies comparing paper/pencil and computer-based testing. Of
the twenty-three studies, three indicated that participants obtained higher scores when
tested on a computer, nine showed higher results when participants were tested using
paper/pencil, and eleven reported that there was no difference in achievement between
the two test delivery methods. Additional studies have also indicated inconclusive results
with regard to a preferred testing delivery method (Mazzeo & Harvey, 1988; Wise &
Plake, 1989). However, these studies included mostly small samplings of college-age
students. Kim and Huynh (2007) conducted an analysis of individual students’ scale
scores from Algebra and Biology end-of-course exams that were administered using
either paper/pencil or a computer. Fifteen schools from five districts volunteered to
participate in the study. Kim and Huynh (2007) found nothing to suggest a difference in
student performance based on the two delivery methods. Because of these studies and
their dissimilar results (across three decades) there continues to be a need for additional
research to closely examine the impact gender, minority, and socioeconomic status have
with regard to paper/pencil and computer-based testing among school-aged children.
A study of this nature, in relation to previous studies, is not a direct comparison
because today’s students are digital natives, whereas, in the 1980’s, students were digital
immigrants. Prensky (2001) defined digital natives as those who are “native speakers of
the digital language” (p. 1). Prensky (2001) went on to explain that speaking the digital

2
language may include being proficient with computers, cell phones, video games, video
cameras, digital music devices, and other devices that include digital components. Later,
Prensky (2013) asserted that technology has moved from supporting brain activity to
being integrated into and interdependent on brain activity. Prensky (2013) made it clear
that the way today’s technology natives think and learn is different from how learning
took place for technology immigrants. This study explored the difference in assessment
delivery methods using digital natives as the population.
While there have been significant changes to how learning occurs for those who
were students (digital natives) at the time of this study, assessment in education has also
undergone change. At the time of this study, schools had to meet the most rigorous
academic standards ever placed upon them, while also meeting the needs of an
increasingly diverse student population (Missouri Department of Elementary and
Secondary Education, 2014). The objective of the No Child Left Behind Act of 2001
(NCLB) was for all students to be proficient in Language Arts and Mathematics by 2014
(No Child Left Behind, 2002). To meet this requirement, each state adopted a
standardized test that determined how well students were progressing toward proficiency.
Consequently, states focused on identifying a testing delivery method that would yield
the highest achievement results (Wang, Jiao, Young, Brooks, & Olson, 2008). “The
implementation of the NCLB Act has increased the stakes for testing. Education
stakeholders have been exploring more efficient measurement tools in place of traditional
paper-and-pencil tests (PPTs)” (Wang et al., 2008, p. 6).
As a component of the NCLB Act, Adequate Yearly Progress (AYP) benchmarks
were identified by each state to measure academic progress. Additionally, they were

3
used to identify high-needs schools in each state and consequences were imposed when
schools failed to meet incremental benchmarks (No Child Left Behind, 2002). Since
schools not meeting their AYP targets were facing sanctions from the United States
Department of Education, the need for students to do their best on assessments became an
intense focus for stakeholders. This increased focus on standardized testing has required
educators to take a closer look at the delivery method they use to assess students. The
increased significance of the role technology started to play exacerbated the need to
evaluate technology-based assessment delivery methods. “For the digital age, we need
new curricula, new organization, new architecture, new teaching, new student
assessments, new parental connections, new administration procedures, and many other
elements,” (Prensky, 2005, para. 28). Technology has shaped the way educators teach
and assess students (Prensky, 2005).
Missouri’s 2001 Senate Bill 319 [Missouri’s Department of Elementary and
Secondary Education (DESE) School Laws, 2008] legislation required fourth grade
students who were in regular education and were English proficient to be retained if the
students scored below a third grade reading level. Additionally, the Senate Bill 319
legislation required that schools provide reading tutoring and individualized reading plans
for all fourth through sixth grade students who were more than one grade level behind in
reading. This legislation also mandated that school districts utilize a uniform assessment
for measuring the reading ability of students. Under the law, each school district had the
flexibility to determine measures to use for assessing students’ reading levels (Missouri’s
DESE School Laws, 2008). The No Child Left Behind Act of 2001 and Missouri’s 2001
Senate Bill 319 legislation have ensured schools in Missouri would be held accountable

4
for underperforming students. The Senate Bill 319 legislation required student reading
levels be no further behind than two academic years for all students regardless of
demographics (Missouri’s DESE School Laws, 2008).
According to Protheroe (2008), most underperforming schools consist of students
from low socioeconomic status (low SES), and have increased numbers of minority
students, and English Language Learners (ELL). Historically, some school stakeholders
have suggested that certain demographic variables may imply more or less experience
with technology for some subgroups when compared with others (Sutton, 1991). Since
Sutton’s (1991) work, computer usage proved to be related to socioeconomic status
(Quick & Gallagher, 2004). As more schools have turned to technology to assess the
learning of students and have been required to report assessment results for identified
subgroups of students, educators and administrators should know the effect computerized
assessment delivery methods have on those subgroups’ scores.
Background
The Belton School District #124 is a public school district that educates students
from the city of Belton, Missouri, a suburb of Kansas City, Missouri. During the 2011-
2012 school year, Belton had an approximate enrollment of 5100 in grades kindergarten
through twelve (Belton School District, 2012). At the time of this study, five elementary
schools housed kindergarten through fourth grade students. Mill Creek Upper
Elementary housed all fifth and sixth grade students within the school district (Belton
School District, 2012). When students entered Mill Creek Upper Elementary at the
beginning of the 2011-2012 school year, it was the first time their entire grade level,
district wide, was housed in one location. After Mill Creek Upper Elementary, students

5
moved to Yeokum Middle School where they spent their seventh and eighth grade years
(Belton School District, 2012). From there, students advanced to the Freshmen Center.
Finally, students made their last transition to the Belton High School where tenth,
eleventh, and twelfth graders reside (Belton School District, 2012). At the time of this
study, the Belton School District was unique to Missouri in that their students
transitioned through five buildings while completing their K-12 education experience.
More specific district demographic data, as well as each school’s individual
building demographics, are presented in the tables below. The data was provided by the
Belton School District, rather than the Missouri Department of Elementary and
Secondary Education (DESE). Using information from the school district was more
current than what was available from DESE.
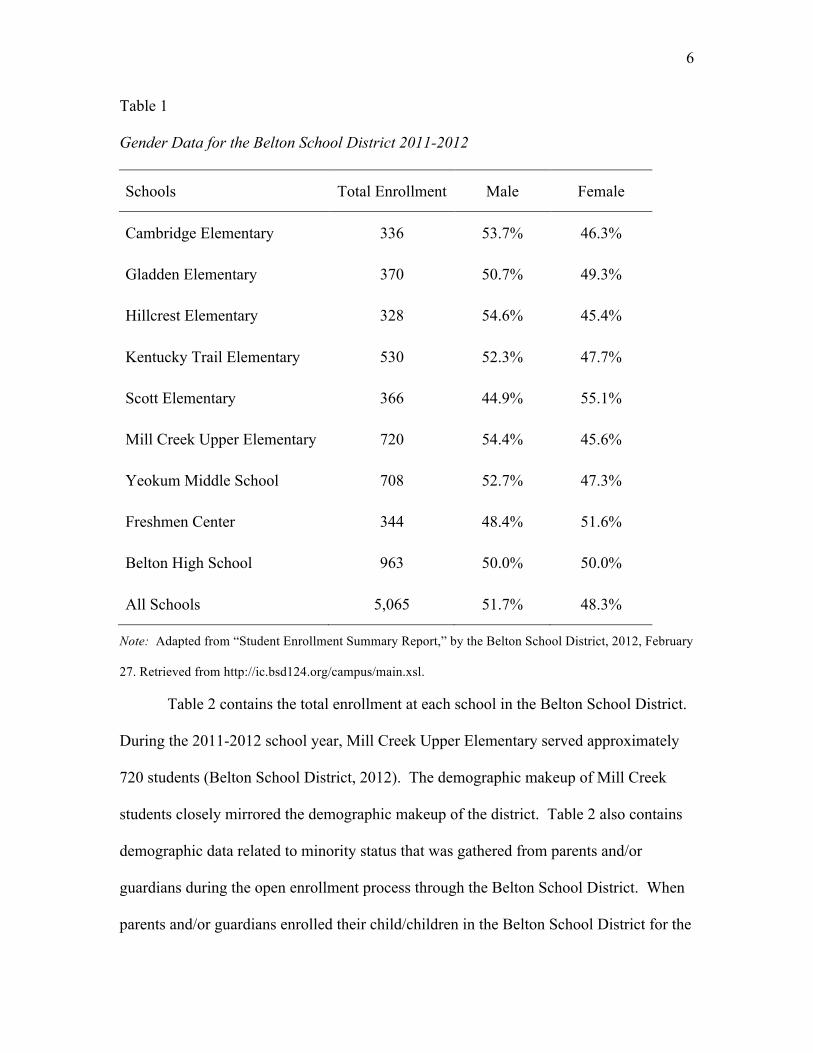
The demographic data from the Belton School District found in Table 1 focuses
on gender by school. Data related to gender was gathered from parents and/or guardians
during the open enrollment process through the Belton School District (2012). Mill
Creek Upper Elementary had approximately 10% more males than females in attendance
at the time of this study. The gender makeup of the schools was relatively similar with
the exception of the Freshmen Center and Scott Elementary, each of which had a higher
percentage of females.
6
Table 1
Gender Data for the Belton School District 2011-2012
Schools Total Enrollment Male Female
Cambridge Elementary 336 53.7% 46.3%
Gladden Elementary 370 50.7% 49.3%
Hillcrest Elementary 328 54.6% 45.4%
Kentucky Trail Elementary 530 52.3% 47.7%
Scott Elementary 366 44.9% 55.1%
Mill Creek Upper Elementary 720 54.4% 45.6%
Yeokum Middle School 708 52.7% 47.3%
Freshmen Center 344 48.4% 51.6%
Belton High School 963 50.0% 50.0%
All Schools 5,065 51.7% 48.3%
Note: Adapted from “Student Enrollment Summary Report,” by the Belton School District, 2012, February
27. Retrieved from http://ic.bsd124.org/campus/main.xsl.
Table 2 contains the total enrollment at each school in the Belton School District.
During the 2011-2012 school year, Mill Creek Upper Elementary served approximately
720 students (Belton School District, 2012). The demographic makeup of Mill Creek
students closely mirrored the demographic makeup of the district. Table 2 also contains
demographic data related to minority status that was gathered from parents and/or
guardians during the open enrollment process through the Belton School District. When
parents and/or guardians enrolled their child/children in the Belton School District for the

7
2011-2012 school year, they identified them as being American Indian, Asian/Pacific
Islander, Black, Hispanic/Latino, Multi-Racial, White, or Other. The researcher
categorized those identified as American Indian, Asian/Pacific Islander, Black,
Hispanic/Latino, Multi-Racial, or Other as minority and those identified as White as non-
minority.
Table 2
Minority Status Data for the Belton School District 2011-2012
Schools Total Enrollment Non-Minority Minority
Cambridge Elementary 336 73.5% 26.5%
Gladden Elementary 370 74.6% 25.4%
Hillcrest Elementary 328 64.0% 36.0%
Kentucky Trail Elementary 530 78.7% 21.3%
Scott Elementary 366 79.2% 20.8%
Mill Creek Upper Elementary 720 77.8% 22.2%
Yeokum Middle School 708 74.9% 25.1%
Freshmen Center 344 75.9% 24.1%
Belton High School 963 75.6% 24.4%
All Schools 5,065 75.1% 24.9%
Note: Adapted from “Student Enrollment Summary Report,” by the Belton School District, 2012, February
27. Retrieved from http://ic.bsd124.org/campus/main.xsl.
Demographic data from the Belton School District related to socioeconomic status
is housed in Table 3. Data related to socioeconomic status was gathered through the

8
Belton School District’s Student Enrollment Summary Report (Belton School District,
2012). For the purpose of this study, students who received free or reduced meal prices
were categorized as being low socioeconomic status. It is important to note, with the
exception of Belton High School, all buildings in the Belton School District had a free
and reduced lunch population that exceeded 50%. Mill Creek Upper Elementary School
had a low socioeconomic status population of 53.5% at the time data was collected for
this study. The distribution was rather similar for all schools with the exception of Belton
High School, Hillcrest Elementary, and Scott Elementary.
Table 3
Socioeconomic Status (SES) Data for the Belton School District 2011-2012
Schools Total Enrollment Low SES Non-low SES
Cambridge Elementary 336 53.5% 46.5%
Gladden Elementary 370 53.8% 46.2%
Hillcrest Elementary 328 64.0% 36.0%
Kentucky Trail Elementary 530 50.4% 49.6%
Scott Elementary 366 65.0% 35.0%
Mill Creek Upper Elementary 720 53.5% 46.5%
Yeokum Middle School 708 51.1% 48.9%
Freshmen Center 344 55.0% 45.0%
Belton High School 963 41.3% 58.7%
All Schools 5,065 52.5% 47.5%
Note: Adapted from “Student Enrollment Summary Report,” by the Belton School District, 2012, February
27. Retrieved from http://ic.bsd124.org/campus/main.xsl.
In an effort to meet the academic needs of a racially and socioeconomically
diverse school district, the Belton School District began administering the Acuity
9
Predictive assessments during the 2010-2011 school year (Belton School District, 2012).
These formative assessments were intended to provide a prediction of each student’s
performance on the state assessment and were administered to all students’ grades three
through eight. During the 2011-2012 school year, the Belton School District continued
administration of the Acuity Language Arts Predictive assessments (administered in
January, 2012) and, additionally, the Acuity Language Arts Diagnostic assessments
(administered in May, 2012) (R. Poisal, personal communication, August 6, 2011).
Statement of the Problem
As required by No Child Left Behind (NCLB), in addition to reporting overall
student performance, states had to report assessment results for identified subgroups of
students. When NCLB expired at the end of the 2013-2014 school year, each state
continued to have its own accreditation model (DESE, 2013). Missouri required
subgroup reporting; the Missouri School Improvement Program’s fifth cycle (MSIP 5)
required Missouri school districts to report assessment results for a super subgroup
composed of the following subgroups: Asian/Pacific Islander, Black, Hispanic, American
Indian, White, Multi-Racial, Free or Reduced Lunch, Individualized Education Plan, and
Limited English Proficiency (DESE, 2013). While overall achievement gains were
important, it was also critical for schools to show improvement among subgroup
achievement.
During the 2002-2003 school year, thirteen states were among the first to
administer computer-based state assessments after the NCLB Act was put into effect.
Two additional states joined one year later (Olson, 2003). As of 2012, the delivery
method by which students were assessed was left up to individual states (DESE, 2013).

10
Research has been conducted to identify whether differences exist in student
performance between students taking paper/pencil or computer-based assessments
(Baumer, Roded, & Gafni, 2009; Bhoola-Patel & Laher, 2011; Bugbee, 1996; Pomplun,
Ritchie, & Custer 2006; Wang et al., 2008). However, little research has been conducted
to determine how subgroups respond to the different testing delivery methods. In a
synthesis of more than 80 studies comparing paper/pencil and computer-based
assessments Kingston (2009) concluded the majority of studies did not focus on varying
subgroups of students and their comparability. Kim and Huynh (2010) found similar
performance between students assessed using paper/pencil and computer-based
assessments. Additionally, Kim and Huynh (2010) noted the following:
Many of the previous studies concerning statewide computer-based assessments
focused mainly on the performance of the student body as a whole, not on the
performance of student subgroups. Only a few studies have directly investigated
the mode effect for subgroups of students in the K-12 large-scale assessment. (p.
109)
NCLB heightened the importance of assessment results and forced educators to
focus on testing practices to comply with new requirements (Wang et al., 2008).
Language Arts was the most highly tested content area, albeit not the only tested area,
according to Stenner (1996). With the emphasis on Language Arts subgroup
achievement and the increase in states using computer-based testing, it has become
imperative that the differences related to gender, minority, and socioeconomic status be
further investigated with regard to Language Arts assessment practices.

11
Purpose of Study
The purpose of this study was to determine whether there was a difference in
student achievement, as measured by the Acuity Language Arts Diagnostic assessment,
between students using a paper/pencil or a computer-based delivery method. The
researcher also examined whether the difference in student achievement was affected by
gender, minority, and socioeconomic status. Participants were of upper elementary age
(fifth or sixth grade) at the time of the study.
Significance of Study
During the 1980s, researchers began to look at the differences between
paper/pencil and computer-based testing (Mazzeo & Harvey, 1988; Wise & Plake, 1989).
In the 1990s, Bugbee (1996) continued to examine the differences between the testing
delivery methods. Clariana and Wallace (2002) further investigated testing delivery
methods in the 2000s. The research has shown varied outcomes with Bugbee (1996)
finding little difference between students tested using different delivery methods and
Clariana and Wallace (2002) noting increased achievement on computer-based
assessments. The current study contributed to the scholarly body of literature and
educational profession by identifying the differences in achievement when students were
tested using paper/pencil compared with when they were tested on a computer-based
delivery method; furthermore, the study disaggregated the results by looking at the
subgroup data of gender, minority, and socioeconomic status.
Multiple studies have examined the effects of technology on Language Arts
instruction, and some have also assessed the impact of technology on Language Arts
assessments (Bauer, 2005; Gordon, 2011; Millsap, 2000). Fewer studies have examined

12
the effect of the delivery method (paper/pencil or computer-based) on the relationship
between the gender, minority, and socioeconomic status of students and their Language
Arts assessment results (Flowers, Do-Hong, Lewis, & Davis, 2011; Kim & Huynh,
2009). The results of this study could aid policy makers, educational leaders, and
classroom teachers as they make decisions with regard to holding schools accountable
using standardized testing. This research may encourage decision makers, when
selecting assessment delivery methods, to consider the advantages or disadvantages a
particular gender, minority, or socioeconomic group may experience.
Delimitations
“Delimitations are self-imposed boundaries set by the researcher on the purpose
and scope of the study” (Lunenburg & Irby, 2008, p. 134). The researcher used the
following delimitations to limit the scope of the current study:
a) All participants were students enrolled during the 2011-2012 school year.
b) All participants were students who attended one public school district located
in Belton, Missouri.
c) Only scores in the content area of Language Arts were compared.
Assumptions
Assumptions are the proposals that are considered operational during a research
study (Lunenburg & Irby, 2008). This study was conducted based on the following
assumptions:
a) Fifth and sixth grade students who participated in this study were comparable
with other students of the same age.

13
b) The Acuity Language Arts Diagnostic assessment and the Acuity Predictive C
Language Arts assessment are accurate measures of study participants’
Language Arts ability.
c) Assessment proctors implemented the Acuity Diagnostic assessment with
fidelity.
d) The reading abilities of Groups A and Groups B students were equal due to
the utilization of systematic selection and Language Arts achievement used
when forming groups.
e) Paper/pencil Acuity Diagnostic assessments were accurately scored and
entered into archival records using a manual system.
f) Computer-based Acuity Diagnostic assessments were accurately scored using
an automated system that transferred the data into archival records.
g) Students who participated in the study answered assessment questions to the
best of their cognitive ability.
h) Students’ familiarity with computers and access to computers in the school
setting was equal before this study.
i) Teachers providing instruction to those participating in the study followed
district-required curriculum and pacing guides.
Research Questions
Research questions give the study direction and contain the essence of the study
for those who review them (Lunenburg & Irby, 2008). The following research questions
guided this study:

14
RQ1. To what extent is there a statistically significant difference in student
Language Arts achievement, as measured by the Acuity Language Arts
Diagnostic assessment, between fifth grade students using a paper/pencil delivery
method and fifth grade students using a computer-based delivery method?
RQ2. To what extent is the difference in student Language Arts achievement, as
measured by the Acuity Language Arts Diagnostic assessment, between fifth
grade students using a paper/pencil delivery method and fifth grade students using
a computer-based delivery method affected by gender?
RQ3. To what extent is the difference in student Language Arts achievement, as
measured by the Acuity Language Arts Diagnostic assessment, between fifth
grade students using a paper/pencil delivery method and fifth grade students using
a computer-based delivery method affected by minority status?
RQ4. To what extent is the difference in student Language Arts achievement, as
measured by the Acuity Language Arts Diagnostic assessment, between fifth
grade students using a paper/pencil delivery method and fifth grade students using
a computer-based delivery method affected by socioeconomic status?
RQ5. To what extent is there a statistically significant difference in student
Language Arts achievement, as measured by the Acuity Language Arts
Diagnostic assessment, between sixth grade students using a paper/pencil delivery
method and sixth grade students using a computer-based delivery method?
RQ6. To what extent is the difference in student Language Arts achievement, as
measured by the Acuity Language Arts Diagnostic assessment, between sixth

15
grade students using a paper/pencil delivery method and sixth grade students
using a computer-based delivery method affected by gender?
RQ7. To what extent is the difference in student Language Arts achievement, as
measured by the Acuity Language Arts Diagnostic assessment, between sixth
grade students using a paper/pencil delivery method and sixth grade students
using a computer-based delivery method affected by minority status?
RQ8. To what extent is the difference in student Language Arts achievement, as
measured by the Acuity Language Arts Diagnostic assessment, between sixth
grade students using a paper/pencil delivery method and sixth grade students
using a computer-based delivery method affected by socioeconomic status?
Definition of Terms
This section of the study identified and defined key terms that were used
throughout the study.
Acuity Language Arts Diagnostic Assessment©. This is an assessment created
by CTB/McGraw-Hill designed to align with local curriculum and state Grade Level
Expectations. The assessment could be administered using a paper/pencil delivery
method or on a computer. Student data was provided to teachers immediately following
students completing a given assessment. This assessment provided a comprehensive
view of assessed students’ strengths and weaknesses related to Grade Level Expectations
in fiction, nonfiction, and poetry. The assessment also reports findings in
comprehension, text features, vocabulary, grammar usage, and punctuation/capitalization.
The Language Arts benchmark assessments were developed for grades two through
twelve (CTB/McGraw-Hill, 2011a).

16
Acuity Predictive C Language Arts assessment©. This is the third assessment in
the predictive series created by CTB/McGraw-Hill designed to predict students’
performance on the Missouri Assessment Program using test questions that were in
alignment with Grade Level Expectations. Acuity Predictive C Language Arts
assessment was designed to fully measure the tested grade levels content and standards.
Predictive assessments were designed to be used with students in grades three through
eight (CTB/McGraw-Hill, 2011a).
Computer based delivery method. A computer-based delivery method is
defined as an assessment administered to students using a computer or over the Internet.
Students read the assessment on a computer and answered a given set of questions at the
desired performance level using a computer keyboard and a mouse (Choi & Tinkler,
2002).
Ethnic groups. For the purpose of this study, a minority was someone who was
African American, Hispanic/Latino, or from another ethnic group that was not classified
as White. African Americans were defined as “A person having origins in any of the
Black racial groups in Africa” (Rastogi, Johnson, Hoeffel, & Drewery, 2011, p. 2).
Hispanic/Latinos were defined as “A person of Cuban, Mexican, Puerto Rican, South or
Central American, or other Spanish culture or origin regardless of race” (Ennis, Rios-
Vargas, & Albert, 2011, p. 2). The term Hispanic was most common in the eastern part
of the United States, while the term Latino was most common in the western portion of
the United States (U.S. Office of Management and Budget, 1997). For the purpose of
this study, a non-minority was, defined as,

17
‘White’ refers to a person having origins in any of the original peoples of Europe,
the Middle East, or North Africa. The White racial category included people who
marked the “White” checkbox on the 2010 United States Census. It also included
respondents who reported entries on the 2010 United States Census such as
Caucasian or White; European entries, such as Irish, German, and Polish; Middle
Eastern entries, such as Arab, Lebanese, and Palestinian; and North African
entries, such as Algerian, Moroccan, and Egyptian. (Hixson, Hepler, & Kim,
2011, p. 2)
Language Arts. In the state of Missouri the Department of Elementary and
Secondary Education have define Language Arts as:
speaking and writing standard English (including grammar, usage, punctuation,
spelling, capitalization); reading and evaluating fiction, poetry and drama; reading
and evaluating nonfiction works and material (such as biographies, newspapers,
technical manuals); writing formally (such as reports, narratives, essays) and
informally (such as outlines, notes); comprehending and evaluating the content
and artistic aspects of oral and visual presentations (such as story-telling, debates,
lectures, multi-media productions); participating in formal and informal
presentations and discussions of issues and ideas; identifying and evaluating
relationships between language and culture. (DESE, 1996, para. 4)
Paper/pencil delivery method. A paper/pencil delivery method is defined as an
assessment administered to students using paper and a pencil. Students read the
assessment on paper and answered a given set of questions at the desired performance
level using paper and a pencil (CTB/McGraw-Hill, 2011a).

18
Socioeconomic status. For the purpose of this study, Low Socioeconomic Status
(Low SES) were students identified when they qualified for and participated in the free
and reduced meal program (see Appendix A). Non-Low Socioeconomic Status (Non-
Low SES) students were identified when they did not qualify for or participate in the free
and reduced meal program. The Missouri Department of Elementary and Secondary
Education set the standards for the Free and Reduced Meal Program (DESE, 2011).
Subgroup. A group of students with more than thirty members sharing the same
gender, minority status (African American, Hispanic/Latino, White), or socioeconomic
status as categorized by free or reduced meal benefits (Missouri Department of
Elementary and Secondary Education, 2004).
Overview of Methods
A quantitative research design was used to identify the extent of the difference in
student Language Arts achievement, as measured by the Acuity Language Arts
Diagnostic assessment, of 5th and 6th grade students using a paper/pencil delivery
method or computer-based delivery method. In addition, the researcher also examined
the effect of gender, minority, and socioeconomic status on the difference in academic
achievement in Language Arts as measured by the Acuity Language Arts Diagnostic
assessments. Purposive sampling was used to narrow data collection to fifth and sixth
grade students enrolled at Mill Creek Upper Elementary School in the Belton School
District. The Belton School District collected the Acuity Language Arts Predictive C
assessment data in January 2012, and the researcher gathered the Acuity Language Arts
Diagnostic assessment data in May 2012. The data was then compiled onto one
spreadsheet. The eight research questions concerning the assessment delivery method

19
were analyzed to determine if a difference existed between assessment delivery methods
as well as between participants from different gender, minority, and/or socioeconomic
groups.
Organization of the Study
This study is presented in five chapters. Chapter one introduced the study and
addressed the background of the study, statement of the problem, purpose, significance,
delimitations, assumptions, research questions, definition of terms, and overview of
methods. Chapter two contains a review of the literature related to current assessment
practices. Additionally, the chapter is divided into four sections: the historical
perspective of assessments, computer-based testing and implications for schools, the
impact of computer-based testing for students, and the demographics of gender, minority,
and socioeconomic status and their impact on testing. Chapter three describes the
methodology used in this study and includes a description of the research design;
population and sample; sampling procedures; instrumentation: measurement, validity,
and reliability; data collection procedures; data analysis and hypotheses testing; and
limitations of the study. Chapter four presents the results of the analysis of the data,
including the descriptive statistics and hypothesis testing. To close, chapter five provides
a study summary that includes an overview of the problem, purpose statement and
research questions, and review of methodology. The chapter ends with the findings
related to the literature and conclusions, which include implications for action,
recommendations for future research, and concluding remarks.

20
Chapter Two
Review of Literature
Student performance on state-required assessments has played a vital role in
education. In 2002, as a component of No Child Left Behind (NCLB), states had to
report assessment results for identified subgroups of students in addition to overall
student performance. Furthermore, the performance of subgroups has been a variable for
school and district accreditation. When NCLB expired at the end of the 2013-2014
school year, each state continued to have its own accreditation model. In Missouri, that
model included data from the performance of student subgroups (DESE, 2013).
Considering the national focus on student performance, the impact of assessment
delivery method on student performance has been of interest to the research community.
Research has been conducted from the 1980s (Bugbee, 1996; Mazzeo & Harvey, 1988;
Wise & Plake, 1989) through the 2000s (Clariana & Wallace, 2002) exploring the
differences between paper/pencil and computer-based testing. This research has shown
varied outcomes with Bugbee (1996) finding little difference between testing delivery
methods and Clariana and Wallace (2002) noting increased achievement on computer-
based assessments. This chapter provides the historical perspective of assessments,
computer-based testing and implications for schools, advantages and disadvantages of
computer-based testing for students, and the influence of demographics.
Historical Perspective on Assessments
For more than a century, assessments in schools have been a reality for teachers
and students in the United States. According to Linn (2000), beginning in the early
1900s, the United States government initiated assessment practices in American schools.

21
Over time, popularity grew for administering standardized testing, such as the
Intelligence Quotient (IQ), in public schools (Linn, 2000). The rationale behind
assessing students was to determine the innate ability of students and to predict their
future performance (Public Broadcasting Service, 2001). Early assessments centered
more on students’ current proficiencies rather than assessing student learning over time.
In the 1920s the Scholastic Aptitude Test was developed to help determine which
students had the ability to attend higher education. At the time of this study proficiency
based test scores, like the ACT and Scholastic Aptitude Test, continue to be used to
determine one’s ability to attend higher education, but they were also used to determine
whether students had mastered specific academic concepts. However, some educational
stakeholders were in opposition to this practice asserting gender, minority status, and
socioeconomic test bias (Linn, 2000; Walsh, 2003).
In the 1920s, the business side of educational assessment focused on publishing
and distributing paper/pencil testing materials that were graded by human scorers (Walsh,
2003). Historically, the Stanford Achievement Test, the Iowa Test of Basic Skills
(ITBS), and the California Achievement Test (CAT) dominated the publishing markets
because developing new, valid, and reliable assessments would have been cost
prohibitive (Walsh, 2003).
Until the 1950s, technology played a minimal role in educational assessment.
Beginning in the 1950s, the development of scanners (devices capable of reading and
scoring pencil marks on a page) allowed for the capability of grading marked answers.
The same decade saw an increase in multiple-choice assessments (Parshall, Spray,
Kalohn, & Davey, 2002). Users were impressed with the timeliness and accuracy with

22
which assessments were scored, and it was concluded that test takers perform better when
completing multiple-choice questions than short answer (Parshall et al., 2002).
In the 1960s assessments became an instrument used for compensatory education
and the government began evaluating federally funded programs (Linn, 2000). Linn
(2002) ascertained, “The congressional demands for evaluation and accountability for the
funds distributed under Title I of Elementary and Secondary Education Act [ESEA] as
well as several other programs of that era proved to be a boon to test publishers” (p. 5).
Thus, test makers were profiting from the rise in educational accountability.
The 1970s brought about minimum-competency testing. This form of assessment
could be used with all students and focused on monitoring the lower range of
achievement, or basic academic skills (Linn, 2000). By the end of the 1970s over half of
the states were using a minimum-competency exam as a high school graduation
requirement (Linn, 2000). Also taking place in the 1970s was the use of the IBM 1500,
which was said to be the first computer specifically designed for an instructional and
assessment purpose, rather than for general use (Kinzer, Sherwood, & Bransford, 1986).
Nevertheless, narrow computer capabilities coupled with high costs of implementation
reduced the ability of schools to use computer-based assessments in this era (Kim &
Huynh, 2007).
Even though computer-based testing was introduced in the 1970s, it was not until
the technology advancements of the 1980s and 1990s that there was an increase in the
number of schools administering what was once a traditional paper/pencil assessment,
through use of a computer. Some initial users of computer-based testing systems
believed they could gather more information about testers than more traditional

23
paper/pencil methods because the efficiency of computer-based testing assessment more
information in the same time frame (Wise & Plake, 1989). However, early integration of
assessments and technology focused on logistical efficiencies such as swift scoring in a
cost effective manner (Bennett, 2008; Bugbee & Bernt, 1990; Quellmalz & Pellegrino,
2009). Some of the first computer-based testing systems included Blackboard, QUIZIT,
WebCT, ASSYST, and PILOT (AL-Smadi & Gütl, 2008). Each of these systems
allowed testers to take and be scored on an assessment using a computer-based model
(AL-Smadi & Gütl, 2008). The 2008 research conducted by AL-Smadi and Gütl showed
that some standardized paper/pencil assessment instruments were converted into a
computer-based delivery method using similar test questions and formatting.
Bleske-Rechek, Zeug, and Webb (2007) conducted an analysis on systematic
assessment data from three psychology classes to determine which measures were more
accurate: multiple-choice or short-answer. The study included approximately170
college-age students. In their study over exam and achievement data Bleske-Rechek, et
al. (2007) drew a similar conclusion to Parshall, Spray, Kalohn, and Davey (2002).
Through the research (Bleske-Rechek et al., 2007), it was determined that when
professors used multiple-choice questions, compared to short-answer questions, the
multiple-choice version produced a more accurate assessment measure, since the
multiple-choice assessment was able to eliminate subjectivity from the scoring process.
In a study conducted by Bontis, Hardie, and Serenko (2009) that included 1551
participants, it was concluded that multiple-choice assessments were the most accurate
measure of student achievement. The researchers used a quantitative analysis over
various components of course grades for students who had completed a Business Policy

24
and Strategic Management class. According to Douglas, Wilson, and Ennis (2012),
multiple-choice assessments decreased the level of assessment bias and increased the
level of scoring accuracy since the completed multiple-choice assessment could be scored
more objectively than other forms of assessments. For these reasons, multiple-choice
assessments became increasingly popular.
The No Child Left Behind (NCLB) Act of 2001 (2002) altered the way in which
schools, districts, and states utilized assessments and communicated their results. The
prominence of school accountability led to an increased focus on the delivery method
through which students were being assessed (Edwards, Chronister, Bushweller, Skinner,
& Bowman, 2003). Even though there was a call for increased accountability from the
federal and state governments, there was some flexibility as individual states were
allowed to select their own assessment and delivery method.
At the national level, individual states were being supported financially in their
efforts to make decisions surrounding the improvement of high quality assessment
systems. Since the implementation of NCLB, funding for Title I grants going to high-
poverty schools increased by 63% (“Fact Sheet,” n.d.). Additionally, special education
programs saw an increase of 67% in their funding since the inception of NCLB in 2001
(“Fact Sheet,” n.d.). Furthermore, states were encouraged to develop high quality
assessments that allowed for accurate measurement of student progress as well as the
progress of teachers, administrators, schools, and districts. With school accountability
being greater than ever, a continued emphasis on quality assessments, student
performance, and score reporting were imperative (Whitaker, Williams, & Dodd, 2011).

25
Some school stakeholders had concerns about NCLB’s effectiveness. Since the
beginning of the Obama administration, attention had been given to the disparities that
existed between the levels of rigor at which standards were being assessed among
varying states (Sloan, 2010). In 2009, U.S. Secretary of Education, Arne Duncan
asserted:
We want to raise the bar dramatically in terms of higher standards. What we have
had as a country, I'm convinced, is what we call a race to the bottom. We have 50
different standards, 50 different goal posts. And due to political pressure, those
have been dumbed down. We want to fundamentally reverse that. We want
common, career-ready internationally benchmarked standards. (as cited in Sloan,
2010, para. 2)
The spotlight on the varying levels of rigor between states on their individual state
assessments led to the Recovery and Reinvestment Act of 2009, which focused on
aligning the academic expectations and their measures in public education (United States
Department of Education, 2013).
The Race to the Top Assessment Program, operating under the American
Recovery and Reinvestment Act of 2009, authorized funding to assessment consortia in
an attempt to create valid and reliable state assessments regarding what students
understood and were able to produce (United States Department of Education, 2013).
The objective was for standards to be in place that would ensure essential college and
career readiness skills were being written, taught, and tested. The new assessments were
significant, as the purpose was to acquire and utilize data that would improve teaching
and learning (United States Department of Education, 2013). Furthermore, the

26
assessments would help the nation keep pulse on progress being made towards President
Obama’s goal of being a world leader of college graduates by 2020 (United States
Department of Education, 2013).
The U.S. Department of Education (2010) distributed $330 million to two
consortia (The Smarter Balanced Assessment Consortium and The Partnership for
Assessment of Readiness for College and Careers) to develop assessments that aligned
with the new Common Core State Standards. Several states chose to partner with both
consortia (Fisher & Frey, 2013; Hwang, McMaken, Porter, & Yang, 2011). The
Partnership for Assessment of Readiness for College and Careers (PARCC) received
$176 million and represented over twenty-five states, while the Smarter Balanced
Assessment Consortium (SBAC) was awarded $160 million and represented over thirty
states (Fisher & Frey, 2013). The objective for the consortia was to design and
implement new common state assessments beginning in third grade and continuing
through high school. These are scheduled to be implemented during the 2014-2015
academic year (Fisher & Frey, 2013).
At the time of this study, both PARCC and SBAC plan to use computer-based
assessments during the pilot study. The SBAC consortium will use adaptive computer-
based assessments; students answer questions whose difficulty increase or decrease
depending on correct and/or incorrect student responses. It was unclear whether or not
PARCC would be adaptive (Aspen Institute, 2012; Fisher & Frey, 2013).
Assessment has been a constant component in education, regardless of the testing
delivery method (Rowe, 2004; Serwata, 2003). With bountiful research surrounding the
comparison of the two delivery methods, it was obvious that this was an important issue

27
in education and one that was likely to remain at the forefront of national, state, and local
discussions. NCLB required that states, districts, and schools publicize their state
assessment results. In addition, the U.S. Department of Education Office of Planning
(2010) encouraged educators to utilize assessment information as they adjusted
instruction and communicated with students and families.
The shifts from traditional paper/pencil tests to computer-based tests made some
question the compatibility of assessment results. Kapes and Vansickle (1992) conducted
a study with 61 undergraduate students who took two assessments, paper/pencil and
computer-based, within a two-week testing window using the test-retest design. They
discovered that the computer-based assessments were more reliable than the same exam
in a paper/pencil format. It was concluded that numerous assessment companies had
hastily entered into the transformation from paper/pencil to computer-based assessments
without determining if student results would be compromised. This prompted a variety
of research studies (Bugbee, 1996; Kim & Huynh, 2007; Neuman & Baydoun, 1998;
Peak, 2005; Poggio, Glasnapp, Yang, & Poggio, 2005) centered on whether testing
students using technology was equivalent to using a paper/pencil. Bugbee (1996)
conducted an examination of existing research to determine the equivalency between
paper/pencil and computer-based assessments. From this research it was determined that
during the 1980s and 1990s paper/pencil and computer-based assessment scores were
comparable. The ability of the two delivery methods (paper/pencil and computer-based)
to measure student performance equally determined whether the two test methods could

28
be interchangeable (Neuman & Baydoun, 1998). Current literature (Kim & Huynh,
2007; Peak, 2005; Poggio, et al., 2005) supports Bugbee’s historical findings that the two
testing delivery methods were comparable.
Computer-Based Testing and Implications for Schools
In the late 1970s, the notion of personal computers became a reality for few U.S.
residents. The impact computers have made on society over the last few decades is
undeniable:
Since the 1990s, the prevalence of computer use has grown exponentially.
Computers have permeated our households, businesses, and schools, leading us to
a point in time where many cannot remember or even imagine what life was like
before they existed. (Fritts & Marszalek, 2010, p. 441)
Personal computers changed the way tasks were executed in many aspects of life and at
an alarming rate.
Rabinowitz and Brandt (2001) pointed out the swiftness in which assessment
technologies evolved. The ways in which computers and similar handheld technological
devices have been used were a distant imagination only a generation ago (Rabinowitz &
Brandt, 2001). When considering the infrastructure of technology, advances have been
seen in speed, capacity, and computer availability. Rabinowitz and Brandt (2001)
predicted that software such as database structures, simulations, and artificial intelligence
models might someday become assessment tools with regard to administering, scoring,
and reporting. Rabinowitz and Brandt (2001) also predicted advancements with
computer-based assessments were on the horizon, and Lesage, Riopel, and Raîche (2010)
confirmed their forecast. Lesage et al. (2010) also introduced a new assessment model

29
known as the cluster assessment. Cluster assessment allowed a person to be assessed
regardless of their geographical location since these assessments were administered via
an online system. Furthermore, it was capable of being formative or summative in
nature. Lesage et al. (2010) asserted the cluster assessment enhanced computer-based
assessments, artificial intelligence, and database management.
Researchers and experts in the field of education have weighed in on the pros and
cons of computer-based assessments. With increased accountability from the federal
government through the NCLB Act, and more recently through the Race to the Top
education initiative, it was essential that educators understood the advantages and
disadvantages of using a particular assessment delivery method. Both PARCC and
SBAC planned to use adaptive computer-based assessments that included summative and
interim assessments (Aspen Institute, 2012; Fisher & Frey, 2013). Interim assessments
were defined as those that could be given between formative and summative assessments
so that progress could be monitored frequently (Perie, Marion, Gong, & Wurtzel, 2007).
Having a firm understanding of the advantages and disadvantages that exist between
different delivery methods would allow educators to make informed decisions when
selecting an assessment method to be used for high-stakes testing.
Computer-based delivery methods. Researchers have accepted that using a
computer-based method of assessment was the most effective and efficient method
available (Bugbee, 1996; Graham, Mogel, Brallier, & Palm, 2008). The growing use of
technology stems from the affordability and timeliness of utilizing technology when
assessing student learning (Bushweller, 2000; Trotter, 2002). Improvements in
technology have stimulated the use of computer software as a delivery method for

30
educational testing (Pomplun, Ritchie, & Custer, 2006). However, there was still debate
surrounding the delivery method that was most advantageous to increased student
performance. During the early stage of familiarization with computer-based testing,
states allowed schools to choose their preferred delivery method: paper/pencil or
computer-based (Flowers et al., 2011). With two delivery methods being accessed, it was
imperative that the comparability of scores be understood (Flowers et al., 2011).
Although research was not lacking with regard to the two delivery methods used
for testing, consensus among the research had not yet been reached. There was still much
room for debate when it came to the delivery method of testing that yielded the highest
achievement results. Historically, Bugbee (1996) concluded from his work in the 1980s
and early 1990s that little difference existed between the two delivery methods.
However, in a study of 105 college students enrolled in a Computer Fundamentals
course, Clariana and Wallace (2002) concluded students scored higher on computer-
based assessments when compared to paper/pencil exams. For study participants in the
paper/pencil group the mean score was 76%. Their counterparts in the computer-based
group outperformed them with a mean score of 83% (Clariana & Wallace, 2002). Some
of the more recent studies showed lower student performance on computer-based
methods when students were required to read and respond to lengthy reading passages
(Pommerich, 2004; Peak, 2005). In 1998 and 2000 Pommerich (2004) conducted
comparability studies by using a passage-based and multiple-choice assessment to
examine how student achievement was impacted when students were required to navigate
through a passage when responding to a test question. Comparisons were made between
the paper/pencil and computer-based assessment administration. There were over 10,000

31
11th and 12th grade participants included in each of the comparison studies (Pommerich,
2004). The results of both studies revealed that small differences between delivery
methods did exist between the assessments (Pommerich, 2004). For instance, Pommerich
(2004) ascertained that one should not expect the same assessment performance between
different delivery methods at the beginning, middle, and end of an assessment. Peak
(2003) reviewed research that took place between 1993 and 2004 that explored the
comparability of paper/pencil and computer-based assessments. They concluded that
although the two delivery methods were comparable, in some cases there were
differences when the reading of long passages was involved (Peak, 2005). Their review
of existing research concluded that students performed better on paper/pencil assessments
when lengthier reading passages were involved.
Additional studies have shown evidence of comparability between the two testing
delivery methods (Kim & Huynh, 2008; Poggio et al., 2005). Kim and Huynh (2008)
compared student test scores on paper/pencil and computer-based assessments that were
administered for a statewide end of course test. They concluded that the assessment
results were comparable between the two delivery methods. Poggio et al. (2005)
conducted an investigation on the impact the delivery method (paper/pencil or computer-
based) had on test scores. Participants in this study were comprised of more than 600
seventh grade students from the state of Kansas. Poggio et al. (2005) found little
performance difference between the two delivery methods.
Advantages of computer-based assessments for schools. There have been
numerous advantages identified when using computer-based testing in lieu of traditional
paper/pencil assessments. Advantages of computer-based assessments included the

32
ability to test more frequently, test more concepts, provide quicker feedback, assess in a
variety of ways, heightened objectivity, decreased time on grading, and decreased manual
work. Perhaps among the most obvious advantages was efficient scoring and immediate
feedback on assessment performance (Parshall, Spray, Kalohn, & Davey, 2002;
Pellegrino & Quellmalz, 2010).
Researchers have found the use of computer-based assessments provided
increased standardization for test administration, timely administration and scoring, and
immediate feedback of assessment results (Parshall, Spray, Kalohn, & Davey, 2002;
Pellegrino & Quellmalz, 2010). Edwards et al. (2003), echoed this sentiment, “Unlike
traditional standardized tests on paper, which can take weeks or even months to score and
return to schools, computer-based assessments can provide almost immediate feedback”
(p. 9). Educators are shifting away from paper/pencil testing to computer-based testing
due to the minimal grading effort and ability to assess more often (Erturk, Ozden, &
Sanli, 2004). Timely feedback provides enrichment and intervention to students as
appropriate, allowing for a more targeted approach to instruction (Erturk et al., 2004). In
the era of high-stakes testing, it is crucial for educators to receive assessment results in a
timely manner. Assessment results are used to make vital educational decisions in the
best interest of students.
Most test takers preferred to be assessed through a computer-based delivery
method (Erturk et al., 2004). In a study designed to evaluate the impact of student
perceptions regarding the use of computer-based assessments on the instructional
process, Erturk et al. (2004) discovered at least 70% of study participants indicated that
the feedback provided using computer-based assessments assisted them in the learning

33
process. Yet, using assessment feedback to provide interventions to students was only as
valuable as the reliability of the assessment method being used (Kingston, 2009).
Kingston (2009) determined this after conducting a meta-analysis of 81 studies occurring
between 1997 and 2007. Studies included in the meta-analysis compared computer-based
assessments to paper/pencil assessments.
Additionally, as technology became more sophisticated, software developers
continued to refine their abilities to develop computer-based assessments that were easy
to use (Kingston, 2009). For instance, educators would be able to use formative
assessment data to make informed decisions regarding appropriate academic instruction
for individual students to meet their unique academic needs. By targeting instructional
concepts and strategies based on timely assessment data, one may have anticipated an
increase in student achievement. Interventions would be a reality for low-performing
students due to the availability of immediate feedback for teachers and students from
administered assessments (Kim & Huynh, 2010).
Immediately receiving formative assessment data allowed teachers to quickly
identify students’ strengths and growth areas. Furthermore, educators were able to
provide academic enrichment and interventions as appropriate, according to the data.
Without the computer-based system, it would be challenging to recreate this form of
tailored interventions through the feedback system (Pellegrino & Quellmalz, 2010). This
challenge stemmed from the lag time that existed between administering assessments
paper/pencil and manually having to score the assessments and compile results, a concern
minimized with the computer-based delivery system. Using feedback to provide students

34
with swift and individualized interventions was a clear advantage to the use of computer-
based assessment systems.
Educators were merely scratching the surface in terms of the ways computer-
based testing could be used to impact student achievement. Computer-based assessments
had the capability of providing accommodations for students with special needs. For
instance, computer-based assessments may read test questions aloud to test takers with
reading disabilities or provide a split computer screen with text on one side and sign
language on the other for students with hearing impairments (Galley, 2003).
Technology not only entered the assessment realm, but it also played a role in test
preparation. Computer-based test-preparation was at the forefront of increasing student
achievement scores on state exams. Some test-preparation activities offered immediate
feedback to students and teachers; and may have even provided students with
instructional assistance on the skills they lacked on the test-preparation assignment
(Borja, 2003). This added instructional support came during a time when improved
results on high-stakes testing exams were at a premium.
As the focus remained on assessment results, educators began to rethink what
computer-based testing entailed. Traditionally, computer-based testing had focused on
multiple-choice questions. Yet, with the upsurge of computer availability, the use of
computer-based and computer-adaptive assessments is on the rise (Clariana & Wallace,
2002; Stocking & Swanson, 1993; Wainer, 1990). Computer-adaptive testing software
has the ability to create tests that are specifically designed for the individual test taker.
Computer-adaptive testing software operates off the notion of item response. When a test

35
taker answers a question incorrectly, the testing software adapted, adjusting the level of
difficulty until it reached an appropriate level (Fritts & Marszalek, 2010).
Even with the advancements in computer-based testing quality, accommodations,
and computer adaptive testing, computer-based assessments are capable of much more
than what is currently being done. In the future, we can anticipate observing the use of
groundbreaking and interactive state assessment systems (Olson, 2003). A new era of
assessments has begun to transform how we test and how the results affect instruction
and learning (Pellegrino & Quellmalz, 2010).
Although placing initial infrastructure such as computers, software, Information
Technology departments, and connectivity has had associated financial costs, once in
place, computer-based testing has proven to be less expensive overall than its
paper/pencil counterpart (Edwards et al., 2003). Researchers have noted it is probable
that computer-based assessments will be far more cost effective than paper/pencil
assessments once the computer-based testing products are implemented (Edwards et al.,
2003). This cost-saving advantage came during a time when schools and districts were
going to extremes to reduce expenses.
Numerous arguments have been made in support of computer-based testing.
Researchers (Edwards et al., 2003) pointed out it was an efficient testing method that
provides timely feedback that could improve teaching and learning. Furthermore,
computer-based testing has become more sophisticated with time, thus minimizing some
of the concerns that existed during the early phases of computer-based assessments.
Moreover, computer-based exams allowed accommodations to be provided more simply
to students. Computer-based exams had the capability to adjust to the ability level of the

36
examinee, and play a role in test preparation (Trotter, 2003). Last, some believed that the
cost of implementing computer-based assessments could ultimately be less than its
traditional paper/pencil counterpart (Edwards et al., 2003; Trotter, 2003).
Disadvantages of computer-based assessments for schools. Even though some
believe selecting a computer-based assessment method was the clear choice, several
disadvantages were also presented in the literature. Educators argued that a lack of
familiarity with computers could hinder a student’s performance on computer-based
assessments (Galley, 2003). There have been concerns with the implementation of
computer-based assessments due to the inequity of technology hardware, software, and/or
proficiency levels of exam administrators among individual schools (Kim & Huynh,
2010; Olson, 2003). Furthermore, Kingston (2009) concluded in a meta-analysis of 81
studies that were conducted between 1997 and 2007 that examinees could be using
different hardware from one assessment to the next. When appropriate bandwidth used to
transmit Internet connection signals was lacking, it was shown that students perform
worse than when using paper/pencil exams due to increased levels of frustration caused
by an inefficient technology connection (Kingston, 2009).
Some predicted the lack of technological infrastructure would worsen in the
future due to budget deficits and limited existing resources (Edwards et al., 2003). The
Enhancing Education Through Technology (EETT) initiative was designed as a result of
the No Child Left Behind Act to provide schools with federal grants that could be used to
support purchasing educational technology and training educators in its use (MacMillan,
2009). However, this funding fell short in that it did not provide schools with the funds
needed to support the inevitable upkeep of infrastructure, training, and maintenance that
37
came with the addition of more devices (MacMillan, 2009). In 2002, the EETT program
was awarded $690 million. This amount was scheduled to decline to only $100 million in
2010 (MacMillan, 2009). While funding dwindled, the pressure for schools to add more
instructional technology to their classrooms still existed without always having the
infrastructure to support more devices.
The inconsistency among infrastructure posed a reliability and validity problem
for computer-based assessments (MacMillan, 2009). The comparability between students
in different settings participating in computer-based tests remained in question. For tests
to be comparable, any variations in the assessment setting should not impact the results.
However, technology equipment has varied between states, districts, schools, and even
classrooms. Thus, adjusting for variations in performance results remained a concern
(Olson, 2003). Using different computer equipment could create an unwanted testing
variable.
Another unwanted variable could stem from the variety in computer proficiency
among test takers. Some worried that computer-based exams may have underestimated
the proficiencies of students who lacked basic computer skills (Galley, 2003). More
recently, Gullen (2014) ascertained that although some students were proficient with
technological devices for entertainment purposes this did not mean proficiency would
transfer to a different device. Gullen (2014) also suggested:
Computerized and online assessments, educators are discovering, will require kids
to have certain digital skills: using a mouse, highlighting text, dropping and
dragging text, drawing lines and creating graphs on a screen, operating an online
calculator, using scroll bars, and keyboarding, to name a few. (p. 69)

38
One must consider the variation in the technology abilities of students as well as the level
of training students received from teachers to help them acquire digital skills that were
required for computer-based assessments (Galley, 2003).
Additionally, those providing assessment support may lack the skills necessary to
utilize the software (Galley, 2003). According to Gullen (2014), computer-based
assessment skills must be integrated into classroom instruction prior to students
participating in computer-based assessments. Thus, to truly obtain an accurate score that
represents students’ academic abilities, all of those providing assessment support as well
as the test takers would need to be proficient with their ability to navigate technology on
high-stakes assessments.
Another disadvantage of computer-based testing were the preparation programs
educators often used. Computer-based testing programs surged in popularity, and thus,
there was an increase in the use of computer-based test-preparation programs (Borja,
2003). Web-based programs are able to tailor themselves to meet the individual needs of
each student, support lessons, and provide instructors with student data (Borja, 2003).
Yet, some gave caution to those using computer-based test preparation programs in hopes
of improving state exam results. Fears surrounding students receiving an unbalanced
education arose since computer-based test-preparation programs traditionally
concentrated on basic skills (Borja, 2003). When teachers focused on teaching basic
skills so students perform well on an assessment, other important academic areas may
have inadvertently been left behind (Borja, 2003).
Software creators were still working on minimizing the computer variables such
as font size, screen brightness, and scrolling that existed between paper/pencil and

39
computer-based exams. Some researchers (Edwards, 2003; MacMillan, 2009) asserted
that, along with improvements software creators were attempting, schools and districts
needed to focus on improving the quality of their technological infrastructure. Lastly,
some questioned the depth and rigor of computer-based assessments that relied primarily
on multiple-choice formats (MacMillan, 2009). With both advantages and disadvantages
to computer-based testing presented, there was little room to wonder why consensus had
not been reached among educators with regard to a preferred assessment delivery
method.
The Impact of Computer-Based Testing for Students
When evaluating the differences between paper/pencil and computer-based
testing, it was important to note the advantages and disadvantages of a computer-based
delivery system for assessments from the perspectives of the students taking those
assessments. Messineo and DeOllos (2005) conducted a study designed to explore the
perceptions of students with regard to computer competency. This study included 233
students enrolled in a medium-sized mid-western university (Messineo & DeOllos,
2005). The majority of survey respondents were white females. Of the 233 study
participants, 99.6% indicated they had computer experience and 76.4% admitted that the
use of technology was a motivator when participating in coursework and assessments.
This study also found that although students had plenty of experience with computers,
they were less confident when using their technology skills for academic versus personal
reasons. As evidenced by the literature cited below, student anxiety and student
motivation were important factors in any testing environment.

40
Student anxiety. There was an increase in popularity of computer-based
assessments due to the many advantages they offered (Bugbee 1996; McDonald, 2002;
Parshall et al., 2002). In light of these advantages, it was important for educators to
consider the impact computer anxiety and motivation may have had on assessment
results. As personal computers became commonplace in homes and schools, McDonald
(2002) defined computer anxiety as “the fear experienced when interacting with a
computer or anticipating the interaction” (p. 305).
During the early stages of computer use by the general population, researchers
noticed behavioral and physiological behaviors that sometimes resulted when one
experienced computer anxiety. Such behaviors included avoidance of locations with
computers, negative comments regarding computers, expedited use of computers, high
blood pressure, and nausea (Maurer & Simonson, 1984; Wienberg & Fuerst, 1984).
McIlroy, Bunting, and Tierney (2001) conducted a study utilizing undergraduate social
science students. They used the Computer Anxiety Rating Scale and the Computer
Thoughts Surveys to gauge attitudes and anxieties study participants had towards
computers. McIlroy, Bunting, and Tierney (2001) experienced similar findings to the
previously mentioned studies conducted by Maurer and Simonson (1984) and Wienberg
and Fuerst (1984) regarding anxiety from some populations when they interacted with or
anticipated interacting with computers. More recently, Gullen (2014) ascertained that
although some students were proficient with technological devices for entertainment
purposes this did not mean proficiency would transfer to a different device. With so
much pressure to increased performance on high-stakes testing, educators may need to
address the adversarial effects of computer anxiety.

41
Addressing the effects of computer anxiety began with understanding the cause of
such anxiety. Much research has produced the notion that computer anxiety exists in
those who lack familiarity with computers (Chua, Chen, & Wong, 1999; Levine &
Donitsa-Schmidt, 1998). Students became less comfortable when they were asked to
perform above their technology skill base to accomplish an academic task (Messineo &
DeOllos, 2005). Fritts and Marszalek (2010) conducted a study that compared anxiety
levels between students who participated in a computerized adaptive test and those who
participated in a paper/pencil test. Ninety-four students were assessed using the
computerized adaptive test and 65 students completed the paper/pencil exam. All
students were of middle school age and attended one of two large school districts located
in mid-western cities. When anxiety was high with a given assignment and the perceived
ability to perform well on such assignment was slim, there was an increased likeliness
that the examinee would begin removing himself from additional cognitive efforts (Fritts
& Marszalek, 2010). What the above research showed was that helping examinees
become proficient with computers prior to participating in computer-based assessments
may have decreased existing computer anxiety levels.
Clarinia and Wallace (2005) conducted a study where student performance was
evaluated on two assessments. The first assessment was administered paper/pencil; the
second assessment was administered using a computer-based system. Participants in this
study included over 200 undergraduate freshman business majors enrolled in a computer
skills course. Students with little to no experience with computers were not the only
group who may have suffered heightened anxiety during computer-based testing. In fact,
female and African American subgroups might have been prone to experience additional

42
computer anxiety than others (Clarinia &Wallace, 2005). This research may help
educators identify those who need the most assistance with computer familiarity and
comfort.
Stephens (2001) conducted a study, which involved 46 Library and Information
Science/Study undergraduate students who participated in two assessments. The first was
a Computer Assisted Assessment, and the second was paper/pencil. The study took place
in the United Kingdom and was designed to identify any benefits to staff or students that
may be present when using a Computer Assisted Assessment. By ensuring examinees
were proficient with computers prior to testing, examiners should help minimize
computer anxiety through the delivery of in-depth preparation with students prior to the
assessment and diligent monitoring of students during the assessment (Stephens, 2001).
This clarity would aid test takers in their ability to understand a given task. Keeping
computer anxiety levels low may help improve student performance. In a review of
existing studies, McDonald (2002) pointed out links of increased levels of anxiety to
decreased levels of working memory. Additionally, McDonald (2002) highlighted the
common misconception that increased exposure to computers could produce a decrease
in computer anxiety, and he has noted the conflicting results of various studies on this
topic. The purpose of McDonald’s work was to better understand the impact individual
differences of test takers have on the equivalence between paper/pencil and computer-
based assessments.
It has been shown that assessment software itself caused test-takers anxiety. In a
2010 study, Fritts and Marszalek compared the amount of test anxiety experienced with
Computer Adaptive Testing (CAT) system with the anxiety experienced on a

43
paper/pencil test. CAT assessments were able to tailor test questions based on the ability
level of the test taker. If test takers comprehended that the assessment was becoming
increasingly simpler or more complex, they began to hypothesize about their
performance, which could result in heightened levels of anxiety (Fritts & Marszalek,
2010). In their study, Fritts and Marzalek (2010) determined the CAT system was a
cause for some computer anxiety in their study. This increased anxiety could have
produced lower assessment results. The sample of this study consisted of 94 middle
school CAT examinees and 65 middle school paper/pencil examinees. The anxiety level
of students in both examinee groups were measured by the State-Trait Anxiety Inventory
for Children (STAIC) after the students had completed a CAT standardized achievement
test.
Student motivation. Computer anxiety was not the only variable at play when it
came to computer-based assessments. Some researchers have discovered that students
were motivated by access to technology during testing (Bridgeman, Lennon, &
Jackenthal, 2001; Flowers et al., 2011; Higgins, Russell, & Hoffmann, 2005; Park, 2003).
Additionally, motivational levels corresponded with the level in which a student would
experience academic success; thus, motivation was essential to learning and achievement
(Marzano, 2003). It was equally important to emphasize heightened levels of motivation,
as it was to work towards decreasing computer anxiety.
Research has shown that some students have a preference when it comes to
selecting an assessment delivery method. Horton and Lovitt (1994) conducted a study
involving 72 students from middle and high school science and social studies classes.
The purpose of their study was to compare group reading inventory outcomes between

44
paper/pencil and computer-based methods. The result of Horton and Lovitt’s (1994)
study, “revealed no significant difference between the assessment methods” (p. 378).
However, the students who claimed a preference for the computer-based assessment cited
the computer as a motivational factor. Further research indicated that many students
preferred to test using a computer-based method versus paper/pencil since test takers
perceived the computer-based delivery method to be less tiring (Bridgeman et al., 2001;
Higgins, et al, 2005).
According to Millsap (2000), student motivation for computer-based assessments
was derived more from the efficiency and timeliness of the results than the simplicity of
the exam. It was also important to note that confidence with a delivery method could
lead to increased motivation, and some research (Park, 2003) implied that test takers
believed computer-based assessments were easier than paper/pencil assessments. In a
2003 Oregon survey conducted by state education officials, 740 third grade students and
730 high school students located in various parts of the state reflected on their
paper/pencil and computer-based assessment experiences (Park, 2003). Students in this
study testified that they were motivated by computer-based assessment because they
found them to be more efficient and more enjoyable than their paper/pencil counterparts.
Survey participants also reported feeling more confident in their performance on
computer-based assessments (Park, 2003).
In a study evaluating the effects of computer variables (screen brightness, font
size, and resolution on testing performance) Bridgeman et al. (2001) discovered that 44%
of study participants preferred computer-based assessment to their paper/pencil
counterparts. Additionally, 20% of participants were indifferent in a study that included

45
357 high school juniors who were college bound. The majority of participants also felt
participating in computer-based assessments was less tiring than paper-pencil
assessments (Bridgeman et al., 2001).
Higgins et al., (2005) examined the effects of transitioning paper/pencil reading
comprehension assessments to the computer for over 200 fourth grade students from
eight schools located in Vermont. An analysis was conducted regarding students’
perspectives of computer-based assessments based on their responses to four open-ended
survey questions (Higgins et al., 2005). The analysis revealed that of the 135
participants, 82.2% felt it was easier to complete the computer-based assessment than the
paper/pencil version (Higgins et al., 2005).
In a comparison study of paper/pencil and computer-based assessments Flowers et
al., (2011) administered a survey following a computer-based assessment to more than
600 third through eleventh grade students located in a southeastern state. The majority of
students (77%) felt they performed better when being assessed on the computer when
compared to paper/pencil (Flowers et al., 2011). Students reported that they could work
at their own pace, pay attention to the assessment, and be more independent when
participating in the computer-based delivery method (Flowers et al., 2011). Furthermore,
259 staff members were surveyed and 79% of them reported observing higher levels of
engagement from students who participated in computer-based assessments versus
paper/pencil (Flowers et al., 2011).
As technology has continued to improve, certain subgroups may have found
increased benefits from using computer-based assessment systems. Some have believed
that students with disabilities experienced increased participation and higher achievement

46
results when using computer-based testing programs due to an increase in motivation
(Flowers et al, 2011). This positive impact could have been due to the ability of software
programs to provide necessary accommodations, thus reducing students’ frustration and
increasing their motivation (Flowers et al, 2011). However, it was important to note a
test taker’s preference toward computer-based testing did not necessarily produce higher
achievement results (Flowers et al., 2011; Higgins et al., 2005).
Demographics and Their Impact on Testing
Equity has been an important component when comparing different assessment
delivery methods. However, the majority of researchers who conducted studies that
compared the delivery method of paper/pencil with computer-based assessments did not
evaluate the comparability of varying gender, minority status, and socioeconomic
demographics and their impact on achievement when comparing delivery methods
(Kingston, 2009). Of the few studies available, one found that students with less access
to and familiarity with computers may be at a disadvantage when participating in
computer-based assessments (Flowers et al., 2011).
When utilizing computer assessments, it was difficult to account for the individual
differences of each examinee (The National Center for Fair and Open Testing, 2002). In
fact, the existing achievement gap between people from different genders, minority
statuses, and socioeconomic backgrounds may indeed have expanded due to the use of
computer-based assessments (The National Center for Fair and Open Testing, 2002;
Weaver & Raptis, 2001). The potential for an expansion in the already evident
achievement gap caused some to work toward a solution. One recommendation was to
allow all examinees to become comfortable with the computer before administering a

47
computer-based assessment (Kingston, 2009). Even if factors were put in place to level
the playing field for testers from all subgroups, it would continue to be important to
disaggregate the assessment data. Kim and Huynh (2009) concluded it is critical to
examine student subgroups because data comprising the entire student population may
conceal findings of particular subgroups.
Gallagher, Bridgeman, and Cahalan (2002) conducted a meta-analysis from
multiple national testing companies to determine if there was a difference in performance
between gender groups. The researchers analyzed three studies, using data from the GRE
General Test Graduate Management Admissions Test (GMAT), SAT I: Reasoning
(SAT), and Praxis Professional Assessments for Beginning Teachers. The researchers
concluded small but consistent patterns of performance change between gender groups
did exist. Gender differences were apparent on two out of twelve subtests that female test
takers completed, pointing researchers to believe that females perform slightly better on
paper/pencil assessments than on computer-based assessments (Gallagher et al., 2002).
In a synthesis of existing research, Clariana and Wallace (2005) reported the
differences of genders in computer-based assessments as well as paper/pencil
assessments. Since males tended to report more access to, knowledge of, and learning
experiences with computers, females may have been at a disadvantage when it came to
computer-based assessments (Clariana & Wallace, 2005; Cooper, 2006). Clariana and
Wallace (2005) concluded that in addition to fewer experiences with computers, females
experienced higher levels of computer anxiety than males. Specifically, African
American females reported experiencing the most computer anxiety. The studies
synthesized by Clariana and Wallace (2005) implied that limited computer experience, as

48
well as the testing stress, might have lead females to perform more poorly than males on
computer-based assessments, even more poorly than they would on paper/pencil
assessments. These results emphasized the importance for educators to have a solid
understanding of advantages and/or disadvantages that may be present for one gender
group over another depending on the assessment delivery method. Clariana and Wallace
(2005) claimed, “because of the increasing use of online testing, it seems critical at this
time to determine factors that differentially affect computer-administered test
performance in order to decrease the amount of measurement error in online tests” (p.
18).
In addition to gender, minority and socioeconomic status may have had an effect
on assessment results when comparing paper/pencil and computer-based testing. The
higher the percentage of low socioeconomic and minority populations were in a given
school, the less likely students were to have technology in schools or home (Clariana &
Wallace, 2005; The National Center for Fair and Open Testing, 2002; Sutton, 1991).
Early studies implied students with less computer experience would perform
worse on computer-based exams (Sutton, 1991; Urban, 1986). There were fewer
opportunities for students to access high quality educational resources at home for
students from low socioeconomic backgrounds than there were for students from middle
or high socioeconomic backgrounds (U.S. Department of Education National Center for
Educational Statistics, 2000; Viadero, 2000). Having less access to computers may have
led to a decrease in performance. Gallagher et al. (2002) examined data from multiple
national testing companies to see if there was a difference in performance among gender
and minority groups. By reviewing data from previous studies, the researchers sought to

49
identify performance patterns across assessments and among subgroups. Segall (1997)
and Gallagher et al. (2002) found small, but consistent patterns of performance change
between gender and minority groups. African-Americans and, to a smaller extent,
Hispanics benefited somewhat from the computer-based delivery method. It was
important to note that in this study all test takers experienced a stronger performance on
computer-based delivery systems than when being assessed paper/pencil (Gallagher et al.,
2002).
A decrease in performance for some may have been tied to unfamiliarity with the
attributes of the computer such as screen size and resolution, font size, and computer
settings (Bridgeman, Lennon, & Jackenthal, 2003). With less frequent, at-home
opportunities to become proficient with technology, students from lower socioeconomic
backgrounds may have faced additional challenges on computer-based assessments.
MacCann (2006) noted a slight effect from SES in a small study using Australian
students as the sample. Nearly identical scores were reported for non-low SES students
on the two testing methods and no significant difference in achievement levels were
identified (MacCann, 2006). However, differences did exist that favored the paper/pencil
method over the computer-based method for students identified as low SES students.
MacCann (2006) pointed out that low SES students might have had less experience with
performing computer functions necessary for a successful computer-based testing
experience. “In addition, affective responses, in part created by computer inexperience,
could conceivably reduce scores differentially on the computer-based mode” (MacCann,
2006, p. 88). It was clear that consensus had yet to have been reached in terms of the

50
degree to which socioeconomic status impacted performance for test takers on
paper/pencil versus computer-based versus delivery methods.
Bridgeman et al. (2003) asserted experience may have been a key factor in test
takers’ comfort level with using a computer-based versus paper/pencil assessment
delivery system. Some research has suggested there is a discrepancy in terms of access to
technology for female, minority, and low SES students (Facer & Furlong, 2001). After
conducting a study in which more than 800 students between the ages of 9 and 14 were
surveyed, Facer and Furlong (2001) called into question the postulations that all students
were “cyberkids,” who were skilled and comfortable with technology. Participants in this
study were located in southwest England and southeast Wales.
Summary
The content in this chapter provided a historical perspective of paper/pencil and
computer-based assessments and specifically focused on a broad history of assessments
in education. A review of current types of assessments being used in the present higher
stakes environment was also conducted. Computer-based testing and its implications for
schools were addressed by reviewing the advantages and disadvantages of delivery
methods. Advantages and disadvantages of computer-based testing for students were
also a focus of this chapter by analyzing the impacts of student anxiety and motivation on
testing. In closing, findings of existing research were reported with regard to
demographics and their impact on student performance on each assessment delivery
method: paper/pencil and computer-based. Specifically, gender, minority, and
socioeconomic status were examined. Chapter three provides the methodology used in
the study.

51
Chapter Three
Methods
The purpose of this study was to determine whether the delivery method in which
an assessment was administered, paper/pencil versus computer-based, made a difference
in fifth and sixth grade student’s Language Arts achievement results. Specifically, this
study determined whether the assessment delivery method made a difference on the
achievement of test takers as affected by gender, minority, and socioeconomic status.
This chapter includes a description of the research design; population and sample;
sampling procedures; instrumentation: measurement, validity, and reliability; data
collection procedures; data analysis and hypotheses testing; and limitations of the study.
Research Design
The researcher utilized a quantitative research design in this study. Specifically, a
quasi-experimental research design was used. The dependent variable was the students’
Language Arts score from the Acuity Language Arts Diagnostic assessment. Four
independent grouping variables included the assessment delivery method (paper/pencil or
computer-based) as well as the demographics of gender (male or female), minority status
(minority or non-minority) and socioeconomic status (low SES or non-low SES).
Population and Sample
The population of interest was upper elementary students in the state of Missouri.
The sample for the study included fifth and sixth grade students from Mill Creek Upper
Elementary during the 2011-2012 school year. At the time of this study, Mill Creek
Upper Elementary was a school in the Belton School District located south of Kansas
City, Missouri.

52
Sampling Procedures
Purposive sampling was used in this study and involved identifying a sample
related to the researcher’s prior knowledge of the group being sampled (Lunenburg &
Irby, 2008). One criterion for inclusion in the study was that participants had to be
enrolled as fifth or sixth grade students at Mill Creek Upper Elementary located in
Belton, Missouri from January through May of the 2011-2012 school year. Additionally,
a prerequisite for participants was having a score from the district-required Acuity
Predictive C Language Arts assessment administered in January 2012. The score from
the Acuity Predictive C Language Arts assessment allowed the researcher to create
academically balanced Groups A and Groups B regarding students’ Language Arts ability
prior to their participation in the Acuity Language Arts Diagnostic assessments.
Instrumentation
Two assessments were used in this study. The first was the district-required
assessment, a CTB/McGraw-Hill Company Acuity Predictive C Language Arts
assessment. The Predictive Assessment was used to place students into academically
balanced groups. This non-timed, computer-based assessment measures grade level
content in Language Arts and predicts future student performance. Assessment questions
are both multiple-choice and constructed response. The predictive assessment offers
multiple-choice questions in which all four multiple-choice answers provide meaningful
feedback to the teacher. When students answer a multiple-choice question accurately, it
displays understanding of a given concept. When an incorrect answer is selected,
meaningful information is gathered based on which incorrect answer is selected. Each
incorrect answer allows teachers to conclude something different in terms of where

53
meaning breaks down for a student (CTB/McGraw-Hill, 2011a). All multiple-choice
questions are worth one point. Regardless of which incorrect answer may be selected the
point value remains the same.
On both the fifth and sixth grade Acuity Predictive C Language Arts assessments,
students are instructed to read two passages and answer questions related to the reading.
Accompanying the story passages and constructed response questions are 30 multiple-
choice questions. There are two constructed response questions where students are
responsible for developing their answer independent of a selection bank, one for each
reading passage, included on each assessment.
On the fifth grade assessment, the first constructed response question is worth
three points and the second constructed response question is worth two points. The sixth
grade assessment has the same total point value but differs in that the first constructed
response question is worth two points while the second constructed response question is
worth three points. On the fifth grade assessment 73.3% of the multiple choice questions
are related to the story passages and 26.6% assessed skills are independent of the story
passages. On the sixth grade assessment 70% of the multiple choice questions are related
to the story passages and 30% assessed items are independent of the story passages. Both
the fifth and sixth grade Predictive C assessments are worth a total of 35 points
(CTB/McGraw Hill, 2011a).
The second assessment used in this study was the CTB/McGraw-Hill Acuity
Language Arts Diagnostic assessment for grades five and six. These benchmark
assessments measures grade-level content based on Missouri standards (CTB/McGraw
Hill, 2011a). Furthermore, the purpose of the Acuity Language Arts Diagnostic

54
assessments is to assess the strengths and weakness of test takers with regard to Language
Arts skills. The paper/pencil and computer-based versions of the Acuity Language Arts
Diagnostic assessments are comparable (CTB/McGraw-Hill, 2008). CTB/McGraw-Hill
(2008) published a set of guidelines that focused on score interchangeability, factors that
could influence comparability of scores, comparability studies, and how one could attain
score equivalence. Specifically, CTB/McGraw-Hill (2008) noted that the requirement
that assessment scores be interchangeable from one delivery method to the next is one of
assessment score equivalence or comparability.
For the purpose of this study, fifth grade students were assessed using the Acuity
Missouri Language Arts Grade 5 Diagnostic. Participants read five short text passages
provided on the assessment including fiction, nonfiction, and poetry. Fiction and
nonfiction passages ranged from 348 to 504 words, and the poem consisted of 181 words.
Each text passage included a visual image to aid reading comprehension. The fifth grade
form included 30 multiple-choice questions with four possible answers for each question.
Each correct response was worth one point. The total questions answered accurately
were converted into the test taker’s percent correct out of 100. All questions assessed the
fifth grade Language Arts standards of comprehension, text features, vocabulary,
grammar usage, and punctuation/capitalization (CTB/McGraw-Hill, 2011a).
For the purpose of this study, sixth grade students were assessed using the Acuity
Missouri Language Arts Grade 6 Diagnostic. Participants read five short text passages
provided on the assessment including fiction and nonfiction. Passages ranged from 342
to 453 words. Each text passage included a visual image to aid reading comprehension.
The sixth grade form included 35 multiple-choice questions with four possible answers

55
for each question. Each correct response was worth one point. The total questions
answered accurately were converted into the test taker’s percent correct out of 100. All
questions assessed the sixth grade Language Arts standards of comprehension, text
features, vocabulary, grammar usage, and punctuation/capitalization (CTB/McGraw-Hill,
2011a).
All Language Arts Diagnostic assessments were untimed for fifth and sixth grade
participants regardless of their assessment delivery method. For fifth and sixth grade
participants taking Acuity Language Arts Diagnostic assessments using the paper/pencil
delivery method, the test setting was a typical classroom with no more than 30 students
from their same grade level. Each student sat at a desk at least three feet away from other
testers. The researcher as well as a classroom teacher proctored the administration of the
paper/pencil assessment. For fifth and sixth grade participants taking Acuity Language
Arts Diagnostic assessments using the computer-based delivery method, the test setting
was a school computer lab with no more than 30 students from their same grade level.
Each participant sat at a computer station located at least three feet away from other
testers. The researcher as well as a classroom teacher proctored the administration of the
computer-based assessment.
Measurement. Scores from the diagnostic assessments were analyzed and served
as the dependent variable in this study to measure fifth and sixth grade students’
Language Arts performance. The diagnostic assessments provide an understanding of
which skills were and were not mastered by test takers. Skills assessed on diagnostic
assessments aligned with Missouri content standards such as vocabulary, comprehension,
text features, punctuation, and capitalization (CTB/McGraw-Hill, 2011b). There are 30

56
points possible on the Acuity Language Arts Diagnostic fifth grade assessment and 35
points possible on the Acuity Language Arts Diagnostic sixth grade assessment. All
questions on each of the Diagnostic assessments are multiple-choice with only one
correct response.
The independent variables in this study were assessment delivery method, gender,
minority, and socioeconomic status. The two testing delivery methods were paper/pencil
and computer-based. Study participants from different minority statuses were collapsed
into two categories: minority (American Indian, Asian/Pacific Islander, Black,
Hispanic/Latino, Multi-Racial, Other) and non-minority (White). The researcher
collapsed study participants from different socioeconomic status into two categories: low
socioeconomic status and non-low socioeconomic status. Participants who qualified for
the statewide free or reduced meal program were categorized as low SES; all other study
participants were categorized as non-low SES.
Validity and reliability. Lunenburg and Irby (2008) identified content validity as
the degree an instrument measures what it reasons to measure. Aligning with the
Missouri Grade Level Expectations, information measured on the Acuity Predictive C
Language Arts assessment achieved construct validity (CTB/McGraw-Hill, 2011a). The
Acuity Predictive C Language Arts assessments were created using the same content
standards used to establish the MAP assessment. By using content and construct validity,
information measured on the district-required Acuity Predictive C Language Arts
assessment was in alignment with Missouri Grade Level Expectations.
Content and construct validity were also achieved through the alignment of the
Acuity Diagnostic Assessments to the Common Core State Standards (S. Reed, personal

57
communication, May 30, 2014) (see Appendix E for complete report). When developing
the Acuity Language Arts Diagnostic assessments, comprehensive item specifications
aligned to content standards were used as the first level of specificity. The second level
of specificity came from sub-content standards, and indicators were used as the third
level of specificity. “These design foundations support both the content and construct
validity of these assessments; this approach to test development should result in the
measurement of the same overall construct,” (S. Reed, personal communication, May 30,
2014, p. 1). When solidifying final assessment forms for the Predictive assessments, an
item analysis was conducted to ensure high-quality measurement. “For all test forms, the
reliability coefficients met accepted psychometric standards for tests of these lengths,”
(CTB/McGraw-Hill, 2011a, p. 10). CTB/McGraw-Hill conducted a distractor analysis to
ensure an acceptable number of students were selecting the correct answer rather than the
distractor.
Reliability is the extent to which an instrument dependably measures what it is
intended to measure (Lunenburg & Irby, 2008). Cronbach’s alpha coefficients were
calculated to determine the reliability of the Predictive assessments (CTB/McGraw-Hill,
2011a). Coefficients for the 2009-2010 district-required Acuity Predictive C Language
Arts assessment based on an operational/field-test ranged from 0.85 to 0.91
(CTB/McGraw-Hill, 2011a). Therefore, the district-required Acuity Predictive C
Language Arts assessment met the accepted psychometric standards for assessments of
this length (CTB/McGraw-Hill, 2011a).

58
The Feldt-Raju method for estimating reliability was utilized for the Acuity
Diagnostic Assessments in 2009-2010 (S. Reed, personal communication, May 30,
2014).
The reliability coefficient is a ratio of the variance of true test scores to those of
the observed scores, it is a positive correlation coefficient of true test score to
observed scores with the values ranging from 0 to 1. The closer the value of the
reliability coefficient is to 1, the more consistent the scores. (S. Reed, personal
communication, May 30, 2014, p. 1)
Reliability coefficients for the Acuity Language Arts Diagnostic assessments were
unavailable; therefore, the researcher conducted a reliability analysis and found the
Cronbach’s Alpha to be .864 (N = 681).
When finalizing assessment forms for the Acuity Language Arts Diagnostic
assessments, a thorough classical test and item analysis was conducted to ensure high-
quality measurement. CTB/McGraw-Hill conducted a “classical analyses included p-
values, point biserials, distractor analyses, Mantel-Haenszel differential item functioning
(bias) indices, and test reliability coefficients,” (S. Reed, personal communication, May
30, 2014, p. 2). Additionally, an empirical approach was used to assist with identifying
biased test items. Differential item functioning studies were conducted to decide if
students with equal underlying ability levels had the same prospect for selecting a correct
response (S. Reed, personal communication, May 30, 2014). If the differential
functioning studies concluded a difference existed, inclusion of such test items was
minimized (S. Reed, personal communication, May 30, 2014).

59
Data Collection Procedures
An Institutional Review Board (IRB) application was submitted to Baker
University requesting permission to conduct the quasi-experiment (see Appendix B).
Additionally, a request to conduct the study and publish school district information was
submitted to Andrew Underwood, Superintendent of the Belton School District. Data
collection began once the Baker University IRB and the Belton School District approved
the requests of the researcher (see Appendices C and D).
An Acuity Predictive C scale score report was created for all fifth grade and sixth
grade students. This report allowed the researcher to place study participants in the
appropriate groups. Systematic assignment was used to create four equally distributed
groups for the purpose of determining which students participated in either the
paper/pencil delivery method (Grade 5 Group A; Grade 6 Group A) or the computer-
based delivery method (Grade 5 Group B; Grade 6 Group B). Data that was collected
from the Acuity Predictive C Language Arts assessment was used to rank order students
within their respective grade level, from the highest scoring to the lowest scoring. Grade
5 Group A and Grade 6 Group A were created by taking all odd-numbered students from
the district-required Acuity Predictive C Language Arts assessment achievement
rankings; Grade 5 Group B and Grade 6 Group B were formed by taking all even-
numbered students from the district-required Acuity Predictive C Language Arts
assessment achievement rankings. Since students were only ranked against other
students in their same grade level, all Groups A and Groups B had an effectively equal
number of fifth grade and sixth grade students. Thus, the researcher created academically
equal groups with similar subsamples.

60
Random assignment was used to determine which group of students was tested
using paper/pencil and which group of students was tested using a computer. A coin was
flipped to determine how Groups A and Groups B students were tested. The coin toss
resulted in Groups A students being tested using paper/pencil and Groups B students
being tested using a computer. Finally, study participants had to complete the Diagnostic
assessment during the five-day testing window in May 2012. All students who met the
criteria participated in the study.
During May 2012, all study participants completed the Acuity Language Arts
Diagnostic assessment. Participants in both Groups A read and answered questions from
the Diagnostic form one of their respective grade levels using a pencil to fill in multiple-
choice response bubbles. Upon completion, Groups A participants turned in their
assessment to the examiner. Participants in both Groups B read and answered the
assessment questions from the Diagnostic form one of their respective grade levels using
a computer. Answers were selected by students using the drag and click feature of a
mouse. Upon completion, participants submitted their responses electronically.
The paper/pencil assessments were hand graded by the researcher using the
answer key provided by CTB/McGraw-Hill. The researcher created a template to use
during the grading process. The template covered up all parts of the assessment with the
exception of the accurate multiple-choice responses. Scores of the participants were
tallied and entered into an Excel database by an administrative intern completing
internship hours in the Belton School District. The Acuity Diagnostic system scored the
responses of Groups B. The researcher pulled Groups B’s data from the Acuity system
and entered it into the same Excel database used for Groups A. An Acuity Language

61
Arts Diagnostic test form was administered to each study participant, and all results were
housed in one database.
Data Analysis and Hypotheses Testing
Data analyses for testing the hypotheses were conducted using the Statistical
Package for the IBM® Social Sciences SPSS® Statistics Faculty Pack 22.0 software for
Windows. Each research question with its corresponding hypothesis and the data tool
used to test that hypothesis follows below. The significance level for all tests was set at
α = .05.
RQ1. To what extent is there a statistically significant difference in student
Language Arts achievement, as measured by the Acuity Language Arts Diagnostic
assessment, between fifth grade students using a paper/pencil delivery method and fifth
grade students using a computer-based delivery method?
H1. There is a statistically significant difference in Acuity Language Arts
Diagnostic scores between fifth grade students who were assessed using paper/pencil and
fifth grade students who were assessed using computers.
A two-factor analysis of variance (ANOVA) was conducted to test H1 and H2.
The two categorical variables used to group the dependent variable, Acuity Language
Arts Diagnostic assessment scores for fifth grade students, were assessment delivery
method (paper/pencil or computer) and gender (male and female). The two-factor
ANOVA can be used to test three hypotheses including a main effect for assessment
delivery method, a main effect for gender, and a two-way interaction effect (assessment
delivery method x gender). The main effect for assessment delivery method was used to
test H1.

62
RQ2. To what extent is the difference in student Language Arts achievement, as
measured by the Acuity Language Arts Diagnostic assessment, between fifth grade
students using a paper/pencil delivery method and fifth grade students using a computer-
based delivery method affected by gender?
H2. Gender affects the difference in Acuity Language Arts Diagnostic scores
between fifth grade students who were assessed using paper/pencil and fifth grade
students who were assessed using computers.
The first two-factor analysis of variance (ANOVA) was conducted to test H2.
The two categorical variables used to group the dependent variable, Acuity Language
Arts Diagnostic assessment scores for fifth grade students, were assessment delivery
method (paper/pencil and computer) and gender (male and female). The interaction
effect for assessment delivery method by gender was used to test H2.
RQ3. To what extent is the difference in student Language Arts achievement, as
measured by the Acuity Language Arts Diagnostic assessment, between fifth grade
students using a paper/pencil delivery method and fifth grade students using a computer-
based delivery method affected by minority status?
H3. Minority status affects the difference in student Language Arts achievement
scores as measured by the Acuity Language Arts Diagnostic assessment scores between
fifth grade students who were assessed using paper/pencil and fifth grade students who
were assessed using computers.
A second two-factor analysis of variance (ANOVA) was conducted to test H3.
The two categorical variables used to group the dependent variable, Acuity Language
Arts Diagnostic assessment scores for fifth grade students, were assessment delivery

63
method (paper/pencil and computer) and minority status (minority and non-minority).
The two-factor ANOVA can be used to test three hypotheses including a main effect for
assessment delivery method, a main effect for minority status, and a two-way interaction
effect (assessment delivery method x minority status). The interaction effect for
assessment delivery method by minority status was used to test H3.
RQ4. To what extent is the difference in student Language Arts achievement, as
measured by the Acuity Language Arts Diagnostic assessment, between fifth grade
students using a paper/pencil delivery method and fifth grade students using a computer-
based delivery method affected by socioeconomic status?
H4. Socioeconomic status affects the difference in student Language Arts
achievement scores as measured by the Acuity Language Arts Diagnostic assessment
scores between fifth grade students who were assessed using paper/pencil and fifth grade
students who were assessed using computers.
A third two-factor analysis of variance (ANOVA) was conducted to test H4. The
two categorical variables used to group the dependent variable, Acuity Language Arts
Diagnostic assessment scores for fifth grade students, were assessment delivery method
(paper/pencil and computer) and socioeconomic status (low SES and non-low SES). The
two-factor ANOVA can be used to test three hypotheses including a main effect for
assessment delivery method, a main effect for socioeconomic status, and a two-way
interaction effect (assessment delivery method x socioeconomic status). The interaction
effect for assessment delivery method by socioeconomic status was used to test the
interaction of H4.

64
RQ5. To what extent is there a statistically significant difference in student
Language Arts achievement, as measured by the Acuity Language Arts Diagnostic
assessment, between sixth grade students using a paper/pencil delivery method and sixth
grade students using a computer-based delivery method?
H5. There is a statistically significant difference in Acuity Language Arts
Diagnostic scores between sixth grade students who were assessed using paper/pencil and
sixth grade students who were assessed using computers.
A fourth two-factor analysis of variance (ANOVA) was conducted to test H5 and
H6. The two categorical variables used to group the dependent variable, Acuity
Language Arts Diagnostic assessment scores for sixth grade students, were assessment
delivery method (paper/pencil or computer) and gender (male and female). The two-
factor ANOVA can be used to test three hypotheses including a main effect for
assessment delivery method, a main effect for gender, and a two-way interaction effect
(assessment delivery method x gender). The main effect for assessment delivery method
was used to test H5.
RQ6. To what extent is the difference in student Language Arts achievement, as
measured by the Acuity Language Arts Diagnostic assessment, between sixth grade
students using a paper/pencil delivery method and sixth grade students using a computer-
based delivery method affected by gender?
H6. Gender affects the difference in Acuity Language Arts Diagnostic scores
between sixth grade students who were assessed using paper/pencil and sixth students
who were assessed using computers.

65
The fourth two-factor analysis of variance (ANOVA) was conducted to test H6.
The two categorical variables used to group the dependent variable, Acuity Language
Arts Diagnostic assessment scores for sixth grade students, were assessment delivery
method (paper/pencil and computer) and gender (male and female). The interaction
effect for assessment delivery method by gender was used to test H6.
RQ7. To what extent is the difference in student Language Arts achievement, as
measured by the Acuity Language Arts Diagnostic assessment, between sixth grade
students using a paper/pencil delivery method and sixth grade students using a computer-
based delivery method affected by minority status?
H7. Minority status affects the difference in student Language Arts achievement
scores as measured by the Acuity Language Arts Diagnostic assessment scores between
sixth grade students who were assessed using paper/pencil and sixth grade students who
were assessed using computers.
A fifth two-factor analysis of variance (ANOVA) was conducted to test H7. The
two categorical variables used to group the dependent variable, Acuity Language Arts
Diagnostic assessment scores for sixth grade students, were assessment delivery method
(paper/pencil and computer) and minority status (minority and non-minority). The two-
factor ANOVA can be used to test three hypotheses including a main effect for
assessment delivery method, a main effect for minority status, and a two-way interaction
effect (assessment delivery method x minority status). The interaction effect for
assessment delivery method by minority status was used to test H7.

66
RQ8. To what extent is the difference in student Language Arts achievement, as
measured by the Acuity Language Arts Diagnostic assessment, between sixth grade
students using a paper/pencil delivery method and sixth grade students using a computer-
based delivery method affected by socioeconomic status?
H8. Socioeconomic status affects the difference in student Language Arts
achievement scores as measured by the Acuity Language Arts Diagnostic assessment
scores between sixth grade students who were assessed using paper/pencil and sixth
grade students who were assessed using computers.
A sixth two-factor analysis of variance (ANOVA) was conducted to test H8. The
two categorical variables used to group the dependent variable, Acuity Language Arts
Diagnostic assessment scores for sixth grade students, were assessment delivery method
(paper/pencil and computer) and socioeconomic status (low SES and non-low SES). The
two-factor ANOVA can be used to test three hypotheses including a main effect for
assessment delivery method, a main effect for socioeconomic status, and a two-way
interaction effect (assessment delivery method x socioeconomic status). The interaction
effect for assessment delivery method by socioeconomic status was used to test the
interaction of H8.
Limitations
Lunenburg and Irby identify limitations as factors that are beyond the control of
the researcher (2008). The limitations of this study included:
1) The potential for error existed when hand grading the assessments for study
participants in Groups A.

67
2) The quality of Language Arts instruction may have differed for students
depending on the quality of the instructor.
3) Some students were enrolled in Mill Creek Upper Elementary after the
beginning of the school year, but before the Acuity Predictive C Language
Arts assessment, and thus, they would not have experienced the same
Language Arts instruction as the students who did attend Mill Creek for the
entirety of the 2011-2012 school year.
Summary
This chapter described the research design, population and sample, sampling
procedures, instrumentation, experimentation, data collection procedures, data analysis
and hypotheses testing, and limitations of the study. Measurement, validity, and
reliability were explained in the instrumentation section. Chapter four presents the
results of the hypotheses testing.

68
Chapter Four
Results
The primary purpose of this study was to determine whether there was a
difference in student achievement, as measured by the Acuity Language Arts Diagnostic
assessment, between students using a paper/pencil or a computer-based delivery method.
The study examined data from one Acuity Language Arts Diagnostic assessment
administered during the 2011-2012 school year to fifth grade and sixth grade students in
one upper elementary school located in the Belton School District. The researcher also
examined if the difference in student achievement between assessment delivery methods
was affected by gender, minority, and socioeconomic status. This chapter contains the
eight research questions (RQ), the hypothesis tested to address each RQ, the statistical
analysis conducted to address each RQ, and the hypothesis testing results.
Hypothesis Testing
In this section, hypothesis testing results are reported along with the descriptive
statistics associated with each test.
RQ1. To what extent is there a statistically significant difference in student
Language Arts achievement, as measured by the Acuity Language Arts Diagnostic
assessment, between fifth grade students using a paper/pencil delivery method and fifth
grade students using a computer-based delivery method?
H1. There is a statistically significant difference in Acuity Language Arts
Diagnostic scores between fifth grade students who were assessed using paper/pencil and
fifth grade students who were assessed using computers.

69
A two-factor analysis of variance (ANOVA) was conducted to test H1 and H2.
The two categorical variables used to group the dependent variable, Acuity Language
Arts Diagnostic assessment scores for fifth grade students, were assessment delivery
method (paper/pencil or computer) and gender (male and female). The two-factor
ANOVA can be used to test three hypotheses including a main effect for assessment
delivery method, a main effect for gender, and a two-way interaction effect (assessment
delivery method x gender). The main effect for assessment delivery method was used to
test H1. The level of significance was set at .05. The results of the analysis indicated
there was not a statistically significant difference between the average score for students
who participated in the paper/pencil and those who participated in the computer-based
assessment, F = .283, df = 1, 335, p = .595. See Table 4 for the means and standard
deviations for this analysis.
Table 4
Descriptive Statistics for the Results of the Test for H1 (Fifth Grade Students)
Assessment Delivery Method M SD N
Paper/Pencil 70.595 18.537 170
Computer 69.654 19.105 169
RQ2. To what extent is the difference in student Language Arts achievement, as
measured by the Acuity Language Arts Diagnostic assessment, between fifth grade
students using a paper/pencil delivery method and fifth grade students using a computer-
based delivery method affected by gender?

70
H2. Gender affects the difference in Acuity Language Arts Diagnostic scores
between fifth grade students who were assessed using paper/pencil and fifth grade
students who were assessed using computers.
The first two-factor analysis of variance (ANOVA) was conducted to test H2.
The two categorical variables used to group the dependent variable, Acuity Language
Arts Diagnostic assessment scores for fifth grade students, were assessment delivery
method (paper/pencil and computer) and gender (male and female). The interaction
effect for assessment delivery method by gender was used to test H2. The level of
significance was set at .05. The results of the analysis indicated there was not a
statistically significant difference between at least two of the means, F = .809, df = 1,
335, p = .369. See Table 5 for the means and standard deviations for this analysis.
Table 5
Descriptive Statistics for the Results of the Test for H2 (Fifth Grade Students)
Assessment Delivery Method Gender M SD N
Paper/Pencil Male 68.953 19.146 92
Female 72.532 17.718 78
Computer Male 69.707 19.568 89
Female 69.596 18.700 80
RQ3. To what extent is the difference in student Language Arts achievement, as
measured by the Acuity Language Arts Diagnostic assessment, between fifth grade
students using a paper/pencil delivery method and fifth grade students using a computer-
based delivery method affected by minority status?

71
H3. Minority status affects the difference in student Language Arts achievement
scores as measured by the Acuity Language Arts Diagnostic assessment scores between
fifth grade students who were assessed using paper/pencil and fifth grade students who
were assessed using computers.
A second two-factor analysis of variance (ANOVA) was conducted to test H3.
The two categorical variables used to group the dependent variable, Acuity Language
Arts Diagnostic assessment scores for fifth grade students, were assessment delivery
method (paper/pencil and computer) and minority status (minority and non-minority).
The two-factor ANOVA can be used to test three hypotheses including a main effect for
assessment delivery method, a main effect for minority status, and a two-way interaction
effect (assessment delivery method x minority status). The interaction effect for
assessment delivery method by minority status was used to test H3. The level of
significance was set at .05. The results of the analysis indicated there was not a
statistically significant difference between at least two of the means, F = .004, df = 1,
335, p = .947. See Table 6 for the means and standard deviations for this analysis.
Table 6
Descriptive Statistics for the Results of the Test for H3 (Fifth Grade Students)
Assessment Delivery Method Minority Status M SD N
Paper/Pencil Minority 63.291 22.358 34
Non-Minority 72.059 18.383 126
Computer Minority 62.609 19.649 43
Non-Minority 72.059 18.383 126

72
RQ4. To what extent is the difference in student Language Arts achievement, as
measured by the Acuity Language Arts Diagnostic assessment, between fifth grade
students using a paper/pencil delivery method and fifth grade students using a computer-
based delivery method affected by socioeconomic status?
H4. Socioeconomic status affects the difference in student Language Arts
achievement scores as measured by the Acuity Language Arts Diagnostic assessment
scores between fifth grade students who were assessed using paper/pencil and fifth grade
students who were assessed using computers.
A third two-factor analysis of variance (ANOVA) was conducted to test H4. The
two categorical variables used to group the dependent variable, Acuity Language Arts
Diagnostic assessment scores for fifth grade students, were assessment delivery method
(paper/pencil and computer) and socioeconomic status (low SES and non-low SES). The
two-factor ANOVA can be used to test three hypotheses including a main effect for
assessment delivery method, a main effect for socioeconomic status, and a two-way
interaction effect (assessment delivery method x socioeconomic status). The interaction
effect for assessment delivery method by socioeconomic status was used to test the
interaction of H4. The level of significance was set at .05. The results of the analysis
indicated there was not a statistically significant difference between at least two of the
means, F = 1.195, df = 1, 335, p = .275. See Table 7 for the means and standard
deviations for this analysis.

73
Table 7
Descriptive Statistics for the Results of the Test for H4 (Fifth Grade Students)
Assessment Delivery Method SES M SD N
Paper/Pencil Low SES 65.638 19.447 94
Non-Low SES 76.726 15.377 76
Computer Low SES 66.965 19.553 101
Non-Low SES 73.649 17.820 68
RQ5. To what extent is there a statistically significant difference in student
Language Arts achievement, as measured by the Acuity Language Arts Diagnostic
assessment, between sixth grade students using a paper/pencil delivery method and sixth
grade students using a computer-based delivery method?
H5. There is a statistically significant difference in Acuity Language Arts
Diagnostic scores between sixth grade students who were assessed using paper/pencil and
sixth grade students who were assessed using computers.
A fourth two-factor analysis of variance (ANOVA) was conducted to test H5 and
H6. The two categorical variables used to group the dependent variable, Acuity
Language Arts Diagnostic assessment scores for sixth grade students, were assessment
delivery method (paper/pencil or computer) and gender (male and female). The two-
factor ANOVA can be used to test three hypotheses including a main effect for
assessment delivery method, a main effect for gender, and a two-way interaction effect
(assessment delivery method x gender). The main effect for assessment delivery method
was used to test H5. The level of significance was set at .05. The results of the analysis
indicated there was not a statistically significant difference between the average score for
students who participated in the paper/pencil and those who participated in the computer-

74
based assessment, F = .047, df = 1, 338, p = .829. See Table 8 for the means and
standard deviations for this analysis.
Table 8
Descriptive Statistics for the Results of the Test for H5 (Sixth Grade Students)
Assessment Delivery Method M SD N
Paper/Pencil 60.261 16.884 171
Computer 59.756 16.063 171
RQ6. To what extent is the difference in student Language Arts achievement, as
measured by the Acuity Language Arts Diagnostic assessment, between sixth grade
students using a paper/pencil delivery method and sixth grade students using a computer-
based delivery method affected by gender?
H6. Gender affects the difference in Acuity Language Arts Diagnostic scores
between sixth grade students who were assessed using paper/pencil and sixth grade
students who were assessed using computers.
The fourth two-factor analysis of variance (ANOVA) was conducted to test H6.
The two categorical variables used to group the dependent variable, Acuity Language
Arts Diagnostic assessment scores for sixth grade students, were assessment delivery
method (paper/pencil and computer) and gender (male and female). The interaction
effect for assessment delivery method by gender was used to test H6. The level of
significance was set at .05. The results of the analysis indicated there was a statistically
significant difference between at least two of the means, F = 7.427, df = 1, 338, p = .007.
A follow up post hoc was conducted to determine which pairs of means were different.
The Tukey’s Honestly Significant Difference (HSD) critical value was 6.56. The

75
differences between the means had to be greater than this value to be considered
significantly different. One of the differences was greater than this value. The results of
the analysis indicated that there was a statistically significant difference between sixth
grade males and the sixth grade females. Males who took the computer-based assessment
(M = 54.658) scored lower than females who took the computer-based assessment (M =
65.288). See Table 9 for the means and standard deviations for this analysis.
Table 9
Descriptive Statistics for the Results of the Test for H6 (Sixth Grade Students)
Assessment Delivery Method Gender M SD N
Paper/Pencil Male 59.815 17.707 100
Female 60.889 15.754 71
Computer Male 54.658 16.511 89
Female 65.288 13.631 82
RQ7. To what extent is the difference in student Language Arts achievement, as
measured by the Acuity Language Arts Diagnostic assessment, between sixth grade
students using a paper/pencil delivery method and sixth grade students using a computer-
based delivery method affected by minority status?
H7. Minority status affects the difference in student Language Arts achievement
scores as measured by the Acuity Language Arts Diagnostic assessment scores between
sixth grade students who were assessed using paper/pencil and sixth grade students who
were assessed using computers.
A fifth two-factor analysis of variance (ANOVA) was conducted to test H7. The
two categorical variables used to group the dependent variable, Acuity Language Arts
Diagnostic assessment scores for sixth grade students, were assessment delivery method

76
(paper/pencil and computer) and minority status (minority and non-minority). The two-
factor ANOVA can be used to test three hypotheses including a main effect for
assessment delivery method, a main effect for minority status, and a two-way interaction
effect (assessment delivery method x minority status). The interaction effect for
assessment delivery method by minority status was used to test H7. The level of
significance was set at .05. The results of the analysis indicated there was not a
statistically significant difference between at least two of the means, F = .436, df = 1,
338, p = .509. See Table 10 for the means and standard deviations for this analysis.
Table 10
Descriptive Statistics for the Results of the Test for H7 (Sixth Grade Students)
Assessment Delivery Method Minority Status M SD N
Paper/Pencil Minority 57.541 16.104 39
Non-Minority 61.064 17.084 132
Computer Minority 59.193 14.079 41
Non-Minority 59.933 16.686 130
RQ8. To what extent is the difference in student Language Arts achievement, as
measured by the Acuity Language Arts Diagnostic assessment, between sixth grade
students using a paper/pencil delivery method and sixth grade students using a computer-
based delivery method affected by socioeconomic status?
H8. Socioeconomic status affects the difference in student Language Arts
achievement scores as measured by the Acuity Language Arts Diagnostic assessment
scores between sixth grade students who were assessed using paper/pencil and sixth
grade students who were assessed using computers.

77
A sixth two-factor analysis of variance (ANOVA) was conducted to test H8. The
two categorical variables used to group the dependent variable, Acuity Language Arts
Diagnostic assessment scores for sixth grade students, were assessment delivery method
(paper/pencil and computer) and socioeconomic status (low SES and non-low SES). The
two-factor ANOVA can be used to test three hypotheses including a main effect for
assessment delivery method, a main effect for socioeconomic status, and a two-way
interaction effect (assessment delivery method x socioeconomic status). The interaction
effect for assessment delivery method by socioeconomic status was used to test the
interaction of H8. The level of significance was set at .05. The results of the analysis
indicated there was not a statistically significant difference between at least two of the
means, F = .778, df = 1, 338, p = .378. See Table 11 for the means and standard
deviations for this analysis.
Table 11
Descriptive Statistics for the Results of the Test for H8 (Sixth Grade Students)
Assessment Delivery Method SES M SD N
Paper/Pencil Low SES 57.810 16.168 101
Non-Low SES 63.797 17.379 70
Computer Low SES 58.676 15.335 105
Non-Low SES 61.473 17.137 66
Summary
Chapter four included a summary of the statistical testing and analysis. Six two-
factor analysis of variance (ANOVA) were conducted for each of the eight hypotheses
and was used to determine whether there was a difference in student achievement, as
measured by the Acuity Language Arts Diagnostic assessment, between students using a

78
paper/pencil or a computer-based delivery method. The researcher specifically examined
the extent to which the difference in student achievement between assessment delivery
methods was affected by gender, minority, and socioeconomic status. The result of the
analyses revealed a statistically significant difference did exist between sixth grade males
and sixth grade females who participated in the computer-based assessment delivery
method. A follow up post hoc using Tukey’s Honestly Significant Difference (HSD) was
conducted and revealed sixth grade males performed lower on the computer-based
assessment than sixth grade females. In all other areas a statistically significant
difference was not present. Chapter five includes the study summary, overview of the
problem, purpose statement and research questions, review of the methodology, major
findings, findings related to the literature, conclusions, implications for action, and
recommendations for future research.

79
Chapter Five
Interpretation and Recommendations
As technology continues to become more prevalent in today’s schools it is
understandable that high stakes testing will be moved from a paper/pencil delivery
method to a computer-based delivery method. The purpose of this study was to
determine whether there was a difference in student achievement, as measured by the
Acuity Language Arts Diagnostic assessment, between students using a paper/pencil
versus a computer-based delivery method. The researcher also examined how that
difference was affected by gender, minority, and socioeconomic status. Participants were
of upper elementary age (fifth grade or sixth grade) at the time of the study. This chapter
contains a summary of the study, which includes an overview of the problem, purpose
statement, and research questions, and a review of the methodology. Furthermore, this
chapter presents the major findings of the study and how the findings are related to the
literature. Finally, this chapter includes implications for action as well as
recommendations for future research.
Study Summary
This study determined whether there was a difference in student achievement, as
measured by the Acuity Language Arts Diagnostic assessment, between students using a
paper/pencil or a computer-based delivery method. Specifically, this study examined
how the difference in student achievement between assessment delivery methods was
affected by gender, minority, and socioeconomic status.

80
Overview of the problem. Little research has been conducted to determine how
subgroups respond to the different testing delivery methods (paper/pencil or computer-
based). In a synthesis of more than 80 studies comparing paper/pencil and computer-
based assessments, Kingston (2009) concluded the majority of studies did not focus on
varying subgroups of students and their comparability. Kim and Huynh (2010) also
found that earlier studies focused primarily on overall student performance, rather than
disaggregating data into student subgroups.
Earlier studies lack a focus on student subgroups, and many of the existing studies
are dated and include primarily small samples of college-aged students. Bunderson et al.
(1989) reviewed twenty-three studies comparing paper/pencil and computer-based
testing. Of the twenty-three studies, three indicated that participants obtained higher
scores when tested on a computer, nine showed higher results when participants were
tested using paper/pencil, and eleven reported that there was no difference in
achievement between the two test delivery methods. Many of these studies included
small samples of college-aged students. Additional studies have also indicated
inconclusive results with regard to a preferred testing delivery method (Mazzeo &
Harvey, 1988; Wise & Plake, 1989). Because schools and districts are adopting more
technology to support instruction and assessment, it is important to keep exploring the
impact that the use of technology has on assessment results.
With increased accountability from the federal government through the NCLB
Act, and more recently through the Race to the Top education initiative, it was essential
that educators understood the advantages and disadvantages of using a particular
assessment delivery method. Both PARCC and SBAC planned to use adaptive

81
computer-based assessments that included summative and interim assessments (Aspen
Institute, 2012; Fisher & Frey, 2013). Since the increase usage of computer-based
testing, it has become imperative that the differences related to gender, minority, and
socioeconomic status be further investigated with regard to assessment practices.
Purpose statement and research questions. The purpose of this study was to
determine whether there was a difference in student achievement, as measured by the
Acuity Language Arts Diagnostic assessment, between students using a paper/pencil or a
computer-based delivery method. This study also examined whether that difference was
affected by gender, minority, and socioeconomic status.
Review of the methodology. This quantitative study involved Mill Creek Upper
Elementary, a school in the Belton School District located south of Kansas City,
Missouri. Specifically, the researcher used a quasi-experimental research design. The
dependent variable was the students’ Language Arts score from the Acuity Language
Arts Diagnostic assessment. Four independent grouping variables included the
assessment delivery method (paper/pencil or computer-based) as well as the
demographics of gender (male/female), minority status (minority/non-minority) and
socioeconomic status (low socioeconomic status/non-low socioeconomic status).
Multiple two-factor ANOVAs were conducted to determine whether there was a
difference in student achievement, as measured by the Acuity Language Arts Diagnostic
assessment, between students using a paper/pencil or a computer-based delivery method
and to determine if the demographics of gender, minority, and socioeconomic status
affected the difference.

82
Major findings. There were no statistically significant differences found between
students who were assessed using paper/pencil and students who were assessed using a
computer with one exception. The assessment delivery method did not make a difference
and the demographics of gender, minority, and socioeconomic status did not change this
except for in the sixth hypothesis. The sixth hypothesis stated that gender would affect
the difference in Acuity Language Arts Diagnostic scores between sixth grade students
who were assessed using paper/pencil and sixth grade students who were assessed using
computers. A statistical analysis of the data was conducted by completing multiple two-
factor analysis of variance (ANOVA). The test results revealed a statistically significant
difference did exist between the sixth grade males and sixth grade females when taking
the computer-based assessment. The mean achievement score for the sixth grade males
on the computer-based assessment was more than 10% lower than the mean achievement
score for the sixth grade females. Although a statistically significant difference did exist
between the sixth grade males and sixth grade females on the computer-based
assessment, the same did not hold true for fifth grade male and fifth grade female study
participants or for sixth grade male and sixth grade female participants who took the
paper/pencil assessment. Additionally, there was not a statistically significant difference
between minority and non-minority study participants or between low socioeconomic
status and non-low socioeconomic status study participants.
Findings Related to the Literature
The researcher conducted a review of literature related to paper/pencil and
computer-based testing and the implications for schools and students. A review of
existing literature regarding demographics (gender, minority, and socioeconomic status)

83
and their impact on testing was also conducted. While literature surrounding whether or
not differences exist between paper/pencil and computer-based assessments was
abundant (Bugbee, 1996; Kim & Huynh, 2007; Neuman & Baydoun, 1998; Peak, 2005;
Poggio et al., 2005) fewer had researched the role demographics may have on assessment
delivery methods (Clariana & Wallace, 2005; Gallagher et al., 2002). Most of the
existing literature explored college-age students who were identified as digital
immigrants (Prensky, 2001). Some of this research has become dated, as today’s students
are digital natives (Prensky 2001).
According to Pellegrino and Quellmalz (2010), advantages of computer-based
assessments included the ability to test more frequently, the ability to test more concepts,
the ability to provide quicker feedback, the ability to assess in a variety of ways
(multiple-choice, short answer, etc.), heightened objectivity, decreased time on grading,
and decreased manual work. Although many of these advantages may allow educators to
use their time more effectively, these advantages do not appear to be linked to increased
student achievement on computer-based assessment delivery methods based on the
results from the current study.
The same held true for disadvantages that have been linked to computer-based
delivery methods in that they did not seem to hinder study participants’ performance on
computer-based assessments in the current study. Kingston (2009) concluded in a meta-
analysis of 81 studies that were conducted between 1997 and 2007 that examinees could
be using different hardware from one assessment to the next, leading to increased levels
of frustration by the student. Additionally, when appropriate bandwidth used to transmit

84
Internet connection was lacking, it was shown that students perform worse than when
using paper/pencil exams (Kingston, 2009).
The results of this study provided evidence that the paper/pencil delivery method
and computer-based assessment delivery method are comparable, with only one
exception reported in this study (the impact of gender of sixth grade computer-based
study participants). This conclusion is consistent with previous findings (Bugbee, 1996;
Kim & Huynh, 2007; Neuman & Baydoun, 1998; Peak, 2005; J. Poggio, Glasnapp, Yang,
& A. Poggio, 2005). These findings indicated that paper/pencil and computer-based
assessment scores were comparable.
The results of this study provided evidence that there was no difference in
achievement between fifth grade male and fifth grade female participants based on the
assessment delivery method. However, a statistically significant difference did exist
between sixth grade male and sixth grade female participants who completed the
computer-based assessment, with sixth grade females achieving a mean achievement
score of greater than 10% more points overall on computer-based assessments than sixth
grade males. This finding differs from the results of a meta-analysis by Gallagher et al.
(2002). Gallagher et al. (2002) collected data from multiple national testing companies to
determine if there was a difference in performance between gender groups. The
researchers concluded slight differences in achievement did exist between males and
females. Gender differences were apparent on two out of twelve subtests that female test
takers perform slightly better on paper/pencil assessments than on computer-based
assessments (Gallagher et al., 2002). However, in all other areas that assessed the

85
influence gender had on assessment delivery methods, a statistically significant
difference did not exist.
In a synthesis of existing research, Clariana and Wallace (2005) reported the
differences gender had on student achievement on paper/pencil and computer-based
assessments. Since males tended to report more access to, knowledge of, and learning
experiences with computers, females may have been at a disadvantage when it came to
computer-based assessments (Clariana & Wallace, 2005; Cooper, 2006). The researcher
of the current study came to a different conclusion than Clariana and Wallace (2005),
finding that sixth grade females outperformed sixth grade males on the computer-based
assessment.
In addition to gender, this study examined the effect minority status had on
assessment results when comparing paper/pencil and computer-based delivery methods.
Segall (1997) and Gallagher et al. (2002) found small but consistent patterns of
differences in performance between minority groups. African-Americans and, to a
smaller extent, Hispanics benefited somewhat from the computer-based delivery method.
It was important to note that in Gallagher et al.’s study all test takers experienced a
stronger performance on computer-based delivery systems than when being assessed by
paper/pencil (Gallagher, Bridgeman, & Cahalan, 2002). Unlike the studies above, the
current study provided no evidence for a statistically significant difference between the
assessment delivery methods and minority/non-minority students.
The current study also explored the effect of a low socioeconomic or a non-low
socioeconomic status had on assessment results when comparing paper/pencil and
computer based delivery methods. Earlier researchers found there were fewer

86
opportunities for children from low socioeconomic backgrounds to access high quality
educational resources at home than there were for students from non-low socioeconomic
backgrounds (U.S. Department of Education, 2000; Viadero, 2000). MacCann (2006)
noted nearly identical scores were reported for non-low socioeconomic status students on
the two assessment delivery methods. However, differences did exist that favored the
paper/pencil method over the computer-based method for students identified as low
socioeconomic status students. Contrary to the studies above, the current study found no
statistically significant difference between the two assessment delivery methods and
participants from a low socioeconomic status and those from a non-low socioeconomic
status.
Conclusions
This section contains implications for school districts when identifying the most
reliable and advantageous assessment delivery method regarding student use. The
implications of this study could be used to help educators interpret assessment data
leading them to draw more accurate conclusions and thus make sound decisions
regarding student improvement. Furthermore, recommendations for future research are
presented as a result of the findings from the current study. Last, concluding remarks
close this chapter.
Implications for action. The findings from this study have implications for
states, districts, and schools that will begin using computer-based assessment delivery
methods when the PARCC and SBAC assessments are first administered during the
2014-2015 school year. The data from the current study reveals that the results between
paper/pencil and computer-based assessments were comparable. When analyzing

87
demographic data, the current study revealed that minority and socioeconomic status did
not influence participant achievement regardless of the assessment delivery method.
However, gender may be a variable that districts and schools should be mindful of as they
analyze their own student achievement data. It is important for those interpreting
assessment data to disaggregate the data by subgroups to ensure achievement levels are
comparable. By combining the overall assessment results into various subgroups, a
system can more accurately draw conclusions and ensure improvement. Analysis of the
data from this study can provide information that may be utilized by states, districts, or
schools as they work to interpret initial student assessment scores from the first round of
PARCC and/or SBAC assessment results.
Recommendations for future research. The current study allowed the
researcher to evaluate student achievement data on two assessment delivery methods and
disaggregate the data based on gender, minority, and socioeconomic status. The
recommendations below are made for others interested in conducting a study involving
the assessment delivery methods.
1. Replicate the current study using participants in grades three, six, and nine.
This may present new information that school stakeholders could generalize to
both elementary and secondary students. The increased technology skill level
in a particular grade/age of student may have an impact on student assessment
results when comparing different delivery methods.
2. Replicate the current study using different types of technological devices such
as tablets or smart phones. For instance, instead of using the variables of

88
paper/pencil and computer-based, one may analyze the delivery methods of
computers versus tablets.
3. Replicate the current study using a larger sample size. Doing so may help
provide clarity to the statistically significant difference that was identified in
the current study between sixth grade males and females participating in the
computer-based assessment.
4. Conduct a similar study using constructed response assessments instead of
multiple-choice assessments, which were used in the current study.
Constructed response assessments would allow school stakeholders to
generalize the results across assessment type.
5. Replicate the current study using other content areas in lieu of Language Arts.
Doing so would allow school stakeholders to generalize the results across the
disciplines.
Concluding remarks. Technology integration will continue to expand in schools
across the United States. As this happens, paper/pencil assessments will continue to
dwindle while computer-based assessments will be on the rise. Furthermore, the U.S.
Department of Education will continue to drive advances in the area of state, district, and
school accountability through the use of national assessments such as those developed by
the PARCC and SBAC. As this happens, it will be essential for states, districts, and
schools to ensure the authenticity of such scores for each of their students. This research
supports the comparability of paper/pencil and computer-based assessments but
encourages those analyzing achievement data to continue to disaggregate the data by the
demographics of gender, minority, and socioeconomic status.

89
References
AL-Smadi, M., & Gütl, C. (2008, September). Past, present and future of e-assessment:
Towards a flexible e-assessment system. Paper presented at the Conference ICL,
Villach, Austria. Retrieved from http://www.scribd.com/doc/6947351/Past-
Present-and-Future-of-EAssessmentTowards-a-Flexible-EAssessment-System
Aspen Institute. (2012). Common Core State Standards: An introduction for families and
other stakeholders [Fact sheet]. Retrieved from
http://www.aspendrl.org/portal/browse/DocumentDetail?documentId=1595&dow
nload
Bauer, H. (2005). The relationship between technology integration reading instruction
and reading achievement in high-performing campuses as reported by PEIMS
and third grade classroom teachers in selected south Texas school districts
(Doctoral dissertation). Retrieved from
http://search.proquest.com.proxyb.kclibrary.org
Baumer, M., Roded, K., & Gafni, N. (2009). Assessing the equivalence of internet-based
vs. paper-and-pencil psychometric tests. In D. J. Weiss (Ed.), Proceedings of the
2009 GMAC conference on computerized adaptive testing. Paper presented at the
California Comparability Symposium, Burlingame, CA. Retrieved from
http://publicdocs.iacat.org/cat2010/cat09roded.pdf
Belton School District. (2012). Student enrollment summary report. Acquired from
student information data at http://ic.bsd124.org/campus/main.xsl
Bennett, R. E. (2008). Technology for large-scale assessment. (ETS Report No. RM-08-
10). Princeton, NJ: Educational Testing Service.

90
Bhoola-Patel, A., & Laher, S. (2011). The influence of mode of test administration on
test performance. Journal of Psychology in Africa, 21(1), 139-144.
Bleske-Rechek, A., Zeug, N., & Webb, R. M. (2007). Discrepant performance on
multiple-choice and short answer assessments and the relation of performance to
general scholastic aptitude. Assessment & Evaluation in Higher Education, 32(2),
89-105.
Bontis, N., Hardie, T., & Serenko A. (2009). Techniques for assessing skills and
knowledge in a business strategy classroom. International Journal of Teaching
and Case Studies, 2(2), 162-180.
Borja, R. R. (2003, May). Preparing for the big test: Students turn to the Web to get ready
for high-stakes exams. Education Week, 22(35), 23-26.
Bridgeman, B., Lennon, M. L., & Jackenthal, A. (2001). Effects of screen size, screen
resolution, and display rate on computer-based test performance (Research
Report No. 01-23). Princeton, NJ: Educational Testing Service.
Bridgeman, B., Lennon, M. L., & Jackenthal, A. (2003). Effects of screen size, screen
resolution and display rate on computer-based test performance. Applied
Measurement in Education, 16(3), 191-205. doi: 10.1207/S15324818AME1603_2
Bugbee, A. C., Jr., (1996). The equivalence of paper-and-pencil and computer-based
testing. Journal of Research on Computing in Education, 28(3), 282-299.
Retrieved from http://proxyb.kclibrary.org/login?url=http://search.ebscohost.com/
login.aspx?direct=true&db=aph&AN=9605221096&site=ehost-live

91
Bugbee, A. C., Jr., & Bernt, F. M. (1990). Testing by computer: Findings in six years of
use 1982-1988. Journal of Research on Computing in Education, 23(1), 87-100.
Accession Number: 9609221569
Bunderson, C. V., Inouye, D. K., & Olsen, J. B. (1989). The four generations of
computerized educational measurement. In R. L. Linn (Ed.), Educational
measurement (3rd ed.) (pp. 367-407). New York, NY: American Council on
Education-Macmillan.
Bushweller, K. (2000). Electronic exams. American School Board Journal, 187(6), 20-
24.
Choi, S. W., & Tinkler, T. (2002). Evaluating comparability of paper and computer
based assessments in a K-12 setting. Paper presented at the Annual Meeting of the
National Council on Measurement in Education, New Orleans, LA.
Chua, S. L., Chen, D. T., & Wong, A. F. L. (1999). Computer anxiety and its correlates:
A meta-analysis. Computers in Human Behavior, 15(5), 609-624.
Clariana, R. B., & Wallace, P. (2002). Paper-based versus computer based assessments:
Key factors associated with the test mode effect. British Journal of Educational
Technology, 33, 593-602.
Clariana, R. B., & Wallace, P. (2005). Gender differences in computer-administered
versus paper-based tests. International Journal of Instructional Media, 32(2),
171-179.
Cooper, J. (2006). The digital divide: The special case of gender. Journal of Computer
Assisted Learning, 22(5), 320-334. doi: 10.1111/j.1365-2729.2006.00185.x

92
CTB/McGraw-Hill. (2008). The computer based or online administration of paper and
pencil tests. Retrieved from
http://www.ctb.com/ctb.com/control/assetDetailsViewAction?articleId=665&asse
tType=article¤tPage=1&p=library
CTB/McGraw-Hill. (2011a). Acuity assessment focused on learning: State of Missouri
(Technical Report). Monterey, CA: Author.
CTB/McGraw-Hill. (2011b). Drive achievement for all students with Acuity Missouri.
Monterey, CA: Author.
Douglas, M., Wilson, J., & Ennis, S. (2012). Multiple-choice question tests: A
convenient, flexible and effective learning tool? A case study. Innovations in
Education and Teaching International, 49(2), 111-121.
Edwards, V., Chronister, G., Bushweller, K., Skinner, R., & Bowman, D. (2003).
Technology counts 2003: Technology's answer to testing. Education Week,
35(22), 8-9.
Ennis, S. R., Rios-Vargas, M., & Albert, N. G. (2011). The Hispanic population: 2010
census briefs. (C2010BR-04). Retrieved from
http://www.census.gov/prod/cen2010/briefs/c2010br-04.pdf
Erturk, I., Ozden, Y., & Sanli, R. (2004). Students’ perceptions of online assessment: A
case study. Journal of Distance Education, 19(2), 77-92.
Facer, K. & Furlong, R. (2001). Beyond the myth of the ‘Cyberkid’: Young people at the
margins of the information revolution. Journal of Youth Studies, 4(4), 451-469).

93
Fact sheet: No child left behind has raised expectations and improved results. (n.d.).
White House archives, education reform: No Child Left Behind. Retrieved from
http://georgewbush-whitehouse.archives.gov/infocus/education/
Fisher, D., & Frey, N. (2013). In Common core English language arts in a PLC at work
grades 3-5. Bloomington, IN: Solution Tree Press.
Flowers, C., Do-Hong, K., Lewis, P., & Davis, V. (2011). A comparison of computer-
based testing and pencil-and-paper testing for students with read-aloud
accommodation. Journal of Special Education Technology, 26(1), 1-12.
Fritts, B. E., & Marszalek, J. M. (2010). Computerized adaptive testing, anxiety levels,
and gender differences. Social Psychology of Education, 13(3), 441-458. doi:
10.1007/s11218-010-9113-3
Gallagher, A., Bridgeman, B., & Cahalan, C. (2002). The effect of computer-based tests
on racial-ethnic and gender groups. Journal of Educational Measurement, 39(2),
133-147.
Galley, M. (2003, May). The teacher’s new test: Computerized exams finding a niche in
classroom assessment. Education Week, 22(35), 31-33.
Gordon, N. L. (2011). Integrating technology-based instruction in middle grades
language arts: Motivating and engaging at-risk learners in reading
comprehension (Doctoral dissertation). Retrieved from
http://search.proquest.com.proxyb.kclibrary.org
Graham, J. M., Mogel, L. A., Brallier, S. A., & Palm, L. J. (2008). Do you online?: The
advantages and disadvantages of online education. Bridges On-Line Journal, 19,
27-36. Retrieved from http://www.coastal.edu/bridges/winter2008.html

94
Gullen, K. (2014). Are our kids ready for computerized tests? Educational Leadership,
71(6), 68-71.
Higgins, J., Russell, M., & Hoffmann, T. (2005). Examining the effect of computer-based
passage presentation on reading test performance. Journal of Technology,
Learning, and Assessment, 3(4), 1-35. Retrieved from
http://ejournals.bc.edu/ojs/index.php/jtla/article/view/1657/1499
Hixson, L., Hepler, B. B., & Kim, M. O. (2011). The white population: 2010 census
briefs. (C2010BR-05). Retrieved from
http://www.census.gov/prod/cen2010/briefs/c2010br-05.pdf
Horton, S. V., & Lovitt, T. C. (1994). A comparison of two methods of administering
group reading inventories to diverse learners: Computer versus pencil and paper.
Remedial and Special Education, 15(6), 378-390. doi:
10.1177/074193259401500606
Kapes, J. T., & Vansickle, T. R. (1992). Comparing paper-pencil and computer-based
versions of the Harrington-O’Shea Career Decision-Making System.
Measurement and Evaluation in Counseling and Development, 25(1), 5-13.
Accession Number: 9709042738
Kim, D. H., & Huynh, H. (2007). Comparability of computer-based and paper-and-pencil
testing for algebra and biology. Journal of Technology, Learning, and
Assessment, 6(4). Retrieved from
http://escholarship.bc.edu/jtla/vol6/4/http://escholarship.bc.edu/jtla/vol6/4/

95
Kim, D. H., & Huynh, H. (2008). Computer-based and paper-and-pencil administration
mode effects on the statewide end-of-course English test. Educational and
Psychological Measurement, 68(4), 554-570. doi: 10.1177/0013164407310132
Kim, D. H., & Huynh, H. (2009). Transitioning from paper-and pencil to computer-based
testing: Examining stability of Rasch latent trait across gender and ethnicity. In E.
V. Smith & G. E. Stone (Eds.), Criterion-referenced testing: Practice analysis to
score reporting using Rasch measurement (pp. 121-137). Maple Grove, MN:
JAM Press.
Kim, D. H., & Huynh, H. (2010). Equivalence of paper-and-pencil and online
administration modes of the statewide English test for students with and without
disabilities. Educational Assessment, 15(2) 107-121. doi:
10.1080/10627197.2010.491066
Kingston, N. M. (2009). Comparability of computer- and paper-administered multiple-
choice test for k-12 populations: A synthesis. Applied Measurement in Education,
22(1), 22-37. doi: 10.1080/08957340802558326
Kinzer, C. K., Sherwood, R. D., & Bransford, J. D. (1986). Computer strategies for
education. Columbus, OH: Merrill Publishing Co.
Lesage, M., Riopel, M., & Raîche G. (2010). Cluster assessment: A complimentary
aspect of cluster learning in J. Sanchez & K. Zhang (Eds.), Proceedings of World
Conference on E-Learning in Corporate, Government, Healthcare, and Higher
Education 2010 (1959-1966). Chesapeake, VA: AACE.
Levine, Y., & Donitsa-Schmidt, S. (1998). Computer use, confidence, attitudes, and
knowledge: A casual analysis. Computers in Human Behavior, 14(1), 125-146.

96
Linn, R. L. (2000, March). Assessments and accountability. Educational Researcher,
29(2), 4-16. doi: 10.3102/0013189X029002004
Lunenburg, F. C., & Irby, B. J. (2008). Writing a successful thesis or dissertation: Tips
and strategies for students in the social and behavioral sciences. Thousand Oaks,
CA: Corwin Press.
MacCann, R. (2006). The equivalence of online and traditional testing for different
subpopulations and item types. British Journal of Educational Technology, 37(1),
79-91. doi: 10.1111/j.1467-8535.2005.00524.x.
MacMillan, D. (2009, July). Tech in schools: Federal cuts sow concern. Bloomberg
Businessweek Technology. San Francisco, CA. Retrieved from
http://www.businessweek.com/technology/content/jul2009/tc20090710_519786.h
tm
Marzano, R. J. (2003). What works in schools: Translating research into action.
Alexandria, VA: Association for Supervision and Curriculum Development.
Maurer, M., & Simonson, M. (1984, January). Development and validation of a measure
of computer anxiety. In: M. Simonson. Proceedings of Selected Research Paper
Presentations, the 1984 Convention of the Association for Educational
Communications and Technology (pp. 310-330). Paper presented at The
Convention of the Association for Educational Communications and Technology,
Dallas, TX.

97
Mazzeo, J., & Harvey A. (1988). The equivalence of scores from automated and
conventional educational and psychological tests: A review of the literature
(Research Report No. CBR-87-8), ETS RR-88-21). Retrieved from
http://research.collegeboard.org/sites/default/files/publications/2012/7/researchrep
ort-1988-8-equivalence-scores-automated-conventionall-tests.pdf
McDonald, A. S. (2002). The impact of individual differences on the equivalence of
computer-based and paper-and-pencil educational assessments. Computer &
Education, 39(3), 299-312. doi: 10.1016/S0360-1315(02)00032-5
McIlroy, D., Bunting, B., & Tierney, K. (2001). The relation of gender and background
experience to self-reported computer anxieties and cognitions. Computers in
Human Behavior, 17(1), 21-33.
Messineo, M., & DeOllos, I. Y. (2005). Are we assuming too much?. College Teaching,
53(2), 50-55.
Millsap, C. M. (2000). Comparison of computer testing versus traditional paper and
pencil testing (Doctoral dissertation). Retrieved from
http://search.proquest.com.proxyb.kclibrary.org
Missouri Department of Elementary and Secondary Education. (1996, January). The
Show-Me Standards. Retrieved from http://dese.mo.gov/show-me-standards
Missouri Department of Elementary and Secondary Education. (2004). Questions &
answers about No Child Left Behind: 2004 update. Retrieved from
http://dese.mo.gov/divimprove/fedprog/grantmgmnt/documents/QA_NCLB_0816
2004.pdf

98
Missouri Department of Elementary and Secondary Education. (2008, Nov. 12). State
policies on reading assessment, “Reading improvement plans,” student retention
and MAP testing. Retrieved August 2, 2014, from
http://dese.mo.gov/college-career-readiness/curriculum/english-language-
arts/senate-bill-319
Missouri Department of Elementary and Secondary Education. (2011). Free and reduced
price application and direct certification: Information and procedures. Retrieved
from http://dese.mo.gov/sites/default/files/FreeandReduced-
DirectCertbooklet2011-2012.doc
Missouri Department of Elementary and Secondary Education. (2013). MSIP 5
Performance Standards [PowerPoint slides]. Retrieved from
http://dese.mo.gov/webinar/documents/MSIP5PerformanceStandards3-1-13.pdf
Missouri Department of Elementary and Secondary Education, (2014). Quick facts:
District and school information. Retrieved from
http://mcds.dese.mo.gov/quickfacts/Pages/District-and-School-Information.aspx
National Center for Fair and Open Testing. (2002). Computerized testing: More questions
than answers (Fact Sheet). Retrieved from http://fairtest.org/facts/computer.html
Neuman, G., & Baydoun, R. (1998). Computerization of paper-and –pencil test: When
are they equivalent? Applied Psychological Measurement, 22(1), 71-83. doi:
10.1177/01466216980221006
No Child Left Behind Act of 2001, Pub. L. No. 107-110 § 101 (2002).

99
U.S. Office of Management and Budget. (1997). Revisions to the standards for the
classification of federal data on race and ethnicity. Retrieved from
http://www.whitehouse.gov/omb/fedreg_1997standards/
Olson, L. (2003, May). Legal twists, digital turns: Computerized testing feels the impact
of ‘No Child Left Behind’. Education Week, 22(35), 11-14.
Park, J. (2003). A test-taker’s perspective. Education Week, 22(35), 15.
Parshall, C. G., Spray, J. A., Kalohn, J. C., & Davey, T. (2002). Practical considerations
in computer-based testing. doi: 10.1007/978-1-4613-0083-0_1
Peak, P. (2005). Recent trends in comparability studies. (Research Report no. 0505).
Retrieved from Pearson Educational Measurement website:
www.pearsonassessments.com/NR/rdonlyres/.../OnlineorPaper.pdf
Pellegrino, J. W., & Quellmalz, E. S. (2010). Perspectives on the integration of
technology and assessment. Journal of Research on Technology in Education,
43(2), 119-134.
Perie, M., Marion, S., Gong, B., & Wurtzel, J. (2007). The role of interim assessments in
a comprehensive assessment system. Measures that Matter [Policy Brief].
Retrieved from http://www.achieve.org/files/TheRoleofInterimAssessments.pdf
Poggio, J., Glasnapp, D. R., Yang, X., & Poggio, A. J. (2005). A comparative evaluation
of score results from computerized and paper and pencil mathematics testing in a
large scale state assessment program. Journal of Technology, Learning, and
Assessment, 3(6). Retrieved from http://www.jtla.org

100
Pommerich, M. (2004). Developing computerized versions of paper-and-pencil tests:
Mode effects for passage-based tests. Journal of Technology, Learning, and
Assessment 2(6). Retrieved from http://escholarship.bc.edu/jtla/vol2/6/
Pomplun, M., Ritchie, T., & Custer, M. (2006). Factors in paper-and-pencil and computer
reading score differences at the primary grades. Educational Assessment, 11(2),
127-143. doi: 10.1207/s15326977ea1102_3
Porter, A., McMaken, J., Hwang, J., & Yang, R. (2011). Common core standards: The
new U.S. intended curriculum. Educational Researcher, 40(3), 103-116.
Prensky, M. (2001). Digital natives, digital immigrants. MCB University Press, 9(5), 1-6.
Retrieved from http://www.marcprensky.com/writing/Prensky%20-
%20Digital%20Natives,%20Digital%20Immigrants%20-%20Part1.pdf
Prensky, M. (2005, December). Shaping tech for the classroom. Retrieved from
http://www.edutopia.org/adopt-and-adapt-shaping-tech-for-classroom
Prensky, M. (2013). Our brains extended. Educational Leadership, 70(6), 22-27.
Protheroe, N. (2008). District support for school improvement. Principal, 87(3), 36-39.
Public Broadcasting Service. (2001). Master timeline [1900]. School: The story of
American public education, roots in history. Retrieved from
https://www.pbs.org/kcet/publicschool/roots_in_history/choice_master3.html
Quellmalz, E. S., & Pellegrino, J. W. (2009). Technology and testing. Science,
323(5910), 75-79. doi: 10.1126/science.1168046
Quick, H. E., & Gallagher, L. P. (2004, April). A closer look at the digital divide:
Computer access and use for disadvantaged students. Paper presented at annual
meeting of the American Educational Research Association, San Diego, CA.

101
Rabinowitz, S., & Brandt, T. (2001). Computer-based assessment: Can it deliver on it’s
promise? Knowledge Brief. Retrieved from: http://wested.org
Rastogi, S., Johnson, T. D., Hoeffel, E. M., & Drewery Jr., M. P. (2011). The black
population: 2010 census briefs. (C2010BR-06). Retrieved from: United States
Census Bureau http://www.census.gov/prod/cen2010/briefs/c2010br-06.pdf
Rowe, N. C. (2004). Cheating in online student assessment: Beyond plagiarism. Online
Journal of Distance Learning Administration, 7(2), 1-10. Retrieved from
http://www.westga.edu/~distance/ojdla/summer72/rowe72.html
Segall, D. (1997). Equating the CAT-ASVAB. In W. Sands, B. Waters, & J. McBride
(Eds.), Computerized adaptive testing: From inquiry to operation (pp. 181-198).
Washington, DC: American Psychological Association.
Serwata, J. (2003). Assessment in on-line CISs courses. Journal of Computer Information
Systems, 44, 16-20.
Sloan, W. (2010, December). Coming to terms with common core standards. ASCD,
16(4). Retrieved from http://www.ascd.org/publications/newsletters/policy-
priorities/vol16/issue4/full/Coming-to-Terms-with-Common-Core-Standards.aspx
Smarter Balanced Assessment Consortium. (2012). If states administer a paper-and-
pencil version of the assessment, will scores be comparable with the computer
adaptive test? [FAQ]. Retrieved from http://www.smarterbalanced.org/faq/36-if-
states-administer-a-paper-and-pencil-version-of-the-assessment-will-scores-be-
comparable-with-the-computer-adaptive-test/

102
Stenner, A. J. (1996, October). Measuring reading comprehension with the Lexile
framework. Paper presented at the California Comparability Symposium,
Burlingame, CA.
Stephens, D. (2001). Use of computer assisted assessment: Benefits to students and staff.
Education for Information, 19(4), 265-275.
Stocking, M. L., & Swanson, L. (1993). A method for severely constrained item selection
in adaptive testing. Applied Psychological Measurement, 17, 277-292.
Sutton, R. E., (1991). Equity and computers in the schools: A decade of research. Review
of Educational Research, 61(4), 475-503.
Trotter, A. (2002). Testing computerized exams. Education Week, 20(37), 30-35.
Trotter, A. (2003). A question of direction. Education Week, 22(35), 17-20.
Urban, C. M. (1986). Inequities in computer education due to gender, race, and
socioeconomic status (Doctoral dissertation). Retrieved from
http://eric.ed.gov/?id=ED279594
U.S. Department of Education, National Center for Educational Statistics, (2000). Digest
of educational statistics. Retrieved from
nces.ed.gov/programs/digest/d00/dt424.asp
U.S. Department of Education, Office of Planning, Evaluation and Policy Development,
ESEA. (2010). Blueprint for reform: The reauthorization of elementary and
secondary education act. Retrieved from
http://www2.ed.gov/policy/elsec/leg/blueprint/blueprint.pdf
U.S. Department of Education. (2013, May). Race to the top assessment program.
Retrieved from http://www2.ed.gov/programs/racetothetop-assessment/index.html

103
Viadero, D. (2000, March). Lags in minority achievement defy traditional explanations.
Education Week, 19(28), 18-22.
Wainer, H. (1990). Computerized adaptive testing: A primer. Hillsdale, NJ: Erlbaum.
Walsh, M. (2003, May). Marketing to the test: Companies envision profits in computer-
based assessment. Education Week’s Technology Counts, 22(35), 34-39.
Wang, S., Jiao, H., Young, M. J., Brooks, T., & Olson, J. (2008). Comparability of
computer-based and paper-and-pencil testing in K-12 reading assessments: A
meta-analysis of testing mode effects. Educational and Psychological
Measurement, 68(1), 5-24. doi: 10.1177/0013164407305592
Weaver, A. J., & Raptis, H. (2001). Gender differences in introductory atmospheric and
oceanic science exams: Multiple choice versus constructed response questions.
Journal of Science Education and Technology, 10(2), 115-126.
Whitaker, T. A., Williams, N. J., & Dodd, B. G. (2011). Do examiners understand score
reports for alternate methods of scoring computer-based tests?. Educational
Assessment, 16(2), 69-89.
Wise, S. L., & Plake, B. S. (1989). Research on the effects of administering tests via
computers. Educational Measurement: Issues and Practice, 8(3), 5-10. doi:
10.1111/j.1745-3992.1989.tb00324.x
Wienberg, S. B., & Fuerst, M. (1984). Computerphobia: How to slay the dragon of
computer fear. Wayne, PA: Banbury Books.

104
Appendices

105
Appendix A: Maximum Annual Household Income Eligible for Free and
Reduced Priced Meals

106
Household Size Reduced Priced Meals Free Meals
1 20,147 14,157
2 27,214 19,123
3 34,281 24,089
4 41,348 29,055
5 48,415 34,021
6 55,482 38,987
7 62,549 43,953
8 69,616 48,919
For each additional person, add +7,067 +4,966
Note: Adapted from “Missouri Department of Elementary and Secondary Education School Food Service
Section,” by the Missouri Department of Elementary and Secondary Education, 2011 May 5. Retrieved
from http://dese.mo.gov/divadm/food/.

107
Appendix B: Baker University IRB Application

108

109
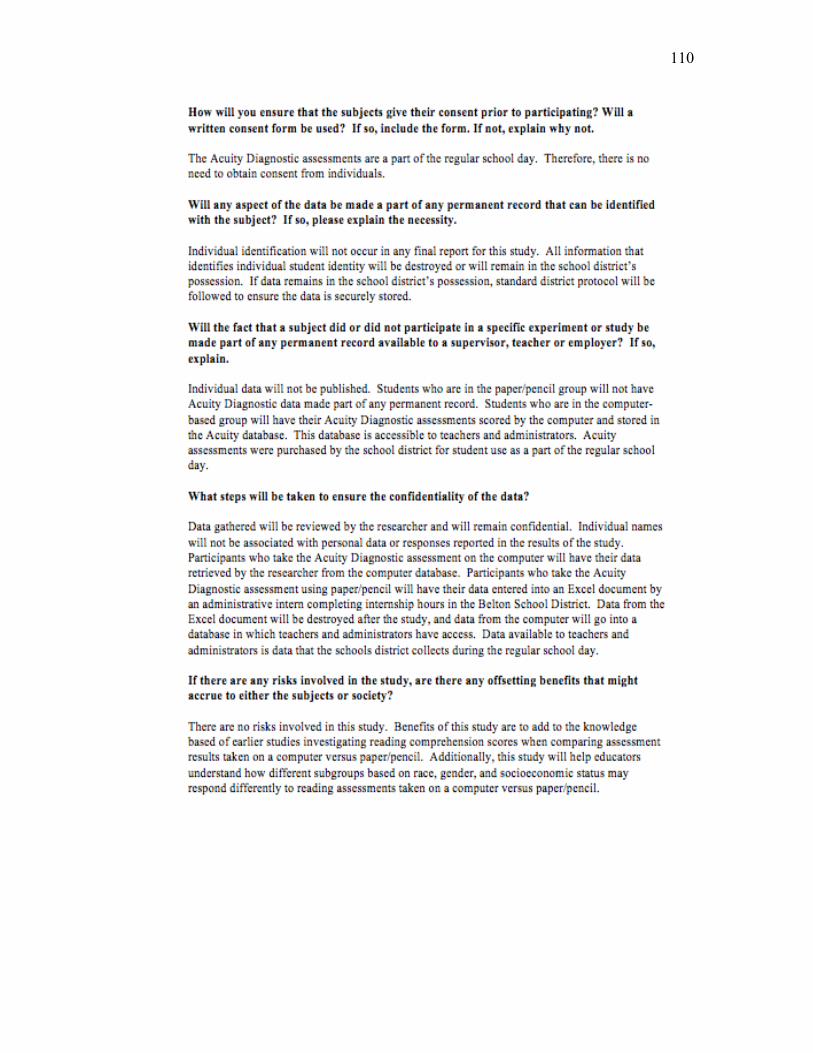
110

111

112
Appendix C: Belton School District Approval Letter

113

114
Appendix D: Baker University IRB Approval Letter

115

116
Appendix E: Acuity Research Synopsis Prepared for Alisa Seidelman

117

118

119