the impact of ability grouping on college student’s performance
TRANSCRIPT

THE IMPACT OF ABILITY GROUPING ON COLLEGE STUDENT’S PERFORMANCE
IN INTRODUCTORY GEOLOGY LABS AT A MIDWESTERN UNIVERSITY
by
KIMBERLY RENÉE BOSCO
B.S., Kansas State University, 2004
A THESIS
submitted in partial fulfillment of the requirements for the degree
MASTER OF SCIENCE
Department of Geology College of Arts and Sciences
KANSAS STATE UNIVERSITY Manhattan, Kansas
2009
Approved by:
Major Professor Dr. Iris Totten

Abstract
There have been numerous studies done during the past hundred years on ability
grouping. The majority of research has focused on the elementary and secondary levels, with
very little done at the post-secondary level of education. Research shows at the K-12 levels high
achieving students have a greater level of learning when placed in groups together. Mid- level
students also show higher achievement in homogeneous groupings. Both high and mid-level
students benefit from heterogeneous grouping, but with smaller gains. Lower ability students
placed in homogenous groups have shown significant gains, but still perform better when
grouped heterogeneously compared with classes that are not grouped by ability. All students
show increases in learning when placed in small groups of any kind. Mid-level and low
achieving students have higher levels of learning when they are taught by someone determined to
close the gap, who takes the students' abilities into consideration, and focuses on increasing those
abilities. Unfortunately, this often does not happen, and when students are grouped by ability,
the higher achieving students do well, and the rest fall further behind.
This graduate research looks at the impact of skill grouping at the university level.
Rather than separating students into different classes by ability, students were placed in
purposeful groups within the class. Overall both homogeneous and heterogeneous groupings
performed better than the control self-selected sections. One homogeneous quartile showed
significant improvement in performance compared to the heterogeneously grouped students, but
another homogeneous quartile showed a significant decline in scores. Gains in one subset of
student should not come as a detriment to another subset of students, so homogeneous grouping
is not recommended. Of the three grouping methods, only heterogeneous grouping showed
significant increases in scores without harm to other students, and for this reason, this study
recommends using a heterogeneous method of grouping students in future GEOL 103 classes.

iii
Table of Contents
List of Figures ..................................................................................................................... v
List of Tables ..................................................................................................................... vi
Acknowledgements .......................................................................................................... viii
CHAPTER 1 - Purpose ....................................................................................................... 1
Ability grouping methods ............................................................................................... 1
The question to be answered ........................................................................................... 1
CHAPTER 2 - Context ....................................................................................................... 3
History of ability grouping ............................................................................................. 3
Many approaches in grouping students .......................................................................... 4
Arguments for and against ability grouping ................................................................... 4
Homogenous grouping ................................................................................................ 4
Heterogeneous grouping ............................................................................................. 6
Studies show mixed results ............................................................................................. 7
Ethics of ability grouping ............................................................................................. 10
Literature review results ............................................................................................... 11
CHAPTER 3 - Study Population and Setting ................................................................... 13
Course description ........................................................................................................ 13
Student demographics ................................................................................................... 14
Setting ........................................................................................................................... 15
CHAPTER 4 - Methods .................................................................................................... 17
IRB approval ................................................................................................................. 17
Section selection ........................................................................................................... 17
Math Proficiency Basic Skills Test ............................................................................... 18
Student removal from study .......................................................................................... 19
MBST student scores .................................................................................................... 19
Establishing groups ....................................................................................................... 21
Method of instruction .................................................................................................... 22
Retrieval of course grades ............................................................................................. 22
Statistical methods ........................................................................................................ 22

iv
CHAPTER 5 - Results ...................................................................................................... 23
MBST scores ................................................................................................................. 23
Descriptive statistics ..................................................................................................... 23
Self-select sections .................................................................................................... 24
Heterogeneous sections ............................................................................................. 24
Homogeneous sections .............................................................................................. 24
Comparing group types and assessments ...................................................................... 28
Demographics ............................................................................................................... 31
MBST validation ........................................................................................................... 39
CHAPTER 6 - Implications .............................................................................................. 40
Ability grouping ............................................................................................................ 40
Homogeneous grouping ............................................................................................ 40
Self-select grouping .................................................................................................. 41
Heterogeneous grouping ........................................................................................... 41
Demographics ............................................................................................................... 41
Sources of data error ..................................................................................................... 42
Conclusions ................................................................................................................... 43
Questions for further study ........................................................................................... 43
References ......................................................................................................................... 45
Appendix A - Mathematics Proficiency Basic Skills Test ................................................ 48
v
List of Figures
Figure 4.1 MBST Frequency ............................................................................................ 21
Figure 5.1 Homogenous group average assessment scores .............................................. 25
Figure 5.2 Average scores across all ability groups ......................................................... 28
Figure 5.3 Course averages across all demographic groups ............................................. 38

vi
List of Tables
Table 3.1 Gender ............................................................................................................... 14
Table 3.2 Age .................................................................................................................... 14
Table 3.3 Ethnicity ............................................................................................................ 14
Table 3.4 Class year .......................................................................................................... 14
Table 3.5 Major ................................................................................................................. 15
Table 3.6 Mother’s education ........................................................................................... 15
Table 3.7 Father’s education ............................................................................................. 15
Table 4.1 Sections selected for study ................................................................................ 18
Table 4.2 Self-select sections ............................................................................................ 19
Table 4.3 Heterogeneous sections ..................................................................................... 20
Table 4.4 Homogeneous sections ..................................................................................... 20
Table 4.5 MBST score grouping ....................................................................................... 21
Table 5.1 Difference between section averages –MBST .................................................. 23
Table 5.2 Self-select descriptive statistics ........................................................................ 24
Table 5.3 Heterogeneous descriptive statistics ................................................................. 24
Table 5.4 Homogeneous (Total) descriptive statistics ...................................................... 25
Table 5.5 Homogeneous (Table A) descriptive statistics ................................................. 26
Table 5.6 Homogeneous (Table B) descriptive statistics .................................................. 26
Table 5.7 Homogeneous (Table C) descriptive statistics .................................................. 26
Table 5.8 Homogeneous (Table D) descriptive statistics ................................................. 27
Table 5.9 Scores across all ability groups ......................................................................... 27
Table 5.10 Statistical significance in average lab scores .................................................. 29
Table 5.11 Statistical significance in average quiz scores ................................................ 30
Table 5.12 Statistical significance in average exam scores .............................................. 30
Table 5.13 Statistical significance between class years .................................................... 31
Table 5.14 Statistical significance in student race ............................................................ 31
Table 5.15 Gender breakdown of grouping types ............................................................. 32
Table 5.16 Gender breakdown of grouping types by assessment category ...................... 32

vii
Table 5.17 t-test analysis: gender breakdown of grouping types by assessment .............. 33
Table 5.18 Class year breakdown of grouping types ........................................................ 33
Table 5.19 Class year breakdown of grouping types by assessment category ................. 34
Table 5.20 t-test analyses: class year breakdown of grouping types by assessment
(SS/HE) ..................................................................................................................... 35
Table 5.21 t-test analyses: class year breakdown of grouping types by assessment (HO) 36
Table 5.22 Course average: gender ................................................................................... 36
Table 5.23 Course average: age ........................................................................................ 36
Table 5.24 Course average: race ....................................................................................... 37
Table 5.25 Course average: class year .............................................................................. 37
Table 5.26 Course average: major .................................................................................... 37
Table 5.27 Course average: mother’s education ............................................................... 37
Table 5.28 Course average: father’s education ................................................................. 37
viii
Acknowledgements
I first want to thank the faculty, staff, and students of the Kansas State University
Geology Department for opening their arms upon my return to Kansas. Thompson Hall
will always feel like home to me.
Yoonsung Jung was a voice of calm reason in the midst of my number
nightmares. My appreciation goes to him for all the statistical help he provided.
I have been fortunate to be a part of the best group of GTAs the department has
had since my arrival in 2002. Chris Flenthrope, the best office mate a person could have,
and the rest of the gang (Darron DeBoer, Nick Patch, Amanda Cushman, Jeff Callicoat,
and Mazin Abbas) ~ thanks for the laughs and the camaraderie.
Dr. Lawrence Scharmann and Dr. Keith Miller were kind enough to agree to my
request to be on my committee. Their experience and patience have been very
appreciated. Dr. Iris Totten, my major professor, has given me just what I needed when
the time was right; both a kind ear and a timely swift kick in the rear. No graduate
student can succeed without the right person in his or her corner; I’m glad I had you in
mine.
Finally, I want to recognize the three people who keep me sane: Darrell, my
husband; Sam Wienke, my best friend; and Joni Gailey, my mother. This thesis would
not have been completed without your unending support.

1
CHAPTER 1 - Purpose
Classrooms are becoming increasingly diverse. Students have a broad range of goals,
backgrounds, abilities, and needs. It has always been difficult for teachers to meet those needs,
and increasing diversity and larger class sizes make the challenge even more difficult. In order
to meet that challenge, teachers are constantly looking for ways to better meet the educational
needs of their students. While ability grouping has been tried many times over the years, there
have been enough positive outcomes to keep trying. Combining ability grouping with small-
group instruction allows teachers to more specifically address the different issues their students
face.
Ability grouping methods There are two ways to group students by ability. Homogeneous grouping is defined as
dividing students into groups of similar ability, creating separate groups of high ability students
and low ability students. Heterogeneous grouping is defined as mixing high and low ability
students together. Students can either be grouped as an entire class, i.e. having all high ability
students in one classroom and low ability students in another, or by separating students within a
classroom into small ability groups. The latter is called within-class grouping and is the method
used in this study.
The question to be answered While thousands of studies have been done with ability grouping on elementary and
secondary students, few have researched the practice on college and university students. A
search on the Education Resources Information Center (ERIC) database found only 15 peer-
reviewed journal articles when prompted with “higher education” and “ability group” or “ability
grouping” as search words. Only two of those results were written about science students. One
studied misconceptions and put students into groups based on those they brought with them into
their first-year biology course. The other was a study on how bias affects ability tests used in
order to group students. Not a single article covered any of the specific topics found in this

2
graduate research. Broader database and internet searches found a similar lack of applicable
research.
Many hundreds of students enroll in GEOL 103 every semester as one of the very few
science classes they will take at the university level. With natural disasters and other geologic
issues such as global warming and limited petroleum resources in the news on a daily basis,
students will be dealing with concepts covered in the GEOL 103 course for the rest of their lives.
It is the goal of this course that students learn about geology in a manner that will enable them to
make informed decisions on where to locate a future business, on purchasing the materials they
use in homes they build, and on avoiding injury in the event of earthquake or volcanic eruption.
To reach this goal, it is important to maximize student learning. This study focuses on
the following: does ability grouping, organizing classrooms to combine those of similar ability,
have an impact on student performance in the GEOL 103 labs?
3
CHAPTER 2 - Context
History of ability grouping The practice of ability grouping is thought to have started in 1867 when W. T. Harris
began to separate out the brightest of his students, more quickly promoting them through
elementary school. Soon after, in what is known as the Santa Barbara Concentric Plan,
elementary schools began to separate each grade into A, B, and C sections. The A section’s
work was more extensive than the B section, the B section’s work more extensive than the C
section (Kulik and Kulik, 1982). Thousands of studies on ability grouping have been done since,
with a wide variety of results, and it is considered to be one of the most controversial issues in
education (Slavin, 1990). In each of the following studies, the control group was a comparable
non-grouped classroom(s).
The first serious research on homogenous grouping was done in 1916. Guy M. Whipple
studied a class of 13 boys and 17 girls, chosen by their late elementary school teachers to
participate in the first ‘gifted’ program. Whipple created special classes for these students and
compared their performance with students in ‘extra-dull’ classes (Kulik and Kulik, 1982).
In Salt Lake City, Utah, in 1927, researchers identified and preassessed two equivalent
groups of elementary students. Students in one group were separated by ability and placed into
homogeneous classes while students in the other group were assigned to mixed-ability classes.
Students were tested again at the end of the school year and those in the homogeneous group
scored approximately two grade equivalents higher in mathematics than did similar-ability
students in the heterogeneous class (Tieso, 2003).
By the late 1950s and 1960s, teachers would divide a class into ability-based reading
groups and sometimes ability-based groups for mathematic instruction (Petty, 1954). In the
1970s and 1980s, teachers emphasized cooperative learning and often would divide students into
heterogeneous groups (Lou et al, 1996). Studies during that time found that students performed
better in the cooperative learning groups because others depended on their input; the group could
not succeed without each student completing his or her task (Abrami et al, 1995).
Values have changed over time; during the 1950s, “excellence” was an education
buzzword, and ability grouping within-class was viewed as beneficial for high ability students.
4
By the 1960s and 70s, equal opportunity was seen as more important than “excellence” for the
few. Between-class grouping (separate classes based on ability) raised concerns for lower
ability, disadvantaged students (Good and Marshall, 1984; Kulik and Kulik, 1987) with this sub-
group separated from higher achieving students and therefore not benefiting from the
collaborative exposure. Both of these concerns are still valid today.
Many approaches in grouping students Grouping for instruction can be made in a variety of ways. Teachers can assign students
to groups, students can self-select their own groups, or groups can be established randomly.
Grouping is, of course, not always based on student ability. Groups can be formed on student
interests, common skills, or preexisting friendships. Conversely, groups can be formed
specifically for diversity, with students of varying interests, skills, and friendships (Lou et al,
1996). Teachers must consider many factors when assigning students to instructional groups;
clearly individual students’ needs and developmental level are the most important (Wilkinson,
1986). Adapting curriculum materials to the needs and abilities of students in the groups is
essential, otherwise it is pointless to group them at all (Kulik and Kulik, 1987).
Arguments for and against ability grouping The arguments for and against ability grouping are as vast as the number of researchers
who have studied it:
Homogenous grouping
Homogenous grouping takes individual differences into account by allowing students to
advance at their own rate with others of similar ability, and by offering them methods and
materials geared to their level. More individual attention from teachers is possible. Students are
challenged to do their best in their group, or to be promoted to the next level, within a realistic
range of competition. It is easier to teach and provide materials for a narrower range of ability
(Esposito, 1973).
Students attempt to keep pace with others in the group, especially if they have formed
friendships as a result of the grouping. When groups are established on the basis of diverse
interests, learning may be enhanced due to multiple perspectives (Lou et al, 1996). Medium and

5
high achieving students especially benefit as they are not required to slow their own pace of
learning for lower achieving students (Mullen and Copper, 1994). Gifted students’ feelings of
superiority are tempered when in groups with others equally capable or even more
knowledgeable about given topics than they are (Fiedler, Lange and Winebrenner, 2002).
Homogenous grouping allows the teacher to increase the pace of content instruction to
the higher achieving students and give more repetition, review, and individualized attention to
the lower achieving students. Also, because the students in each homogenous grouping are well
matched in academic ability, they are more likely to engage in peer helping, debating, discussing
content, and discovering solutions on their own (Lou et al, 1996). This social aspect in cognitive
growth emphasizes higher order thinking skills (Piaget, 1954; Vygotsky, 1978). By working
together, students learn to cooperate instead of compete, an aspect of learning that many students
prefer. And in working closely with other students, they develop social and communication
skills that may have otherwise not developed in the classroom (Lou et al, 1996).
Saleh, et al. (2005), studied 104 fourth graders in a Kuwait elementary school and found
that middle and high ability students were found to have better outcomes in homogenously
grouped classrooms. Homogeneous grouping resulted in more collaboration and motivation for
the middle and high ability students. Low ability students in homogeneous groups had increased
student-teacher dialog, asking eight times as many questions as average ability students, but no
significant increase in performance. Teachers were able to spend more time with the low ability
students, as the average and high ability groups worked well independently.
However, it is impossible to achieve truly homogenous grouping, even along a single
achievement variable, since test data are not generally reliable or valid enough for this type of
distinction. Homogeneous grouping may provide less sensitivity to individual differences in
children by giving the teacher the false sense that students are similar in social needs,
achievement, and learning style. It tends to segregate children along ethnic and socioeconomic
lines as well as ability. Homogeneous grouping affects the self-concept of all children adversely
by placing a stigma on those in lower groups while giving high-group children an inflated sense
of their own worth. (Esposito, 1973). Teachers must decide on what basis to form the
homogeneous groups; academic factors are not always the most important, as developmental
levels heavily influence learning as well (Wilkinson, 1986).

6
Additionally, if groups are maintained too long, students can miss out on opportunities to
learn from others with different skills and talents and some groups will more quickly learn how
to accomplish the tasks than others (Lou et al, 1996). Adjustments must be made as the students
in homogenous groups learn at different rates. Groups need to be reformed often to
accommodate the changes in individual student achievement (Ireson, Clark and Hallam, 2002b)
Heterogeneous grouping
Most adult life experiences do not occur in homogeneous settings, and students must
learn to work with a wide range of people (Esposito, 1973). Heterogeneous groups may foster
learning through the use of more elaborate explanations, as the teacher attempts to cover material
in more than one way. The more advanced students gain teaching experience themselves by
helping the lower ability students understand the material. Mixing students from various ability
groups, groups they have likely been placed in for years, may better integrate students from all
social circles, may avoid outcast situations, and may teach students tolerance and acceptance of
all of their peers (Lou et al, 1996).
Burris et al. (2006), worked with 985 middle school students where mathematics
instruction was accelerated using heterogeneous ability grouping. Their results showed that the
probability of completion of advanced math courses increased significantly in all groups,
including minority students, students of low socioeconomic status, and students in all initial
achievement levels. Additionally, the performance of initially high achievers did not differ
significantly in heterogeneous classes relative to previous homogeneous grouping, and rates of
participating in advanced placement calculus and test scores improved.
Another Burris study (Burris et al, 2008) examined the long-term effects on the
achievement of students in a diverse suburban high school on Long Island, New York, after all
students were given accelerated mathematics in a heterogeneously grouped middle school.
Struggling learners were supported with after-school workshops four days a week. Teachers
stressed high expectations for all students, with a focus towards supplying enriched resources
and curriculum. Science scores showed improvements as well, and the district decided to move
all subjects to heterogeneous groupings. As a result, there was a 70% increase in the number of
students earning an International Baccalaureate diploma, with a three-fold increase for White and

7
Asian students and a 26-fold increase for low socioeconomic minorities. Average scores
remained high, even as the enrollment in International Baccalaureate classes increased.
There are drawbacks to heterogeneous groupings as well. Group members often turn to
the most able student in the group for help. When this occurs, little interaction and engagement
with the material can lead to students getting answers right and yet not understanding the
concepts taught (Noddings, 1989). If the nature of the assessment is completely lower-level
thinking skills, lower achieving students may miss out on learning entirely. However, if higher-
level thinking skills are needed to answer the question, those students might still learn from the
most able student as the thought process is more involved and students need to work harder to
understand the explanation (Webb, 1989).
Another unintended result of heterogeneous grouping is an increase in highly gifted
students’ feelings of superiority (Fiedler, Lange and Winebrenner, 2002). These students,
repeatedly getting the answers right and being able to offer complex ideas far ahead of other
students in class discussions, often become arrogant. Without being challenged by intellectual
peers, the possibility that they will develop an elitist attitude would increase.
Studies show mixed results One school district in Scotland allowed secondary schools to decide for themselves how
to group classes in the English department (Boyd, 2007). One school retained the current
heterogeneous grouping, three grouped the students homogeneously, and one maintained
heterogeneous grouping but reduced class sizes. The teachers in the new higher level
homogeneous classes were able to study more intensive works at a higher conceptual level and
reported the new students as ‘a joy to teach.’ The teachers of the lower ability classrooms
reported a slower pace of learning, poor student motivation , and more discipline problems. The
school that remained heterogeneous showed good progress of all students, as did the school that
reduced the size of their heterogeneous classrooms. In addition, the teachers of the reduced size
classes reported higher student motivation and achievement and lower discipline referrals. The
school district chose to return all schools to the heterogeneous grouping method with an effort to
reduce class sizes when possible.
8
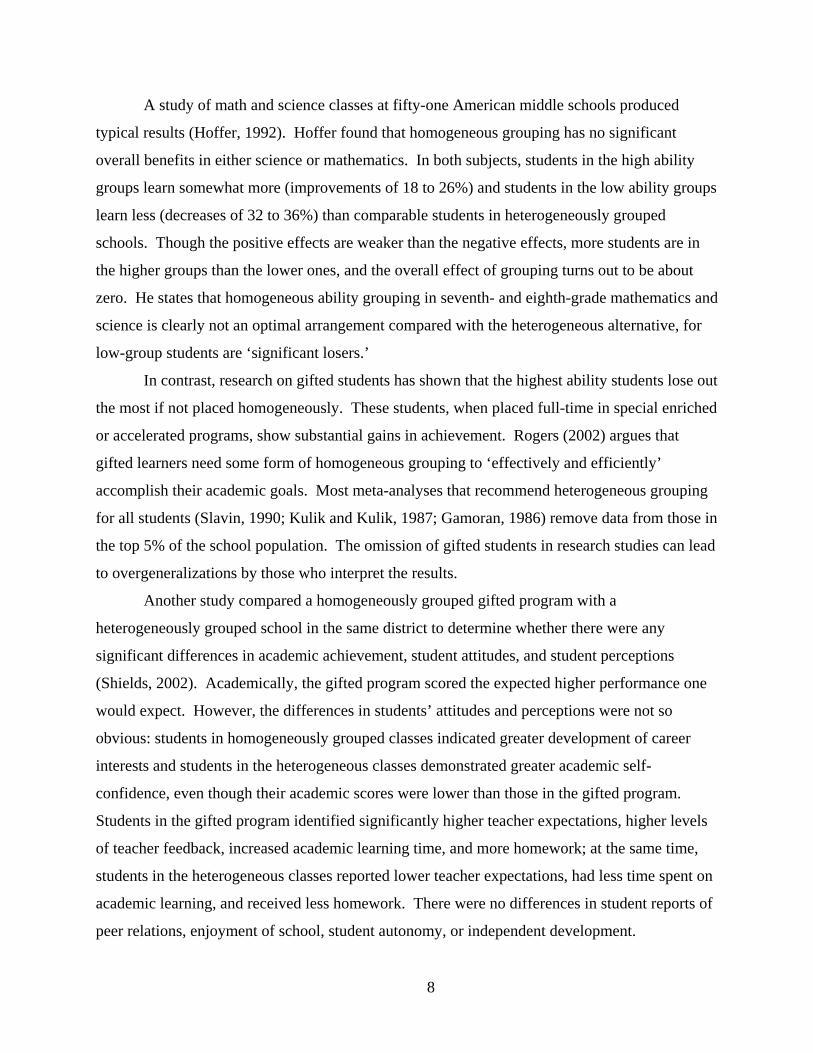
A study of math and science classes at fifty-one American middle schools produced
typical results (Hoffer, 1992). Hoffer found that homogeneous grouping has no significant
overall benefits in either science or mathematics. In both subjects, students in the high ability
groups learn somewhat more (improvements of 18 to 26%) and students in the low ability groups
learn less (decreases of 32 to 36%) than comparable students in heterogeneously grouped
schools. Though the positive effects are weaker than the negative effects, more students are in
the higher groups than the lower ones, and the overall effect of grouping turns out to be about
zero. He states that homogeneous ability grouping in seventh- and eighth-grade mathematics and
science is clearly not an optimal arrangement compared with the heterogeneous alternative, for
low-group students are ‘significant losers.’
In contrast, research on gifted students has shown that the highest ability students lose out
the most if not placed homogeneously. These students, when placed full-time in special enriched
or accelerated programs, show substantial gains in achievement. Rogers (2002) argues that
gifted learners need some form of homogeneous grouping to ‘effectively and efficiently’
accomplish their academic goals. Most meta-analyses that recommend heterogeneous grouping
for all students (Slavin, 1990; Kulik and Kulik, 1987; Gamoran, 1986) remove data from those in
the top 5% of the school population. The omission of gifted students in research studies can lead
to overgeneralizations by those who interpret the results.
Another study compared a homogeneously grouped gifted program with a
heterogeneously grouped school in the same district to determine whether there were any
significant differences in academic achievement, student attitudes, and student perceptions
(Shields, 2002). Academically, the gifted program scored the expected higher performance one
would expect. However, the differences in students’ attitudes and perceptions were not so
obvious: students in homogeneously grouped classes indicated greater development of career
interests and students in the heterogeneous classes demonstrated greater academic self-
confidence, even though their academic scores were lower than those in the gifted program.
Students in the gifted program identified significantly higher teacher expectations, higher levels
of teacher feedback, increased academic learning time, and more homework; at the same time,
students in the heterogeneous classes reported lower teacher expectations, had less time spent on
academic learning, and received less homework. There were no differences in student reports of
peer relations, enjoyment of school, student autonomy, or independent development.

9
Wiliam and Bartholomew (2003) followed a cohort of 709 students over four years in six
secondary schools in England. The students were grouped homogeneously in four divisions.
The highest group scored half a grade higher on their end of year test than similarly able students
had in the past. In addition, the lowest group scored half a grade lower on the test than expected.
The groups in the middle showed minor improvements in scores. However, the researchers
found that the teachers teaching the bottom group were the least qualified to teach and had lower
expectations of their students, frequently gave their students undemanding lower-skill work, and
used a narrower range of teaching approaches. Teachers in the highest group, while very
qualified, often set the bar too high and students had difficulty keeping up. The same teachers of
both grouping methods, when teaching heterogeneous classes, used a wider range of approaches
and took greater account of individual differences.
A study by Ireson, et al. (2002a) interviewed teachers in 45 British high schools. Within
all subjects grouped homogeneously, teachers reported a tendency for lower ability classes to
have less access to the curriculum and to be taught in more structures ways, with more repetition
and less discussion. In heterogeneous classes, teachers provided a greater variety of activities
and more differentiated work. Teachers considered mathematics to be the least suitable subject
for heterogeneous grouping. The humanities were considered the most suitable. Student
performance in this study mirrored teacher beliefs, as only higher-level mathematics students
showed gains in learning when grouped homogeneously. No academic gains were found in
homogeneously grouped English or science classes when compared to heterogeneously grouped
classes. The study found that the expectations of the teachers were influenced by the type of
ability grouping in their classrooms and the performance of the students resulted directly from
those expectations.
When secondary student preferences are studied, researchers found that the majority
would choose to be grouped homogeneously (Hallam and Ireson, 2006). Sixty-percent of
students in 45 high schools in Britain expressed a preference for homogeneous grouping. Even
students currently enrolled in heterogeneously grouped schools showed a majority preference for
homogeneously grouped classrooms. Students want the ability to choose classes at different
levels for different subjects; results showed a desire to take lower level classes in subjects
students did not feel confident in, yet also be able to take higher level classes in subjects they

10
enjoyed. Forty-seven percent of students chose homogeneous groupings in order to take classes
with others at the same ability and be pushed further academically.
Student preferences are based on self-esteem and self-respect as much as academic
achievement. One recommendation on how to fill classrooms is to allow students to choose their
own grouping method. This would allow those typically under-represented in higher level
homogeneous groupings the chance to see if they could succeed in such a classroom. Terwell
(2005) argues that institutional barriers, feelings of inadequacy, and the wish not to leave the
‘safe places’ in lower ability groups may lead such students to avoid higher level classes even if
given the choice. It is his opinion that schools should move away from offering homogeneous
groupings entirely.
Ethics of ability grouping There is a concern that it is unethical to stigmatize lower-ability students by using ability
grouping due to the fear that lower-ability students will be denied opportunities to learn and will
be unmotivated to learn because of lower performance expectations by their teacher, their peers,
and themselves (Oakes, 2005; Allan, 1991). Additionally, grouping by ability may actually
serve to increase the already present divisions along racial, ethnic, and class lines (Rosenbaum,
1976).
It is also unethical to hinder the achievement of higher-ability students by assigning them
to heterogeneous groups due to the likelihood that they will have already mastered the material
given to them and because the pace of learning is below their capability; they are placed in the
group not to learn themselves, but to teach others in the group (Oakes, 2005; Allan, 1991).
Gifted students have just as much right to be challenged academically as other students.
Including them in heterogeneous groupings to act as tutors for the other students is impeding
their own right to a rigorous education (Fiedler, Lange and Winebrenner, 2002).
Hanushek and oßmann (2006) studied students in 4th and 8th grade across 26 countries
and found that early homogeneous grouping increases educational inequality. Their research
found that some countries based their grouping on family background, further solidifying the
cycle of poverty and underachievement. Not a single case found overall improvement in scores;
both high and low achievers had negative effects when students are placed in ability groups in

11
early elementary classes. In fact, initially low achieving students lost even more ground in
achievement than high achieving students. Obviously, this is a strong ethical case against ability
grouping.
A National Science Foundation study in 1986 (Oakes, 1990) found that schools most
often place their least qualified mathematics teachers in low ability classes and their most
qualified teachers in high ability classes, especially at the secondary level. The study also found
that teachers of higher level courses spent more time preparing for class and appeared to be more
enthusiastic and more willing to push their students to stretch academically than teachers of
lower ability students. In heterogeneously grouped classrooms, lower ability students received
less teacher time and were asked a fewer number of process-oriented questions. All of these
results leads to larger gaps in learning, to the severe detriment of the lower ability students.
Literature review results The results of these thousands of studies are varied but there is a general consensus that
higher ability students generally excel in homogeneous groupings and lower ability students
generally do poorly in homogeneous groupings unless the quality of the instruction is a main
focus (Kulik and Kulik, 1982; Slavin, 1990; Gamoran, 1986; Gamoran, 1992). Mid-level
students also show higher achievement in homogeneous groupings. Lower ability students
placed in smaller homogenous groups have shown significant gains, but still perform better when
grouped heterogeneously. On average, homogeneous grouping is superior to heterogeneous
grouping in small group instruction, but no one method of grouping was uniformly superior for
promoting the advancement of learning for all students (Lou et al, 1996).
Small group instruction, regardless of type of instruction, results in across-the-board
increases in student positive attitude, achievement, and self-concept compared to classes without
grouping (Lou et al, 1996). Students learn interdependence, how to contribute to an overall
group goal, and receive some sort of group reward. Differentiated instruction, teaching
specifically towards the needs of each individual small group, brings the greatest gains in
learning and achievement (Kulik and Kulik, 1987). Several studies of mathematics instruction
have shown that homogeneous regrouping, formerly heterogeneous classes regrouped into
homogeneous classes based on mathematics and reading achievement scores, had positive effects
on mathematics achievement when materials appropriate for the students’ level of performance

12
were used (Davenport, 1993). However, this is difficult on a long-term scale because it is
expensive, time consuming, and requires much more training for teachers (Lou et al, 1996).
This graduate research differs from most of those in the literature, in that the instruction
is consistent across all sections of the course, regardless of the grouping in each individual
section. The sections are initially heterogeneous, as they’re filled by the students as they enroll
for the semester without any consideration for ability, and the groupings are done within-class
rather than between-class. A few studies have covered this method, and have found that students
assigned to groups within a heterogeneous classroom have found that such grouping clearly
benefitted the students (Allan, 1991).

13
CHAPTER 3 - Study Population and Setting
Kansas State University was founded as a private college in 1858 and became the United
States’ first land-grant school during the Civil War in 1863. It is now a large public research
university with an enrollment of around 23,500. K-State has 60 academic departments in nine
colleges, with over 250 undergraduate majors and degrees (Kansas State University, 2008).
Undergraduates are primarily Arts and Science majors (34.2%), Engineering majors (15.6%),
Business majors (13.5%), Agriculture majors (10.4%), or Education majors (7.7%). The
Colleges of Architecture, Human Ecology, Technology and Aviation, and Veterinary Medicine
make up the rest of the university’s undergraduate enrollment. The graduate school offers
approximately 100 degree programs. Overall, 53% of K-State students are male; 47% are female
(Kansas State University Registrar's Office, 2009).
Students at K-State are predominantly Caucasian (81.3%), with small minorities of
African American (3.5%), Hispanic American (3.2%), Asian American (1.4%), Native American
(0.7%), multi-ethnic American (0.7%), and international (6.1%) students (Kansas State
University Registrar's Office, 2009).
Course description The undergraduate geology laboratory course, GEOL 103, is taken by a wide variety of
students. It is a required course for many different majors. Enrollment priority at K-State is
based on seniority; because of this, there are more upperclassmen then one would expect in a 100
level course. Enrollment is limited to 24 students per section. The course is classified as an
Undergraduate General Education course and is one of only two stand-alone science laboratories
offered. Because of these two reasons, hundreds of students enroll in the course to meet the
science requirements for their degree. For most students, this one of the few science courses
they will take at the university level; it is critical that the course is taught well.
GEOL 103 is a required course for geology majors; however, there were no geology
majors involved in this study.

14
Student demographics Data for this study were collected during the Spring 2008 semester. A total of 214
students were initially involved in the research. Data was collected using the 8 demographic
items on the MBST. The demographics for the 200 students that remained in the study for the
entire semester are as follows (totals vary due to non-responses):
Table 3.1 Gender
Male n=64 34.6%Female n=121 65.4%
Table 3.2 Age
18-21 years n=148 80.4%22-26 years n=27 14.7%27-22 years n=4 2.2%34-40 years n=27 14.7%>40 years n=3 1.6%
Table 3.3 Ethnicity
Caucasian n=156 85.7%Multi-ethnic n=15 8.2%African-American n=4 2.2%Hispanic n=3 1.6%Asian n=1 0.5%Other n=3 1.6%
Table 3.4 Class year
Freshman n=44 23.9%Sophomore n=75 40.8%Junior n=41 22.3%Senior n=24 13.0%

15
Table 3.5 Major
Arts, Humanities, Social Sciences n=79 42.9%Education n=48 26.1%Business Administration n=41 22.3%Science/Math n=11 6.0%Engineering n=5 2.7%
Table 3.6 Mother’s education
Did not graduate high school n=3 1.6%Graduated high school n=41 22.3%Attended some college or vocational school n=59 32.1%Has a bachelors degree n=50 27.2%Attended college beyond a bacherlors level n=31 16.8%
Table 3.7 Father’s education
Did not graduate high school n=3 1.7%Graduated high school n=30 16.6%Attended some college or vocational school n=57 31.5%Has a bachelors degree n=48 26.5%Attended college beyond a bacherlors level n=43 23.8%
Setting There were 15 sections of GEOL 103 in the Spring 2008 semester. The course is taught
by Graduate Teaching Assistants (GTAs). Each GTA is assigned to teach three sections of the
course that work the best with his or her class schedule. There were a total of five GTAs
teaching the course; three participated in this study.
The laboratory has four large student tables in the center of the room with six chairs per
table. There are more tables around the outside of the room, with a large teacher’s table at the
front near the chalkboard and projector screen. Each table holds a group of six students that
generally work together to complete assigned work. The optimal size for group learning is three
to four students; groups larger than six do not show significant improvement over non-grouped
classrooms (Kulik and Kulik, 1987).
The course includes a series of laboratories designed to teach students about the basic
principles of physical geology, including plate tectonics, minerals, rocks, fossils, weathering and

16
erosion, geologic time, geologic structures, topographic and geologic maps, volcanoes,
earthquakes, and petroleum geology. Course assessment includes individually-completed
quizzes given at the start of class based on material the students were to have read for that day’s
class, labs that are handed in separately but worked on as a group, and two individually-taken
exams. Success in the course is based on student performance on the labs (11), quizzes (10), and
two exams (midterm and final). Student final grades are the summation of all of these
assessments.

17
CHAPTER 4 - Methods
Students were administered a basic math skills test during the second week of class, after
most enrollment issues were settled. Students were assigned to groups based on their scores on
the math instrument. Within and between each type of grouping (homogeneous, heterogeneous,
and self-select), individual grades throughout the semester (quizzes and exams) were compared
to group grades (laboratory assignments) to determine the effect that grouping had on their
learning.
IRB approval In accordance with K-State regulations, an application for approval to conduct research
on human subjects was submitted at the start of the study semester, Spring 2008. Students read
and signed consent forms agreeing to participate in the research. All students were over 18 years
of age, so no parental permissions were required. The IRB Committee granted an exemption and
approved the project (IRB# 4555).
Section selection Three of the five GEOL 103 GTAs were selected to participate in the study. GTAs were
chosen based on their interest and willingness to participate in the project. Each GTA taught
three sections, assigned to accommodate their own class and research schedule. Two, both male,
were experienced (GTAs 1 and 2) and the third was teaching her first semester (GTA 3). Each
GTA taught sections that used each of the three grouping types. The nine sections were scattered
throughout the week (Table 4.1).

18
Table 4.1 Sections selected for study
Section GTA Type Day Time1 1 SS Mon AM2 1 HO Mon noon3 2 SS Tues AM4 3 HO Tues PM5 1 HE Wed noon6 2 HO Wed PM7 2 HE Thurs AM8 3 HE Fri AM9 3 SS Fri noon
Math Proficiency Basic Skills Test The GTAs distributed a Mathematics Proficiency Basic Skills Test (MBST, Appendix A)
in class to all of their students at the beginning of the semester. The instrument was co-created
by Dr. Iris Totten and the Office of Education, Innovation and Evaluation at K-State. It includes
three sections: 1) 29 multiple choice mathematic calculations, 2) 23 five-point Likert-scale self-
efficacy questions, and 3) 8 personal background/demographic items. Students recorded their
responses on scantron forms and returned it to the GTAs. The data were then entered into an
Excel spreadsheet for analysis. Student responses to the 23 five-point Likert-scale self-efficacy
questions were not examined in the study.
Previous studies have linked math skills and ability in science (Benbow and Minor, 1986;
Britton et al, 2005). Benbow and Minor found that high school students who were
mathematically talented tend to have favorable attitudes towards science and have higher
achievement than those not as strong in math skills. Britton et al. studied the ability of first year
university students to transfer their understanding of mathematics concepts into scientific
contexts: “confirming the obvious prediction that students who score well in mathematics would
tend to score better in science.”
The MBST itself was composed of 29 questions. Questions 1 through 4 required students
to identify the numeric position of a point along a number line. Questions 5 through 7 consisted
of addition problems, with nine or ten 2- to 4-digit numbers lined up appropriately in a column.
Questions 8 through 14 tested students understanding of simple fractions, both in the abstract
(numerator and denominator definitions) and in practice (dividing one number by another).

19
Questions 15 through 19 required students to calculate the mean (average) of a set of numbers.
Questions 20 through 25 asked about concepts of powers, including what the exponent is called
and basic computations on the powers of 0, 1, 2, 3, and 4. The last four questions, 25 through
29, required students to calculate the numerical equivalence for base-10 logarithms.
Student removal from study A total of 214 students completed the consent form and MBST. Fourteen students were
removed from the study for the following reasons: nine students dropped the course in the first
month, one student missed the midterm exam, and four students did not take the final exam.
These students did not have the full set of course grades necessary to be included in the study.
The first nine stayed in the class only through the first few labs and the last five missed one of
the two exams. Because of the small number of exams, the score of only one exam reports their
understanding of only half of the course.
MBST student scores The following tables show student scores on the MBST for each section. Figure 4.1
illustrates student scores on the assessment.
Table 4.2 Self-select sections
Section1 2 3 4 5 6 7 8 9 10 11
96.55 96.55 93.10 93.10 89.66 86.21 82.76 82.76 82.76 79.31 79.3112 13 14 15 16 17 18 19 20 21 22
75.86 75.86 75.86 72.41 72.41 68.97 68.97 65.52 65.52 58.62 48.281 2 3 4 5 6 7 8 9 10 11
96.55 86.21 82.76 82.76 82.76 82.76 79.31 79.31 79.31 79.31 75.8612 13 14 15 16 17 18 19 20 21 22
75.86 75.86 75.86 68.97 62.07 55.17 48.28 31.03 27.59 NA NA1 2 3 4 5 6 7 8 9 10 11
100.00 100.00 100.00 96.55 96.55 93.10 93.10 89.66 86.21 86.21 86.2112 13 14 15 16 17 18 19 20 21 22
82.76 82.76 79.31 79.31 79.31 75.86 72.41 72.41 68.97 65.52 44.83
9
Scores, in order from highest to lowest
1
3

20
Table 4.3 Heterogeneous sections
Section1 2 3 4 5 6 7 8 9 10 11 12
96.55 89.66 89.66 86.21 86.21 86.21 82.76 82.76 82.76 82.76 82.76 82.7613 14 15 16 17 18 19 20 21 22 23 24
79.31 79.31 79.31 75.86 75.86 72.41 68.97 65.52 65.52 58.62 58.62 55.171 2 3 4 5 6 7 8 9 10 11 12
100.00 96.55 96.55 96.55 86.21 82.76 82.76 82.76 82.76 82.76 82.76 82.7613 14 15 16 17 18 19 20 21 22 23 24
79.31 75.86 75.86 68.97 65.52 62.07 55.17 44.83 27.59 NA NA NA1 2 3 4 5 6 7 8 9 10 11 12
100.00 100.00 89.66 89.66 86.21 86.21 86.21 82.76 82.76 82.76 82.76 82.7613 14 15 16 17 18 19 20 21 22 23 24
79.31 75.86 75.86 72.41 68.97 65.52 65.52 65.52 62.07 51.72 NA NA
5
7
8
Scores, in order from highest to lowest
Table 4.4 Homogeneous sections
Section1 2 3 4 5 6 7 8 9 10 11 12
100.00 100.00 100.00 86.21 86.21 82.76 82.76 82.76 79.31 75.86 75.86 72.4113 14 15 16 17 18 19 20 21 22 23 24
68.97 68.97 68.97 58.62 48.28 62.07 58.62 55.17 48.28 NA NA NA1 2 3 4 5 6 7 8 9 10 11 12
96.55 96.55 89.66 89.66 86.21 86.21 93.10 82.76 79.31 79.31 79.31 75.8613 14 15 16 17 18 19 20 21 22 23 24 25
75.86 72.41 72.41 72.41 65.52 65.52 65.52 58.62 58.62 58.62 48.28 48.28 44.831 2 3 4 5 6 7 8 9 10 11 12
96.55 96.55 96.55 96.55 96.55 93.10 93.10 89.66 89.66 89.66 86.21 86.2113 14 15 16 17 18 19 20 21 22 23 24
86.21 86.21 82.76 82.76 82.76 79.31 65.52 62.07 58.62 58.62 44.83 NA
2
4
6
Scores, in order from highest to lowest

21
Figure 4.1 MBST Frequency
0
5
10
15
20
25
30
35
40
20 30 40 50 60 70 80 90 100
Freq
uency o
f score
MBST score
Establishing groups Student scores on the MBST were listed in order from highest (#1) to lowest (#24);
homogeneous and heterogeneous groups were established as shown in Table 4.5. Students in
self-select sections chose their own seats. The average score on the MBST was 77.41%. 67% of
the sample scored above a 75%. Only 13 students (6.5%) scored below 50%. Nine students
(4.5%) scored 100%.
Table 4.5 MBST score grouping
Table A Table B Table C Table D1, 2, 3, 4, 5, 6 7, 8, 9, 10, 11, 12 13, 14, 15, 16, 17, 18 19, 20, 21, 22, 23, 24
Table A Table B Table C Table D1, 24, 5, 20, 9, 16 2, 23, 6, 19, 10, 15 3, 22, 7, 18, 11, 14 4, 21, 8, 17, 12, 13
Homogenous
Heterogeneous
Each GTA had one section grouped homogeneously, one grouped heterogeneously, and
one self-selected (Table 4.1). Students who did not agree to participate (i.e. did not sign the
consent form) were seated apart from the other students to avoid contaminating the results of the
study. The GTAs ensured that these groups were maintained through the semester.

22
Method of instruction This research does not study variations in the method of instruction. All three groupings,
homogeneous, heterogeneous, and self-select, were taught the same way. The GTAs did not
know how each section was grouped. The groupings were established specifically to control for
teaching and grading variation by assigning every GTA one of each of the three types of groups:
homogeneous, heterogeneous, and self-select.
Retrieval of course grades The GEOL 103 course grades are maintained on the K-State Online website. At the end
of the semester, all quiz, lab, and exam grades were downloaded from the website and saved to
Excel. The results from the MBST were added to the spreadsheet. Once student grades and
MBST results were correlated, student numbers replaced names to create complete anonymity
for the participants.
Statistical methods Mean, median, mode, and standard deviation were calculated using Microsoft Excel.
Comparative statistical analyses were completed using SPSS with the help of Yoonsung Jung, a
doctoral candidate in the K-State Statistics Department. Further t-test calculations were
completed in Microsoft Excel. ANOVA and t-test (Least Squares Difference) analyses were
used to find p-values to the 95% confidence level. At a 95% confidence level, the p-value equals
0.05. Anything that is below this value is considered significant. For the purposes of this
graduate research, a 1-tail, type 2 t-test was used.
The SPSS Generalized Linear Model (GLM) procedure used the method of least squares
to determine if there was a statistical difference between the nine GEOL 103 sections.
23
CHAPTER 5 - Results
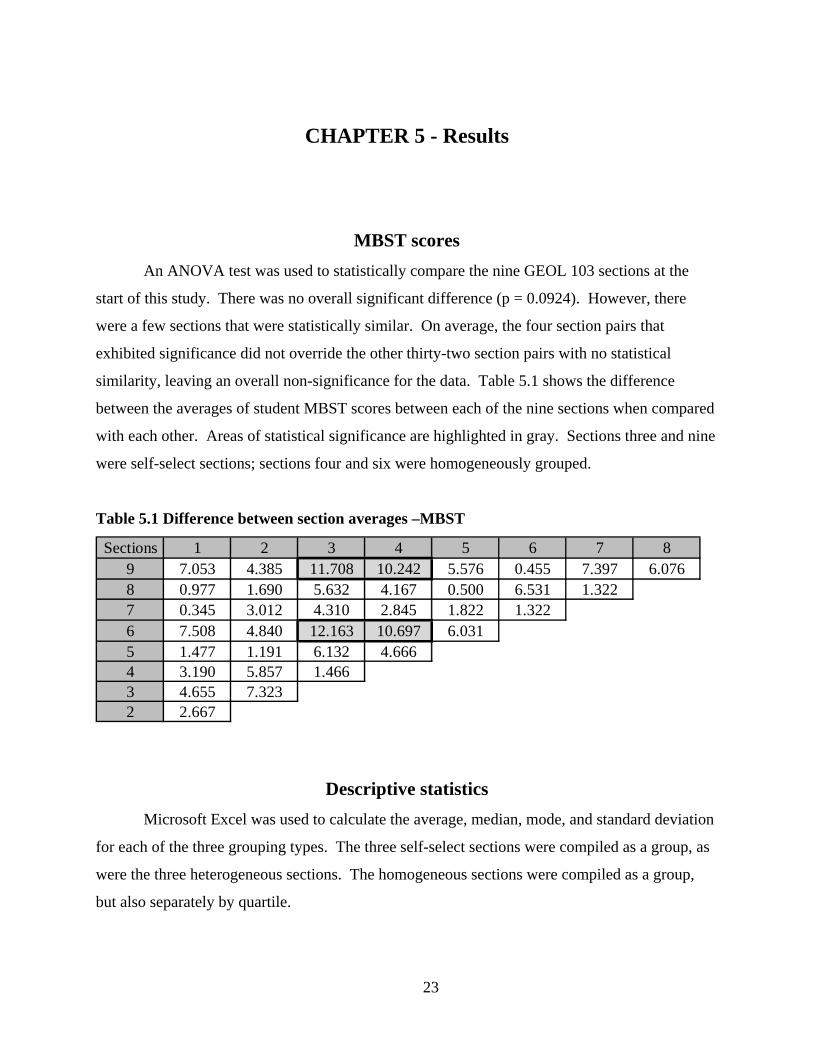
MBST scores An ANOVA test was used to statistically compare the nine GEOL 103 sections at the
start of this study. There was no overall significant difference (p = 0.0924). However, there
were a few sections that were statistically similar. On average, the four section pairs that
exhibited significance did not override the other thirty-two section pairs with no statistical
similarity, leaving an overall non-significance for the data. Table 5.1 shows the difference
between the averages of student MBST scores between each of the nine sections when compared
with each other. Areas of statistical significance are highlighted in gray. Sections three and nine
were self-select sections; sections four and six were homogeneously grouped.
Table 5.1 Difference between section averages –MBST
Sections 1 2 3 4 5 6 7 89 7.053 4.385 11.708 10.242 5.576 0.455 7.397 6.0768 0.977 1.690 5.632 4.167 0.500 6.531 1.3227 0.345 3.012 4.310 2.845 1.822 1.3226 7.508 4.840 12.163 10.697 6.0315 1.477 1.191 6.132 4.6664 3.190 5.857 1.4663 4.655 7.3232 2.667
Descriptive statistics Microsoft Excel was used to calculate the average, median, mode, and standard deviation
for each of the three grouping types. The three self-select sections were compiled as a group, as
were the three heterogeneous sections. The homogeneous sections were compiled as a group,
but also separately by quartile.

24
Self-select sections
Self-selected (SS) section statistics (n= 64) were compiled as a group (Table 5.2). The
self-select sections did not score the highest average, median, or mode on any of the assessments
compared to the other grouping methods.
Table 5.2 Self-select descriptive statistics
MBST Lab Quiz Exam TotalAverage 76.72 91.53 84.60 82.60 86.81Median 79.31 93.18 86.67 84.63 87.70Mode 82.76 93.18 92.22 85.00 94.31
St. Dev. 15.19 5.33 10.07 9.08 5.94
Heterogeneous sections
Heterogeneous (HE) section statistics (n= 67) were also compiled as a group (Table 5.3).
The heterogeneous sections did not score the highest average, median, or mode on any of the
assessments compared to the other grouping methods.
Table 5.3 Heterogeneous descriptive statistics
MBST Lab Quiz Exam TotalAverage 76.97 94.14 81.34 83.16 87.18Median 81.03 83.50 95.23 87.78 88.24Mode 82.76 95.23 94.44 85.00 94.71
St. Dev. 13.73 10.89 4.14 12.88 6.77
Homogeneous sections
Table 5.4 shows homogeneous (HO) sections (n=69) data when compiled as a group.
The homogeneous sections compiled as one group scored the highest median and mode on lab
scores, the highest average and mode on quiz scores, the highest average and mode on exam
scores, and the highest average and median on total course scores when compared to the
heterogeneous and self-select sections.

25
Table 5.4 Homogeneous (Total) descriptive statistics
MBST Lab Quiz Exam TotalAverage 78.16 93.01 84.86 83.71 87.93Median 82.76 95.68 88.89 86.00 90.20Mode 86.21 96.14 100.00 93.50 93.63
St. Dev. 14.93 7.77 12.29 10.02 7.72
However, the students in these sections were grouped so that each table held a specific
quartile of the class. Therefore, Table A consisted of the highest quartile of scores on the MBST.
Table B consisted of the second quartile, and so on. Figure 5.1 compares the average scores
from each quartile on each of the assessments.
Figure 5.1 Homogenous group average assessment scores
76.00
80.00
84.00
88.00
92.00
96.00
lab quiz exam total
Avera
ge sco
re
Assessment
HO‐A
HO‐B
HO‐C
HO‐D
The first homogeneous quartile, Table A (n=18, Table 5.5), scored the highest average,
median, and mode on the MBST (by design). The quartile also recorded the highest lab average
and median exam scores when compared to the heterogeneous, self-select, and other
homogeneous quartile groups.

26
Table 5.5 Homogeneous (Table A) descriptive statistics
MBST Lab Quiz Exam TotalAverage 93.10 95.09 87.84 83.97 89.45Median 96.55 95.80 90.56 89.00 92.16Mode 96.55 93.86 91.67 93.00 93.63
St. Dev. 5.67 2.53 9.88 10.25 6.29 The second homogeneous quartile, Table B (n=19, Table 5.6), recorded the highest lab
median and mode scores, and the highest quiz mode when compared to the when compared to
the heterogeneous, self-select, and other homogeneous quartile groups.
Table 5.6 Homogeneous (Table B) descriptive statistics
MBST Lab Quiz Exam TotalAverage 81.99 91.81 83.68 84.22 87.40Median 81.03 96.14 88.89 84.25 88.53Mode 79.31 96.14 100.00 94.00 NA
St. Dev. 5.98 11.96 13.48 8.55 8.92
The third homogeneous quartile, Table C (n=16, Table 5.7) recorded the highest average
quiz score, the highest average and mode exam score, and the highest average and median total
course grade when compared to the heterogeneous, self-select, and other homogeneous quartile
groups.
Table 5.7 Homogeneous (Table C) descriptive statistics
MBST Lab Quiz Exam TotalAverage 71.77 93.85 90.17 87.00 90.51Median 70.69 95.34 93.06 88.38 92.94Mode 82.76 94.55 98.89 94.00 92.94
St. Dev. 10.48 4.20 9.07 7.60 5.17
Finally, the fourth homogeneous quartile, Table D (n=16, Table 5.8), scored the highest
lab mode score when compared to the heterogeneous, self-select, and other homogeneous
quartile groups.

27
Table 5.8 Homogeneous (Table D) descriptive statistics
MBST Lab Quiz Exam TotalAverage 56.74 91.26 77.60 79.52 84.25Median 58.62 94.09 75.28 79.75 83.63Mode 58.62 96.14 NA 93.50 NA
St. Dev. 10.15 8.12 13.24 12.65 8.88
Table 5.9 lists the descriptive statistics of all assessments across all ability group types.
The three self-select sections and the three heterogeneous sections are combined into one. The
three homogeneous first quartile sections are combined (HO-A), as are the three second quartile
sections (HO-B), etc. The highest average, median, and mode for each assessment are
highlighted in gray; the HO-B and HO-D quartiles have the same mode score on the lab.
Table 5.9 Scores across all ability groups
MBST Lab Quiz Exam TotalAverage 76.72 91.53 84.60 82.60 86.81Median 79.31 93.18 86.67 84.63 87.70Mode 82.76 93.18 92.22 85.00 94.31
St. Dev. 15.19 5.33 10.07 9.08 5.94Average 76.97 94.14 81.34 83.16 87.18Median 81.03 83.50 95.23 87.78 88.24Mode 82.76 95.23 94.44 85.00 94.71
St. Dev. 13.73 10.89 4.14 12.88 6.77Average 93.10 95.09 87.84 83.97 89.45Median 96.55 95.80 90.56 89.00 92.16Mode 96.55 93.86 91.67 93.00 93.63
St. Dev. 5.67 2.53 9.88 10.25 6.29Average 81.99 91.81 83.68 84.22 87.40Median 81.03 96.14 88.89 84.25 88.53Mode 79.31 96.14 100.00 94.00 NA
St. Dev. 5.98 11.96 13.48 8.55 8.92Average 71.77 93.85 90.17 87.00 90.51Median 70.69 95.34 93.06 88.38 92.94Mode 82.76 94.55 98.89 94.00 92.94
St. Dev. 10.48 4.20 9.07 7.60 5.17Average 56.74 91.26 77.60 79.52 84.25Median 58.62 94.09 75.28 79.75 83.63Mode 58.62 96.14 NA 93.50 NA
St. Dev. 10.15 8.12 13.24 12.65 8.88
HO-D
SS
HE
HO-A
HO-B
HO-C

28
Figure 5.2 illustrates the average scores for each assessment across all ability groups.
The total average score for each assessment type, across all ability groups is as follows: MBST,
77.41%; lab, 92.92%; quiz, 84.21%; exam, 82.56%; and total course average, 87.32%.
Figure 5.2 Average scores across all ability groups
50.00
55.00
60.00
65.00
70.00
75.00
80.00
85.00
90.00
95.00
100.00
MBST Lab Quiz Exam Total
Score
Assessment
SS
HE
HO‐A
HO‐B
HO‐C
HO‐D
Comparing group types and assessments There were four areas of significance in the lab averages across the groups (Table 5.10).
The first homogeneous quartile (HO-A, 95.09%) compared with the last homogeneous quartile
(HO-D, 91.26%) has a p-value of 0.0332. The HO-A quartile is also significantly different from
the self-selected sections (SS, 91.53%), with a p-value of 0.0038, which is then different from
the heterogeneous grouped sections (HE, 94.14%) with a p-value of 0.0011. The heterogeneous
sections are also significantly different from the HO-D quartile, with a p-value of 0.0233.
Additionally, when comparing the homogeneous HO-A quartile with the comparable
self-select top quartile (91.72%), the p-value was still significant (0.0310). The difference

29
between the homogeneous HO-D quartile and the comparable bottom heterogeneous quartile
(94.26%) was also significant (p = 0.0124).
Table 5.10 Statistical significance in average lab scores
p-valueHO-A (95.09) HO-D (91.26) 0.0332HO-A (95.09) SS (91.53) 0.0038
HE (94.14) SS (91.53) 0.0011HE (94.14) HO-D (91.26) 0.0233
Group (Average)
These results show that grouping based on math ability did, in fact, make a significant
difference on the lab scores. The HO-A group not surprisingly earned a higher average on labs
than the HO-D group and the self-select control group. On this assessment, the argument found
in the literature that homogeneous grouping does a disservice to lower ability students seems to
hold true, as the heterogeneously grouped sections also had higher scores than the HO-D group.
In addition, the heterogeneously grouped sections earned a higher lab average than the self-select
sections. Grouping students into heterogeneous groups improves lab scores compared to letting
them randomly sit where they want.
Five areas of significance were found in comparing quiz averages (Table 5.11). The HO-
A quartile averaged 87.84% on the quizzes, the heterogeneously grouped students scored an
81.34% average, and the HO-D quartile earned an average of 77.60%. The differences between
the HO-D quartile and the HO-A quartile (p = 0.0061) and the HO-D quartile with the self-select
sections (p = 0.0113) are both significant. The third homogeneous quartile, with an average of
90.17%, was significantly higher than the heterogeneous sections (81.34%, p = 0.0215), the self-
select sections (84.60%, p = 0.0236), and the HO-D quartile (77.60%, p = 0.0019).
Additionally, when comparing a homogeneous quartile to the comparable self-select and
heterogeneous quartile, two of the three significances still held true. The third homogeneous
quartile (HO-C) was statistically higher than the third heterogeneous quartile (80.65%) with a p-
value of 0.0164 and also statistically higher than the third self-select quartile (81.08%) with a p-
value of 0.0037. However, when comparing the HO-D quartile with the fourth self-select
quartile (80.80%), the p-value was a not significant 0.2298.

30
Table 5.11 Statistical significance in average quiz scores
p-valueHO-A (87.84) HO-D (77.60) 0.0061
SS (84.60) HO-D (77.60) 0.0113HO-C (90.17) HE (81.34) 0.0215HO-C (90.17) SS (84.60) 0.0236HO-C (90.17) HO-D (77.60) 0.0019
Group (Average)
As expected, the HO-A and HO-C quartiles performed higher than the HO-D quartile.
Again, the literature appears to hold true, as the self-selected sections earned a higher score on
the quizzes than the HO-D quartile. However, the quizzes cover material that the students are
required to read before the start of class. The students have not worked with each other on the
concepts to be assessed on the quiz. Differences in scores on the quiz are more likely to be a
result of the students’ preparation, rather than the groups in which they were placed, and the
seemingly odd placement of the third quartile over the heterogeneous and self-select groups is
likely a result of this.
Three areas of significance were found in comparing exam scores (Table 5.12). The third
homogeneous quartile (HO-C, 87.00) scored higher than the heterogeneous sections (83.16%, p
= 0.0265), the self-selected sections (82.60%, p = 0.0390), and the HO-D quartile (79.52%, p =
0.0257).
Again, when comparing the HO-C quartile with each of the comparable heterogeneous
(80.34%) and self-select (82.61%) quartiles, both are also statistically significant with p-values
of 0.0197 and 0.0491 respectively.
Table 5.12 Statistical significance in average exam scores
p-valueHO-C (87.00) HE (83.16) 0.0265HO-C (87.00) SS (82.60) 0.0390HO-C (87.00) HO-D (79.52) 0.0257
Group (Average)
The strength of the third homogeneous quartile on the exams is a strong argument for
homogeneous grouping. It is not surprising that they scored higher than the fourth homogeneous

31
quartile, but it is surprising that they performed better than the heterogeneous and self-selected
sections.
Demographics There were no significant differences found between grouping type and gender (p =
0.2025), grouping type and race/ethnicity (p = 0.8110), grouping type and class year (p =
0.0663), grouping type and major (p = 0.3910), grouping type and mother’s education (p =
0.6108), or grouping type and father’s education (p = 0.5683).
However, there were a few areas of significance comparing class years (Table 5.13):
freshmen and juniors (p = 0.0001), freshmen and seniors (p = 0.0455), and sophomores and
juniors (p = 0.0013). Another significant difference (Table 5.14) is found between the Caucasian
students (n = 156) and those of non-Caucasian decent (n = 26), with a p-value of 0.0003.
Table 5.13 Statistical significance between class years
p-valueFreshmen Juniors <0.0001Freshmen Seniors 0.0455
Sophomores Juniors 0.0013
Class year
Table 5.14 Statistical significance in student race
p-valueCaucasian Non-caucasian 0.0003
Race
Although there were no statistical differences between male and female performance on
the MBST, there were some expected results in the make-up of the sections that resulted from
students’ performance on the assessment (Table 5.15). Males are known to perform well in math
and science (Spelke, 2005). 42.31% of the males assigned to homogeneous sections scored well
enough on the MBST to be placed in the highest quartile; if distributed evenly, this value would
be only 25%. Gender differences are expanded in Table 5.16, comparing gender, ability
grouping type, and average scores on each assessment category. The highest average in each
category is highlighted in gray.

32
Table 5.15 Gender breakdown of grouping types
n = 121 % of total n = 64 % of totalSS 39 21.08% 22 11.89%HE 45 24.32% 16 8.65%HO 37 20.00% 26 14.05%
n = 37 % of HO n = 26 % of HOHO-A 7 18.92% 11 42.31%HO-B 13 35.14% 5 19.23%HO-C 8 21.62% 8 30.77%HO-D 9 24.32% 2 7.69%
MaleFemale
Table 5.16 Gender breakdown of grouping types by assessment category
Gro
up
Gen
der
MBS
T
Lab
Qui
z
Exa
m
Tot
al
F 77.37 93.22 84.29 83.02 87.65M 78.45 92.54 84.94 83.09 87.49F 78.69 92.06 86.47 84.16 87.97M 73.98 90.92 81.64 80.55 85.21F 78.08 94.31 83.40 82.08 87.59M 78.02 94.60 83.78 82.34 87.89F 92.61 95.39 87.94 84.61 89.85M 93.42 94.90 87.78 83.57 89.20F 81.96 93.55 80.94 82.21 86.88M 82.07 88.00 88.33 87.60 87.90F 68.10 94.49 87.29 84.31 89.23M 75.43 93.21 93.06 89.69 91.80F 57.85 89.49 78.64 81.61 84.49M 51.72 89.43 73.89 76.75 81.72
HO-D
All
SS
HE
HO-A
HO-B
HO-C
Some of the descriptive statistics appear significantly large, an example is the quiz grades
for the HO-B group, a t-test analysis reports very few areas of significance within the 95%
confidence level (Table 5.17). Only the quiz and total scores in the self-select section show
statistical significance, highlighted in gray.

33
Table 5.17 t-test analysis: gender breakdown of grouping types by assessment
ALL MBST Lab Quiz Exam TotalM/F 0.3127 0.2343 0.3601 0.4823 0.4403SS MBST Lab Quiz Exam Total
M/F 0.1244 0.2092 0.0326 0.0606 0.0360HE MBST Lab Quiz Exam TotalM/F 0.4927 0.4025 0.4595 0.4641 0.4357HOA MBST Lab Quiz Exam TotalM/F 0.3893 0.3500 0.4873 0.4206 0.4192HOB MBST Lab Quiz Exam TotalM/F 0.4872 0.2033 0.1566 0.1193 0.4191HOC MBST Lab Quiz Exam TotalM/F 0.0846 0.2804 0.1074 0.0821 0.1681HOD MBST Lab Quiz Exam TotalM/F 0.2346 0.4967 0.3447 0.3348 0.3686
Many small areas of significance were found in comparing assessment scores across class
year. Table 5.18 outlines the class year breakdown by ability groups. Students are spread fairly
evenly across the grouping types, the highest percentages are highlighted in gray.
Table 5.18 Class year breakdown of grouping types
n = 44 % of total n = 75 % of total n = 41 % of total n = 24 % of totalSS 15 8.15% 25 13.59% 14 7.61% 7 3.80%HE 18 9.78% 21 11.41% 14 7.61% 7 3.80%HO 11 5.98% 29 15.76% 13 7.07% 10 5.43%
n = 11 % of HO n = 29 % of HO n = 13 % of HO n = 10 % of HOHO-A 4 36.36% 8 27.59% 5 38.46% 1 10.00%HO-B 3 27.27% 7 24.14% 4 30.77% 4 40.00%HO-C 3 27.27% 9 31.03% 2 15.38% 2 20.00%HO-D 1 9.09% 5 17.24% 2 15.38% 3 30.00%
SrFr So Jr
When comparing assessment average scores across grouping types and class years, many
large differences are found (Table 5.19). Freshmen scored the highest average in all categories,
and at first glance, it appears that freshmen in the lowest homogeneous quartile earned the
highest scores in all other assessments. However, Table 5.18 shows that there is only one
student that falls into that category. That person scored only a 58.62% on the MBST, placing the
student into the fourth quartile, but obviously performed quite well on the geology assessments.

34
Freshmen in the second homogenous quartile, n=3, scored the second highest average on the
quizzes and exams, highlighted in light gray. Heterogeneously grouped seniors (n=7) scored
highest on the labs.
Table 5.19 Class year breakdown of grouping types by assessment category
Gro
up
Yea
r
MB
S T
Lab
Qui
z
Exa
m
Tot
al
Freshmen 83.31 93.77 90.92 86.76 90.52Sophomores 78.30 93.92 83.31 84.24 88.25
Juniors 75.02 90.64 80.38 77.44 83.65Seniors 71.41 92.54 83.45 82.00 86.80
Freshmen 83.22 92.80 87.63 84.70 88.71Sophomores 77.38 92.90 85.78 85.60 88.78
Juniors 75.62 89.95 82.46 78.64 84.19Seniors 65.02 88.08 79.29 77.54 82.39
Freshmen 83.33 93.35 91.48 86.04 90.15Sophomores 78.49 94.37 78.17 81.95 86.64
Juniors 74.14 94.35 80.20 76.64 84.91Seniors 74.38 97.08 84.92 83.36 89.55
Freshmen 94.83 96.59 91.81 89.69 93.04Sophomores 93.53 95.37 85.76 84.16 89.28
Juniors 93.10 93.68 89.89 83.05 88.84Seniors 82.76 93.86 78.33 64.25 79.51
Freshmen 82.76 96.59 96.30 91.00 94.35Sophomores 84.24 97.14 82.70 83.71 89.33
Juniors 76.72 76.65 71.67 77.69 76.18Seniors 82.76 94.94 84.86 84.25 88.97
Freshmen 77.01 92.88 94.44 90.17 92.09Sophomores 74.71 94.14 89.57 87.33 90.66
Juniors 58.62 91.25 80.56 78.25 84.26Seniors 63.79 96.59 96.11 89.50 93.73
Freshmen 58.62 98.86 100.00 96.00 97.94Sophomores 55.86 89.82 78.22 82.40 84.86
Juniors 44.83 89.20 60.56 59.25 72.40Seniors 65.52 85.98 81.11 87.17 85.59
All
SS
HE
HO-A
HO-B
HO-C
HO-D
Again, it is difficult to see where areas of significance can be found. A t-test analysis
(Tables 5.20 and 5.21) clarifies. In Table 5.21, combinations notated by NA are a result of
categories with only one student and a t-test could not be run.
As mentioned earlier, there were overall significant differences (Table 5.13) between
freshmen and juniors, freshmen and seniors, and sophomores and juniors. Overall, freshmen
performed better than seniors regardless of the group that they are in. Because there was not one

35
group or quartile with a high concentration of freshmen, there is little chance of skew in the
results.
Table 5.20 t-test analyses: class year breakdown of grouping types by assessment (SS/HE) SS MBST Lab Quiz Exam Total
Fr/So 0.0854 0.4656 0.2344 0.3658 0.4821Fr/Jr 0.0557 0.0916 0.0942 0.0342 0.0170Fr/Sr 0.0090 0.0334 0.0422 0.0298 0.0100So/Jr 0.3564 0.0392 0.1516 0.0093 0.0062So/Sr 0.0444 0.0085 0.0533 0.0121 0.0037Jr/Sr 0.1074 0.2927 0.2984 0.3940 0.2783HE MBST Lab Quiz Exam Total
Fr/So 0.0794 0.2272 0.0002 0.0532 0.0187Fr/Jr 0.0252 0.2588 0.0043 0.0075 0.0094Fr/Sr 0.0596 0.0291 0.1035 0.2729 0.4124So/Jr 0.1436 0.4934 0.3223 0.0531 0.2049So/Sr 0.2032 0.0446 0.1226 0.3557 0.1439Jr/Sr 0.4855 0.0483 0.2450 0.1260 0.1000
Interestingly, the self-select and heterogeneous sections show many more significant
differences between class years than the homogeneous sections. These groups are much larger,
so one would think that particularly high or low scores would cancel each other out, reducing the
chance for overall significance. However, that is not the case. No statistical differences were
found between class years for the first homogeneous quartile (HO-A, n=18). This group
performed the best on the MBST and earned the highest average scores on the labs and the
second highest average on the total course grade. As shown in Table 5.9, the students in the
third homogeneous quartile (HO-C) scored the highest in quiz, exam, and total course grade
scores as a whole. It is not surprising that these two quartiles exhibit only a few areas of
significance between the class years. All most all of the students did extremely well, as seen by
the high averages and low standard deviations (Table 5.5 and Table 5.7). The other two
quartiles, HO-B and HO-D had more variations between student performances in all
assessments.

36
Table 5.21 t-test analyses: class year breakdown of grouping types by assessment (HO) HO-A MBST Lab Quiz Exam TotalFr/So 0.3438 0.1344 0.2093 0.1881 0.1771Fr/Jr 0.3235 0.0926 0.3079 0.0943 0.0961Fr/Sr NA (1) NA (1) NA (1) NA (1) NA (1)So/Jr 0.4507 0.1563 0.2619 0.4295 0.4564So/Sr NA (1) NA (1) NA (1) NA (1) NA (1)Jr/Sr NA (1) NA (1) NA (1) NA (1) NA (1)
HO-B MBST Lab Quiz Exam TotalFr/So 0.3736 0.3168 0.0748 0.1221 0.1056Fr/Jr 0.0894 0.0816 0.0238 0.0082 0.0262Fr/Sr 0.5000 0.2453 0.0154 0.1439 0.0566So/Jr 0.0366 0.0116 0.1297 0.1422 0.0184So/Sr 0.3529 0.0986 0.3898 0.4648 0.4609Jr/Sr 0.0570 0.0654 0.0817 0.1362 0.0473
HO-C MBST Lab Quiz Exam TotalFr/So 0.3490 0.3377 0.2288 0.2958 0.3503Fr/Jr 0.0776 0.4051 0.0294 0.0954 0.1069Fr/Sr 0.0793 0.2659 0.3764 0.4548 0.3810So/Jr 0.0305 0.1799 0.1313 0.0881 0.0609So/Sr 0.0702 0.1776 0.2048 0.3578 0.2166Jr/Sr 0.3492 0.1759 0.0243 0.1098 0.0048
HO-D MBST Lab Quiz Exam TotalFr/So NA (2) NA (2) NA (2) NA (2) NA (2)Fr/Jr NA (2) NA (2) NA (2) NA (2) NA (2)Fr/Sr NA (2) NA (2) NA (2) NA (2) NA (2)So/Jr 0.0528 0.4527 0.0377 0.0111 0.0345So/Sr 0.1006 0.3197 0.3493 0.2520 0.4554Jr/Sr 0.0514 0.4052 0.1211 0.0171 0.1295
(1) Only one HO-A senior(2) Only one HO-D freshman
The following tables list the final course averages across each of the demographic groups
compiled in Chapter 3:
Table 5.22 Course average: gender
Male n=64 87.65Female n=121 87.49
Table 5.23 Course average: age
18-21 years n=148 88.1322-26 years n=27 84.7727-22 years n=4 86.4234-40 years n=27 84.26>40 years n=3 89.54
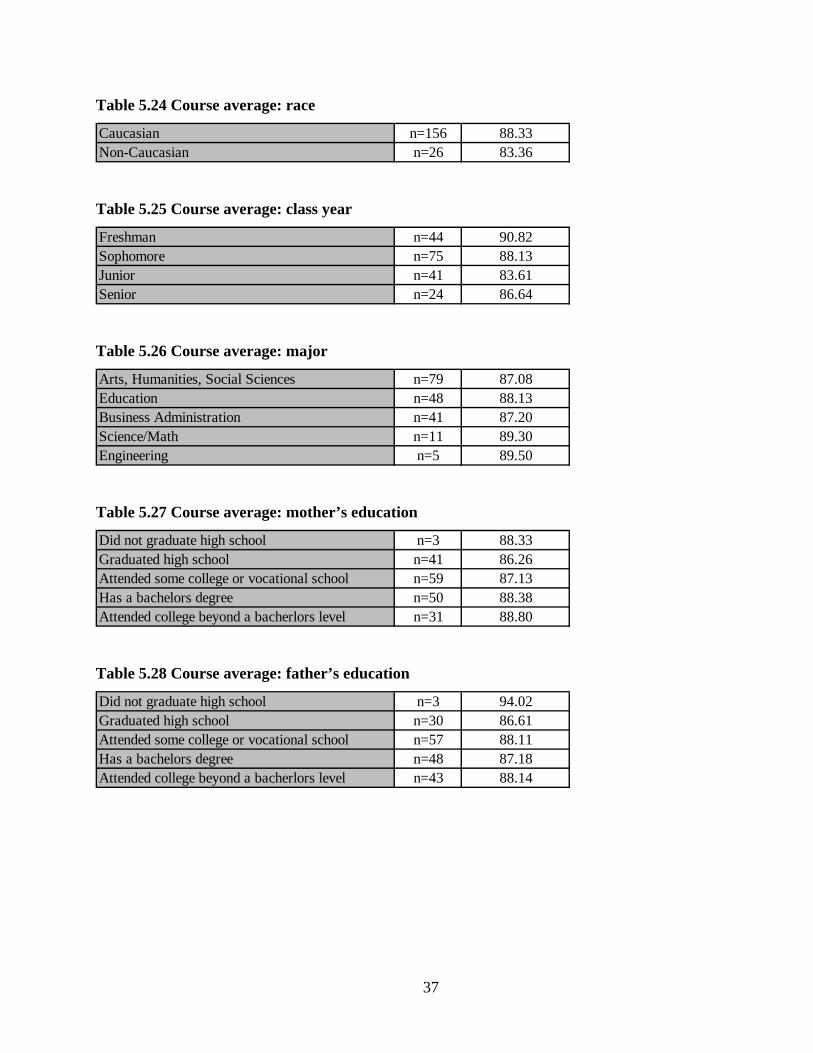
37
Table 5.24 Course average: race
Caucasian n=156 88.33Non-Caucasian n=26 83.36
Table 5.25 Course average: class year
Freshman n=44 90.82Sophomore n=75 88.13Junior n=41 83.61Senior n=24 86.64
Table 5.26 Course average: major
Arts, Humanities, Social Sciences n=79 87.08Education n=48 88.13Business Administration n=41 87.20Science/Math n=11 89.30Engineering n=5 89.50
Table 5.27 Course average: mother’s education
Did not graduate high school n=3 88.33Graduated high school n=41 86.26Attended some college or vocational school n=59 87.13Has a bachelors degree n=50 88.38Attended college beyond a bacherlors level n=31 88.80
Table 5.28 Course average: father’s education
Did not graduate high school n=3 94.02Graduated high school n=30 86.61Attended some college or vocational school n=57 88.11Has a bachelors degree n=48 87.18Attended college beyond a bacherlors level n=43 88.14

38
Figure 5.3 Course averages across all demographic groups
80.00
85.00
90.00
95.00
Male
Female
Age
18‐21 years
22‐26 years
27‐22 years
34‐40 years
>40 years
Race
White
Non
‐white
Class year
Freshm
anSoph
omore
Junior
Senior
Major
Arts, Hum
anities, SocSci
Education
Busine
ss Adm
inistration
Science/Math
Engine
ering
Mothe
r's e
ducatio
nDid not gradu
ate HS
Gradu
ated
HS
Atten
ded coll or votec
Has a bache
lors degree
College
beyon
d BS
Father's edu
catio
nDid not gradu
ate HS
Gradu
ated
HS
Atten
ded coll or votec
Has a bache
lors degree
College
beyon
d BS

39
MBST validation For the MBST to be a valid instrument for the purposes of this study, students who
scored well should also have earned high grades in the course. Students who tested poorly on the
MBST should also have earned low grades in the course. This is indeed the case. The students
who scored in the top 25% on the MBST had a significantly higher course average (p = 0.0001),
earning an average of 90.68% compared to an 86.24% earned by the bottom 75%. The students
who scored in the bottom 25% on the MBST had a significantly lower course average (p =
0.0464), earning an average of 85.59% compared to an 87.86% earned by the top 75%.
Additionally, there were no statistical differences in performance on the MBST between
males and females. This result predicts a similar response for the other assessments in the study,
and in fact, no gender differences were found in lab, quiz, or exam scores.

40
CHAPTER 6 - Implications
The purpose of this study was to answer the question: does ability grouping, organizing
classrooms to combine those of similar ability, have an impact on student performance in the
GEOL 103 labs? This research found the answer to be yes.
Ability grouping The students in all three grouping types, homogenous, heterogeneous, and self-select,
scored higher averages on the group assessments (laboratories) than on the individual
assessments (quizzes and exams), as seen in Figure 5.2. This result was expected, as groups of
six are more likely to come up with the correct response to a question than any one person alone.
The top 50% of students, whether grouped homogeneously or heterogeneously,
performed the same. The top two quartiles showed no significant difference between the
homogenous groups and the heterogeneous groups on the labs, exams, and quizzes. This finding
implies that the upper half of students are not positively or negatively affected by purposeful
grouping.
Homogeneous grouping
Although there was no global increase in scores with any of the homogeneous groups,
one area of note was the third quartile (HO-C). The students in that quartile scored significantly
higher than the heterogeneous and self-selected sections, and also on the HO-A and HO-B
quartiles, on two of the three assessment types, quizzes and exams. While this could be a strong
argument for the benefits of homogeneous grouping, gains in one fourth of a group of students
does not mean the grouping method should be adopted for all students. As the fourth
homogenous quartile earned significantly lower scores on the labs, quizzes, exams, and therefore
total grade, it is clear that this grouping method does not benefit all students and should not be
used in this course.
41
Self-select grouping
Self-selected groups scored significantly better than another group in only one area; they
scored higher on quizzes than the fourth homogeneous quartile. As mentioned earlier, quiz
scores do not reflect students working together, as quizzes covered material not yet discussed in
class. Even so, one would expect a mixed ability group of students to perform better than the
lowest 25th percentile on any type of assessment. Therefore, this significance can be ignored. In
contrast, both heterogeneous and homogeneous groups performed better than the self-selected
groups on the labs and exams. Additionally, in self-select sections, students with friends in the
class are likely to sit with those friends. This can be very distracting and would likely impact
their performance in the class. Clearly, allowing students to choose their own seats is not
benefitting all students.
Heterogeneous grouping
Heterogeneously grouped students earned significantly higher scores than the self-
selected students on the labs, and did not fall behind either of the other grouping methods in any
of the other assessments. Only heterogeneous grouping resulted in gains for all students;
therefore, it is better to group the students heterogeneously than to allow them to sit wherever
they wish.
Demographics There was not a large difference in performance between genders. Although traditionally
males score higher than females in science subjects (Spelke, 2005), the GEOL 103 course is an
introductory level laboratory that does not delve deeply into the science of geology. Concepts
are covered in a broad level, designed to incorporate student experiences as much as possible
with the geologic topics.
Similarly, no trend was found in students’ age or in the education level of students’
parents. One spike is found with students whose fathers did not graduate from high school, but
only three students recorded that response and thus the sample size is too small to be of
significance.

42
Lower-level class years, freshmen and sophomores, scored much higher than juniors and
slightly better than seniors. This may be due to the shorter time between high school geology
courses and students’ enrollment in GEOL 103. Seniors may be working harder to increase their
GPA before graduation. Juniors are neither close to graduation nor have taken high school
geology classes recently. Alternatively, there could be completely different factors influencing
their poor results.
Not surprisingly, students majoring in science, math, and engineering showed the highest
performance in overall course grades. These students have an interest in science and therefore
likely a higher aptitude as well. Business administration, arts and humanities, and social science
majors do not have much in common with the natural and physical sciences, and their lower
course grades match this.
Sources of data error Student performance on the MBST was not a factor in the overall semester grade for the
course. Because of this, students did not have an incentive to perform at their best on the test.
Upon compiling overall student responses on the individual questions on the MBST, some of the
easier concepts resulted in higher incorrect responses than expected. For example, thirty
students did not record the correct response to a question that asked students to divide a number
by ten. Fifty-two students recorded an incorrect response for a simple addition problem. Thirty
students missed a question requiring students to average three two-digit numbers. Twelve
missed a question asking students to average 2 and 4.
The implication for this finding is profound for this study. If students did not perform to
their actual ability on the MBST, then the placement of those students in the homogeneous and
heterogeneous groupings may not have aligned appropriately for accurate results.
In order to reduce grouping error due to students’ lack of effort on the MBST, is there a
method of encouraging students to perform to their true ability? Similar studies at the university
level have given extrinsic rewards, not counting toward their grade in the course. Students could
be given candy or preferred seating in the classroom. Perhaps they might earn a chance to
submit an assignment for extra credit or being allowed to drop a homework grade – rewards that
will indirectly influence their grade and discourage student apathy.

43
Another source of data error may be due to the four sections that showed statistical
similarity on the MBST scores. While the nine sections as a whole did not show significant
similarity, four sections did. Two of the four were assigned to homogeneous groups which may
have skewed those results. This is likely to be a much smaller source of error than student
apathy on the MBST itself, but nevertheless, it is a possible factor.
Conclusions Some of the areas of significance are in demographic categories that are beyond the
Geology department’s control during registration. Obviously, course decisions can not be made
due to race (p = 0.0003). However, other differences can be controlled for, with minor additions
to the registration line schedule. Because of the significant variations between class years,
students may benefit from enrollment of students into sections designated only for freshmen or
seniors, etc.
Overall both homogeneous and heterogeneous groupings performed better than the
control self-selected sections. One homogeneous quartile showed significant improvement in
performance compared to the heterogeneously grouped students, but another homogeneous
quartile showed a significant decline in scores. Gains in one subset of student should not come
as a detriment to another subset of students, so homogeneous grouping is not recommended.
Only heterogeneous grouping showed significant increases in scores without harm to other
students, and for this reason, this study recommends using a heterogeneous method of grouping
students in future GEOL 103 classes.
Questions for further study Why did we find so little significance between grouping methods? Is it because GEOL
103 students only meet once per week, for less than two hours? Lou et al. (1996) found that
classes that meet only once per week may not have enough face-to-face time in order for
grouping to have an effect. Homogeneous and heterogeneous groups that meet more than once
per week show greater gains.

44
Is it a problem with how we grouped the students? Does math ability relate strongly
enough to geology for the MBST groupings to be valid? Do students in science or math classes
show improvement with the establishment of ability groups? Research shows that reading and
English composition classes report much higher benefit from ability grouping over math and
science classes (Lou et al, 1996). The ability groups in this study were established using
students’ mathematical knowledge; in contrast, a study by Gustin and Corazza (1994) found that
grouping by verbal reasoning may be more valid as a predictor of scientific performance.
Differentiated instruction, when done correctly, has shown to bring very significant gains
in small groups of almost any type (Kulik and Kulik, 1987; Esposito, 1973; Ireson, 2002a).
Perhaps grouping students by ability and adapting the teaching methods for each particular group
could result in the overall gains in performance that this study failed to find.
Data on student self-efficacy in laboratory groups was collected during this study.
Further research could concentrate on influences on students’ preferences within laboratory
ability groups.

45
References
Abrami, P.C., Chambers, B., Poulsen, C., De Simone, C., d'Apollonia, S., and Howden, J., 1995, Classroom connections: Understanding and using cooperative learning: Toronto, Ontario, Canada, Harcourt-Brace, p. 221.
Allan, S.D., 1991, Ability-grouping research reviews: What do they say about grouping and the gifted?: Educational Leadership, v. 48, p. 60-65.
Benbow, C.P., and Minor, L.L., 1986, Mathematically talented males and females and achievement in the high school sciences: American Educational Research Journal, v. 23, p. 425-436.
Boyd, B., 2007, To set or not to set; Is that the question?: Improving Schools, v. 10, p. 283-294.
Britton, S., New, P.B., Sharma, M.D., and Yardley, D., 2005, A case study of the transfer of mathematics skills by university students: International Journal of Mathematical Education in Science and Technology, v. 36, p. 1-13.
Burris, C.C., Heubert, J.P., and Levin, H.M., 2006, Accelerating mathematics achievement using heterogeneous grouping: American Educational Research Journal, v. 41, p. 105-136.
Burris, C.C., Wiley, E., Welner, K.G., and Murphy, J., 2008, Accountability, rigor, and detracking: Achievement effects of embracing a challenging curriculum as a universal good for all students: Teachers College Record, v. 110, p. 571-607.
Davenport, L.R., 1993, The effects of homogeneous groupings in mathematics: ERIC Clearinghouse for Science, Mathematics, and Environmental Education ED 359 065, Report EDO-SE-93-6.
Esposito, D., 1973, Homogeneous and heterogeneous ability grouping: Principal findings and implications for evaluating and designing more effective educational environments: Review of Educational Research, v. 43, p. 163-179.
Fiedler, E.D., Lange, R.E., and Winebrenner, S., 2002, In search of reality: Unraveling the myths about tracking, ability grouping, and the gifted: Roeper Review, v. 24, p. 108-111.
Gamoran, A., 1992, Is ability grouping equitable?: Educational Leadership, v. 50, p. 11-17.
Gamoran, A., 1986, Instructional and institutional effects of ability grouping: Sociology of Education, v. 59, p. 185.

46
Good, T.L., and Marshall, S., 1984, Do students learn more in heterogeneous or homogeneous groups? in Peterson, P., Wilkinson, L.C. and Hallinan, M., eds., The social context of instruction: Group organization and group processes: Orlando, FL, Academic Press, p. 15-38.
Gustin, W.C., and Corazza, L., 1994, Mathematical and verbal reasoning as predictors of science achievement: Roeper Review, v. 16, p. 160-162.
Hallam, S., and Ireson, J., 2006, Secondary school pupils' preferences for different types of structured grouping practices: British Educational Research Journal, v. 32, p. 583-599.
Hanushek, E.A., and ößmann, L.W., 2006, Does educational tracking affect performance and inequality?: The Economic Journal, v. 116, p. C63-C76.
Hoffer, T.B., 1992, Middle school ability grouping and student achievement in science and mathematics: Educational Evaluation and Policy Analysis, v. 14, p. 205-227.
Ireson, J., Hallam, S., Hack, S., Clark, H., and Plewis, I., 2002a, Ability grouping in English secondary schools: Effects on attainment in English, mathematics, and science: Educational Research and Evaluation, v. 8, p. 299-318.
Ireson, J., Clark, H., and Hallam, S., 2002b, Constructing ability groups in the secondary school: Issues in practice: School Leadership & Management, v. 22, p. 163-176.
Kansas State University, 2008, About K-State: v. 2009, http://www.k-state.edu/welcome/.
Kansas State University Registrar's Office, 2009, Enrollment statistics: v. 2009, http://www.k-state.edu/registrar/statistics/.
Kulik, C.L.C., and Kulik, J.A., 1982, Effects of ability grouping on secondary school students: A meta-analysis of evaluation findings: American Educational Research Journal, v. 19, p. 415-428.
Kulik, J.A., and Kulik, C.L.C., 1987, Effects of ability grouping on student achievement: Equity and Excellence, v. 23, p. 22-30.
Lou, Y., Abrami, P.C., Spence, J.C., Poulsen, C., Chambers, B., and d'Apollonia, S., 1996, Within-class grouping: A meta-analysis: Review of Educational Research, v. 66, p. 423-458.
Mullen, B., and Copper, C., 1994, The relationship between group cohesiveness and performance: An integration: Psychological Bulletin, v. 115, p. 210-227.
Noddings, N., 1989, Theoretical and practical concerns about small groups in mathematics: Elementary School Journal, v. 89, p. 607-623.
Oakes, J., 1990, Multiplying inequalities: The effects of race, social class, and tracking on opportunities to learn mathematics and sciences: Santa Monica, CA, Rand Corporation, p. 132.

47
Oakes, J., 2005, Keeping track: How schools structure inequality: New Haven, CT, Yale University Press, p. 352.
Petty, M.C., 1954, Intraclass grouping in the elementary school: Austin, TX, University of Texas Press, p. 189.
Piaget, J., 1954, The construction of reality in the child: New York, Ballatine Books, p. 386.
Rogers, K.B., 2002, Grouping the gifted and talented: Roeper Review, v. 24, p. 103-107.
Rosenbaum, J.E., 1976, Making inequality: The hidden curriculum of high school tracking: New York, Wiley, p. 256.
Saleh, M., Lazonder, A.W., and DeJong, T., 2005, Effects of within-class ability grouping on social interaction, achievement, and motivation: Instructional Science, v. 22, p. 105-119.
Shields, C.M., 2002, A comparison study of student attitudes and perceptions in homogeneous and heterogeneous classrooms: Roeper Review, v. 24, p. 115-119.
Slavin, R.E., 1990, Achievement effects of ability grouping in secondary schools: A best-evidence synthesis: Review of Educational Research, v. 60, p. 471-499.
Spelke, E.S., 2005, Sex differences in intrinsic aptitude for mathematics and science?: American Psychologist, v. 60, p. 950-958.
Terwel, J., 2005, Curriculum differentiation: Multiple perspectives and developments in education: Journal of Curriculum Studies, v. 37, p. 653-670.
Tieso, C.L., 2003, Ability grouping is not just tracking anymore: Roeper Review, v. 26, p. 29-36.
Vygotsky, L.S., 1978, Mind in society: The development of higher mental processes: Cambridge, MA, Harvard University Press, p. 159.
Webb, N.M., 1989, Peer interaction and learning in small groups: Journal of Educational Research, v. 13, p. 21-39.
Wilkinson, L.C., 1986, June, Grouping low-achieving students for instruction, in Designs for Compensatory Education Conference, Washington, D.C. (ERIC Document Reproduction Service No. ED 293 915).
Wiliam, D. and Bartholomew, H., 2004, It's not which school but which set you're in that matters: the influence of ability grouping practices on student progress in mathematics: British Educational Research Journal, v. 30, p. 279-293.

48
Appendix A - Mathematics Proficiency Basic Skills Test

49

50

51

52

53

54

55