the human development index in canada: ranking the ... · the human development index in canada:...
TRANSCRIPT
1
July 2016
James Uguccioni
CSLS Research Report 2016-14
July 2016
CENTRE FOR THE
STUDY OF LIVING
STANDARDS
THE HUMAN DEVELOPMENT INDEX IN
CANADA: RANKING THE PROVINCES AND
TERRITORIES INTERNATIONALLY, 2000-2014
151 Slater Street, Suite710
Ottawa, Ontario K1P 5H3
613-233-8891, Fax 613-233-8250

2
The Human Development Index in Canada: Ranking the Provinces and Territories
Internationally, 2000-2014
Abstract
We develop internationally comparable estimates of the Human Development
Index (HDI) for the Canadian provinces and territories over the 2000-2014 period. The
HDI is a composite index composed of three dimensions (life expectancy, education and
income) measured by four indicators (life expectancy at birth, average years of education,
expected years of schooling and GNI per capita). We first replicate the Canadian estimates
from the most recent Human Development Report (HDR) using data from Statistics
Canada. Next, we generate estimates for the provinces and territories following the same
methodology and using the same Canadian data sources. We make these estimates
internationally comparable by scaling each province or territory’s estimate to Canada’s in
the most recent HDR. This allows the provinces and territories to be ranked in the most
recent HDR international rankings for all four component variables as well as the overall
HDI. The highest HDI score in 2014 among the provinces and territories belongs to
Alberta, which would be fourth in the international rankings, while the lowest ranking
region is Nunavut, which would be in 46th place. Overall, our report highlights the diverse
human development experiences of Canadians that are concealed by Canada’s overall
HDI.

3
The Human Development Index in Canada: Ranking the Provinces and Territories
Internationally, 2000-2014
Table of Contents
Abstract ......................................................................................................................................................... 2
Table of Contents .......................................................................................................................................... 3
List of Tables ................................................................................................................................................ 4
List of Exhibits .............................................................................................................................................. 5
List of Charts................................................................................................................................................. 5
List of Appendix Tables ................................................................................................................................ 5
Executive Summary ...................................................................................................................................... 7
Introduction ................................................................................................................................................... 9
I. The Human Development Index .............................................................................................................. 10
II. Replicating the most recent HDR’s Estimates for Canada ..................................................................... 13
A. Life Expectancy ................................................................................................................................. 13
B. Education ........................................................................................................................................... 14
i. Average Educational Attainment .................................................................................................... 14
ii. Expected Years of Schooling ......................................................................................................... 17
C. Income ............................................................................................................................................... 21
D. Overall Human Development Index .................................................................................................. 22
III. Estimates of the Human Development Index for the Canadian Provinces and
Territories .................................................................................................................................................... 23
A. Life Expectancy ................................................................................................................................. 23
B. Education ........................................................................................................................................... 26
i. Average Years of Education ........................................................................................................... 26
ii. Expected Years of Schooling ......................................................................................................... 28
C. Income ............................................................................................................................................... 31
D. Overall Human Development Index .................................................................................................. 34
IV. Future Research with the Human Development Index ......................................................................... 36
V. Summary ................................................................................................................................................ 38
References ................................................................................................................................................... 40
Appendix 1: Statistics Canada Data ............................................................................................................ 42
Appendix 2: CSLS Estimates of HDI and its Components......................................................................... 57

4
The Human Development Index in Canada: Ranking the Provinces and Territories
Internationally, 2000-2014 List of Tables Table 1: Life Expectancy at Birth, Canada, 1980, 1990, 2000-2014 ................................... 13 Table 2: Estimated Average Educational Attainment, Canada, Persons aged 25
and over, 1980-2014 ........................................................................................................ 15 Table 3: School Attendance by age group, Canada, 2000-2014 ......................................... 19
Table 4: Expected Years of Schooling, Canada, 1980-2014 .............................................. 20 Table 5: GNI per capita, PPP adjusted 2011 US dollars, Canada, 1990, 2000,
2005-2014 ............................................................................................................................ 21 Table 6: CSLS Replication of the Official Human Development Index Estimate
for Canada, 2014 ............................................................................................................. 22 Table 7: Life Expectancy Estimates and Index, Canada and the Provinces/Territories,
1990, 2000, 2011, and 2014 ............................................................................................ 24
Table 8: Life Expectancy Rank, Canada and the Provinces/Territories, 2000,
2005, 2011, and 2014 ...................................................................................................... 25
Table 9: Average Educational Attainment Estimates and Index, Canada and the
Provinces/Territories, 2000, 2005, 2011, and 2014 ....................................................... 26 Table 10: Average Educational Attainment Rank, Canada and the
Provinces/Territories, 2000, 2005, 2011, and 2014 ........................................................ 28
Table 11: Expected Years of Schooling Estimates and Index, Canada and the
Provinces/Territories, 2000, 2005, 2011, and 2014 ....................................................... 28 Table 12: Expected Years of Schooling Rank, Canada and the Provinces/Territories,
2000, 2005, 2011, and 2014 ............................................................................................ 30 Table 13: Gross National Income per capita Estimates and Income Index, Canada
and the Provinces/Territories, 2000, 2005, 2011, and 2014 ............................................ 32 Table 14: Gross National Income per capita Rank, Canada and the
Provinces/Territories, 2000, 2005, 2011, and 2014 ........................................................ 34 Table 15: Human Development Index, Canada and the Provinces/Territories, 2000,
2005, 2011, and 2014 ...................................................................................................... 34 Table 16: Human Development Index Rank, Canada and the Provinces/Territories,
1990, 2000, 2011, and 2014 ............................................................................................ 35
Table 17: Summary of Regional Rankings for the Canadian Provinces/Territories,
2014 ................................................................................................................................. 38
Table 18: Summary of International HDR Ranks, Canada and the Provinces/Territories,
2014 ................................................................................................................................ 39

5
List of Exhibits
Exhibit 1: Structure of the Human Development Index ..................................................... 10
List of Charts
Chart 1: Life Expectancy, Raw Estimates, Canada and the Provinces/Territories, 2014 ... 24 Chart 2: Compound Annual Growth in Raw Estimates of Life Expectancy, per cent per
year, Canada and the Provinces/Territories, 2000-2014 ..................................................... 25 Chart 3: Average Educational Attainment, Raw Estimates, Canada and the
Provinces/Territories, 2014 ................................................................................................. 27
Chart 4: Compound Annual Growth in Average Educational Attainment, per cent per year,
Canada and the Provinces/Territories 2000-2014 ............................................................... 27 Chart 5: Expected Years of Schooling, Raw Estimates, Canada and the
Provinces/Territories, 2014 ................................................................................................. 29 Chart 6: Compound Annual Growth in Expected Years of Schooling, per cent per year,
Canada and the Provinces/Territories, 2000-2014 .............................................................. 30
Chart 7: GNI per capita, current dollars, Raw Estimates, Canada and the
Provinces/Territories, 2014 ................................................................................................. 33
Chart 8: Compound Annual Growth in Nominal GNI per capita, per cent per year, Canada
and the Provinces/Territories, 2000-2014 ........................................................................... 33 Chart 9: Human Development Index, Canada and the Provinces/Territories, 2014 ........... 35
Chart 10: Compound Annual Growth Rate in the HDI, per cent per year, Canada and the
Provinces/Territories, 2000-2014 ....................................................................................... 36
List of Appendix Tables
Appendix Table 1: Life Expectancy at Birth, Canada, Provinces and Territories, Both
Sexes, 1979-2014 ............................................................................................................ 42
Appendix Table 2: Gross Domestic Product, Canada, Provinces and Territories,
1981-2014 ....................................................................................................................... 43 Appendix Table 3: GNI and GNI per Capita, Market Prices, Canada, 1982-2014 ............. 45 Appendix Table 4: Enrolment in Public Elementary and Secondary Schools, Canada,
Provinces and Territories, 1996-2012 ............................................................................. 46
Appendix Table 5: College Enrolment (Full-time and Part-time), Canada, Provinces
and Territories, 1992-2013 .............................................................................................. 48
Appendix Table 6: University Enrolment (Full-time and Part-time), Canada,
Provinces and Nunavut, 1992-2013 ................................................................................ 50 Appendix Table 7: Population, Canada, Provinces and Territories ..................................... 52 Appendix Table 8: Estimated Average Educational Attainment Using LFS data,
Canada, Provinces and Territories, 1990-2014 ............................................................... 57 Appendix Table 9: Expected Years of Schooling, Canada, Provinces and Territories ....... 58 Appendix Table 10: GNI, Canada, Provinces and Territories, 1981-2014 .......................... 59

6
Appendix Table 11: Life Expectancy Dimension Data and Calculations, Canada,
Provinces and Territories, 1990, 2000, and 2005-2014 .................................................. 61 Appendix Table 12: Average Educational Attainment Dimension Data and
Calculations, Canada, Provinces and Territories, 1990, 2000, and 2005-2014 .............. 63
Appendix Table 13: Expected Years of Schooling Dimension Data and Calculations,
Canada, Provinces and Territories, 1990, 2000, and 2005-2014 .................................... 65 Appendix Table 14: Education Index Based on 2011 HDR Consistent Estimates,
Canada, Provinces and Territories, 1990, 2000, and 2005-2014 .................................... 67 Appendix Table 15: Income Dimension Data and Calculations, Canada, Provinces
and Territories, 1990, 2000, and 2005-2014 ................................................................... 68 Appendix Table 16: Human Development Index Based on 2011 HDR Consistent
Estimates, Canada, Provinces and Territories, 1990, 2000, and 2005-2014 ................... 71 Appendix Table 17: International Rankings from 2014 HDR with Provinces and
Territories Inserted on an Individual Basis, HDI and Component Indicators, 2014 ....... 72

7
The Human Development Index in Canada: Ranking the Provinces and Territories
Internationally, 2000-2014
Executive Summary
The Human Development Index (HDI) is an internationally recognized measure of
socio-economic well-being. It is a composite index composed of three dimensions: life
expectancy, education and income. In the most recent Human Development Report (HDR)
produced by the United Nations Development Program, life expectancy is measured by life
expectancy at birth, education is measured by average educational attainment and expected
years of schooling, and income is measured by Gross National Income (GNI) per capita.
Although the HDI is by no means a comprehensive measure of human development, it is a
substantial improvement over the standard income-based metrics.
Canada falls into an impressive ninth place in the international 2014 HDI rankings
published in the most recent HDR. However, this ranking hides significant regional
variations among the Canadian provinces and territories. This report aims to calculate an
internationally comparable HDI for each of the Canadian provinces and territories in order
to evaluate their respective levels of human development relative not only to each other
and the Canadian average, but also to the rest of the world.
To estimate the provincial and territorial HDIs, the Centre for the Study of Living
Standards (CSLS) employs data sources that allow a breakdown by province and territory
and used the methodology of the most recent HDR to replicate the estimates:
In terms of the HDI, Alberta ranked first among the provinces and
territories in 2014 and Nunavut last;
For life expectancy, British Columbia was the top jurisdiction and
Nunavut again ranked last;
For average educational attainment, Yukon ranked first while Nunavut
ranked last;
For expected years of schooling, Quebec ranked at the top and
Nunavut came in last;
For GNI per capita, the Northwest Territories ranked first and Prince
Edward Island came last.

8
Using internationally comparable index values for the Canadian provinces and
territories, we can then rank the provinces against the index values of other countries. Of
the 188 countries in the most recent HDR rankings, Canada’s provinces and territories
ranked between:
Fourth and 46th place in overall HDI;
Sixth and 103rd
in life expectancy;
First and 35th
in average educational attainment;
14th
and 107th
in expected years of schooling;
Third and 34th
in GNI per capita.
Although most Canadian provinces and territories achieve impressive ranks in the
international context, evidently Canada’s overall HDI masks substantial variation among
the different regions. For example, according to overall HDI Canadians living in Alberta
enjoy a quality of life similar to that of Switzerland or Denmark while Canadians in
Nunavut face a quality of life similar to Latvia or Croatia.
All provinces and territories experienced improvements in the HDI between 2000
and 2014, with the HDI in advancing between 0.3 per cent per year and 0.6 per cent per
year. The two jurisdictions with the greatest improvement were Newfoundland and
Labrador and Nunavut, which experienced HDI growth of 0.58 per cent per year and 0.50
per cent per year respectively. This fast growth boosted Newfoundland and Labrador from
eleventh to sixth place among the Canadian provinces and territories. On the other hand,
despite its rapid HDI growth, Nunavut remained the lowest ranked jurisdiction in both
2000 and 2014.
There is some evidence of convergence in the HDI as three of the regions with the
highest HDI in 2014 (Alberta, Ontario, and British Columbia) had below average growth
in the HDI between 2000 and 2014, while the three bottom ranked regions (Nunavut,
Prince Edward Island, and New Brunswick) had above average growth in the HDI.

9
The Human Development Index in Canada: Ranking the Provinces and Territories
Internationally, 2000-20141
Introduction
The Human Development Index (HDI) is an internationally recognized measure of
socio-economic well-being. It was first published by the United Nations Development
Program (UNDP) in 1990 and estimates of the HDI have been released on an annual basis
ever since.2 The HDI has become a popular tool, particularly because its simple structure
facilitates international comparisons of human development and well-being. The most
recent Human Development Report contains HDI estimates for 188 of the 193 member
countries of the United Nations.
Canada falls into an impressive ninth place in the international HDI rankings of the
2015 Human Development Report (HDR), which reports results up to 2014. However, this
ranking glosses over regional variations among the Canadian provinces and territories. An
earlier CSLS research report by Hazell et al. (2012) calculated an internationally
comparable HDI for the provinces and territories in order to compare their respective
levels of human development not only with each other and the Canadian average, but also
with the rest of the world. This report reprises the work of Hazell et al. to update their
findings.
This report is divided into three major sections. In the first section, the Human
Development Index is discussed. Next, the Centre for the Study of Living Standards
(CSLS) replicates the estimates for Canada in the three dimensions of the HDI (life
expectancy, education and income) published in the most recent HDR. The difficulties in
precisely matching these numbers are also discussed. Finally, the provincial and territorial
HDIs are calculated for the 2000-2014 period and the ranking results are discussed. These
estimates as well as estimates for the pre-2000 period for all variables are provided in the
Appendix Tables at the end of this paper.
1 The author is an economist at the CSLS. Comments on the report are welcome and should be sent to
Andrew Sharpe at [email protected] or James Uguccioni at [email protected]. The CSLS
thanks the Government of Alberta for financial assistance for data development. 2 All of the twenty-five annual HDR reports, containing estimates for HDI in each respective year, are
available on the UNDP website. The most recent report is available at http://hdr.undp.org/en/2015-report.

10
I. The Human Development Index
In the past two decades, the HDI has become a common tool for evaluating the
level of human development in a country or a region. Its popularity has arisen for two main
reasons. First, it captures more elements which encompass quality of life than standard
income measures do, namely education and life expectancy. In this sense, it presents a
broader measure of human development than GDP per capita or other common measures
of income and consumption. Second, it is relatively easy to calculate and has minimal data
requirements, allowing it to be calculated for many developing countries. Thus, it is
particularly useful for international comparisons of human development and well-being.
However, this measure of human development is not without its weaknesses. Its
primary failing is that it only considers three elements of economic well-being: education,
life expectancy and income. It does not take into account other critical elements of well-
being such as income inequality, gender inequality, morbidity, political freedom, civil
liberties, corruption, pollution, or economic security. To address this shortcoming, the
most recent HDR supplements its HDI estimates with additional information on human
development, including estimates of an Inequality-adjusted HDI, a Gender Development
Index, a Multidimensional Poverty Index and data on environmental sustainability, human
development effects of environmental threats, and perceptions about well-being and the
environment, in addition to more detailed health and education statistics. Indeed, the
authors of the HDR reports emphasize that the HDI alone is not a complete description of
human development.
Still, the HDI is a very useful tool, particularly because it is easily understood and
widely used owing to its simple structure. Moreover, the UNDP is a high profile
organization with significant reach across the world. As noted, the HDI is a composite
index composed of three dimensions: life expectancy, education, and income. In the most
recent HDR, life expectancy is measured by life expectancy at birth, education is measured
by average educational attainment in years and expected years of schooling, and income is
measured by Gross National Income (GNI) per capita. Exhibit 1, taken from the 2011
HDR, illustrates the fundamental structure of the HDI.
Exhibit 1: Structure of the Human Development Index
Before estimating the provincial and territorial HDIs, it is important to understand
not only how the HDI is constructed, but also how the most recent HDR differs from
Source: UNDP (2011: 167)

11
earlier reports. This is particularly important because the 2010 report instituted major
changes in how the HDI is calculated in response to the concerns of researchers in
economic development.3
The HDI estimates in the most recent HDR are calculated in the following manner.
First, the estimates for the life expectancy, average educational attainment, expected years
of schooling and GNI per capita data for each country are scaled into indices using the
following equation:
The maximum and minimum values for each dimension are taken from the most recent
HDR, and follow a simple rationale. The minimum values are based on the concept of
subsistence, that is, they are set at the lowest value needed in that indicator for a society to
function, or, in the case of income, the lowest value in recorded history. The maximum
values are set as “aspirational goals” which allow for this standardization to take place.4
The life expectancy index calculation is a straightforward application of equation
(1), while the income index requires taking the natural logarithm (ln) of each income
statistic before applying it in equation (1). The education index is slightly more
complicated to calculate, as it involves creating two sub-indices and then combining them
to create the dimension index. The two education sub-indices are constructed for mean
years of schooling and expected years of schooling, respectively, using equation (1). The
education index is then created by taking the arithmetic mean of the two sub-indices.
Notably, prior to the 2014 HDR the education index was created by taking the geometric
mean of the two sub-indices and rescaling the number that results by using the maximum
and minimum values listed for this purpose in the technical notes of the HDR (e.g. the
technical notes of the 2013 HDR).5
The HDI itself is calculated as the geometric mean6 of the three indices already
discussed, i.e.:
3 For critiques of earlier versions of the HDI, see Srinivasan (1994), Sagar and Najam (1998) and McGillivray (1991). As
a result of the changes, HDI estimates presented in HDR reports from 2010 onwards are not comparable to those
published in previous HDR reports, but represent an improvement in methodology in many respects. Naturally, the
current methodology has been used to generate estimates prior to 2010 which are comparable to the current methodolgy. 4 Life Expectancy: minimum=20.0 years based on long-run historical evidence from Maddison (2010) and Riley (2005),
maximum=85.
Education: minimum=0 years for both average educational attainment and expected years of schooling since survival is
possible without education, maximum=15 years for average educational attainment and maximum=18.0 years for
expected years of schooling.
Income (PPP adjusted 2011 US$): maximum= $75,000 per capita as Kahneman and Deaton (2010) showed that there is
essentially no gain in human development and well-being beyond an annual income of $75,000, minimum= $100.
For more information see Technical notes in the most recent HDR 5 Available at: http://hdr.undp.org/sites/default/files/hdr_2013_en_technotes.pdf .
6 A geometric mean is calculated by multiplying n numbers and then taking the nth root of that product. The HDI used to
be calculated with an arithmetic mean (or average), which is the sum of n numbers divided by n. This was changed
because geometric means allow less substitutability between measures or dimension indices, so poor performances in one

12
This results in a number between 0 and 1, where 1 represents the highest possible human
development score. A country achieves a score of 1 only if it matches the highest observed
outcomes to date in all categories. The highest HDI score for 2014 belongs to Norway
(0.944), and the lowest belongs to Niger (0.348) (Appendix Table 17).
This methodology of the post-2010 HDR reports departs from prior reports in three
main ways.
First, the education index is constructed using average educational attainment and
expected years of schooling, instead of literacy and the gross enrolment rate (which
combines primary, secondary and tertiary enrolment rates), to offer a more
complete picture of education.
Second, income per capita is measured by GNI per capita instead of Gross
Domestic Product (GDP) per capita. This switch occurred because GDP measures
the amount produced in a country without capturing where the income from this
production goes. In contrast, GNI reflects the income of the residents of a country
regardless of where the income is generated, and is therefore a better measure of
domestic purchasing power than GDP.
Finally, the geometric mean has replaced the arithmetic mean for calculating the
overall index. This reduces the substitutability of improvements across measures,
so a country cannot linearly trade off performing poorly in one dimension by
performing well in another. In other words, a country cannot receive a very high
human development score without impressive scores in all dimensions.
One criticism that remains of the HDI is the arbitrarily determined equal weights
applied to each dimension. Lind (2010) instead proposes a Calibrated Human
Development Index (CDI) that employs revealed preferences to justify the weights applied
to each dimension, and in doing so better reflects the relative roles of education and
consumption in determining quality of life. However, the CDI is tailored to accurately rank
highly developed countries, and in that way is not as useful for international comparisons
as the original HDI.
dimension is not linearly compensated for by better performances in other dimensions. For more information, see
http://hdr.undp.org/en/statistics/hdi/.

13
II. Replicating the most recent HDR’s Estimates for Canada
In order to develop an internationally comparable HDI for the Canadian provinces
and territories, the CSLS sought to employ methodologies and data sources that were as
consistent as possible with those used in the most recent HDR. We use Statistics Canada
data that have national, provincial, and territorial estimates for each indicator, and used
these data first to replicate the official HDI results for Canada and then to develop
estimates for the provinces and territories using the same methodology. This section will
outline the process of replicating the most recent HDR official estimates for life
expectancy, education (which includes both average educational attainment and expected
years of schooling) and income for Canada. The difficulties in precisely matching the most
recent HDR results are also discussed.
A. Life Expectancy
In the most recent HDR, Canada’s life expectancy at birth was estimated to be 82.0
years for 2014, which ranked at 12th
place internationally. The source given for the HDR’s
estimate is the World Population Prospects Database (United Nations Department of
Economic and Social Affairs (UNDESA), 2015), which states that life expectancy at birth is
“based on official estimates of life expectancy available through 2009,” where “the age
pattern of mortality is based on life tables through 2007 from the Human Mortality
Database.”
Table 1: Life Expectancy at Birth, Canada, 1980, 1990, 2000-2014
Year UNDP – HDR Statistics Canada
1980 75.0 75.2
1990 77.2 77.6
2000 79.1 79.4
2001 - 79.6
2002 - 79.7
2003 - 79.9
2004 - 80.2
2005 80.1 80.4
2006 80.3 80.8
2007 80.5 80.9
2008 80.6 81.0
2009 80.8 81.4
2010 81.0 81.6
2011 81.2 81.8
2012 81.3 82.0
2013 81.5 82.2
2014 82.0 82.4 Sources: The UNDP - HDR data taken from the International Human Development Indicators website
(http://hdr.undp.org/en/69206). Statistics Canada data from CANSIM Table 102-0025 for 1980 and 1990, Table 102-0511 for 2000-2006; Table 102-0512 for 2007-2009; the italicized values (2010-2014) are estimated by the CSLS by applying
the compound annual growth rate for 1991-2009 (0.25 per cent) to each year. Note: Statistics Canada modified their life expectancy at birth methodology to include three years of data with CANSIM Table 102-
0512. An annual time series can be derived from these data.

14
Statistics Canada’s official estimates of annual Canadian life expectancy are
available for 1979-2009, and they are very similar to the estimates in the most recent HDR,
as shown in Table 1. While the two estimates differ due to rounding, the possibility of
minor data revisions by Statistics Canada since the data were extracted by UNDESA, and
the forecasting methods employed by UNDESA after 2009, the differences are miniscule.
Both sets of estimates show that Canada had a life expectancy of around 82 years in 2014
(Table 1).7
B. Education
As mentioned earlier, the HDR reports following 2010 differ from all earlier
reports in that the education indicators employed to generate the education index are
average and expected years of schooling, instead of literacy and gross enrolment rates.
These new measures of education are used because they offer a more complete picture of
education. However, the estimates of average years of schooling, calculated using the
Barro and Lee (2010) methodology, are difficult to replicate. In addition, the most recent
HDR extrapolates expected years of school estimates from 2002 to generate their 2014
value. Although these new measures of education may represent an improvement in
theory, employing them makes the HDI’s results difficult to replicate and the official
estimates in the most recent HDR may not accurately reflect the situation of Canada’s
educational attainment in 2014.
i. Average Educational Attainment
Overall, Canada performs well in the category of average educational attainment
relative to many other nations. According to the most recent HDR, Canadians aged 25 and
over have obtained, on average, 13.0 years of schooling, or sixth place in the international
rankings for this measure. This estimate of average years of schooling updates the Barro
and Lee (2010) estimates using UNESCO (United Nations Educational, Scientific and
Cultural Organization) Institute for Statistics data on educational attainment. The HDR
estimates for 1980, 1990, 2000, 2005, and 2010 to 2014 are presented in Table 2.8
Although Barro and Lee (2010) do not describe how average educational
attainment is calculated for Canada specifically, their general methodology is
straightforward. They first multiply the duration of each schooling level in years by the
proportion of individuals in different age brackets that have achieved that level as their
highest level of schooling, where “level of schooling” refers to primary, secondary and
tertiary (or post-secondary) schooling levels.9 The age brackets used for the average
education of those 25 and older are defined by 5 year intervals (i.e. 25-29, 30-34) until age
74, with the final age category being 75 and older. Summing these results across schooling
levels for each age group yields the average schooling level for each age group. The
7 CSLS’s projected estimate of 82.4 years for 2014, which is estimated using historical growth rates, is 0.4 years above
the most recent HDR’s estimate (82.0 years). Inserting CSLS’s estimate into the most recent HDR international life
expectancy rankings would move Canada into eighth place, instead of its actual ranking of ninth place. 8 In 2014, Barro and Lee last revised their estimates for average years of schooling in 2010. The revised dataset estimates
that average educational attainment in Canada was 12.3 years in 2010. 9 Specifically, 8 years for those with at most a primary education, 12 years for those with at most a secondary education,
and 14 years for those with at most tertiary schooling.

15
average educational attainment for the entire population is then calculated by adding
together these age group average educational attainments once they have been weighted by
the share of that age group in the total population aged 25 and older.
Table 2: Estimated Average Educational Attainment, Canada, Persons aged 25 and over, 1980-2014
Year UNDP – HDR LFS data
1980 9.8 -
1990 10.0 10.5
2000 11.0 11.9
2005 12.2 12.2
2010 12.7 12.5
2011 13.0 12.5
2012 13.0 12.5
2013 13.0 12.6
2014 13.0 12.6 Notes: CSLS allocates 8 years for those with at most primary, 12 years for those with at most secondary and 14 years for those with
tertiary schooling.
Sources: LFS data underlying the CSLS calculation from CANSIM Table 282-0004; HDR estimates can be found on the International Human Development Indicators website (http://hdr.undp.org/sites/all/themes/hdr_theme/country-notes/CAN.pdf).
To develop an estimate of average years of schooling, the CSLS aggregates data on
all educational attainment categories to create three broad schooling level categories, and
allocates individuals into these categories according to the highest level of schooling they
have attained, similar to what is done in Barro and Lee (2010). Individuals are considered
to have attained a certain level of schooling only if they have a certificate or diploma
indicating that they have completed that program. For example, an individual is placed in
the secondary school category if they have a high school diploma or certificate but no
certificates, diplomas or degrees from any further education, such as a university degree,
regardless of whether they attended a post-secondary institution or not.10
Individuals are
placed in the primary schooling category if they do not have a high school certificate or
diploma or if they have no formal education.11
However, an earlier publication by the same authors (Barro and Lee, 2001), which
performs almost identical calculations, does state that duration data vary between countries
and are taken from the UNESCO (United Nations Educational, Scientific and Cultural
Organization) statistical year book for various years. Examining the data on duration of
10
Calver (2015) discusses some of the issues with this methodology. First, there is the issue of completion of a degree –
if an individual begins but does not complete some post-secondary program, none of their schooling is counted. Second,
there is the issue of underassigning tertiary schooling. For example, suppose the most common form of post-secondary
school in Country A is a two year program but in Country B it is a more rigorous four year program. If the two countries
have the same completion rates for tertiary education, then Barro and Lee would estimate the same average educational
attainment in the two countries. This is likely an issue in Canada, where 2011 National Household Survey data shows
that 25.9 per cent of the population aged 25 to 64 had completed a university degree of some sort (corresponding to 15
years of schooling minimum). Calver uses microdata on the number of years an individual spent in school to avoid this
problem. While this is likely not possible for the UNDP to do on a global scale, a better measure could use the sort of
tertiary schooling completed (e.g. certificate, Bachelor’s, Masters) to avoid the latter source of mismeasurement. 11
In 2014, Labour Force Survey data indicate that 15.2 per cent of Canadians aged 25 and over had not graduated from
high school (in the primary schooling category, allocated 8 years of schooling), 24.9 per cent had graduated from high
school or had attended some post-secondary schooling without completion (in the secondary schooling category,
allocated 12 years), and 59.9 per cent had earned a post-secondary certificate or diploma or university degree (in the
tertiary schooling category, allocated 14 years).

16
schooling available from the UNESCO Institute for Statistics (UIS) yields the following
duration data for Canada: primary is 6 years, secondary adds another 6 years and post-
secondary (tertiary) adds another 2 years.
It is therefore difficult to determine how many years of education should be
allocated to those with at most primary schooling (i.e. those who did not complete
secondary school). Although primary schooling is listed as lasting 6 years in UNESCO’s
1999 Statistical Yearbook, schooling is mandatory in Canada up to at least the age of 16,
for a total of 10 years (excluding kindergarten). Thus, 6 years of schooling allocated to
those who do not complete high school will grossly underestimate their years of schooling.
As recently as the 1970s, however, the school leaving age was still 15 in some provinces,
so there are still some in the Canadian population today who have received no more than 8
years of formal schooling, ignoring the kindergarten years (Oreopoulos, 2006). Indeed,
according to the LFS data, 17.1 per cent of those aged 65 and over had eight or fewer years
of schooling in 2015. Therefore, the CSLS allocates those with at most the primary level of
schooling 8 years of education. Secondary and tertiary education are more straightforward,
and the years allocated follow the UIS duration data: those with at most secondary
schooling are allocated 12 years, and those with tertiary are assumed to have 14 years of
schooling.
The estimates of average years of schooling are presented in Table 2. The LFS-
based CSLS estimates are surprisingly quite similar to those in the most recent HDR,
reflecting the small share of Canadians who did not finish high school in the overall
population. For the majority of the period, the LFS-based estimates are marginally higher
than the corresponding HDR estimate, however in 2014 the HDR estimate of average
years of schooling is 0.4 years higher than the LFS estimate.12
As average educational attainment is sensitive to the duration assumptions for each
schooling level, it is worth checking the sensitivity of the results to alternate assumptions.
One important test is to assign those with at most primary education 6 years of schooling,
in line with UNESCO’s definition, instead of the more realistic 8 years assumed by CSLS.
When those with at most primary education are assigned 6 years of schooling, the data
from the census gives estimates of 11.1 years in 2001 and 11.9 years in 2006 for those 25
and older. The LFS data similarly yield estimates of 11.4 years in 2000, 11.8 years in
2005, 12.2 years in 2011, and 12.3 years in 2014. These estimates are much closer to the
results of Barro and Lee (2014) than are the first set of CSLS estimates: 12.2 years in 2011
from LFS exceeds Barro and Lee’s estimate (12.1 years) by only 0.1 years. Since the
assumption of 6 years of primary education is not realistic given the Canadian context,
CSLS will employ the original assumption of 8 years.
The validity of CSLS’s estimates is confirmed by Cohen and Soto (2007). This
paper estimates average years of schooling by employing data from surveys published by
UNESCO and from an OECD database on educational attainment. Despite using the same
UNESCO data source as Barro and Lee for their schooling duration assumptions, their
12 If the CSLS estimate using LFS data for Canada in 2014 (12.6 years) is inserted into the most recent HDR
international rankings for average years of schooling, Canada would be in eighth place instead of ranking third.

17
results for Canada exceed those of both the CSLS and Barro and Lee for all available data
years (11.7 years in 1990, 12.6 years in 2000, and 13.2 years in 2010).13
Along with the
higher estimates in the revised Barro and Lee dataset, this raises the concern that the most
recent HDR may be overestimating Canada’s average years of schooling relative to the rest
of the world, although this issue is not directly relevant to this report. More importantly,
although the CSLS results are not identical to Barro and Lee’s results, it is clear that the
CSLS estimates are not unreasonable or inconsistent with the literature.
ii. Expected Years of Schooling
UNESCO Institute for Statistics (UIS) (2009) defines school-life expectancy, or
expected years of schooling, as the “total number of years of schooling which a child of a
certain age can expect to receive in the future, assuming that the probability of his or her
being enrolled in school at any particular age is equal to the current enrolment ratio for that
age.” Thus, school-life expectancy is simply the sum of the enrolment rates of each age in
a population, where the enrolment rate of a certain age is defined as the number of people
of that age enrolled in formal schooling divided by the total population of that same age.
Canada’s expected years of schooling for 2014 in the most recent HDR is 15.9
years, which places Canada in 26th
place in the most recent HDR rankings for this
indicator. The most recent HDR cites UNESCO as its data source for this measure. The
HDR simply uses data on enrolment rates by age. The methodology used by the UNDP for
estimating school life expectancy is described in the UIS Educational Indicators:
Technical Guidelines (UIS, 2009), and this methodology will be followed here.
Unfortunately, the enrolment data for each age year are not publicly available in
Canada. Thus two sets of estimates of expected years of schooling will be calculated using
different data sources. The first will use administrative data on enrolment from Statistics
Canada, and the second will employ school attendance estimates from the Labour Force
Survey (LFS) for the population aged 15-29.
For the first set of estimates of expected years of schooling, administrative data on
enrolment for 1996-2009 are taken from various versions of Summary Public School
Indicators for Canada, the Provinces and Territories, a Statistics Canada publication. It
should be noted that kindergarten students are included in this enrolment data, and cannot
be separated out. Thus, this measure of expected years of schooling includes kindergarten
while all other education measures (including expected years of schooling using LFS data)
calculated in this paper do not. College and university enrolment data are taken from
Statistics Canada’s CANSIM database. The enrolment rate data can be seen in Appendix
Table 7.
The CSLS calculates expected years of schooling by dividing the enrolment
numbers for certain levels of education (primary and secondary, college, and university)
by the total population of the age group most likely to be in that level of schooling
13 Data from Cohen and Soto (2007) can be found at http://soto.iae-csic.org/Data.htm.

18
(primary and secondary, including one year of kindergarten: 5-17 years old and university
and college: 18-22 years old) to obtain the enrolment rate. It is assumed that enrolment
below age 5 and above age 22 is zero.14
For Canada in 2013, the most recent year for
which enrolment rates for all schooling levels are available, primary and secondary school
enrolment was 99.9 per cent of all those covered by the sample, college enrolment was
31.3 per cent, and university enrolment was 54.5 per cent.
These enrolment rates are then multiplied by the duration of each level (primary
and secondary: 13 years (including one year of kindergarten), college: 2 years, university:
4 years) to obtain expected years of schooling. This method is by no means perfect, as
many adults over age 22 enroll in secondary school or register in college or university
programs and many students do not complete their programs. However, due to data
limitations, this is the best approximation available.
It should be noted that the primary and secondary school enrolment data are only
for publicly funded schools (including adult high schools), which account for
approximately 93 per cent of Canadian students (Brockington, 2009). The exclusion of
private school students results in lower enrolment rates in the primary and secondary
school years and biases the estimates for expected years of schooling downwards.
The second set of estimates of expected years of schooling employs LFS data.15
The LFS captures data on whether an individual is attending school (either full-time or
part-time) during the regular school year (September to June) and organizes these data by
age instead of level of education. Since LFS data on student status are only available for
those aged 15-29 and the current school-leaving age is at least 16 in all Canadian provinces
and territories, the assumption is made that 100 per cent of individuals between the ages of
6 and 14 attend school and zero per cent are enrolled below the age of 6. Enrolment over
age 29 is also assumed to be zero due to lack of data beyond this age.
14
Naturally, if 85.8 per cent of individuals aged 18-22 are enrolled in some form of education, assuming the
enrollment rate falls to zero at 23 is unrealistic. As such, our estimates ought to be understood to be lower
bound. Our administrative estimates are purely for the sake of comparison. 15 Expected years of schooling using LFS data is calculated using the data in Table 3. First, the per cent of people in
school for each age group in a given year is multiplied by the number of years that age group represents (ie 15-19 is 5
years, 20-24 is 5 years and 25-29 is 5 years). These numbers are summed to obtain the expected year of schooling after
age 15. Second, nine years are added to t his number to approximate 100 per cent enrolment between ages 6-14
(inclusive), yielding the expected years of schooling for a child born in that year. For Canada in 2011, the calculation is
as follows: Step 1: (5*0.837) + (5*0.419) + (5*0.142) =6.99. Step 2: 6.99 +9=15.99. Thus, Canada's expected years of
schooling result in 2011 is 15.99, rounded to 16.0 years.
19
Table 3: School Attendance by age group, Canada, 2000-2014
Year
Ages 15-19 Ages 20-24 Ages 25-29
Number
of
Students
Population % in
school
Number
of
Students
Population % in
school
Number
of
Students
Population % in
school
2000 1,685.7 2,046.9 82.4 757.2 2,021.2 37.5 247.0 2,023.5 12.2
2001 1,715.7 2,063.5 83.1 788.2 2,054.8 38.4 269.0 2,020.5 13.3
2002 1,716.3 2,074.3 82.7 807.8 2,086.3 38.7 271.9 2,032.0 13.4
2003 1,707.0 2,078.7 82.1 824.6 2,119.2 38.9 278.9 2,044.9 13.6
2004 1,715.4 2,092.6 82.0 856.2 2,150.9 39.8 284.9 2,068.1 13.8
2005 1,752.2 2,121.3 82.6 891.9 2,176.6 41.0 288.0 2,092.9 13.8
2006 1,784.3 2,151.8 82.9 876.4 2,194.2 39.9 292.5 2,125.5 13.8
2007 1,795.6 2,173.4 82.6 882.3 2,204.6 40.0 292.8 2,164.1 13.5
2008 1,800.3 2,192.3 82.1 866.4 2,210.9 39.2 297.7 2,211.6 13.5
2009 1,827.1 2,198.0 83.1 885.4 2,226.3 39.8 307.6 2,259.5 13.6
2010 1,835.8 2,191.3 83.8 938.4 2,252.4 41.7 313.1 2,293.7 13.7
2011 1,825.5 2,178.6 83.8 951.6 2,286.9 41.6 321.7 2,309.8 13.9
2012 1,799.0 2,153.9 83.5 1,012.4 2,336.0 43.3 321.7 2,327.9 13.8
2013 1,793.0 2,118.9 84.6 1,013.2 2,378.3 42.6 329.7 2,342.9 14.1
2014 1,753.2 2,076.0 84.5 1,013.2 2,398.1 42.3 317.2 2,366.4 13.4
Note: Number of students and population are given in thousands.
Source: CANSIM Table 282-0095. Territory data obtained by special request from Statistics Canada. Territorial values
for 2012-2014 estimated using compound annual growth rate from 1992 to 2011 for Yukon, 2001 to 2011 for the
Northwest Territories, and 2004 to 2011 for Nunavut.
Ideally, the number of individuals of each age (i.e. 15, 16, 17 …) attending school
would be used. However, these data are not publicly available from the LFS, which instead
has attendance by age brackets. One problem with this method is that calculating expected
years of schooling using a wide age bracket (i.e. 15-29) assumes that each age has a
relatively similar number of individuals. Using narrower age brackets available from the
LFS (15-19, 20-24 and 25-29) mitigates concerns about the age range’s distributions of
individuals. When the in-school rates for these three age brackets are multiplied by the
number of years they represent (5 years each) and summed together, they represent the
expected years of schooling remaining for someone aged 15 years of age and over. Adding
nine to this number (to represent the 100 per cent enrolment from ages 6 to 14) yields the
expected years of schooling.
Table 3 outlines the LFS data for those aged 15-29. In 2014, it is clear that the large
majority (84.5 per cent) of youth aged 15-19 are in school, while the opposite is true for
individuals aged 25-29 (just 13.4 per cent are in school). Not surprisingly, the 20-24 age
group lies between these two extremes, with 42.3 per cent in school in 2011. These series
have shown a slight upward trend since 2000.

20
Table 4: Expected Years of Schooling, Canada, 1980, 1990, and 2000-2014
Year UNDP – HDR LFS data Administrative Data
1980 15.6 - -
1990 16.7 14.8 -
2000 15.8 15.6 15.2
2001 - 15.7 15.2
2002 - 15.7 15.2
2003 - 15.7 15.2
2004 - 15.8 15.3
2005 15.9 15.9 15.2
2006 15.9 15.8 15.2
2007 15.9 15.8 15.2
2008 15.9 15.7 15.4
2009 15.9 15.8 15.6
2010 15.9 16.0 15.7
2011 15.9 16.0 15.7
2012 15.9 16.0 15.8
2013 15.9 16.1 -
2014 15.9 16.0 - Sources: LFS data calculated using CANSIM Table 282-0095, HDR data can be found on the International Human Development
Indicators Website (http://hdr.undp.org/en/content/expected-years-schooling-children-years),
The estimates of expected years of schooling using LFS data are presented in Table
4. The most recent HDR relies on UNESCO data (UNDP, 2015b). The CSLS estimates
based on LFS data are closer to UNESCO’s estimates in 2000 and 2005 than the CSLS
estimates based on administrative data. Our LFS-based estimate is 15.6 versus UNESCO’s
15.8 in 2000, and 15.9 years in 2005 compared to UNESCO’s 15.9. CSLS’s 2014 estimate
using LFS data is also quite similar to the HDR estimate for 2014: 16.0 and 15.9 years
respectively.
It is worth noting, however, that the most recent estimate available from UNESCO
(2015) using the source provided in the HDR technical notes (UNDP, 2015b) for school-
life expectancy is, surprisingly, for 2000.16
Although all other indicators used in the HDI
are projected forward in some way to obtain an estimate for 2014, the HDR assumes no
growth after 2000 for expected years of schooling. The assumed lack of growth in this
education measure from 2000 to 2014 may not accurately reflect the evolution of Canada’s
skill base, especially since some growth is observed in the LFS and administrative data
estimates by CSLS. However, CSLS’s estimates show that the growth in this indicator has
been slow in recent years due to relatively stable enrolment rates in primary and secondary
schools and colleges, so the error is likely small.
16
Specifically, data on Canadian primary and secondary school enrollment from UNESCO is available until
2000 and from 2004 to 2013, but data on Canadian tertiary enrollment is only provided until 2000.

21
C. Income
In the most recent HDR, Canada’s Gross National Income (GNI) per capita for
2014 is $42,155 in purchasing power parity (PPP) adjusted 2011 US dollars, the 20th
highest of all nations with an HDI ranking. The most recent HDR uses GNI estimates and
population data from the UN Statistical Division National Accounts Main Aggregates
Database. While the GNI estimates match those reported by Statistics Canada, the
population figures are slightly different. For the years lacking GNI estimates when the
UNDP extracted data, projections were developed using information from the IMF’s
World Economic Outlook publications.
National accounts estimates from Statistics Canada state that in 2014 Canada’s
GNI per capita was $54,674 in current Canadian dollars. This nominal GNI is then
deflated by the gross final domestic expenditure implicit price index (2011=100), and
adjusted by Canada’s PPP in 2011.17
This PPP adjustment simply translates constant 2011
Canadian dollars into a common unit used in international comparisons (2011 US dollars)
so that the cost of a representative basket of goods in Canada will be the same as in the
United States, given the exchange rate.18
Canada’s GNI estimate for 2011 in 2011 US PPP
adjusted dollars is $36,058. This estimate does differ somewhat from the projection used in
the HDI, which is $35,166 (Table 5).19
Table 5: GNI per capita, PPP adjusted 2011 US dollars, Canada, 1990, 2000, 2005-2014
Year
UNDP – HDR CSLS
PPP adjusted
2011 USD
Current
dollars
Gross final domestic
expenditure, implicit
price index 2011=100
2011 constant
CAD
PPP adjusted
2011 USD
1990 29,231 24,122 67.8 35,585 29,749
2000 34,567 34,979 81.0 43,160 35,779
2005 38,660 43,048 89.1 48,327 41,465
2006 39,794 45,083 91.2 49,421 42,601
2007 40,150 47,139 93.4 50,486 43,418
2008 39,988 48,986 95.7 51,184 44,070
2009 38,343 45,804 96.5 47,443 40,184
2010 39,049 47,910 97.9 48,962 41,471
2011 41,333 50,561 100.0 50,561 42,825
2012 41,539 51,520 101.7 50,668 43,017
2013 41,887 53,040 103.3 51,362 43,555
2014 42,155 54,674 105.6 51,774 44,008
Sources: CSLS: Current dollar from CANSIM Table 380-0083, Implicit Price Index from CANSIM 380-0102,
Canada’s PPP for GDP in 2011 was 0.847 US dollars per Canadian dollar (PPP from CANSIM table 380-0058).
17
While GNI and GNP are equivalent in current prices, we note that in constant prices they are not (except in
the base year). Nominal GNI is deflated with the gross final domestic expenditure deflator to obtain real
GNI, while nominal GNP is deflated with the GDP deflator to obtain real GNP. The UNDP uses the GDP
deflator to deflate GNI, which appears inconsistent with the definition of GNI. 18
Canada’s PPP for GDP in 2011 was 0.847 US dollars per Canadian dollar (PPP from CANSIM table 380-
0058). 19
Employing the estimate our GNI estimate in the most recent HDR’s GNI rankings increases Canada’s
ranking from 20th
to 16th
place.

22
D. Overall Human Development Index
Table 6 presents the results from the CSLS’s attempt to replicate the 2014 HDI
estimate for Canada. The CSLS is able to closely replicate both the life expectancy index
and the income index. CSLS estimates the 2014 Canadian life expectancy index to be
0.960 compared to that from 2014 HDR data of 0.954. Similarly, using the 2014 GNI per
capita projection from CSLS yields an income index of 0.919, compared to 0.913 used in
the most recent HDR. While the largest discrepancy was found in the education index due
to the average educational attainment component, here too it was reasonably close: 0.875
for the HDR compared to 0.862 by the CSLS. Altogether, these indices lead to an HDI
(0.913) that is equal when rounded to the third decimal place to the official estimate of the
2015 HDI for Canada (0.913). As such, the insertion of the CSLS HDI estimate for 2015
would not change Canada’s eighth place ranking whatsoever.
Table 6: CSLS Replication of the Official Human Development Index Estimate for Canada, 2014
Dimension UNDP – HDR
CSLS estimates
CSLS
Proportion of
HDR
estimates (%)
A B C = B / A
Life Expectancy Index 0.954 0.960 100.6
Life Expectancy at Birth (years) 82.0 82.4 100.5
Education Index 0.875 0.862 98.5
Average Educational Attainment
(years) 13.0 12.6
96.9
Average Educational Attainment
Index 0.867 0.840
96.9
Expected Years of Schooling 15.9 16.0 100.6
Expected Years of Schooling Index 0.883 0.883 100.0
Income Index 0.913 0.919 100.7
GNI per capita (2011 US PPP adjusted
dollars) 42,155 44,008
104.4
HDI 0.913 0.913 99.9
Notes: For "UNDP - HDR", CSLS uses the data listed in the most recent HDR and calculates the indices and
HDI identically to the other column.
Source: CSLS estimates from Table 1, 2, 3, 5 and most recent HDR.

23
III. Estimates of the Human Development Index for the Canadian Provinces and Territories
Though we do come quite close, it is clear from the previous section that it is not
possible to precisely replicate the estimates of the HDI indicators for Canada using
Canadian data sources. As a result, directly calculating each province and territory’s HDI
using the raw estimates developed by the CSLS is not the most exact estimation strategy.
To obtain estimates which are the most internationally comparable for the provinces and
territories, we take the proportion that each province and territory’s estimate represents of
the corresponding Canadian estimate and applying that ratio to Canada’s most recent HDR
official estimates.
To obtain the proportions needed to develop the internationally comparable
estimates, the provincial and territorial estimates are developed using the same
methodology and data sources used in replicating Canada’s HDI in the previous section.
This reduces as much as possible any error arising from using the proportion method of
estimating the provincial and territorial HDIs. Therefore, this section will estimate the
three components of the HDI (life expectancy, education and income) for each Canadian
province or territory in a manner that is as consistent as possible with the most recent
HDR. The HDI results and rankings for each province will then be discussed.20
A. Life Expectancy
The life expectancy data for the provinces and territories are taken from the same
Statistics Canada table as that for Canada, and are only available up to 2009. CSLS
developed estimates for 2010-2014 by employing the historical growth rates of life
expectancy in each province and territory from 1991 to 2009 (Appendix Table 1). While
extending any series five years forward is not ideal, because life expectancy moves slowly
and steadily over time we do not believe it is a large source of error.
Table 7 shows these raw CSLS estimates in addition to the HDR consistent
estimates and the resulting life expectancy index for 2000, 2005, 2011, and 2014. It is
notable that the spread between the lowest and highest life expectancy decreased between
2000 (12.7 years) and 2014 (10.7 years). This decreased variation is largely caused by the
4.9 year increase in the average life expectancy of Nunavut between 2000 and 2014.
Despite this relatively large improvement, Chart 1 illustrates that in 2014, Nunavut still
had by far the lowest life expectancy of all the regions. For this year, this territory’s life
expectancy was estimated to be 72.7 years, which was 4.6 years lower than the next lowest
jurisdiction (Yukon, 77.3 years).
20
Due to data limitations, this report will focus on the period 2000 to 2014 when discussing trends over time.
Full time series on all of the HDI domains are available in the Appendix Tables. Caution should be taken
when interpreting education data for the Territories because of the small sample size involved.

24
Table 7: Life Expectancy Estimates and Index, Canada and the Provinces/Territories, 1990, 2000, 2011, and 2014
Year CAN NL PEI NS NB QC ON MB SK AB BC YT NWT NU
Raw Estimates (years)
2000 79.4 77.3 78.2 78.6 78.8 79.2 79.5 78.1 78.6 79.5 80.5 75.6 75.9 67.8
2005 80.4 78.2 79.8 79.3 79.8 80.4 80.7 79.0 79.3 80.3 81.2 77.0 78.0 72.0
2009 81.4 79.4 79.9 80.2 80.1 81.5 81.7 79.3 79.7 80.8 82.3 76.7 77.4 71.6
2014 82.4 80.2 80.9 81.0 80.8 82.7 82.8 79.8 80.2 81.6 83.4 77.3 77.9 72.7
HDR Consistent Estimates (years)
2000 79.1 77.0 77.9 78.3 78.5 78.9 79.2 77.8 78.3 79.2 80.2 75.3 75.6 67.5
2005 80.1 77.9 79.5 79.0 79.5 80.1 80.4 78.7 79.0 80.0 80.9 76.7 77.7 71.7
2011 81.2 79.1 79.7 79.9 79.8 81.4 81.5 78.9 79.3 80.5 82.1 76.4 77.0 71.5
2014 82.0 79.7 80.5 80.6 80.4 82.3 82.3 79.4 79.7 81.1 83.0 76.9 77.5 72.3
Life Expectancy Index
2000 0.909 0.877 0.891 0.897 0.900 0.906 0.911 0.889 0.897 0.911 0.926 0.851 0.856 0.731
2005 0.925 0.891 0.915 0.908 0.915 0.925 0.929 0.903 0.908 0.923 0.937 0.873 0.888 0.796
2011 0.942 0.909 0.918 0.922 0.920 0.944 0.946 0.906 0.912 0.931 0.956 0.867 0.877 0.792
2014 0.954 0.919 0.930 0.932 0.929 0.958 0.959 0.913 0.919 0.941 0.969 0.876 0.884 0.804
Source: CANSIM Table 102-4307 for 2005-2007 for YT, NU and NWT (2005-2007 average for 2005 and 2006, 2007-2009
average for 2007, 2008, and 2009), CANSIM Table 102-0025 for 1979-1990 for all series, CANSIM Table 102-0025 for 1991-
1999 for NU and NWT, CANSIM Table 102-0511 for 1991-2006 for all series, CANSIM Table 102-0512 for 2007-2009 for all
ten provinces.
The growth rates for the provinces and territories ranged between 0.14 to 0.50 per
cent per year over the 2000-2014 period. The three jurisdictions with the fastest growth
were Nunavut (0.50 per cent per year), Quebec (0.31 per cent per year), and Ontario (0.29
per cent per year) (Chart 2). As nearly two thirds of Canada’s population resides in Ontario
and Quebec, their high rates of growth in life expectancy result in the national growth rate
exceeding 10 provinces and territories.
Chart 1: Life Expectancy, Raw Estimates, Canada and the Provinces/Territories, 2014
72.7
77.3 77.9
79.8 80.2 80.2 80.8 80.9 81.0 81.6
82.4 82.7 82.8 83.4
66.0
68.0
70.0
72.0
74.0
76.0
78.0
80.0
82.0
84.0
86.0
Ye
ars
25
Table 8 shows the ranking of the provinces and territories (where 1 is the highest
performing province in that indicator) for 2000, 2005, 2011, and 2014. Most of the
provinces and territories maintained the same relative position between 2000 and 2014; for
example, Nunavut was 13th
for all three years and British Columbia remained the top
province. The province that fell the most in the rankings was Saskatchewan, from sixth to
ninth place. This was reflected in the compound annual growth rates, as Saskatchewan had
the worst growth rates of all thirteen regions (Chart 2). On the other hand, despite the very
rapid growth in life expectancy between 2000 and 2014, Nunavut continued to lag behind
the other provinces and territories.
Chart 2: Compound Annual Growth in Raw Estimates of Life Expectancy, per cent per year, Canada and the
Provinces/Territories, 2000-2014
Examining the rankings of the regions’ life expectancies in the 2011 HDR
international rankings highlights the discrepancies between the regions. Table 8 reports the
rankings of the provinces and territories from entering each (alone) into the international
rankings as if it were a country. British Columbia, the top Canadian province or territory,
would rank sixth, while Nunavut, the lowest ranking province or territory, would be in
103rd
place.
Table 8: Life Expectancy Rank, Canada and the Provinces/Territories, 2000, 2005, 2011, and 2014
Year CAN NL PEI NS NB QC ON MB SK AB BC YT NWT NU
Regional Rank (Based on Raw Estimates)
2000 - 10 8 6 5 4 2 9 6 2 1 12 11 13
2005 - 10 5 7 5 3 2 9 7 4 1 12 11 13
2011 - 10 6 7 5 3 2 8 9 4 1 12 11 13
2014 - 8 6 5 7 3 2 10 9 4 1 12 11 13
2014 International HDR Rank (Based on HDR Consistent Estimates)
2014 12 33 29 28 30 10 10 35 33 21 6 47 43 103
Note: The "2014 International HDR Rank" is based on inserting that province alone into the most recent HDR international
rankings as if it were a country.
0.14 0.15 0.16 0.18 0.18 0.18 0.22
0.24 0.25 0.26 0.27 0.29 0.31
0.50
0.00
0.10
0.20
0.30
0.40
0.50
0.60
Ave
rage
pe
r ce
nt
chan
ge p
er
year

26
B. Education
i. Average Years of Education
Average educational attainment for the provinces and territories is calculated using
LFS data (Appendix Table 8). It is calculated in exactly the same manner as described for
Canada, allocating 8 years for those with at most primary education, 12 years for those
with at most secondary and 14 for those who have a tertiary education. The resulting
estimates are reported for 2000, 2005, 2011, and 2014 in Table 9.
Examining the raw estimates for average educational attainment, the gap between
the lowest and highest average educational attainment estimates were similar in 2000 (1.5
years) and 2014 (2.1 years). The primary reason for this widening of the gap was due to
Nunavut’s slow growth in educational attainment, which was 0.7 years lower than the
second lowest province or territory in 2000 (Newfoundland and Labrador, 11.4 years),
slipping to be 1.4 years lower than the next lowest province or territory in 2014
(Newfoundland and Labrador, 12.3 years). These values translate into rankings between
first and 35th
place in the most recent HDR international rankings for every region.
Table 9: Average Educational Attainment Estimates and Index, Canada and the Provinces/Territories, 2000,
2005, 2011, and 2014
Year CAN NL PEI NS NB QC ON MB SK AB BC YT NWT NU
Raw Estimates (years)
2000 11.9 11.4 11.5 11.8 11.6 11.6 12.1 11.7 11.7 12.2 12.2 12.2 12.2 10.7
2005 12.2 11.8 12.0 12.1 11.9 12.0 12.3 12.0 12.0 12.4 12.4 12.5 11.9 10.3
2011 12.5 12.1 12.3 12.4 12.1 12.3 12.6 12.3 12.3 12.6 12.7 12.5 12.2 10.9
2014 12.6 12.3 12.4 12.5 12.3 12.4 12.7 12.4 12.4 12.7 12.7 13.0 12.5 10.9
HDR Consistent Estimates (years)
2000 11.1 10.6 10.7 11.0 10.8 10.8 11.2 10.9 10.9 11.3 11.4 11.3 11.3 9.9
2005 12.3 11.8 12.1 12.2 11.9 12.1 12.4 12.1 12.1 12.5 12.5 12.6 12.0 10.3
2011 12.3 11.9 12.1 12.2 11.9 12.1 12.4 12.1 12.1 12.4 12.5 12.3 12.0 10.8
2014 13.0 12.7 12.8 12.9 12.7 12.9 13.1 12.8 12.8 13.1 13.2 13.4 12.9 10.9
Average Educational Attainment Index
2000 0.740 0.707 0.714 0.733 0.718 0.721 0.749 0.728 0.724 0.755 0.757 0.755 0.755 0.663
2005 0.820 0.789 0.804 0.812 0.797 0.806 0.828 0.804 0.805 0.833 0.832 0.837 0.800 0.690
2011 0.820 0.794 0.808 0.810 0.794 0.808 0.827 0.806 0.806 0.827 0.832 0.821 0.799 0.718
2013 0.867 0.845 0.854 0.863 0.848 0.857 0.873 0.851 0.855 0.873 0.877 0.893 0.859 0.748
Source: CANSIM Table 282-0004. Territorial data obtained by special request from Statistics Canada. Territorial values for
2012-2014 based on compound annual growth rate of available data for each territory (1991-2011 for Yukon, 2001-2011 for the
Northwest Territories, 2004-2011 for Nunavut).21
LFS data are not available for Nunavut before 2004. Since there is no clear
pattern in the yearly growth rates for Nunavut, estimate for 2000 (italicized) is assumed to be equal to the 2004 estimate.
21
In 2014, the Yukon is ranked first overall in large part due to its rapid growth from 1991 to 2011. Were we
to take a more recent subperiod like 2000 to 2011 for the basis of our extrapolation, average educational
attainment in the Yukon would be 12.6 years, dropping its ranking among the provinces to fourth.

27
Chart 3: Average Educational Attainment, Raw Estimates, Canada and the Provinces/Territories, 2014
Table 10 also shows the ranking of each province and territory within Canada.
There is some change between 2000 and 2014 in terms of rankings among the different
provinces and territories. The rank of average educational attainment in the Northwest
Territories has declined significantly since 2000, dropping from third to sixth place.
Quebec and Ontario, conversely, improved their relative position (ninth to seventh, and
fifth to fourth place respectively). British Columbia, Alberta, and Yukon are consistently
among the top provinces and territories, while New Brunswick, Newfoundland and
Labrador, and Nunavut are consistently in the bottom four throughout the period.
Chart 4: Compound Annual Growth in Average Educational Attainment, per cent per year, Canada and the
Provinces/Territories 2000-2014
There is some evidence that provinces and territories are converging in average
educational attainment by the growth rates for 2000-2014 despite slow growth in Nunavut,
which are illustrated in Chart 4. Chart 3 and Chart 4 show British Columbia and Alberta
were among the top ranked provinces in 2014 but were also among the regions with the
slowest growth (less than 0.35 per cent per year), while Newfoundland and Labrador and
Prince Edward Island had compound annual growth rates that were above the national
average (0.39 per cent per year) despite a low ranking among the provinces and territories.
The Northwest Territories and Nunavut were the exceptions, as they had both lower ranks
in 2014 and the weakest compound annual growth rates of all Canadian regions.
10.9
12.3 12.3 12.4 12.4 12.4 12.4 12.5 12.5 12.6 12.7 12.7 12.7 13.0
9.0
10.0
11.0
12.0
13.0
14.0 Y
ear
s
0.11 0.17
0.29 0.31 0.35 0.37 0.39
0.42 0.44 0.44 0.46 0.48 0.52 0.53
0.00
0.10
0.20
0.30
0.40
0.50
0.60
Ave
rage
pe
r ce
nt
chan
ge p
er
year
28
Table 10: Average Educational Attainment Rank, Canada and the Provinces/Territories, 2000, 2005, 2011, and
2014
Year CAN NL PEI NS NB QC ON MB SK AB BC YT NWT NU
Regional Rank (Based on Raw Estimates)
2000 - 12 11 6 10 9 5 7 8 2 1 4 3 13 2005 - 12 8 5 11 6 4 9 7 2 3 1 10 13 2011 - 11 7 5 12 6 3 9 8 2 1 4 10 13 2014 - 12 9 5 11 7 4 10 8 3 2 1 6 13
2014 International HDR Rank (Based on HDR Consistent Estimates)
2014 3 13 11 5 13 6 1 11 6 1 1 1 6 35
Note: The "2014 International HDR Rank" is based on introducing that province alone into the most recent HDR international
rankings as if it were a country.
ii. Expected Years of Schooling
Expected years of schooling are estimated for the provinces and territories using
LFS data. Once again, the methodology used here is the same as the one used to replicate
the Canadian estimates (Appendix Table 9). In 2014, the raw estimate for Canada is nearly
identical to the official estimate from the most recent HDR, and as such there ought to be
minimal error as a result of scaling the raw provincial values in Table 11 to obtain HDR
consistent estimates.
Table 11: Expected Years of Schooling Estimates and Index, Canada and the Provinces/Territories, 2000, 2005,
2011, and 2014
Year CAN NL PEI NS NB QC ON MB SK AB BC YT NWT NU
Raw Estimates (years)
2000 15.6 15.7 15.1 15.7 14.9 15.7 15.9 15.0 15.1 14.8 15.6 13.9 14.5 13.1
2005 15.9 15.7 15.3 15.6 15.3 16.1 16.2 15.5 15.1 14.9 15.7 13.8 14.1 13.3
2011 16.0 15.5 15.5 15.7 15.3 16.4 16.2 15.3 15.1 15.0 15.9 14.3 14.6 12.8
2014 16.0 15.7 15.9 15.7 15.2 16.7 16.2 15.3 15.3 15.1 15.6 14.4 14.7 12.8
HDR Consistent Estimates (years)
2000 15.8 15.9 15.3 15.9 15.1 15.9 16.1 15.2 15.3 15.0 15.8 14.1 14.7 13.3
2005 15.9 15.8 15.3 15.6 15.4 16.1 16.3 15.5 15.2 15.0 15.7 13.8 14.1 13.3
2011 15.9 15.5 15.4 15.6 15.2 16.3 16.2 15.3 15.0 15.0 15.9 14.2 14.6 12.7
2014 15.9 15.6 15.7 15.6 15.1 16.6 16.1 15.2 15.2 15.0 15.5 14.2 14.6 12.6
Expected Years of Schooling Index
2000 0.878 0.883 0.851 0.883 0.837 0.885 0.893 0.842 0.848 0.836 0.880 0.781 0.816 0.737
2005 0.883 0.875 0.852 0.866 0.853 0.896 0.903 0.861 0.843 0.832 0.872 0.768 0.785 0.740
2011 0.883 0.859 0.855 0.869 0.845 0.907 0.897 0.849 0.833 0.831 0.881 0.790 0.810 0.707
2014 0.883 0.865 0.875 0.867 0.841 0.924 0.894 0.845 0.844 0.831 0.860 0.787 0.811 0.700
Source: CSLS calculations using CANSIM Table 282-0095. Territorial data obtained by special request
from Statistics Canada. Territorial values for 2012-2014 estimated using compound annual growth rate for
available territorial data (1991 to 2011 for Yukon, 2001 to 2011 for the Northwest Territories, and 2004 to
2011 for Nunavut). LFS data are not available for Nunavut before 2004. Since there is no clear pattern in the
yearly growth rates, estimate for 2000 (italicized) is assumed to be equal to the 2004 estimate.

29
An examination of these raw estimates shows that roughly one year and a half
separates the lowest and highest ranking provinces in both 2000 and 2014 (from 15.1 years
to 16.7 years), with all three territories consistently ranking below the lowest province
throughout the period. The similarity in expected years of schooling across provinces is
illustrated for 2014 in Chart 5. The highest expected years of schooling in 2014 was in
Quebec at 16.7 years, closely followed by Ontario (16.2 years).22
Compared to average educational attainment, there was less movement in the
regional rankings between 2000 and 2014 for this measure of education (Table 12).
Quebec and Ontario remained in the top two positions, while the three territories occupied
the bottom three places between 2000 and 2014. None of the provinces changed their
relative position by more than three places in the time frame. It is noteworthy that the top
and bottom regions in 2014 are not the same for average educational attainment and
expected years of schooling. Indeed, Alberta was in third place for the former and tenth
place for the latter, while Newfoundland and Labrador was twelfth for the former and fifth
place for the latter in 2014. In both 2000 and 2014, all three territories were in the bottom
three places for expected years of schooling. As average educational attainment reflects the
current population’s level of education and expected years of schooling estimates in part
the future level of schooling, it could be the case that we will see a reversal of educational
attainment levels down the road. However, it may also be the case that the educated tend to
migrate to certain provinces instead of others, and this results in observed average
educational attainment estimates.
Chart 5: Expected Years of Schooling, Raw Estimates, Canada and the Provinces/Territories, 2014
The growth rates indicate that the gap in expected years of schooling over time
between the top and bottom ranked regions is increasing (Chart 6). Nunavut was the lowest
ranked region in 2000 and experienced significant negative growth from 2000 to 2014,
while Quebec, the second ranked province in 2000, experienced the highest growth of all
22
In 2014, the LFS shows that 48.8 per cent of the population aged 15 to 29 in Quebec was attending school,
compared to the Canadian average of 44.6 per cent. The respective figures for the 15-19 age group were 86.9
per cent versus 84.5 per cent, for the 20-24 age group 49.6 per cent versus 42.3 per cent, and for the 25-29
age group 18.3 per cent versus 13.4 per cent.
12.8 14.4 14.7 15.1 15.1 15.3 15.3 15.6 15.7 15.7 15.9 16.0 16.2 16.7
0.0
3.0
6.0
9.0
12.0
15.0
18.0
Ye
ars

30
provinces. However, other than these two regions, there does not seem to be significant
positive or negative correlation between the regions’ ranking and their growth rate.
Table 12: Expected Years of Schooling Rank, Canada and the Provinces/Territories, 2000, 2005, 2011, and 2014
Year CAN NL PEI NS NB QC ON MB SK AB BC YT NWT NU
Regional Rank (Based on Raw Estimates)
2000 - 4 6 3 9 2 1 8 7 10 5 12 11 13 2005 - 3 8 5 7 2 1 6 9 10 4 12 11 13 2011 - 5 6 4 8 1 2 7 9 10 3 12 11 13 2014 - 5 3 4 9 1 2 7 8 10 6 12 11 13
2014 International HDR Rank (Based on HDR Consistent Estimates)
2014 26 33 29 33 46 14 23 50 43 49 35 65 55 107
Note: The "2014 International HDR Rank" is based on introducing that province alone into the most recent HDR international
rankings as if it were a country.
Since many developed countries are clustered around the same values for expected
years of schooling in the most recent HDR international rankings, the provinces and
territories are remarkably spread out in terms of ranking considering how close their
estimates are in absolute terms. Indeed, while Quebec would be in 14th
place, Nunavut
would be 107th
.
Chart 6: Compound Annual Growth in Expected Years of Schooling, per cent per year, Canada and the
Provinces/Territories, 2000-2014
-0.15
-0.03 -0.01
0.01
0.10 0.10 0.12 0.15 0.16 0.17 0.18
0.25
0.34
0.45
-0.40
-0.30
-0.20
-0.10
0.00
0.10
0.20
0.30
0.40
0.50
Ave
rage
pe
r ce
nt
chan
ge p
er
year
31
C. Income
In the most recent HDR, the indicator for the income dimension is GNI per capita.
Unfortunately, Statistics Canada has not developed a GNI measure for the Canadian
provinces and territories despite measuring it for the Canadian economy on the whole.23
The best way to approximate this income measure is to adjust provincial and territorial
GDP by the national difference observed between nominal GNI and GDP in that year
(Canada’s GNI was 98.2 per cent of Canada’s GDP in 2011).24
Once a province or
territory’s GDP is adjusted by the national nominal GDP to GNI ratio, population
estimates are used to obtain GNI per capita.25
The raw estimates for 2000, 2005, 2011, and
2014 are presented in Table 13. It should be noted that there are no purchasing power
parity (PPP) data available to correct for price differences across Canada, so one dollar is
assumed to buy the same amount of goods in all provinces. 26
For example, when
comparing food prices in Nunavut with the CPI Food Price Basket from Statistics Canada,
the Nunavut Bureau of Statistics (2015) found that in general, Nunavummiut pay around
twice as much as Canadians for the same basket of goods. It may well be unrealistic to
ignore regional price differences altogether, but without PPP data by region no other
assumptions can be reasonably made to try and capture variations in purchasing power.
23
This is largely a matter of accounting difficulties. The difference between GNI and GDP is income earned
by residents abroad less income earned by non-residents domestically. At the provincial level it is more
difficult to identify what income is sent “abroad” (i.e. out of province). Statistics Canada would have to
somehow account for workers who cross a provincial border to work in another province, as well as a
company paying dividends or servicing debt in one province but doing business across the country. 24
Nominal GNI is by definition equal to nominal GNP, which is equal to GDP plus net production from non-
residents. However, real GNI is not equal to real GNP, except in the base year. See Ross and Murray (2010)
for a greater discussion. 25
It is worth noting that the GDP to GNI ratio almost certainly differs significantly across the country.
Provinces such as Newfoundland and Labrador with its oil wells have significant amounts of income earned
in the province by corporations located out of province. 26
Thomas (2016) does provide an alternative to making no adjustment whatsoever. She uses a Statistics
Canada series on the consumer price level in the provincial capital cities to roughly estimate purchasing
power differences across provinces. While this is an alternative, it exclusively looks at consumer prices, and
altogether ignores the prices faced by firms. For example, the prices faced by the Albertan oil firms who
earned an extremely significant portion of the province’s income would not be included in the price
adjustment. Rather than introduce more assumptions, we opt not to adjust our GNI figures whatsoever.
32
Unlike the other indicators that make up the HDI, there is quite substantial
variation in estimated GNI per capita between provinces and territories, ranging from
$24,804 (current dollars) to $65,810 in 2000 and $41,071 to $107,572 in 2014.27
The
Northwest Territories, the top ranking province or territory, has nearly triple the estimated
GNI per capita of Prince Edward Island, the lowest ranking one (Chart 7).
27
One could use real GDP estimates instead of nominal GDP estimates to estimate provincial GDP per
capita as a share of the national average. We, however, prefer nominal estimates as they capture terms of
trade effects.
Table 13: Gross National Income per capita Estimates and Income Index, Canada and the Provinces/Territories, 2000, 2005, 2011, and
2014
Year CAN NL PEI NS NB QC ON MB SK AB BC YT NWT NU
Raw Estimates (current dollars)
2000 35,925 26,797 24,804 27,280 27,741 31,298 38,708 30,420 34,030 48,911 33,325 41,405 65,810 32,366
2005 43,949 43,259 30,834 34,254 34,158 36,951 44,431 36,563 45,182 67,876 41,674 49,281 102,417 38,268
2011 51,537 63,879 37,657 39,866 41,693 43,051 49,741 45,551 70,166 79,025 48,184 70,392 108,733 59,481 2014 55,510 63,345 41,071 41,466 42,482 45,048 52,785 50,051 73,760 91,183 51,136 70,370 107,572 68,924
Raw Estimates (2011 PPP adjusted USD)
2000 34,759 24,355 24,394 26,781 27,601 30,948 38,246 30,186 32,267 42,427 32,510 39,095 62,959 31,890
2005 40,156 36,592 28,173 31,654 31,379 34,756 41,474 33,687 40,119 57,860 37,632 44,812 100,471 36,044
2011 42,309 48,232 31,904 33,857 34,728 35,820 41,582 37,793 52,168 62,625 39,756 57,821 96,323 49,673
2014 44,198 54,418 32,651 33,592 34,616 36,373 42,007 40,169 61,986 70,576 40,606 57,481 84,018 54,204
HDR Consistent Estimates (2011 PPP adjusted US dollars)
2000 35,567 24,922 24,961 27,404 28,243 31,667 39,135 30,887 33,017 43,413 33,265 40,003 64,423 32,632
2005 38,660 35,228 27,123 30,474 30,210 33,461 39,929 32,432 38,624 55,704 36,229 43,142 96,727 34,701
2011 41,333 47,119 31,168 33,076 33,927 34,994 40,623 36,922 50,965 61,180 38,839 56,487 94,102 48,527
2014 42,155 51,902 31,142 32,040 33,016 34,692 40,065 38,312 59,121 67,314 38,729 54,824 80,134 51,698
Income Index
2000 0.887 0.834 0.834 0.848 0.852 0.870 0.902 0.866 0.876 0.917 0.877 0.905 0.977 0.874
2005 0.900 0.886 0.846 0.864 0.863 0.878 0.905 0.873 0.900 0.955 0.890 0.916 1.000 0.884 2011 0.910 0.930 0.867 0.876 0.880 0.885 0.907 0.893 0.942 0.969 0.901 0.957 1.000 0.934
2014 0.913 0.944 0.867 0.872 0.876 0.884 0.905 0.899 0.964 0.984 0.900 0.953 1.000 0.944
Source: CANSIM Table 384-0038 for GNI, PPP from CANSIM Table 380-0058, and Appendix Table 7a for population.
33
Chart 7: GNI per capita, current dollars, Raw Estimates, Canada and the Provinces/Territories, 2014
Chart 8: Compound Annual Growth in Nominal GNI per capita, per cent per year, Canada and the
Provinces/Territories, 2000-2014
Looking at the provinces and territories’ placements in the most recent HDR
international rankings, there is not surprisingly a substantial difference between the ranks
of the top and bottom regions. The Northwest Territories would claim the third overall
spot, while Prince Edward Island is in just 34th
place (Table 14).
0
20,000
40,000
60,000
80,000
100,000
120,000 C
urr
en
t d
olla
rs
2.49 2.90
3.27 3.32 3.44 3.49 3.87 3.99 4.00
4.29
5.13
6.13 6.25 6.86
0.00
1.00
2.00
3.00
4.00
5.00
6.00
7.00
8.00
Ave
rage
pe
r ce
nt
chan
ge p
er
year

34
Table 14: Gross National Income per capita Rank, Canada and the Provinces/Territories, 2000, 2005, 2011, and
2014
Year CAN NL PEI NS NB QC ON MB SK AB BC YT NWT NU
Regional Rank (Based on Raw Estimates)
2000 - 12 13 11 10 8 4 9 5 2 6 3 1 7 2005 - 6 13 11 12 9 5 10 4 2 7 3 1 8 2011 - 5 13 12 11 10 7 9 4 2 8 3 1 6 2014 - 6 13 12 11 10 7 9 3 2 8 4 1 5
2014 International HDR Rank (Based on HDR Consistent Estimates)
2014 20 13 34 34 32 23 22 22 8 6 21 10 3 13
Note: The "2014 International HDR Rank" is based on introducing that province alone into the most recent HDR international
rankings as if it were a country.
D. Overall Human Development Index
As previously noted, since the CSLS’s methods and Canadian data sources result in
estimates of the HDI that are not exactly equal to those in the most recent HDR, the CSLS
takes the ratio of each jurisdiction’s raw estimate to the national raw estimate and applies it
to the most recent HDR’s official estimates for Canada in order to obtain an internationally
comparable HDI estimate for the region. This method results in provincial and territorial
estimates that are compatible with the most recent HDR while still representing the same
relationship as is shown between the raw CSLS estimates for the provinces/territories and
Canada.
Table 15: Human Development Index, Canada and the Provinces/Territories, 2000, 2005, 2011, and 2014
Year CAN NL PEI NS NB QC ON MB SK AB BC YT NWT NU
HDI Estimates (Based on HDR Consistent Estimates)
2000 0.867 0.835 0.835 0.850 0.842 0.859 0.877 0.846 0.852 0.873 0.873 0.839 0.869 0.765
2005 0.892 0.869 0.862 0.870 0.867 0.884 0.899 0.869 0.876 0.902 0.892 0.863 0.901 0.795
2011 0.900 0.887 0.872 0.879 0.872 0.895 0.905 0.875 0.889 0.908 0.903 0.874 0.900 0.808
2014 0.913 0.905 0.887 0.889 0.882 0.910 0.915 0.886 0.910 0.924 0.912 0.886 0.901 0.836
Source: CSLS Calculations.
The CSLS’s HDI estimates for Canada and the provinces/territories are given for
2000, 2005, 2011, and 2014 in Table 15. The provincial and territorial ranking for 2014 is
illustrated in Chart 9. Alberta was found to have the highest HDI of all regions or
jurisdictions, while Ontario and the British Columbia came in second and third. Nunavut
and New Brunswick held the bottom two spots for 2014, though Nunavut was quite a bit
lower than New Brunswick.

35
Chart 9: Human Development Index, Canada and the Provinces/Territories, 2014
Given the relative stability in provincial and territorial rank observed within
Canada for most jurisdictions in most indicators, it is not surprising to see little variation in
the provincial and territorial HDI rank over time (Table 16). Alberta, Ontario, British
Columbia, and Quebec were in the top five places throughout the 2000 to 2014 period. The
only province or territory that changed rank significantly was Newfoundland and
Labrador, which rose from 11th
place in 2000 to seventh in 2014 as its income per capita
increased dramatically. Notably, the Northwest Territories fell steeply from 2nd
in 2005 to
6th
in 2014.
Table 16: Human Development Index Rank, Canada and the Provinces/Territories, 1990, 2000, 2011, and 2014
Year CAN NL PEI NS NB QC ON MB SK AB BC YT NWT NU
Regional Rank (Based on Raw Estimates)
2000 - 11 12 7 9 5 1 8 6 3 2 10 4 13 2005 - 8 12 7 10 5 3 9 6 1 4 11 2 13 2011 - 7 12 8 11 5 2 9 6 1 3 10 4 13 2014 - 7 10 9 12 4 2 11 5 1 3 8 6 13
2014 International HDR Rank (Based on HDR Consistent Estimates)
2014 9 16 23 22 25 12 8 23 12 4 11 23 16 40
Note: The "2014 International HDR Rank" is based on introducing that province alone into the most recent HDR international
rankings as if it were a country.
Newfoundland and Labrador experienced the fastest growth between 2000 and
2014, well above the national average (0.58 versus 0.37 per cent per year), followed
closely behind by Nunavut (0.50 per cent per year) (Chart 10). The Northwest Territories
had the worst performance, at 0.31 per cent year, while Ontario and British Columbia were
not far from the bottom. There may be some evidence of convergence in HDI as two of the
regions with the highest HDI in 2014 (Ontario and British Columbia) had below average
growth in HDI, while two of the bottom three ranked regions (Nunavut, Prince Edward
Island) had above average growth in HDI.
0.821
0.882
0.886 0.887
0.889 0.889
0.905 0.907
0.910
0.910
0.912
0.913 0.915
0.924
0.760
0.780
0.800
0.820
0.840
0.860
0.880
0.900
0.920
0.940 H
DI

36
Chart 10: Compound Annual Growth Rate in the HDI, per cent per year, Canada and the Provinces/Territories,
2000-2014
Examining the provincial performance in the most recent HDR international
rankings, Alberta, places well above all other provinces and territories, coming in fourth
place (Table 16). This implies that these provinces had levels of human development
below Switzerland (third highest HDI in the world), but higher than Denmark and the
Netherlands (fourth and fifth respectively). Nunavut, on the other hand, comes in 46th
place in the international HDI rankings, showing a similar level of human development as
Croatia and Latvia. It is also important to understand why Alberta is the top ranking
region, and Nunavut is the lowest ranking one. Given the small differences between
provinces and territories in the scaled education indicators, it is clear that these differences
are primarily driven by differences in life expectancy and income.
IV. Future Research with the Human Development Index
The HDI occupies a critical area in research into socio-economic well-being,
thanks in large part to the global reach of the UNDP. The UNDP undertakes the herculean
task of obtaining estimates from national statistics agencies from 188 countries to create
the HDR and rank countries in terms of socio-economic well-being. These national
statistics agencies vary significantly in the range and quality of data they produce, so the
use of four key summary statistics in the HDI makes production of the HDR a more
feasible task. Moreover, the inclusion of other components in a development index would
make it less transparent for policymakers, as well as run the risk of being criticized for
which components are included and which are not. Providing more sophisticated,
alternative indices which capture concepts such as gender and income inequality is the best
way to provide a more nuanced picture of the level of economic development in a given
country, as the UNDP does in every HDR.
0.31 0.31 0.31 0.32 0.33 0.34 0.37
0.41 0.42 0.42 0.44 0.47
0.50
0.58
0.00
0.10
0.20
0.30
0.40
0.50
0.60
0.70
Ave
rage
pe
r ce
nt
chan
ge p
er
year

37
While HDI does a commendable job measuring socio-economic well-being, it does
have several major drawbacks in terms of its construction. Presently, the index is quite
capable of differentiating between advanced economies and developing economies, but has
a difficult time differentiating levels of development among economies which are closer in
their levels of development. One of the primary issues with its ability differentiating
between developed economies is both of the measurements of education employed.
The HDI measures average educational attainment by using statistics on the highest
level of education completed. It assigns 8 years for completing primary education only, 12
for completing secondary education only, and 14 for having completed some form of
tertiary education. By measuring education completed rather than years of schooling, there
is a definite issue with individuals who successfully completed part of a degree. As
suggested by Calver (2015), a better measure would simply use number of years of
schooling. While this method results in underestimating the average number of years of
schooling because it systematically fails to count some successful years of schooling, it
will not affect the integrity of the HDI rankings assuming that completion rates for degrees
are similar in similar countries.28
A much more consequential source of measurement error with average educational
attainment is assessing 14 years of education to those who have completed some form of
tertiary education. For example, if one country has a most of its students complete two
year certificates whereas another country has most of its students complete four year
Bachelor’s degrees, the HDI’s measurement will underestimate the latter country’s average
educational attainment. In the advanced economies, this is especially an issue as most now
have secondary school completion rates well above 90 per cent. A better measure of
average educational attainment could still use the degree completed metric, but focus more
on the level of degree individuals have completed (e.g. a degree requiring 4 years of study
versus 2 years of study). We acknowledge that adding too many different sorts of tertiary
education is unrealistic because of the number of national statistics agencies the UNDP
deals with, however we believe that breaking tertiary education into three sorts of post-
secondary education is realistic. We suggest that the average educational attainment metric
should include: a “certificate completed” category for all those who complete a
qualification below the level of a Bachelor’s degree (equal to 14 years of education
completed); an “undergraduate degree completed” value for all those who complete a
qualification at the Bachelor’s level (equal to 16 years of education completed); and finally
a “postgraduate degree completed” for all those who complete a qualification beyond the
Bachelor’s level (equal to 18 years of education completed).29
28
Differential degree completion rates should not matter when comparing two countries with completely
different education profiles. For example, suppose the completion rate of tertiary education is much higher in
South Africa than Canada. Ranking Canadian estimated average years of education versus South Africa will
not be much of an issue simply because individuals undertaking tertiary education in South Africa
(regardless of completion) is a much smaller proportion of their population as a whole. Differential
completion rates could be a far greater issue when comparing two similar countries, such as Canada and the
United Kingdom, however we have no a priori reason to believe they differ much in similar countries. 29
Admittedly there is still an issue with unmeasured quality differences among the sorts of tertiary schooling
received at these levels in different countries. While this is an issue, we believe its influence on HDI rank is

38
Another issue with the measurement of education in the HDR is its use of
UNESCO enrolment data in constructing the expected years of schooling. Canadian
tertiary school enrolment data is not available from UNESCO, and has not been available
since 2000. While the problem is not endemic to the UNESCO enrolment data, and most
of the advanced economies have data to 2013 or 2014, it is still rather embarrassing that a
G7 country’s HDI relies on data over a decade old. Whether the burden to resolve the
problem lies on Statistics Canada, UNESCO, or the UNDP, the solution should be
relatively easy using the LFS microdata as we did in this paper. As mentioned in Section
II, using LFS data to estimate Canada’s expected years of education yields an estimate
which differs very little from the UNESCO estimate.
Finally, from the perspective of Canadian researchers who endeavour to estimate
HDI for the provinces (or to do any work comparing the provinces internationally for that
matter), we strongly advocate that Statistics Canada create PPP and GNI estimates for a
Canadian dollar in individual provinces and territories. The cost of living for provincial
capitals solution proposed by Thomas (2016) will suffice in the meantime to provide a
purchasing power adjustment for studies dealing solely with consumer data, however at the
moment there is no solution we are aware of once producers are included in the data. The
measurement of GNI by province and territory is crucial for the measurement of HDI in
jurisdictions like Newfoundland and Labrador due to dividends being paid out to residents
of other provinces, creating a significant gap between GNI and GDI.
V. Conclusion
This report has estimated internationally comparable HDIs for Canada and its
provinces and territories. A summary of the provincial and territorial rankings for HDI and
its component indicators within Canada is presented in Table 17. In 2014, Alberta held the
top of the table for the overall HDI and Nunavut the lowest. For life expectancy, British
Columbia was the top body and Nunavut ranked last. For average educational attainment,
Yukon ranked first and Nunavut last. For expected years of schooling, Quebec ranked at
the top and Nunavut came last, while for GNI per capita, Northwest Territories was in first
place and Prince Edward Island was in last.
Table 17: Summary of Regional Rankings for the Canadian Provinces/Territories, 2014
Dimension NL PEI NS NB QC ON MB SK AB BC YT NWT NU
Life Expectancy 8 6 5 7 3 2 10 9 4 1 12 11 13
Average Educational Attainment 12 9 5 11 7 4 10 8 3 2 1 6 13
Expected Years of Schooling 5 3 4 9 1 2 7 8 10 6 12 11 13
GNI per capita 6 13 12 11 10 7 9 3 2 8 4 1 5
HDI 7 10 9 12 4 2 11 5 1 3 8 6 13
minor because countries already near each other in rank due to the other components of HDI are likely to
provide similar quality of schooling (e.g. Canada and Australia).

39
HDI growth in the provinces and territories from 2000-2014 ranged between 0.31
per cent per year and 0.58 per cent per year, lead by Newfoundland and Labrador and
Nunavut, where HDI grew the fastest of all provinces and territories at 0.58 and 0.50 per
cent per year respectively. This rapid growth was reflected in Newfoundland and
Labrador’s rise in the rankings from eleventh to sixth place. On the other hand, despite its
fast HDI growth, Nunavut was still the lowest ranked jurisdiction in 2014. There is some
evidence of convergence in regional HDI as provinces with the highest HDI in 2014 had
below average HDI growth during the 2000 to 2014 period, while the bottom three ranked
provinces had above average growth. One notable exception to this trend was Alberta,
which was the beneficiary of a commodity boom throughout the period, and as such
enjoyed high growth despite starting with a high level.
Table 18: Summary of International HDR Ranks, Canada and the Provinces/Territories, 2014
Dimension CAN NL PEI NS NB QC ON MB SK AB BC YT NWT NU
Life Expectancy 12 33 29 28 30 10 10 35 33 21 6 47 43 103
Average Educational
Attainment 3 8 7 5 8 6 1 7 6 1 1 1 6 35
Expected Years of
Schooling 26 33 29 33 46 14 23 50 43 49 35 65 55 107
GNI per capita 20 13 34 34 32 23 22 22 8 6 21 10 3 13
HDI 9 16 23 22 25 12 8 23 12 4 11 22 15 46
The performance of Canada’s provinces and territories in terms of human
development in the international context is summarized in Table 18. Of the 188 countries
in the most recent HDR rankings, Canada’s regions ranked between sixth and 103rd
in life
expectancy, between third and 35th
in average educational attainment, between 14th
and
107th
in expected years of schooling and between third and 34th
in GNI per capita. For the
overall HDI, Canada’s provinces and territories ranked between fourth and 46th
place. It is
therefore clear that Canada’s overall HDI masks substantial variation among the provinces
and territories.

40
References Barro, R. and J.W. Lee (2001). “International Data on Educational Attainment: Updates and
Implications,” Oxford Economic Papers, Vol. 53, No.3, pp. 541-563.
Barro, R. and J. W. Lee (2010). “A New Data Set of Educational Attainment in the World, 1950–
2010.” NBER Working Paper 15902 (Cambridge, MA: National Bureau of Economic
Research).
Barro, R. and J.W. Lee (2014). “Educational Attainment for Total Population, 1950-2010: Version
2.0.” Available at: http://www.barrolee.com/data/yrsch_old.htm
Brockington, Riley (2009). Summary Public School Indicators for Canada, the Provinces and
Territories, 2000/2001 to 2006/2007, Catalogue no. 81-595-M, No. 078 (Ottawa: Statistics
Canada).
Calver, Matthew (2015). “Closing the Aboriginal Education Gap in Canada: Assessing Progress
and Estimating the Economic Benefits.” CSLS Research Report 2015-03. Available at:
http://www.csls.ca/reports/csls2015-03.pdf
Cohen, D. and M. Soto (2007). “Growth and Human Capital: Good Data, Good Results,” Journal
of Economic Growth, Vol.12, pp. 51–76.
Hazell, Elspeth, Kar-Fai Gee, and Andrew Sharpe (2012). “The Human Development Index in
Canada: Estimates for the Canadian Provinces and Territories, 2000-2011.” CSLS
Research Report 2012-02. Available at: http://www.csls.ca/reports/csls2012-02.pdf
IMF (International Monetary Fund) (2009). World Economic Outlook: Sustaining the Recovery
(Washington, DC).
IMF (International Monetary Fund) (2010a). Government Finance Statistics (Washington, DC).
IMF (International Monetary Fund) (2010b). World Economic Outlook Update: An Update of the
Key WEO Projections (Washington, DC).
Lind, Niels (2010) “A Calibrated Index of Human Development.” Social Indicators Research, Vol.
98, No. 2, pp. 301-319.
Kahneman, Daniel and Angus Deaton. (2010) “High income improves evaluation of life but not
emotional well being.” Proceedings of the National Academies of Science. Vol. 107, No.
38, 16489-16493.
Maddison, A. (2010). Historical Statistics of the World Economy: 1–2008 AD (Paris: Organisation
for Economic Co-operation and Development).
McGillivray, Mark (1991). “The Human Development Index: Yet Another Redundant Composite
Development Indicator?” World Development, Vol. 19, No.10, pp. 1461-1468.
41
Nunavut Bureau of Statistics (2015). 2015 Nunavut Food Price Survey, Comparison of Nunavut &
Canada CPI Food Price Basket Items. Retrieved from:
http://www.stats.gov.nu.ca/en/Economic%20prices.aspx
Ross, Chris and Alexander Murray (2010). “Aggregate Measures of Income and Output in Canada
and the United States: Implications for Productivity and Living Standards,” International
Productivity Monitor Number 19, Spring, pp. 20-39.
Oreopoulos, Philip (2006). “The compelling effects of compulsory schooling: evidence from
Canada,” Canadian Journal of Economics, Vol. 39, No. 1, pp. 22-52.
Riley, J.C (2005). Poverty and Life Expectancy (Cambridge, UK: Cambridge University Press).
Sagar, Ambuj D. and Adil Najam (1998). “The human development index: a critical review”
Ecological Economics, Vol. 25, pp. 249-264.
Statistics Canada (2000). Health Indicators. Catalogue No. 82-221-XIE, December.
Srinivasan, T.N. (1994). “Human Development: A New Paradigm or Reinvention of the Wheel?”
American Economic Review, Vol. 84, No.2, pp. 238-243.
Thomas, Jasmin (2016). “Trends in Low-Wage Employment in Canada: Incidence, Gap and
Intensity, 1997-2014.” CSLS Research Report 2016-10. Available at:
http://www.csls.ca/reports/csls2016-10.pdf
UNDESA (United Nations Department of Economic and Social Affairs) (2011). World Population
Prospects: The 2010 Revision (New York).
(UIS) UNESCO Institute for Statistics (2009). Education Indicators: Technical Guidelines.
http://www.uis.unesco.org/template/pdf/EducGeneral/Indicator_Technical_guidelines_EN.
UNDP (United Nations Development Programme) – Human Development Report Office (2011).
Human Development Report 2011. (New York: Palgrave Macmillan).
UNDP (United Nations Development Programme) - Human Development Report Office (2015a).
Human Development Report 2015 (New York: Palgrave Macmillan). Available at:
http://hdr.undp.org/sites/default/files/2015_human_development_report.pdf
UNDP (United Nations Development Programme) – Human Development Report Office (2015b).
Human Development Report 2015 – Technical Notes. Available at:
http://hdr.undp.org/sites/default/files/hdr2015_technical_notes.pdf
UNESCO Institute for Statistics (2015). Data Centre. See: http://stats.uis.unesco.org.
World Bank (2010). World Development Indicators 2010 (Washington, DC).
42
Appendix 1: Statistics Canada Data Appendix Table 1: Life Expectancy at Birth, Canada, Provinces and Territories, Both Sexes, 1979-2014
Year Canada NL PEI NS NB QC ON MB SK AB BC YT NWT NU 1979 74.9 75.4 75.4 74.2 74.3 74.1 75.3 75.3 76.0 75.2 75.6 70.0 - - 1980 75.2 74.8 75.9 74.2 74.5 74.5 75.5 75.4 75.9 75.1 76.0 69.9 - -
1981 75.6 75.6 76.7 74.6 75.1 75.1 75.9 75.2 76.3 75.5 76.2 68.1 - -
1982 75.8 75.3 77.1 75.1 75.3 75.4 76.1 75.9 75.7 75.9 76.3 70.7 - - 1983 76.1 75.1 76.0 75.1 75.8 75.5 76.3 76.0 76.9 76.6 77.2 71.4 - -
1984 76.4 75.4 76.4 75.9 76.0 75.8 76.7 76.8 77.1 76.8 77.2 72.8 - -
1985 76.4 75.6 76.4 75.4 76.3 75.8 76.7 76.4 76.7 76.7 77.3 71.3 - - 1986 76.6 76.2 75.8 75.9 76.1 75.9 76.9 76.5 76.9 76.7 77.6 72.7 - -
1987 76.9 76.0 77.2 76.3 76.6 76.1 77.2 76.8 77.5 77.3 77.7 73.9 - -
1988 77.0 76.3 77.0 76.1 76.8 76.5 77.2 76.7 77.3 77.2 77.7 71.0 - - 1989 77.3 76.2 76.9 76.3 76.9 76.7 77.5 77.3 78.0 77.7 77.9 76.8 - -
1990 77.6 76.1 76.6 76.7 77.3 77.1 77.9 77.5 78.0 77.9 78.1 74.4 - -
1991 77.8 76.7 76.4 77.3 77.7 77.3 78.0 77.6 78.1 78.1 78.4 74.7 75.9 68.3 1992 78.0 76.9 77.5 77.1 77.6 77.7 78.2 77.9 78.9 78.3 78.4 75.8 74.3 67.3
1993 77.9 76.8 77.1 77.4 77.5 77.4 78.1 77.6 78.5 78.2 78.3 75.2 75.3 67.0
1994 78.0 76.6 78.0 77.2 77.6 77.7 78.2 77.9 78.4 78.3 78.6 75.1 75.6 71.5 1995 78.2 77.2 77.4 77.8 77.7 77.6 78.4 77.6 78.1 78.5 78.9 72.8 77.4 70.7
1996 78.4 77.5 77.2 77.7 78.1 78.1 78.6 78.1 78.3 78.5 78.9 76.6 76.3 69.0
1997 78.6 76.9 79.4 77.8 78.2 78.0 78.9 78.1 78.5 78.9 79.3 76.4 76.8 70.4 1998 78.8 77.3 77.4 77.8 78.0 78.3 79.2 78.0 78.5 79.1 79.5 75.8 76.5 66.5
1999 79.0 77.6 78.5 78.8 78.4 78.5 79.3 78.0 78.5 79.2 79.9 76.8 75.3 68.9
2000 79.4 77.3 78.2 78.6 78.8 79.2 79.5 78.1 78.6 79.5 80.5 75.6 75.9 67.8 2001 79.6 78.1 78.9 78.9 79.0 79.4 79.9 78.6 79.2 79.7 80.4 77.5 75.9 69.4
2002 79.7 78.3 78.8 79.0 79.3 79.4 80.1 78.7 79.1 79.7 80.6 76.7 75.8 68.5
2003 79.9 78.2 79.1 79.1 79.2 79.9 80.2 78.7 79.1 79.9 80.8 78.8 74.7 68.5
2004 80.2 78.5 79.2 79.1 79.7 80.1 80.6 78.9 79.3 80.2 80.9 76.4 79.1 70.4
2005 80.4 78.2 79.8 79.3 79.8 80.4 80.7 79.0 79.3 80.3 81.2 77.0 78.0 72.0
2006 80.8 78.2 79.9 79.6 80.1 80.9 81.1 79.3 79.4 80.5 81.4 77.0 78.0 72.0 2007 80.9 78.5 80.9 80.2 80.1 80.8 81.2 79.6 79.8 80.7 81.0 76.7 77.4 71.6
2008 81.0 78.8 79.8 79.9 80.4 81.3 81.6 79.6 79.3 80.6 81.8 76.7 77.4 71.6
2009 81.4 79.4 79.9 80.2 80.1 81.5 81.7 79.3 79.7 80.8 82.3 76.7 77.4 71.6 2010 81.6 79.6 80.1 80.4 80.2 81.7 81.9 79.4 79.8 81.0 82.5 76.8 77.5 71.8
2011 81.8 79.7 80.3 80.5 80.4 82.0 82.1 79.5 79.9 81.1 82.7 77.0 77.6 72.0
2012 82.0 79.9 80.5 80.7 80.5 82.2 82.3 79.6 80.0 81.3 83.0 77.1 77.7 72.2 2013 82.2 80.0 80.7 80.9 80.6 82.5 82.5 79.7 80.1 81.4 83.2 77.2 77.8 72.4
2014 82.4 80.2 80.9 81.0 80.8 82.7 82.8 79.8 80.2 81.6 83.4 77.3 77.9 72.7
Compound Annual Growth Rates 1991-2008 0.25 0.19 0.25 0.20 0.17 0.29 0.26 0.12 0.11 0.19 0.27 0.17 0.12 0.30
2000-2014 0.27 0.26 0.24 0.22 0.18 0.31 0.29 0.15 0.14 0.18 0.25 0.16 0.18 0.50
2000-2005 0.25 0.23 0.41 0.18 0.25 0.30 0.30 0.23 0.18 0.20 0.17 0.37 0.55 1.21
2005-2014 0.28 0.28 0.15 0.24 0.14 0.31 0.28 0.11 0.12 0.17 0.30 0.05 -0.02 0.10
Sources: CANSIM Table 102-4307 for 2005-2007 for YT, NU and NWT (2005-2007 average for 2005 and 2006, 2007-2009 average for 2007, 2008, and 2009), CANSIM Table 102-0025 for 1979-
1990 for all series, CANSIM Table 102-0025 for 1991-1999 for NU and NWT, CANSIM Table 102-0511 for 1991-2006 for all series, CANSIM Table 102-0512 for 2007-2008 for all ten
provinces
Notes: Provincial estimates for 2007 and 2008 calculated using CANSIM table 102-0512 three-year life expectancy averages. Italicized estimates for 2010-2014 are extrapolated using compound
annual growth rate from 1991-2009 for that province or for Canada.

43
Appendix Table 2: Gross Domestic Product, Canada, Provinces and Territories, 1981-2014
Appendix Table 2a: GDP, Income-Based at Market Prices, Millions of Current Dollars, Canada, Provinces and Territories, 1981-2014
Year Canada NL PEI NS NB QC ON MB SK AB BC YT NWT NU
1981 367,121 5,247 1,072 8,066 6,624 82,453 132,336 13,839 15,101 54,491 45,999 495 .. ..
1982 386,773 5,646 1,151 9,389 7,263 87,281 139,969 14,342 15,276 58,335 45,928 486 .. ..
1983 419,691 6,056 1,335 10,627 8,292 94,115 156,545 15,381 16,225 60,239 48,540 460 .. ..
1984 460,243 6,491 1,376 11,896 9,174 102,992 175,735 17,290 17,310 64,590 50,949 473 .. ..
1985 498,075 6,813 1,437 12,894 9,758 110,084 193,511 18,848 18,189 68,906 54,868 512 .. ..
1986 524,450 7,378 1,672 14,051 10,950 119,800 212,800 19,395 17,958 59,613 57,943 655 .. ..
1987 571,926 7,977 1,771 15,066 12,044 131,308 235,504 20,772 18,496 61,564 64,039 920 .. ..
1988 624,401 8,568 1,942 15,909 12,828 143,220 260,275 22,423 19,121 65,363 70,943 1,006 .. ..
1989 669,026 9,068 2,091 17,031 13,441 150,298 282,766 23,831 20,125 69,096 77,267 1,069 .. ..
1990 692,997 9,300 2,183 17,602 13,770 155,692 287,334 24,752 21,623 75,284 81,223 1,106 .. ..
1991 699,253 9,704 2,258 18,257 13,910 157,509 288,217 24,607 21,783 75,046 83,779 1,008 .. ..
1992 716,019 9,677 2,303 18,749 14,372 160,868 293,068 25,093 21,723 76,639 89,356 1,179 .. ..
1993 744,608 9,878 2,488 18,898 15,096 164,840 302,245 25,134 23,088 82,913 96,066 958 .. ..
1994 789,507 10,398 2,543 19,247 15,762 174,054 319,986 26,640 24,670 89,886 102,426 991 .. ..
1995 828,973 10,855 2,671 19,801 16,994 181,452 337,400 27,653 26,584 93,614 107,931 1,131 .. ..
1996 857,023 10,610 2,827 20,025 17,257 184,390 347,842 29,062 29,102 100,517 111,195 1,221 .. ..
1997 903,902 10,716 2,837 20,956 17,404 192,942 368,960 30,189 29,177 109,163 117,135 1,185 .. ..
1998 937,295 11,273 2,979 21,978 18,165 200,301 389,250 31,690 29,855 109,317 118,186 1,129 .. ..
1999 1,004,456 12,347 3,160 23,771 19,693 215,431 418,245 32,780 31,117 119,077 123,959 1,144 2,432 813
2000 1,102,380 14,148 3,385 25,475 20,820 230,258 452,238 34,901 34,287 146,939 134,606 1,260 2,664 890
2001 1,140,505 14,433 3,448 26,723 21,430 238,548 469,084 36,080 33,704 154,230 136,852 1,337 3,152 933
2002 1,189,452 16,722 3,705 28,006 22,012 249,671 494,815 37,588 35,062 153,801 141,946 1,317 3,205 1,019
2003 1,250,315 18,400 3,801 29,786 23,093 259,094 509,511 38,521 37,528 173,951 149,751 1,358 3,893 1,029
2004 1,331,178 19,651 4,026 30,871 24,408 271,833 533,365 41,022 41,529 194,484 162,293 1,463 4,516 1,117
2005 1,417,028 22,249 4,257 32,127 25,552 280,133 556,635 43,082 44,889 225,460 174,855 1,572 4,445 1,161
2006 1,492,207 24,573 4,425 32,701 26,718 290,595 578,241 46,622 46,171 245,929 188,219 1,700 4,437 1,240
2007 1,573,532 29,065 4,630 33,941 28,287 306,029 601,735 49,726 52,381 260,964 198,325 1,814 4,667 1,319
2008 1,652,923 31,572 4,754 35,416 28,779 314,380 608,446 52,154 67,619 296,072 204,406 2,043 5,024 1,566
2009 1,567,365 25,001 4,927 34,931 28,857 314,541 597,882 50,804 60,080 245,690 196,250 2,134 4,012 1,535
2010 1,662,130 29,085 5,222 36,849 30,213 328,138 630,989 53,308 63,368 270,049 205,117 2,311 4,816 1,914
2011 1,769,921 33,539 5,424 37,652 31,500 344,735 659,743 56,197 74,821 299,521 216,786 2,492 4,730 2,034
2012 1,822,808 32,032 5,573 37,835 31,723 354,040 680,084 59,781 77,957 312,485 221,414 2,551 4,393 2,199
2013 1,892,193 34,991 5,783 38,576 31,857 361,211 693,210 61,897 83,496 344,452 226,605 2,550 4,490 2,339
2014 1,973,043 33,514 6,003 39,077 32,056 370,064 721,970 64,077 82,780 375,756 237,188 2,603 4,731 2,487
Compound Annual Growth Rates
1991-2014 4.61 5.54 4.34 3.36 3.70 3.78 4.07 4.25 5.98 7.25 4.63 4.21 - -
1991-2000 5.19 4.28 4.60 3.77 4.58 4.31 5.13 3.96 5.17 7.75 5.41 2.51 - -
2000-2014 4.25 6.35 4.18 3.10 3.13 3.45 3.40 4.44 6.50 6.94 4.13 5.32 4.19 7.62
2000-2005 5.15 9.48 4.69 4.75 4.18 4.00 4.24 4.30 5.54 8.94 5.37 4.52 10.78 5.46
2005-2014 3.75 4.66 3.89 2.20 2.55 3.14 2.93 4.51 7.04 5.84 3.45 5.76 0.70 8.83
Sources: CANSIM table 384-0037.

44
Appendix Table 2b: GDP per Capita, Current Dollars, Canada, Provinces and Territories, 1981-2014
Year Canada NL PEI NS NB QC ON MB SK AB BC YT NWT NU
1981 14,791 9,120 8,677 9,435 9,377 12,594 15,017 13,364 15,476 23,784 16,274 20,729 - -
1982 15,399 9,840 9,313 10,930 10,266 13,263 15,691 13,721 15,484 24,616 15,967 19,702 - -
1983 16,545 10,456 10,671 12,239 11,600 14,253 17,318 14,514 16,205 25,167 16,695 19,439 - -
1984 17,973 11,190 10,872 13,557 12,733 15,531 19,169 16,132 17,061 26,981 17,287 19,773 - -
1985 19,274 11,761 11,260 14,556 13,491 16,515 20,820 17,412 17,747 28,657 18,442 21,005 - -
1986 20,094 12,802 13,018 15,804 15,103 17,859 22,549 17,768 17,457 24,503 19,291 26,811 - -
1987 21,626 13,867 13,767 16,860 16,549 19,361 24,435 18,912 17,909 25,222 21,006 35,789 - -
1988 23,306 14,901 15,021 17,732 17,564 20,948 26,454 20,345 18,596 26,607 22,776 37,744 - -
1989 24,527 15,728 16,066 18,843 18,284 21,703 27,987 21,590 19,741 27,657 24,171 39,349 - -
1990 25,026 16,108 16,740 19,333 18,604 22,251 27,908 22,391 21,457 29,549 24,672 39,561 - -
1991 24,940 16,741 17,320 19,954 18,657 22,287 27,630 22,176 21,724 28,950 24,832 34,914 - -
1992 25,237 16,681 17,603 20,392 19,211 22,626 27,721 22,552 21,637 29,111 25,760 39,190 - -
1993 25,958 17,032 18,823 20,454 20,160 23,033 28,274 22,489 22,930 31,085 26,926 31,579 - -
1994 27,224 18,100 19,058 20,766 21,011 24,200 29,576 23,717 24,436 33,284 27,863 33,385 - -
1995 28,290 19,131 19,871 21,335 22,630 25,135 30,812 24,490 26,212 34,234 28,573 37,153 - -
1996 28,943 18,957 20,827 21,502 22,940 25,444 31,385 25,623 28,561 36,221 28,701 38,901 - -
1997 30,225 19,451 20,846 22,475 23,128 26,523 32,862 26,572 28,664 38,576 29,665 37,268 - -
1998 31,082 20,882 21,936 23,586 24,203 27,454 34,247 27,860 29,346 37,708 29,672 36,245 - -
1999 33,040 23,151 23,187 25,457 26,236 29,417 36,354 28,693 30,672 40,328 30,902 37,161 59,845 30,313
2000 35,925 26,797 24,804 27,280 27,741 31,298 38,708 30,420 34,030 48,911 33,325 41,405 65,810 32,366
2001 36,766 27,647 25,230 28,658 28,580 32,252 39,428 31,334 33,696 50,434 33,568 44,335 77,170 33,163
2002 37,931 32,190 27,068 29,948 29,374 33,551 40,916 32,498 35,174 49,165 34,620 43,412 76,870 35,355
2003 39,515 35,491 27,700 31,766 30,814 34,613 41,614 33,107 37,662 54,653 36,313 43,891 91,396 35,093
2004 41,680 37,980 29,242 32,855 32,570 36,075 43,048 34,965 41,641 60,056 39,060 46,512 104,284 37,412
2005 43,949 43,259 30,834 34,254 34,158 36,951 44,431 36,563 45,182 67,876 41,674 49,281 102,417 38,268
2006 45,815 48,127 32,097 34,867 35,834 38,076 45,669 39,393 46,529 71,880 44,374 52,679 102,761 40,244
2007 47,845 57,098 33,619 36,298 37,948 39,782 47,142 41,809 52,274 74,263 46,219 55,718 107,599 42,013
2008 49,718 61,719 34,260 37,843 38,534 40,505 47,230 43,542 66,466 82,339 46,996 61,744 115,894 49,103
2009 46,608 48,383 35,216 37,232 38,478 40,102 45,999 42,036 58,061 66,780 44,494 63,263 92,980 47,086
2010 48,879 55,721 36,858 39,115 40,121 41,383 48,039 43,662 60,269 72,349 45,929 66,800 111,281 57,386
2011 51,537 63,879 37,657 39,866 41,693 43,051 49,741 45,551 70,166 79,025 48,184 70,392 108,733 59,481
2012 52,453 60,794 38,366 40,044 41,915 43,791 50,716 47,809 71,703 80,360 48,742 70,491 100,646 63,319
2013 53,824 66,269 39,762 40,908 42,155 44,294 51,156 48,917 75,485 85,947 49,449 69,999 102,315 66,008
2014 55,510 63,345 41,071 41,466 42,482 45,048 52,785 50,051 73,760 91,183 51,136 70,370 107,572 68,924
Compound Annual Growth Rates
1991-2011 3.70 6.92 3.96 3.52 4.10 3.35 2.98 3.66 6.04 5.15 3.37 3.57 - -
1991-2000 4.14 5.37 4.07 3.54 4.51 3.85 3.82 3.57 5.11 6.00 3.32 1.91 - -
2000-2013 3.16 7.21 3.70 3.17 3.27 2.71 2.17 3.72 6.32 4.43 3.08 4.12 3.45 5.64
2000-2005 4.11 10.05 4.45 4.66 4.25 3.38 2.80 3.75 5.83 6.77 4.57 3.54 9.25 3.41
2005-2013 2.57 5.48 3.23 2.24 2.66 2.29 1.78 3.71 6.63 2.99 2.16 4.48 -0.01 7.05
Sources: Appendix Table 2a and Appendix Table 7a.
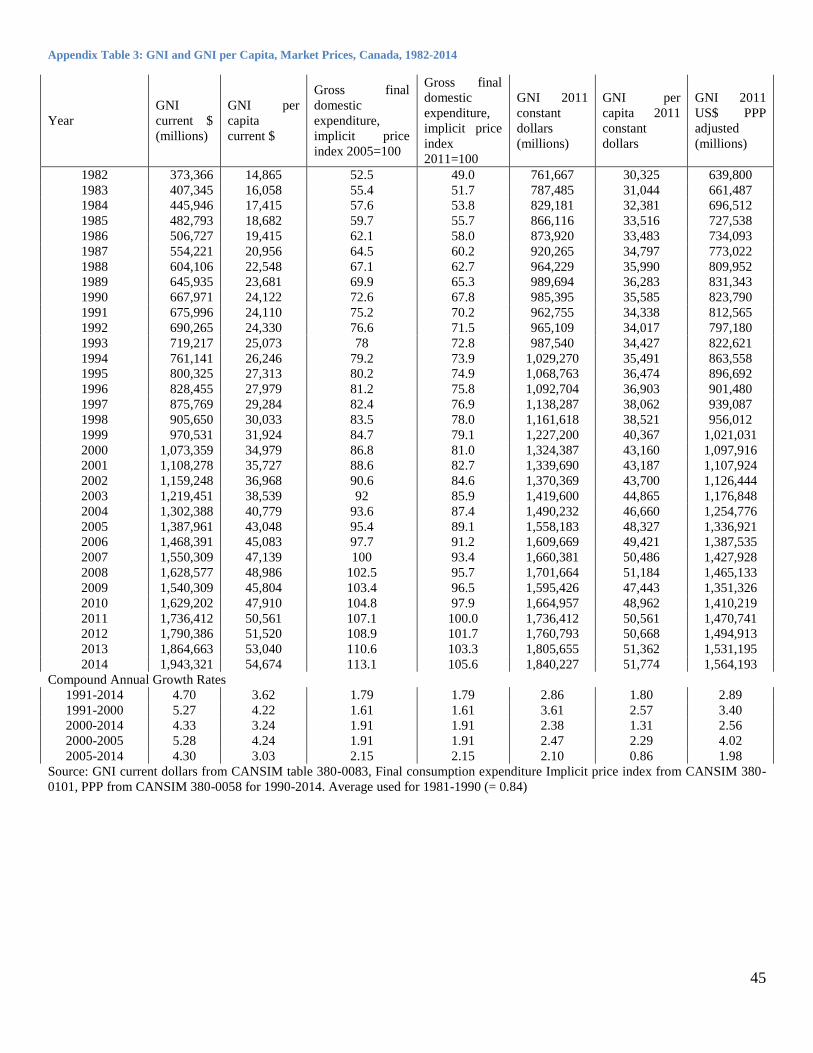
45
Appendix Table 3: GNI and GNI per Capita, Market Prices, Canada, 1982-2014
Year
GNI
current $
(millions)
GNI per
capita
current $
Gross final
domestic
expenditure,
implicit price
index 2005=100
Gross final
domestic
expenditure,
implicit price
index
2011=100
GNI 2011
constant
dollars
(millions)
GNI per
capita 2011
constant
dollars
GNI 2011
US$ PPP
adjusted
(millions)
1982 373,366 14,865 52.5 49.0 761,667 30,325 639,800
1983 407,345 16,058 55.4 51.7 787,485 31,044 661,487
1984 445,946 17,415 57.6 53.8 829,181 32,381 696,512
1985 482,793 18,682 59.7 55.7 866,116 33,516 727,538
1986 506,727 19,415 62.1 58.0 873,920 33,483 734,093
1987 554,221 20,956 64.5 60.2 920,265 34,797 773,022
1988 604,106 22,548 67.1 62.7 964,229 35,990 809,952
1989 645,935 23,681 69.9 65.3 989,694 36,283 831,343
1990 667,971 24,122 72.6 67.8 985,395 35,585 823,790
1991 675,996 24,110 75.2 70.2 962,755 34,338 812,565
1992 690,265 24,330 76.6 71.5 965,109 34,017 797,180
1993 719,217 25,073 78 72.8 987,540 34,427 822,621
1994 761,141 26,246 79.2 73.9 1,029,270 35,491 863,558
1995 800,325 27,313 80.2 74.9 1,068,763 36,474 896,692
1996 828,455 27,979 81.2 75.8 1,092,704 36,903 901,480
1997 875,769 29,284 82.4 76.9 1,138,287 38,062 939,087
1998 905,650 30,033 83.5 78.0 1,161,618 38,521 956,012
1999 970,531 31,924 84.7 79.1 1,227,200 40,367 1,021,031
2000 1,073,359 34,979 86.8 81.0 1,324,387 43,160 1,097,916
2001 1,108,278 35,727 88.6 82.7 1,339,690 43,187 1,107,924
2002 1,159,248 36,968 90.6 84.6 1,370,369 43,700 1,126,444
2003 1,219,451 38,539 92 85.9 1,419,600 44,865 1,176,848
2004 1,302,388 40,779 93.6 87.4 1,490,232 46,660 1,254,776
2005 1,387,961 43,048 95.4 89.1 1,558,183 48,327 1,336,921
2006 1,468,391 45,083 97.7 91.2 1,609,669 49,421 1,387,535
2007 1,550,309 47,139 100 93.4 1,660,381 50,486 1,427,928
2008 1,628,577 48,986 102.5 95.7 1,701,664 51,184 1,465,133
2009 1,540,309 45,804 103.4 96.5 1,595,426 47,443 1,351,326
2010 1,629,202 47,910 104.8 97.9 1,664,957 48,962 1,410,219
2011 1,736,412 50,561 107.1 100.0 1,736,412 50,561 1,470,741
2012 1,790,386 51,520 108.9 101.7 1,760,793 50,668 1,494,913
2013 1,864,663 53,040 110.6 103.3 1,805,655 51,362 1,531,195
2014 1,943,321 54,674 113.1 105.6 1,840,227 51,774 1,564,193
Compound Annual Growth Rates
1991-2014 4.70 3.62 1.79 1.79 2.86 1.80 2.89
1991-2000 5.27 4.22 1.61 1.61 3.61 2.57 3.40
2000-2014 4.33 3.24 1.91 1.91 2.38 1.31 2.56
2000-2005 5.28 4.24 1.91 1.91 2.47 2.29 4.02
2005-2014 4.30 3.03 2.15 2.15 2.10 0.86 1.98
Source: GNI current dollars from CANSIM table 380-0083, Final consumption expenditure Implicit price index from CANSIM 380-
0101, PPP from CANSIM 380-0058 for 1990-2014. Average used for 1981-1990 (= 0.84)

46
Appendix Table 4: Enrolment in Public Elementary and Secondary Schools, Canada, Provinces and Territories, 1996-2012
Appendix Table 4a: Total Enrolment in September by Headcount in Public Elementary and Secondary Schools, Both Sexes, Canada, Provinces and Territories, 1996-2009
Year Canada NL PEI NS NB QC ON MB SK AB BC YT NWT NU
1996 5,319,748 106,205 24,537 163,941 133,276 1,267,336 2,080,197 192,176 193,881 526,930 607,644 6,366 - -
1997 5,354,706 101,768 24,397 162,359 131,586 1,260,513 2,095,630 194,798 196,013 532,301 631,445 6,333 - -
1998 5,357,244 97,557 24,146 160,011 129,131 1,250,248 2,111,622 192,630 194,797 543,387 629,545 6,102 - -
1999 5,372,733 94,118 24,089 158,205 127,003 1,247,757 2,131,626 197,067 192,885 546,402 628,269 5,975 9,753 9,584
2000 5,350,719 90,233 23,153 155,873 124,942 1,237,981 2,143,599 189,912 186,586 549,633 624,618 5,764 9,672 9,558
2001 5,360,375 86,971 22,843 153,450 122,792 1,244,689 2,163,108 188,907 183,024 548,122 622,829 5,608 9,707 8,738
2002 5,352,040 84,337 23,242 150,599 120,600 1,244,943 2,164,940 186,892 184,605 554,397 613,227 5,610 9,747 8,901
2003 5,293,261 81,511 22,905 148,514 118,869 1,240,820 2,129,742 186,287 182,128 552,592 605,536 5,520 9,718 9,119
2004 5,255,616 79,483 22,393 145,396 117,145 1,232,663 2,123,904 184,352 178,709 550,983 596,168 5,459 9,607 9,354
2005 5,213,462 76,806 21,948 142,304 114,820 1,215,927 2,118,544 182,371 175,588 551,740 589,379 5,335 9,571 9,129
2006 5,169,601 74,345 21,365 138,661 112,013 1,204,612 2,103,464 180,043 172,109 560,563 578,797 5,232 9,332 9,065
2007 5,115,075 72,109 20,813 135,303 110,288 1,188,904 2,087,588 179,320 167,066 559,118 571,268 5,227 9,048 9,023
2008 5,086,549 70,641 20,324 133,134 108,407 1,187,612 2,070,736 177,962 164,763 564,051 565,875 5,005 8,762 9,277
2009 5,074,669 69,665 19,955 130,550 106,394 1,189,876 2,061,390 177,500 166,003 567,979 562,743 5,010 8,564 9,040
2010 5,051,760 68,655 21,162 128,131 104,421 1,179,970 2,051,865 177,679 167,043 573,198 557,102 5,086 8,576 8 872
2011 5,030,315 67,829 20,831 125,540 102,579 1,172,185 2,043,117 178,919 168,354 577,759 550,748 5,037 8,512 8,905
2012 5,029,009 67,478 20,406 122,643 101,079 1,176,811 2,031,195 179,291 170,318 594,445 542,879 5,049 8,329 9,086 Compound Annual Growth Rates
1996-2012 -0.35 -2.80 -1.15 -1.80 -1.71 -0.46 -0.15 -0.43 -0.81 0.76 -0.70 -1.44 - -
1996-2000 0.15 -3.99 -1.44 -1.25 -1.60 -0.58 0.75 -0.30 -0.95 1.06 0.69 -2.45 - -
2000-2012 -0.52 -2.39 -1.05 -1.98 -1.75 -0.42 -0.45 -0.48 -0.76 0.66 -1.16 -1.10 -1.24 -0.42
2000-2005 -0.52 -3.17 -1.06 -1.81 -1.68 -0.36 -0.23 -0.81 -1.21 0.08 -1.15 -1.53 -0.21 -0.91
2005-2012 -0.51 -1.61 -0.91 -1.84 -1.58 -0.41 -0.52 -0.21 -0.38 0.94 -1.02 -0.69 -1.72 -0.06
Sources: Statistics Canada, "Summary Public School Indicators for the Provinces and Territories," catalogue number 81-595-M, nos. 22, 44, 50, 67, 78, 83, 88, and 95.
Notes: Headcount enrolments are the number of students enrolled in a publicly-funded primary or secondary school in September of the indicated year (or as soon as possible thereafter). In some
cases this includes adult high schools and kindergarten students.
Years refer to the year in which the school year began. For example, 2006 data refer to the 2006/2007 school year, which began in September 2006.
Data from 1996 to 1999 is obtained from an earlier publication of "Summary Public School Indicators for the Provinces and Territories" and, unlike the period 2000-2004, has not been updated
in later publications.

47
Appendix Table 4b: Total Enrolment Rates in September by Headcount in Public Elementary and Secondary Schools, Proportion of the Population Aged 5-17, Both Sexes, Per Cent, Canada,
Provinces and Territories, 1996-2012
Year Canada NL PEI NS NB QC ON MB SK AB BC YT NWT NU
1996 101.6 99.9 93.5 100.5 100.7 103.5 107.6 90.4 93.1 96.5 91.8 99.9 - -
1997 101.3 99.6 93.3 100.0 100.3 103.2 106.4 91.3 94.7 95.9 93.7 97.7 - -
1998 100.7 99.7 93.0 99.4 99.9 102.8 105.4 90.2 94.6 96.4 92.8 96.3 - -
1999 100.8 99.7 93.4 99.0 99.5 103.4 105.1 91.9 94.7 96.4 92.5 96.0 102.8 118.9
2000 100.0 99.1 90.9 98.5 99.3 103.0 104.1 88.3 93.1 96.5 92.0 94.8 102.8 115.7
2001 99.9 99.1 90.2 98.0 99.2 103.7 103.7 87.7 93.3 95.8 91.9 95.1 102.9 104.2
2002 99.7 99.4 93.1 97.6 99.2 104.0 102.7 86.9 95.8 96.1 91.4 97.2 102.9 104.2
2003 99.0 99.1 93.9 97.8 99.5 104.3 100.9 86.9 96.4 95.8 91.4 96.2 102.6 105.8
2004 98.9 99.5 93.6 97.4 99.7 104.3 100.8 86.1 96.4 95.7 90.6 96.2 102.0 108.1
2005 98.4 98.4 92.9 97.0 99.0 103.2 100.8 85.6 96.6 95.3 90.0 94.9 103.9 104.7
2006 98.2 98.0 92.1 96.5 98.6 102.8 100.7 85.0 96.4 96.0 88.9 95.2 104.3 104.5
2007 98.0 97.3 92.2 96.6 99.0 102.6 100.6 85.4 94.7 95.8 88.7 96.7 103.1 104.1
2008 98.6 97.4 91.7 97.8 99.4 104.4 100.7 85.6 94.3 96.8 88.8 93.4 102.9 107.2
2009 99.3 97.2 91.3 98.4 99.4 106.6 101.0 85.7 95.4 97.2 88.8 94.8 103.7 104.5
2010 99.6 97.0 97.9 98.6 99.4 107.6 101.2 86.0 96.0 97.9 88.3 96.4 106.9 -
2011 99.8 96.7 96.3 98.5 99.4 108.2 101.4 86.2 96.8 97.9 87.8 96.5 108.1 103.1
2012 99.9 97.1 95.1 98.2 99.4 109.4 101.6 86.1 97.0 99.2 87.2 96.0 106.9 104.9 Compound Annual Growth Rates
1996-2009 -0.18 -0.21 -0.18 -0.17 -0.10 0.22 -0.48 -0.41 0.18 0.05 -0.26 -0.40 - -
1996-2000 -0.38 -0.20 -0.71 -0.49 -0.34 -0.12 -0.81 -0.60 -0.01 -0.02 0.06 -1.31 - -
2000-2012 -0.01 -0.17 0.39 -0.03 0.01 0.50 -0.20 -0.20 0.34 0.24 -0.45 0.11 0.33 -0.81
2000-2005 -0.33 -0.14 0.44 -0.30 -0.05 0.04 -0.66 -0.61 0.73 -0.25 -0.44 0.04 0.22 -1.98
2005-2012 0.21 -0.20 0.34 0.17 0.05 0.83 0.12 0.09 0.07 0.58 -0.45 0.16 0.41 0.03
Sources: Appendix Table 4a and Appendix Table 7a.

48
Appendix Table 5: College Enrolment (Full-time and Part-time), Canada, Provinces and Territories, 1992-2013
Appendix Table 5a: College Enrolment (Full-time and Part-time) in September, Both Sexes, Canada, Provinces and Territories, 1992-2013
Year Canada NL PEI NS NB QC ON MB SK AB BC YT NWT NU
1992 469,806 4,830 924 3,297 3,207 191,643 130,257 5,670 4,251 45,774 78,492 570 885 -
1993 467,622 5,151 1,344 3,228 3,291 184,935 134,886 5,619 4,644 44,145 78,480 612 1,284 -
1994 470,769 6,177 1,197 3,003 3,603 184,608 138,786 5,289 3,936 44,112 77,811 639 1,614 -
1995 478,971 5,859 1,317 7,083 3,852 183,501 146,034 4,971 3,405 43,017 78,531 564 834 -
1996 484,389 5,811 1,419 7,242 4,977 177,867 152,037 5,742 2,946 44,769 80,244 654 678 -
1997 490,221 6,150 1,695 7,701 5,274 173,823 152,451 6,246 3,351 46,137 85,923 813 648 -
1998 494,955 6,444 1,974 7365 5,364 173,427 152,583 6,693 2,829 49,836 86,781 714 942 -
1999 497,250 7,410 1,974 7,776 5,478 174,831 154,590 7,542 3,048 46,215 86,895 654 594 243
2000 545,943 4,095 1,368 6,924 5,274 203,850 154,338 8,715 4,320 48,048 107,580 621 591 216
2001 562,446 6,333 1,557 10,353 6,684 199,173 158,943 8,262 4,137 49,446 116,004 609 405 543
2002 571,956 7,860 1,800 7,950 6,270 195,507 168,324 8,463 3,852 53,073 117,381 540 522 420
2003 608,277 7,779 1,791 7,662 6,501 190,800 207,837 8,841 4,020 54,246 117,381 522 507 390
2004 608,352 6,558 1,275 7,677 8,040 189,159 203,967 8,733 3,840 61,011 116,601 501 531 459
2005 605,637 8,718 1,620 8,013 7,278 185,382 217,302 8,931 3,837 61,674 101,565 501 531 285
2006 611,823 8,991 1,557 8,547 7,008 188,055 216,414 9,051 6,825 61,770 102,570 201 531 297
2007 644,790 9,504 1,842 8,880 6,987 195,627 230,040 8,940 17,862 60,063 104,040 207 498 294
2008 634,233 9,690 2,487 9,417 7,110 202,299 239,334 8,871 20,160 62,982 70,995 210 447 237
2009 704,169 9,498 3,447 10,179 8,082 210,084 276,492 11,685 19,959 59,319 94,386 243 522 279
2010 725,559 10,170 3,510 11,811 9,288 214,761 278,610 18,387 20,541 60,246 97,056 - - -
2011 738,363 9,774 3,576 11,757 8,889 217,545 287,223 16,197 20,103 59,145 99,111 - - -
2012 739,917 9,888 2,622 11,124 8,454 220,125 292,044 16,134 19,407 59,898 96,543 - - -
2013 747,576 9,108 2,670 11,715 8,721 221,778 301,794 16,149 19,134 54,978 97,698 - - - Compound Annual Growth Rates
1992-2013 2.24 3.07 5.18 6.22 4.88 0.70 4.08 5.11 7.43 0.88 1.05 - - -
1992-2000 1.90 -2.04 5.03 9.72 6.42 0.77 2.14 5.52 0.20 0.61 4.02 1.08 -4.92 -
2000-2013 2.45 6.34 5.28 4.13 3.94 0.65 5.29 4.86 12.13 1.04 -0.74 - - -
2000-2005 2.10 16.31 3.44 2.96 6.65 -1.88 7.08 0.49 -2.34 5.12 -1.14 -4.20 -2.12 5.70
2005-2013 2.67 1.59 6.20 4.19 1.89 2.17 3.76 7.67 22.46 -0.36 -0.63 - - -
Sources: CANSIM Table 477-0019.
Notes: Years refer to the year in which the school year began. For example, 2005 data refer to the 2005/2006 school year, which began in September 2005.
49
Appendix Table 5b: College Enrolment Rate, Proportion of the Total Population Aged 18-22, Both Sexes, Per Cent, Canada, Provinces and Territories, 1992-2013
Year Canada NL PEI NS NB QC ON MB SK AB BC YT NWT NU
1992 23.4 9.2 9.3 33.2 5.4 40.8 17.2 6.9 6.1 24.0 33.5 26.7 26.8 -
1993 23.6 9.9 13.5 32.4 5.6 39.5 18.1 6.9 6.6 23.5 33.3 29.1 41.0 -
1994 23.9 12.3 12.1 30.4 6.3 39.4 19.0 6.6 5.6 23.5 32.8 34.2 53.1 -
1995 24.2 12.3 13.5 72.7 6.9 38.5 20.0 6.3 4.7 22.7 32.4 29.9 26.8 -
1996 24.3 12.7 14.5 74.0 9.1 36.7 20.9 7.3 4.0 23.0 31.8 33.1 21.8 -
1997 24.3 14.1 17.4 79.0 9.8 35.3 20.8 7.9 4.5 23.0 33.2 41.0 20.6 -
1998 24.3 15.6 20.7 77.4 10.2 34.7 20.7 8.6 3.8 23.8 33.4 36.6 30.8 -
1999 24.1 18.6 20.7 81.6 10.6 34.5 20.6 9.6 4.1 21.5 33.1 33.8 19.5 10.5
2000 26.1 10.5 14.2 71.8 10.3 40.1 20.1 11.0 5.8 21.7 40.2 31.4 19.3 9.4
2001 26.4 16.5 16.0 106.1 13.0 39.4 20.0 10.3 5.5 21.6 42.0 29.7 12.8 22.9
2002 26.4 20.7 18.6 82.2 12.2 39.0 20.6 10.4 5.1 22.5 41.5 24.5 15.9 16.7
2003 27.8 20.9 18.3 78.1 12.7 38.6 24.8 10.7 5.3 22.5 40.9 22.4 14.9 15.2
2004 27.6 17.9 12.8 76.8 15.9 38.9 23.9 10.4 5.0 24.7 40.5 21.5 15.4 17.2
2005 27.4 24.8 16.3 80.8 14.7 38.7 25.1 10.6 5.1 24.2 35.5 22.0 15.5 10.3
2006 27.5 26.6 16.1 88.3 14.4 39.6 24.7 10.7 9.1 23.6 35.8 8.8 15.3 10.3
2007 28.9 28.9 19.1 92.2 14.6 41.0 26.2 10.5 23.6 22.6 35.9 9.0 14.1 9.8
2008 28.1 29.3 25.9 97.9 14.8 41.6 27.0 10.3 26.2 23.5 24.4 9.2 12.3 7.7
2009 30.7 28.7 35.6 105.1 16.8 41.8 30.8 13.4 25.6 22.1 32.2 10.4 14.1 8.7
2010 31.2 30.8 35.3 118.9 19.1 41.3 30.5 20.8 26.3 22.7 32.8 - - -
2011 31.3 30.1 35.6 117.1 18.3 41.0 30.8 18.2 25.8 22.2 33.4 - - -
2012 31.0 31.0 25.9 109.8 17.5 41.2 30.8 17.8 24.9 22.3 31.8 - - -
2013 31.3 29.5 26.8 117.6 18.4 41.9 31.7 17.6 24.7 20.4 31.8 - - - Compound Annual Growth Rates
1992-2013 1.39 5.73 5.16 6.20 5.98 0.13 2.96 4.55 6.88 -0.77 -0.25 - - -
1992-2000 1.37 1.74 5.39 10.10 8.29 -0.22 1.98 5.97 -0.64 -1.23 2.32 2.04 -4.01 -
2000-2013 1.40 8.26 5.02 3.87 4.59 0.34 3.57 3.69 11.80 -0.49 -1.80 - - -
2000-2005 0.93 18.67 2.88 2.41 7.43 -0.68 4.57 -0.80 -2.71 2.21 -2.49 -6.91 -4.25 1.85
2005-2013 1.70 2.22 6.38 4.79 2.85 0.99 2.95 6.60 21.94 -2.14 -1.36 - - -
Sources: Appendix Table 5a and 7c.

50
Appendix Table 6: University Enrolment (Full-time and Part-time), Canada, Provinces and Nunavut, 1992-2013
Appendix Table 6a: University Enrolment (Full-time and Part-time), Both Sexes, Canada, Provinces and Nunavut, 1992-2013
Year Canada NL PEI NS NB QC ON MB SK AB BC NU
1992 885,645 17,856 3,636 37,881 24,822 257,472 339,048 37,587 32,895 68,271 66,171 -
1993 874,605 17,397 3,468 37,983 25,059 255,552 330,723 37,056 31,707 68,769 66,888 -
1994 858,972 17,169 3,132 37,245 24,783 248,421 324,387 35,769 31,248 67,434 69,381 -
1995 846,408 16,215 2,901 36,639 24,798 242,031 319,413 33,408 31,575 67,917 71,502 -
1996 829,767 16,053 2,739 36,834 23,628 235,692 306,834 32,055 31,320 70,032 74,580 -
1997 822,774 15,798 2,934 37,083 22,686 232,095 303,408 30,822 31,227 71,418 75,303 -
1998 826,362 15711 2,886 37,242 22,767 232,278 302,943 30,735 31,278 73,773 76,749 -
1999 847,032 16,278 3,096 37,137 22,374 237,855 312,315 30,696 31,452 81,552 74,277 -
2000 851,157 16,140 3,366 38,823 23,649 233,652 320,112 31,938 32,013 76,341 75,126 4
2001 887,244 16,275 3,354 40,575 24,312 240,669 335,721 34,143 32,673 79,131 80,388 12
2002 936,390 16,908 3,561 41,892 24,654 250,806 362,736 35,172 34,254 83,448 82,959 5
2003 993,711 17,550 3,855 44,778 25,554 260,058 397,773 38,046 34,560 86,097 85,440 18
2004 1,021,500 18,048 3,972 43,539 24,903 263,379 413,406 39,285 33,126 89,124 92,724 10
2005 1,050,057 18,336 3,849 43,308 25,014 265,992 431,040 39,615 20,622 91,665 110,619 7
2006 1,066,770 17,811 3,999 42,465 23,757 266,709 440,607 40,119 20,604 94,149 116,550 9
2007 1,072,902 17,523 3,837 41442 23,682 268,011 446,196 39,567 20,607 94,659 117,375 5
2008 1,113,507 17,322 4,089 40,890 23,004 269,091 448,470 42,081 19,818 93,774 154,968 8
2009 1,201,062 17,967 4,227 41,886 23,349 277,398 468,834 43,155 31,683 125,607 166,953 10
2010 1,235,916 18,324 4,401 42,831 23,415 287,475 483,780 43,632 31,848 128,361 171,840 10
2011 1,261,911 18,417 4,491 43,305 23,250 294,525 495,906 44,610 33,276 130,113 174,015 10
2012 1,283,241 18,615 4,362 43,824 22,644 300,612 504,972 45,336 34,509 131,799 176,562 10
2013 1,300,440 18,096 4,197 43,905 21,843 307,548 512,712 45,876 34,701 131,742 179,817 - Compound Annual Growth Rates
1992-2013 1.85 0.06 0.69 0.71 -0.61 0.85 1.99 0.95 0.25 3.18 4.88 -
1992-2000 -0.50 -1.26 -0.96 0.31 -0.60 -1.21 -0.72 -2.02 -0.34 1.41 1.60 -
2000-2013 3.31 0.88 1.71 0.95 -0.61 2.14 3.69 2.82 0.62 4.29 6.94 -
2000-2005 4.29 2.58 2.72 2.21 1.13 2.63 6.13 4.40 -8.42 3.73 8.05 -
2005-2013 2.71 -0.16 1.09 0.17 -1.68 1.83 2.19 1.85 6.72 4.64 6.26 -
Sources: Statistics Canada. Table 477-0019. Nunavut university data based on number of BEd graduates associated with Nunavut Arctic College, taken from correspondence with the College.
Notes: Years refer to the year in which the school year began. For example, 2006 data refer to the 2006/2007 school year, which began in September 2006.
51
Appendix Table 6b: University Enrolment Rate (Full-time and Part-time Enrolment), Proportion of the Total Population Aged 18-22, Both Sexes, Per Cent, Canada, Provinces and Nunavut, 1992-
2013
Year Canada NL PEI NS NB QC ON MB SK AB BC NU
1992 44.2 33.9 36.7 381.9 42.1 54.8 44.7 45.9 47.2 35.8 28.2 -
1993 44.1 33.6 34.8 380.9 43.0 54.6 44.5 45.6 45.1 36.6 28.4 -
1994 43.7 34.3 31.7 376.9 43.4 53.0 44.3 44.5 44.2 36.0 29.2 -
1995 42.8 34.0 29.8 375.9 44.3 50.8 43.7 42.1 43.7 35.8 29.5 -
1996 41.6 35.2 28.0 376.2 43.0 48.7 42.1 40.5 42.5 36.0 29.5 -
1997 40.8 36.2 30.1 380.5 42.1 47.1 41.4 39.2 41.9 35.6 29.1 -
1998 40.6 38.0 30.3 391.2 43.4 46.5 41.0 39.5 41.8 35.3 29.5 -
1999 41.1 40.8 32.5 389.9 43.3 46.9 41.6 39.2 41.9 37.9 28.3 -
2000 40.7 41.5 34.9 402.5 46.1 46.0 41.6 40.4 43.0 34.5 28.1 0.2
2001 41.7 42.4 34.4 416.0 47.4 47.6 42.2 42.7 43.6 34.5 29.1 0.5
2002 43.3 44.6 36.8 433.1 48.0 50.0 44.4 43.4 45.3 35.3 29.3 0.2
2003 45.4 47.2 39.3 456.5 50.1 52.6 47.5 46.2 45.1 35.7 29.8 0.7
2004 46.4 49.3 39.8 435.8 49.3 54.2 48.5 47.0 42.9 36.1 32.2 0.4
2005 47.5 52.1 38.8 436.9 50.6 55.6 49.8 46.9 27.2 36.0 38.6 0.3
2006 48.0 52.6 41.3 438.7 48.9 56.2 50.4 47.4 27.6 36.0 40.7 0.3
2007 48.0 53.2 39.8 430.1 49.4 56.2 50.7 46.5 27.3 35.6 40.5 0.2
2008 49.3 52.4 42.5 425.1 47.9 55.3 50.5 48.9 25.8 35.0 53.2 0.3
2009 52.4 54.3 43.7 432.6 48.4 55.2 52.2 49.3 40.7 46.9 57.0 0.3
2010 53.1 55.5 44.3 431.1 48.2 55.3 52.9 49.3 40.8 48.3 58.1 0.3
2011 53.5 56.6 44.7 431.2 47.8 55.5 53.2 50.0 42.7 48.8 58.6 0.3
2012 53.8 58.3 43.1 432.6 46.8 56.2 53.3 49.9 44.3 49.2 58.2 0.3
2013 54.5 58.6 42.1 440.6 46.1 58.1 53.8 50.1 44.8 48.9 58.5 0.3 Compound Annual Growth Rates
1992-2013 1.00 2.65 0.66 0.68 0.44 0.28 0.89 0.42 -0.25 1.50 3.53 -
1992-2000 -1.01 2.56 -0.61 0.66 1.14 -2.18 -0.87 -1.60 -1.18 -0.45 -0.06 -
2000-2013 2.26 2.70 1.46 0.70 0.00 1.82 1.99 1.68 0.32 2.71 5.80 4.24
2000-2005 3.10 4.66 2.16 1.66 1.86 3.88 3.64 3.06 -8.76 0.86 6.57 7.77
2005-2013 1.74 1.49 1.02 0.11 -1.14 0.56 0.98 0.82 6.45 3.88 5.32 2.09
Sources: Appendix Table 7c and Appendix Table 6a.

52
Appendix Table 7: Population, Canada, Provinces and Territories
Appendix Table 7a: Population, Both Sexes, Canada, Provinces and Territories, 1981-2014
Year Canada NL PEI NS NB QC ON MB SK AB BC YT NWT NU
1981 24,819,915 575,302 123,551 854,871 706,438 6,547,207 8,812,286 1,035,545 975,759 2,291,104 2,826,558 23,880 - -
1982 25,116,942 573,795 123,588 859,038 707,457 6,580,631 8,920,288 1,045,224 986,582 2,369,827 2,876,513 24,668 - -
1983 25,366,451 579,164 125,102 868,289 714,842 6,602,976 9,039,564 1,059,752 1,001,249 2,393,587 2,907,502 23,664 - -
1984 25,607,053 580,065 126,563 877,471 720,488 6,631,220 9,167,484 1,071,810 1,014,615 2,393,907 2,947,181 23,921 - -
1985 25,842,116 579,275 127,619 885,848 723,287 6,665,802 9,294,657 1,082,495 1,024,928 2,404,490 2,975,131 24,375 - -
1986 26,100,278 576,306 128,436 889,087 725,019 6,708,170 9,437,359 1,091,552 1,028,717 2,432,930 3,003,621 24,430 - -
1987 26,446,601 575,242 128,641 893,606 727,768 6,781,984 9,637,945 1,098,373 1,032,799 2,440,877 3,048,651 25,706 - -
1988 26,791,747 574,982 129,289 897,216 730,349 6,837,077 9,838,620 1,102,152 1,028,225 2,456,614 3,114,761 26,653 - -
1989 27,276,781 576,551 130,153 903,841 735,129 6,925,128 10,103,305 1,103,792 1,019,439 2,498,325 3,196,725 27,167 - -
1990 27,691,138 577,368 130,404 910,451 740,156 6,996,986 10,295,832 1,105,421 1,007,727 2,547,788 3,292,111 27,957 - -
1991 28,037,420 579,644 130,369 914,969 745,567 7,067,396 10,431,316 1,109,604 1,002,713 2,592,306 3,373,787 28,871 38,724 22,154
1992 28,371,264 580,109 130,827 919,451 748,121 7,110,010 10,572,205 1,112,689 1,003,995 2,632,672 3,468,802 30,084 39,416 22,883
1993 28,684,764 579,977 132,177 923,925 748,812 7,156,537 10,690,038 1,117,618 1,006,900 2,667,292 3,567,772 30,337 39,820 23,559
1994 29,000,663 574,466 133,437 926,871 750,185 7,192,403 10,819,146 1,123,230 1,009,575 2,700,606 3,676,075 29,684 40,578 24,407
1995 29,302,311 567,397 134,415 928,120 750,943 7,219,219 10,950,119 1,129,150 1,014,187 2,734,519 3,777,390 30,442 41,432 24,978
1996 29,610,218 559,698 135,737 931,327 752,268 7,246,897 11,082,903 1,134,196 1,018,945 2,775,133 3,874,317 31,387 41,741 25,669
1997 29,905,948 550,911 136,095 932,402 752,511 7,274,611 11,227,651 1,136,128 1,017,902 2,829,848 3,948,583 31,797 41,625 25,884
1998 30,155,173 539,843 135,804 931,836 750,530 7,295,935 11,365,901 1,137,489 1,017,332 2,899,066 3,983,113 31,149 40,802 26,373
1999 30,401,286 533,329 136,281 933,784 750,601 7,323,250 11,504,759 1,142,448 1,014,524 2,952,692 4,011,375 30,785 40,638 26,820
2000 30,685,730 527,966 136,470 933,821 750,517 7,356,951 11,683,290 1,147,313 1,007,565 3,004,198 4,039,230 30,431 40,480 27,498
2001 31,020,596 522,046 136,665 932,491 749,819 7,396,415 11,897,370 1,151,450 1,000,239 3,058,084 4,076,881 30,157 40,845 28,134
2002 31,358,418 519,483 136,876 935,155 749,379 7,441,498 12,093,299 1,156,636 996,816 3,128,262 4,100,161 30,337 41,694 28,822
2003 31,641,630 518,445 137,221 937,676 749,434 7,485,491 12,243,758 1,163,528 996,431 3,182,852 4,123,937 30,940 42,595 29,322
2004 31,938,004 517,402 137,681 939,612 749,408 7,535,278 12,390,068 1,173,223 997,312 3,238,387 4,155,017 31,454 43,305 29,857
2005 32,242,364 514,315 138,064 937,899 748,044 7,581,192 12,527,990 1,178,296 993,523 3,321,638 4,195,764 31,899 43,401 30,339
2006 32,570,505 510,584 137,865 937,869 745,609 7,631,873 12,661,566 1,183,524 992,302 3,421,361 4,241,691 32,271 43,178 30,812
2007 32,887,928 509,039 137,721 935,071 745,407 7,692,736 12,764,195 1,189,366 1,002,048 3,514,031 4,290,988 32,557 43,374 31,395
2008 33,245,773 511,543 138,764 935,865 746,855 7,761,504 12,882,625 1,197,774 1,017,346 3,595,755 4,349,412 33,088 43,350 31,892
2009 33,628,571 516,729 139,909 938,194 749,954 7,843,475 12,997,687 1,208,589 1,034,782 3,679,092 4,410,679 33,732 43,149 32,600
2010 34,005,274 521,972 141,678 942,073 753,044 7,929,365 13,135,063 1,220,930 1,051,425 3,732,573 4,465,924 34,596 43,278 33,353
2011 34,342,780 525,037 144,038 944,469 755,530 8,007,656 13,263,544 1,233,728 1,066,349 3,790,191 4,499,139 35,402 43,501 34,196
2012 34,751,476 526,895 145,259 944,835 756,836 8,084,768 13,409,558 1,250,406 1,087,223 3,888,552 4,542,578 36,189 43,648 34,729
2013 35,155,499 528,017 145,441 942,991 755,718 8,154,761 13,551,004 1,265,342 1,106,122 4,007,748 4,582,607 36,429 43,884 35,435
2014 35,543,658 529,069 146,162 942,387 754,578 8,214,885 13,677,687 1,280,242 1,122,283 4,120,897 4,638,415 36,990 43,980 36,083
Compound Annual Growth Rates
1991-2014 1.04 -0.40 0.50 0.13 0.05 0.66 1.19 0.62 0.49 2.04 1.39 1.08 0.55 2.14
2000-2014 1.06 0.01 0.49 0.07 0.04 0.79 1.13 0.79 0.77 2.28 0.99 1.40 0.59 1.96
2000-2005 0.99 -0.52 0.23 0.09 -0.07 0.60 1.41 0.53 -0.28 2.03 0.76 0.95 1.40 1.99
2005-2014 1.09 0.31 0.64 0.05 0.10 0.90 0.98 0.93 1.36 2.42 1.12 1.66 0.15 1.95
1991-2014 1.04 -0.40 0.50 0.13 0.05 0.66 1.19 0.62 0.49 2.04 1.39 1.08 0.55 2.14
2000-2014 1.06 0.01 0.49 0.07 0.04 0.79 1.13 0.79 0.77 2.28 0.99 1.40 0.59 1.96
Source: CANSIM table 015-0001.

53
Appendix Table 7b: Population Aged 5-17 (School Aged Population), Both Sexes, Canada, Provinces and Territories, 1981-2014
Year Canada NL PEI NS NB QC ON MB SK AB BC YT NWT NU
1981 5,111,600 158,816 28,785 189,384 165,174 1,297,441 1,791,448 219,002 214,399 480,664 547,356 5,403 - -
1982 5,006,960 154,097 27,956 184,015 160,398 1,261,407 1,752,853 214,948 210,788 482,763 538,725 5,326 - -
1983 4,906,618 150,823 27,343 179,338 156,682 1,228,210 1,718,074 212,043 208,695 476,866 530,127 4,826 - -
1984 4,847,382 147,036 27,012 176,303 153,479 1,209,125 1,698,237 210,283 208,427 470,709 528,299 4,815 - -
1985 4,826,565 143,678 26,774 174,284 151,015 1,203,898 1,691,518 209,738 209,460 469,307 527,862 4,928 - -
1986 4,824,948 139,749 26,367 171,709 148,814 1,204,818 1,693,574 209,657 209,845 473,245 528,032 4,937 - -
1987 4,836,497 136,222 26,127 169,954 147,165 1,209,234 1,706,345 209,382 209,866 472,953 530,209 5,119 - -
1988 4,852,627 133,215 26,046 168,061 145,361 1,208,221 1,723,205 208,482 208,903 475,015 537,033 5,222 - -
1989 4,883,130 130,173 26,015 165,995 143,569 1,211,455 1,742,873 207,198 207,300 482,218 546,950 5,346 - -
1990 4,933,018 126,701 25,866 164,766 141,858 1,217,715 1,765,874 207,185 205,798 494,088 563,369 5,548 - -
1991 4,984,705 123,370 25,823 163,844 140,389 1,225,980 1,788,077 207,756 205,605 506,455 577,046 5,648 8,427 6,285
1992 5,035,813 120,127 25,761 163,325 138,483 1,226,605 1,815,928 207,689 205,814 516,427 594,400 5,890 8,865 6,499
1993 5,068,521 116,877 25,762 162,646 136,308 1,221,949 1,835,467 207,641 206,171 523,514 610,461 5,867 9,080 6,778
1994 5,117,548 112,963 25,964 162,059 134,644 1,220,281 1,863,784 208,543 207,063 530,404 629,599 5,888 9,256 7,100
1995 5,177,683 109,947 26,147 162,710 133,358 1,220,355 1,897,592 210,828 207,962 538,836 647,020 6,168 9,411 7,349
1996 5,238,039 106,357 26,250 163,128 132,391 1,224,010 1,933,793 212,522 208,142 545,980 662,065 6,373 9,490 7,538
1997 5,286,018 102,166 26,147 162,392 131,183 1,221,433 1,969,322 213,375 207,015 554,974 674,251 6,480 9,544 7,736
1998 5,318,539 97,839 25,957 161,018 129,258 1,215,654 2,003,425 213,632 205,976 563,776 678,355 6,338 9,477 7,834
1999 5,330,242 94,392 25,783 159,778 127,688 1,206,866 2,027,753 214,541 203,630 566,917 679,119 6,227 9,490 8,058
2000 5,348,557 91,071 25,483 158,207 125,812 1,201,534 2,058,511 215,168 200,373 569,849 678,797 6,083 9,410 8,259
2001 5,364,395 87,765 25,318 156,515 123,741 1,199,785 2,085,902 215,420 196,259 572,414 677,562 5,898 9,431 8,385
2002 5,370,784 84,840 24,970 154,263 121,546 1,197,393 2,108,598 215,099 192,603 576,996 670,687 5,774 9,476 8,539
2003 5,345,754 82,262 24,403 151,924 119,456 1,190,133 2,110,893 214,453 188,842 576,746 662,807 5,741 9,476 8,618
2004 5,316,458 79,921 23,917 149,316 117,491 1,181,710 2,107,379 214,209 185,355 575,713 657,705 5,677 9,415 8,650
2005 5,297,301 78,053 23,627 146,635 115,929 1,177,830 2,102,751 213,086 181,860 579,130 654,855 5,619 9,208 8,718
2006 5,265,854 75,824 23,208 143,620 113,590 1,172,061 2,089,602 211,757 178,519 583,803 650,762 5,493 8,943 8,672
2007 5,217,659 74,126 22,575 140,058 111,387 1,158,586 2,074,214 209,999 176,487 583,671 643,707 5,405 8,776 8,668
2008 5,158,915 72,554 22,169 136,134 109,079 1,137,702 2,055,882 207,920 174,722 582,697 637,526 5,361 8,512 8,657
2009 5,112,611 71,675 21,862 132,722 107,038 1,116,333 2,041,180 207,087 174,081 584,384 634,058 5,286 8,258 8,647
2010 5,070,839 70,807 21,625 129,937 105,063 1,096,389 2,028,278 206,719 173,931 585,242 630,902 5,274 8,023 8,649
2011 5,042,068 70,157 21,623 127,436 103,187 1,083,351 2,015,498 207,609 173,869 590,095 627,515 5,217 7,871 8,640
2012 5,019,450 69,525 21,447 124,899 101,672 1,075,835 1,999,085 208,130 175,519 598,992 622,641 5,257 7,789 8,659
2013 5,005,463 69,054 21,159 122,745 100,389 1,073,659 1,982,313 208,102 177,307 611,351 617,639 5,190 7,747 8,808
2014 5,001,784 68,779 21,067 120,922 99,451 1,074,779 1,966,588 208,827 179,808 624,024 615,746 5,245 7,645 8,903
Compound Annual Growth Rates
1989-2014 0.10 -2.52 -0.84 -1.26 -1.46 -0.48 0.48 0.03 -0.57 1.04 0.48 -0.08 - -
1991-2014 0.01 -2.51 -0.88 -1.31 -1.49 -0.57 0.41 0.02 -0.58 0.91 0.28 -0.32 -0.42 1.53
1989-2000 0.83 -3.20 -0.19 -0.44 -1.19 -0.07 1.52 0.34 -0.31 1.53 1.98 1.18 - -
2000-2014 -0.48 -1.99 -1.35 -1.90 -1.67 -0.79 -0.33 -0.21 -0.77 0.65 -0.69 -1.05 -1.47 0.54
2000-2005 -0.19 -3.04 -1.50 -1.51 -1.62 -0.40 0.43 -0.19 -1.92 0.32 -0.72 -1.57 -0.43 1.09
2005-2014 -0.64 -1.40 -1.27 -2.12 -1.69 -1.01 -0.74 -0.22 -0.13 0.83 -0.68 -0.76 -2.05 0.23
Source: CANSIM table 051-0001.
Note: Values are computed by subtracting the 0-4 population from the 0 to 17 population.
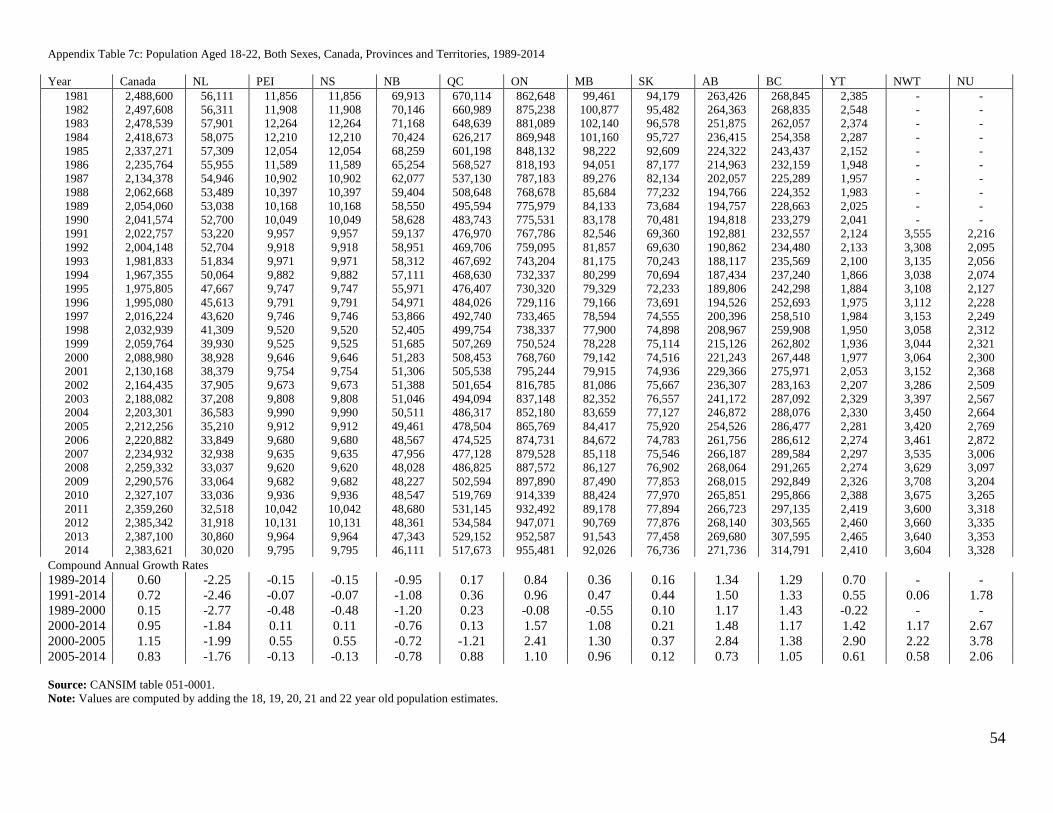
54
Appendix Table 7c: Population Aged 18-22, Both Sexes, Canada, Provinces and Territories, 1989-2014
Year Canada NL PEI NS NB QC ON MB SK AB BC YT NWT NU
1981 2,488,600 56,111 11,856 11,856 69,913 670,114 862,648 99,461 94,179 263,426 268,845 2,385 - -
1982 2,497,608 56,311 11,908 11,908 70,146 660,989 875,238 100,877 95,482 264,363 268,835 2,548 - -
1983 2,478,539 57,901 12,264 12,264 71,168 648,639 881,089 102,140 96,578 251,875 262,057 2,374 - -
1984 2,418,673 58,075 12,210 12,210 70,424 626,217 869,948 101,160 95,727 236,415 254,358 2,287 - -
1985 2,337,271 57,309 12,054 12,054 68,259 601,198 848,132 98,222 92,609 224,322 243,437 2,152 - -
1986 2,235,764 55,955 11,589 11,589 65,254 568,527 818,193 94,051 87,177 214,963 232,159 1,948 - -
1987 2,134,378 54,946 10,902 10,902 62,077 537,130 787,183 89,276 82,134 202,057 225,289 1,957 - -
1988 2,062,668 53,489 10,397 10,397 59,404 508,648 768,678 85,684 77,232 194,766 224,352 1,983 - -
1989 2,054,060 53,038 10,168 10,168 58,550 495,594 775,979 84,133 73,684 194,757 228,663 2,025 - -
1990 2,041,574 52,700 10,049 10,049 58,628 483,743 775,531 83,178 70,481 194,818 233,279 2,041 - -
1991 2,022,757 53,220 9,957 9,957 59,137 476,970 767,786 82,546 69,360 192,881 232,557 2,124 3,555 2,216
1992 2,004,148 52,704 9,918 9,918 58,951 469,706 759,095 81,857 69,630 190,862 234,480 2,133 3,308 2,095
1993 1,981,833 51,834 9,971 9,971 58,312 467,692 743,204 81,175 70,243 188,117 235,569 2,100 3,135 2,056
1994 1,967,355 50,064 9,882 9,882 57,111 468,630 732,337 80,299 70,694 187,434 237,240 1,866 3,038 2,074
1995 1,975,805 47,667 9,747 9,747 55,971 476,407 730,320 79,329 72,233 189,806 242,298 1,884 3,108 2,127
1996 1,995,080 45,613 9,791 9,791 54,971 484,026 729,116 79,166 73,691 194,526 252,693 1,975 3,112 2,228
1997 2,016,224 43,620 9,746 9,746 53,866 492,740 733,465 78,594 74,555 200,396 258,510 1,984 3,153 2,249
1998 2,032,939 41,309 9,520 9,520 52,405 499,754 738,337 77,900 74,898 208,967 259,908 1,950 3,058 2,312
1999 2,059,764 39,930 9,525 9,525 51,685 507,269 750,524 78,228 75,114 215,126 262,802 1,936 3,044 2,321
2000 2,088,980 38,928 9,646 9,646 51,283 508,453 768,760 79,142 74,516 221,243 267,448 1,977 3,064 2,300
2001 2,130,168 38,379 9,754 9,754 51,306 505,538 795,244 79,915 74,936 229,366 275,971 2,053 3,152 2,368
2002 2,164,435 37,905 9,673 9,673 51,388 501,654 816,785 81,086 75,667 236,307 283,163 2,207 3,286 2,509
2003 2,188,082 37,208 9,808 9,808 51,046 494,094 837,148 82,352 76,557 241,172 287,092 2,329 3,397 2,567
2004 2,203,301 36,583 9,990 9,990 50,511 486,317 852,180 83,659 77,127 246,872 288,076 2,330 3,450 2,664
2005 2,212,256 35,210 9,912 9,912 49,461 478,504 865,769 84,417 75,920 254,526 286,477 2,281 3,420 2,769
2006 2,220,882 33,849 9,680 9,680 48,567 474,525 874,731 84,672 74,783 261,756 286,612 2,274 3,461 2,872
2007 2,234,932 32,938 9,635 9,635 47,956 477,128 879,528 85,118 75,546 266,187 289,584 2,297 3,535 3,006
2008 2,259,332 33,037 9,620 9,620 48,028 486,825 887,572 86,127 76,902 268,064 291,265 2,274 3,629 3,097
2009 2,290,576 33,064 9,682 9,682 48,227 502,594 897,890 87,490 77,853 268,015 292,849 2,326 3,708 3,204
2010 2,327,107 33,036 9,936 9,936 48,547 519,769 914,339 88,424 77,970 265,851 295,866 2,388 3,675 3,265
2011 2,359,260 32,518 10,042 10,042 48,680 531,145 932,492 89,178 77,894 266,723 297,135 2,419 3,600 3,318
2012 2,385,342 31,918 10,131 10,131 48,361 534,584 947,071 90,769 77,876 268,140 303,565 2,460 3,660 3,335
2013 2,387,100 30,860 9,964 9,964 47,343 529,152 952,587 91,543 77,458 269,680 307,595 2,465 3,640 3,353
2014 2,383,621 30,020 9,795 9,795 46,111 517,673 955,481 92,026 76,736 271,736 314,791 2,410 3,604 3,328
Compound Annual Growth Rates
1989-2014 0.60 -2.25 -0.15 -0.15 -0.95 0.17 0.84 0.36 0.16 1.34 1.29 0.70 - -
1991-2014 0.72 -2.46 -0.07 -0.07 -1.08 0.36 0.96 0.47 0.44 1.50 1.33 0.55 0.06 1.78
1989-2000 0.15 -2.77 -0.48 -0.48 -1.20 0.23 -0.08 -0.55 0.10 1.17 1.43 -0.22 - -
2000-2014 0.95 -1.84 0.11 0.11 -0.76 0.13 1.57 1.08 0.21 1.48 1.17 1.42 1.17 2.67
2000-2005 1.15 -1.99 0.55 0.55 -0.72 -1.21 2.41 1.30 0.37 2.84 1.38 2.90 2.22 3.78
2005-2014 0.83 -1.76 -0.13 -0.13 -0.78 0.88 1.10 0.96 0.12 0.73 1.05 0.61 0.58 2.06
Source: CANSIM table 051-0001.
Note: Values are computed by adding the 18, 19, 20, 21 and 22 year old population estimates.

55
Appendix Table 7d: Population Aged 25 and Over, Both Sexes, Canada, Provinces and Territories, 1989-2014
Year Canada NL PEI NS NB QC ON MB SK AB BC YT NWT NU
1981 14,440,952 290,239 69,190 488,592 391,345 3,835,024 5,230,705 602,263 549,635 1,243,884 1,706,116 12,925 - -
1982 14,804,225 294,999 70,203 497,667 398,597 3,915,633 5,352,668 613,547 561,115 1,306,624 1,757,635 13,372 - -
1983 15,144,969 302,149 71,743 508,784 408,282 3,990,465 5,481,046 626,904 573,499 1,345,584 1,800,456 13,072 - -
1984 15,481,564 307,524 73,271 519,977 417,477 4,068,177 5,617,409 639,179 585,877 1,369,386 1,845,651 13,462 - -
1985 15,820,562 312,507 74,667 531,784 425,563 4,149,860 5,755,865 651,949 597,176 1,396,579 1,885,372 13,893 - -
1986 16,182,220 316,573 76,205 541,263 433,188 4,238,069 5,909,731 664,367 605,639 1,430,969 1,925,949 14,230 - -
1987 16,600,728 321,716 77,223 551,988 441,479 4,344,179 6,102,116 675,545 615,172 1,455,406 1,974,095 15,269 - -
1988 17,016,015 327,213 78,594 562,102 449,810 4,438,056 6,292,540 684,983 621,055 1,483,837 2,034,690 16,108 - -
1989 17,498,890 333,618 79,997 573,318 458,840 4,545,084 6,521,214 692,155 623,111 1,523,464 2,103,536 16,545 - -
1990 17,902,486 339,733 80,932 583,424 467,346 4,631,866 6,693,200 697,832 621,968 1,563,738 2,176,260 17,114 - -
1991 18,228,512 346,000 81,405 591,176 474,701 4,700,617 6,818,698 703,581 622,268 1,600,042 2,242,045 17,766 20,962 9,251
1992 18,504,236 350,932 82,099 598,236 480,143 4,745,511 6,927,492 707,218 624,415 1,631,173 2,307,286 18,488 21,415 9,828
1993 18,781,114 355,850 83,302 604,688 484,292 4,791,043 7,031,851 712,229 627,290 1,661,501 2,378,194 18,727 21,869 10,278
1994 19,058,771 357,758 84,457 610,515 488,619 4,828,757 7,139,057 717,599 630,066 1,691,394 2,458,736 18,489 22,550 10,774
1995 19,338,131 358,772 85,586 615,297 492,849 4,863,186 7,251,107 723,448 633,976 1,722,003 2,538,621 19,004 23,245 11,037
1996 19,613,446 359,675 86,902 621,060 498,142 4,896,647 7,363,216 729,087 637,990 1,755,482 2,610,594 19,735 23,521 11,395
1997 19,892,117 359,705 87,873 626,576 502,867 4,933,658 7,485,823 733,508 639,543 1,797,008 2,670,198 20,178 23,624 11,556
1998 20,129,890 357,840 88,471 630,805 506,228 4,964,449 7,596,062 737,328 641,691 1,845,397 2,706,432 19,949 23,377 11,861
1999 20,366,747 357,682 89,453 636,152 510,070 5,003,766 7,705,811 742,347 642,455 1,887,062 2,736,676 19,797 23,348 12,128
2000 20,635,305 357,959 90,051 639,318 513,569 5,052,189 7,840,978 747,533 641,344 1,929,558 2,767,220 19,715 23,353 12,518
2001 20,939,306 357,457 90,693 642,183 516,577 5,107,031 7,999,461 752,378 639,988 1,973,879 2,803,336 19,730 23,664 12,929
2002 21,256,848 358,981 91,484 647,971 519,734 5,163,796 8,159,213 757,995 640,679 2,028,356 2,830,982 19,930 24,388 13,339
2003 21,538,117 361,600 92,329 652,615 522,834 5,220,518 8,288,740 764,683 643,410 2,073,758 2,858,526 20,392 25,075 13,637
2004 21,828,037 363,764 93,238 657,445 525,392 5,280,794 8,416,191 772,754 646,815 2,119,045 2,892,076 20,871 25,680 13,972
2005 22,131,438 364,952 94,156 660,186 527,883 5,341,764 8,538,747 778,353 648,626 2,181,610 2,933,480 21,370 25,973 14,338
2006 22,452,465 365,577 94,843 664,421 529,717 5,404,680 8,659,900 784,256 651,868 2,254,556 2,980,022 21,857 26,081 14,687
2007 22,767,560 366,627 95,357 665,734 532,424 5,470,030 8,766,584 789,925 660,685 2,327,567 3,029,020 22,167 26,411 15,029
2008 23,109,169 370,017 96,620 669,520 536,003 5,536,842 8,884,444 797,214 672,790 2,396,226 3,084,956 22,701 26,514 15,322
2009 23,462,484 375,410 97,801 674,088 540,571 5,610,357 8,996,403 805,486 686,734 2,467,878 3,142,175 23,285 26,520 15,776
2010 23,808,807 381,022 99,481 679,514 544,832 5,687,942 9,121,939 814,808 700,331 2,517,790 3,194,039 24,040 26,793 16,276
2011 24,121,813 385,094 101,571 684,150 548,997 5,758,047 9,239,454 824,664 713,264 2,567,403 3,230,419 24,766 27,121 16,863
2012 24,489,705 388,238 102,748 687,233 552,144 5,826,153 9,378,780 837,695 729,327 2,646,616 3,270,725 25,384 27,366 17,296
2013 24,857,956 390,829 103,205 689,421 553,650 5,888,323 9,517,381 849,986 744,165 2,739,673 3,310,152 25,636 27,739 17,796
2014 25,222,416 393,272 104,077 692,238 555,157 5,950,001 9,647,151 862,173 757,309 2,829,096 3,359,611 26,079 27,951 18,301
Compound Annual Growth Rates
1989-2014 1.47 0.66 1.06 0.76 0.77 1.08 1.58 0.88 0.78 2.51 1.89 1.84 - -
1991-2014 1.42 0.56 1.07 0.69 0.68 1.03 1.52 0.89 0.86 2.51 1.77 1.68 1.26 3.01
1989-2000 1.51 0.64 1.08 1.00 1.03 0.97 1.69 0.70 0.26 2.17 2.52 1.61 - -
2000-2014 1.44 0.67 1.04 0.57 0.56 1.18 1.49 1.02 1.19 2.77 1.40 2.02 1.29 2.75
2000-2005 1.41 0.39 0.90 0.64 0.55 1.12 1.72 0.81 0.23 2.49 1.17 1.63 2.15 2.75 Source: CANSIM table 051-0001. Note: Values are computed by subtracting the 18-24 population from the 18 and over population.
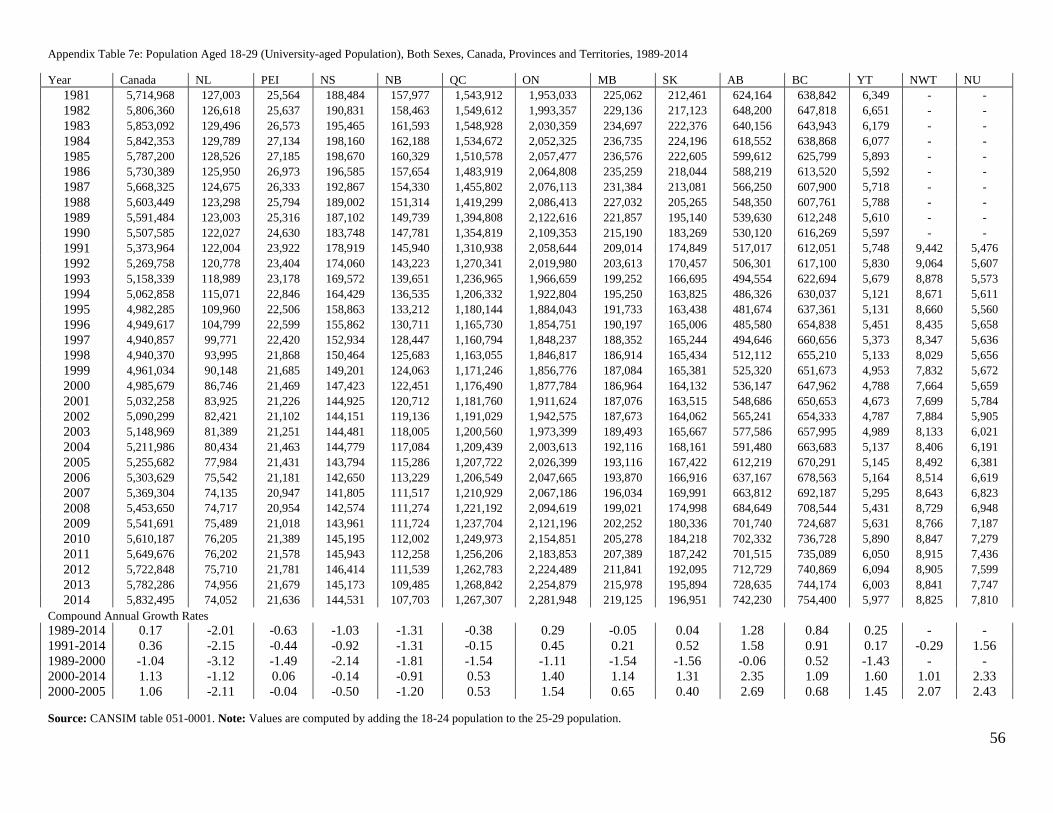
56
Appendix Table 7e: Population Aged 18-29 (University-aged Population), Both Sexes, Canada, Provinces and Territories, 1989-2014
Year Canada NL PEI NS NB QC ON MB SK AB BC YT NWT NU
1981 5,714,968 127,003 25,564 188,484 157,977 1,543,912 1,953,033 225,062 212,461 624,164 638,842 6,349 - -
1982 5,806,360 126,618 25,637 190,831 158,463 1,549,612 1,993,357 229,136 217,123 648,200 647,818 6,651 - -
1983 5,853,092 129,496 26,573 195,465 161,593 1,548,928 2,030,359 234,697 222,376 640,156 643,943 6,179 - -
1984 5,842,353 129,789 27,134 198,160 162,188 1,534,672 2,052,325 236,735 224,196 618,552 638,868 6,077 - -
1985 5,787,200 128,526 27,185 198,670 160,329 1,510,578 2,057,477 236,576 222,605 599,612 625,799 5,893 - -
1986 5,730,389 125,950 26,973 196,585 157,654 1,483,919 2,064,808 235,259 218,044 588,219 613,520 5,592 - -
1987 5,668,325 124,675 26,333 192,867 154,330 1,455,802 2,076,113 231,384 213,081 566,250 607,900 5,718 - -
1988 5,603,449 123,298 25,794 189,002 151,314 1,419,299 2,086,413 227,032 205,265 548,350 607,761 5,788 - -
1989 5,591,484 123,003 25,316 187,102 149,739 1,394,808 2,122,616 221,857 195,140 539,630 612,248 5,610 - -
1990 5,507,585 122,027 24,630 183,748 147,781 1,354,819 2,109,353 215,190 183,269 530,120 616,269 5,597 - -
1991 5,373,964 122,004 23,922 178,919 145,940 1,310,938 2,058,644 209,014 174,849 517,017 612,051 5,748 9,442 5,476
1992 5,269,758 120,778 23,404 174,060 143,223 1,270,341 2,019,980 203,613 170,457 506,301 617,100 5,830 9,064 5,607
1993 5,158,339 118,989 23,178 169,572 139,651 1,236,965 1,966,659 199,252 166,695 494,554 622,694 5,679 8,878 5,573
1994 5,062,858 115,071 22,846 164,429 136,535 1,206,332 1,922,804 195,250 163,825 486,326 630,037 5,121 8,671 5,611
1995 4,982,285 109,960 22,506 158,863 133,212 1,180,144 1,884,043 191,733 163,438 481,674 637,361 5,131 8,660 5,560
1996 4,949,617 104,799 22,599 155,862 130,711 1,165,730 1,854,751 190,197 165,006 485,580 654,838 5,451 8,435 5,658
1997 4,940,857 99,771 22,420 152,934 128,447 1,160,794 1,848,237 188,352 165,244 494,646 660,656 5,373 8,347 5,636
1998 4,940,370 93,995 21,868 150,464 125,683 1,163,055 1,846,817 186,914 165,434 512,112 655,210 5,133 8,029 5,656
1999 4,961,034 90,148 21,685 149,201 124,063 1,171,246 1,856,776 187,084 165,381 525,320 651,673 4,953 7,832 5,672
2000 4,985,679 86,746 21,469 147,423 122,451 1,176,490 1,877,784 186,964 164,132 536,147 647,962 4,788 7,664 5,659
2001 5,032,258 83,925 21,226 144,925 120,712 1,181,760 1,911,624 187,076 163,515 548,686 650,653 4,673 7,699 5,784
2002 5,090,299 82,421 21,102 144,151 119,136 1,191,029 1,942,575 187,673 164,062 565,241 654,333 4,787 7,884 5,905
2003 5,148,969 81,389 21,251 144,481 118,005 1,200,560 1,973,399 189,493 165,667 577,586 657,995 4,989 8,133 6,021
2004 5,211,986 80,434 21,463 144,779 117,084 1,209,439 2,003,613 192,116 168,161 591,480 663,683 5,137 8,406 6,191
2005 5,255,682 77,984 21,431 143,794 115,286 1,207,722 2,026,399 193,116 167,422 612,219 670,291 5,145 8,492 6,381
2006 5,303,629 75,542 21,181 142,650 113,229 1,206,549 2,047,665 193,870 166,916 637,167 678,563 5,164 8,514 6,619
2007 5,369,304 74,135 20,947 141,805 111,517 1,210,929 2,067,186 196,034 169,991 663,812 692,187 5,295 8,643 6,823
2008 5,453,650 74,717 20,954 142,574 111,274 1,221,192 2,094,619 199,021 174,998 684,649 708,544 5,431 8,729 6,948
2009 5,541,691 75,489 21,018 143,961 111,724 1,237,704 2,121,196 202,252 180,336 701,740 724,687 5,631 8,766 7,187
2010 5,610,187 76,205 21,389 145,195 112,002 1,249,973 2,154,851 205,278 184,218 702,332 736,728 5,890 8,847 7,279
2011 5,649,676 76,202 21,578 145,943 112,258 1,256,206 2,183,853 207,389 187,242 701,515 735,089 6,050 8,915 7,436
2012 5,722,848 75,710 21,781 146,414 111,539 1,262,783 2,224,489 211,841 192,095 712,729 740,869 6,094 8,905 7,599
2013 5,782,286 74,956 21,679 145,173 109,485 1,268,842 2,254,879 215,978 195,894 728,635 744,174 6,003 8,841 7,747
2014 5,832,495 74,052 21,636 144,531 107,703 1,267,307 2,281,948 219,125 196,951 742,230 754,400 5,977 8,825 7,810
Compound Annual Growth Rates
1989-2014 0.17 -2.01 -0.63 -1.03 -1.31 -0.38 0.29 -0.05 0.04 1.28 0.84 0.25 - -
1991-2014 0.36 -2.15 -0.44 -0.92 -1.31 -0.15 0.45 0.21 0.52 1.58 0.91 0.17 -0.29 1.56
1989-2000 -1.04 -3.12 -1.49 -2.14 -1.81 -1.54 -1.11 -1.54 -1.56 -0.06 0.52 -1.43 - -
2000-2014 1.13 -1.12 0.06 -0.14 -0.91 0.53 1.40 1.14 1.31 2.35 1.09 1.60 1.01 2.33
2000-2005 1.06 -2.11 -0.04 -0.50 -1.20 0.53 1.54 0.65 0.40 2.69 0.68 1.45 2.07 2.43
Source: CANSIM table 051-0001. Note: Values are computed by adding the 18-24 population to the 25-29 population.

57
Appendix 2: CSLS Estimates of HDI and its Components Appendix Table 8: Estimated Average Educational Attainment Using LFS data, Canada, Provinces and Territories, 1990-2014
Year Canada NL PEI NS NB QC ON MB SK AB BC YT NWT NU
1990 10.5 10.7 10.7 11.2 10.9 10.9 11.4 11.0 11.0 11.6 11.7 - - -
1991 11.3 10.8 10.8 11.2 10.9 11.0 11.4 11.1 11.0 11.7 11.7 - - -
1992 11.4 10.9 11.0 11.3 11.0 11.1 11.5 11.1 11.1 11.8 11.8 12.0 - -
1993 11.5 11.0 11.2 11.3 11.1 11.2 11.6 11.2 11.2 11.9 11.9 12.0 - -
1994 11.6 11.0 11.2 11.4 11.2 11.2 11.7 11.2 11.3 11.9 12.0 12.0 - -
1995 11.6 11.1 11.3 11.4 11.3 11.3 11.7 11.4 11.3 11.9 12.0 12.2 - -
1996 11.7 11.1 11.3 11.5 11.3 11.4 11.8 11.5 11.4 12.0 12.1 12.3 - -
1997 11.8 11.2 11.3 11.6 11.4 11.5 11.9 11.5 11.4 12.1 12.1 12.2 - -
1998 11.8 11.3 11.4 11.7 11.5 11.6 11.9 11.6 11.6 12.2 12.1 12.3 - -
1999 11.9 11.3 11.5 11.8 11.6 11.6 12.0 11.7 11.6 12.2 12.2 12.4 - -
2000 11.9 11.4 11.5 11.8 11.6 11.6 12.1 11.7 11.7 12.2 12.2 12.2 12.2 10.7
2001 12.0 11.5 11.7 11.9 11.7 11.7 12.2 11.8 11.7 12.3 12.3 12.6 12.2 10.7
2002 12.1 11.6 11.8 11.9 11.7 11.8 12.2 11.8 11.8 12.3 12.3 12.6 11.9 10.7
2003 12.1 11.7 11.9 12.0 11.8 11.9 12.3 11.9 11.9 12.3 12.3 12.5 11.9 10.7
2004 12.2 11.7 11.9 12.1 11.9 11.9 12.3 11.9 11.9 12.3 12.4 12.6 12.0 10.7
2005 12.2 11.8 12.0 12.1 11.9 12.0 12.3 12.0 12.0 12.4 12.4 12.5 11.9 10.3
2006 12.3 11.8 12.0 12.1 12.0 12.1 12.4 12.0 12.0 12.4 12.4 12.2 12.1 10.9
2007 12.3 11.8 12.0 12.2 12.0 12.1 12.5 12.0 12.1 12.5 12.5 12.4 12.2 11.2
2008 12.4 11.9 12.0 12.2 12.1 12.2 12.5 12.1 12.1 12.5 12.5 12.4 12.0 11.0
2009 12.4 11.9 12.1 12.2 12.1 12.2 12.5 12.2 12.2 12.6 12.6 12.3 11.9 10.9
2010 12.5 12.1 12.2 12.4 12.1 12.3 12.6 12.2 12.3 12.6 12.6 12.2 11.9 10.8
2011 12.5 12.1 12.3 12.4 12.1 12.3 12.6 12.3 12.3 12.6 12.7 12.5 12.2 10.9
2012 12.5 12.2 12.3 12.4 12.2 12.4 12.6 12.3 12.3 12.6 12.7 12.6 12.1 11.3
2013 12.6 12.3 12.4 12.5 12.2 12.4 12.7 12.3 12.4 12.6 12.7 12.7 12.0 11.8
2014 12.6 12.3 12.4 12.5 12.3 12.4 12.7 12.4 12.4 12.7 12.7 12.8 12.0 12.2 Compound Annual Growth Rates
1990-2014 0.75 0.56 0.63 0.49 0.51 0.55 0.44 0.49 0.51 0.36 0.35 - - -
1990-2000 1.25 0.60 0.76 0.58 0.60 0.65 0.57 0.65 0.59 0.45 0.41 - - -
2000-2014 0.39 0.52 0.53 0.42 0.44 0.48 0.35 0.37 0.44 0.29 0.31 0.36 -0.11 0.94
2000-2005 0.51 0.64 0.82 0.49 0.53 0.67 0.46 0.42 0.57 0.43 0.34 0.53 -0.39 -0.77
2005-2013 0.32 0.46 0.37 0.39 0.39 0.38 0.29 0.34 0.38 0.22 0.29 0.26 0.04 1.91
Sources: LFS data from CANSIM Table 2820004 for provinces, unpublished Yukon, Northwest Territories, and Nunavut data obtained from LFS by
special request from Statistics Canada.
Notes: LFS data is not available for Nunavut before 2004. Since there is no clear pattern in the yearly growth rates, estimates for 2000-2003
(italicized) are assumed to be equal to the 2004 estimate. Average educational attainment for Northwest Territories (2000) was estimated in
the same manner.
CSLS allocates 8 years for those with at most primary, 12 years for those with at most secondary and 14 years for those with tertiary
schooling.
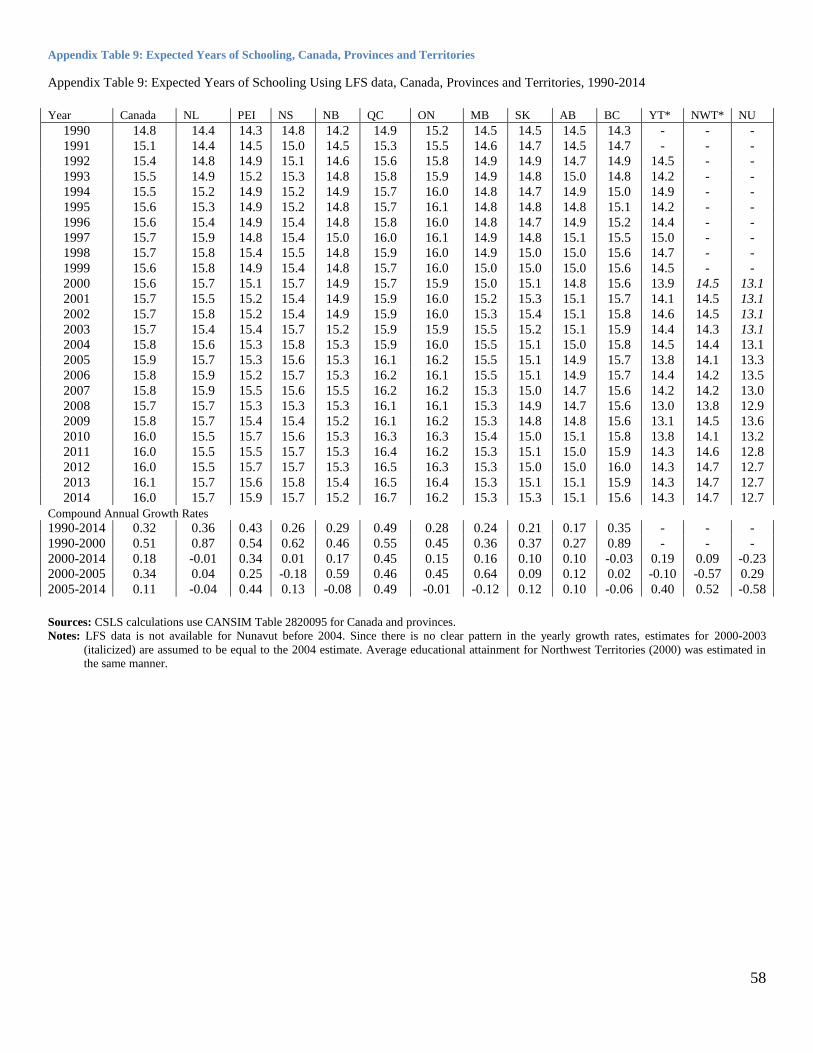
58
Appendix Table 9: Expected Years of Schooling, Canada, Provinces and Territories
Appendix Table 9: Expected Years of Schooling Using LFS data, Canada, Provinces and Territories, 1990-2014 Year Canada NL PEI NS NB QC ON MB SK AB BC YT* NWT* NU
1990 14.8 14.4 14.3 14.8 14.2 14.9 15.2 14.5 14.5 14.5 14.3 - - -
1991 15.1 14.4 14.5 15.0 14.5 15.3 15.5 14.6 14.7 14.5 14.7 - - -
1992 15.4 14.8 14.9 15.1 14.6 15.6 15.8 14.9 14.9 14.7 14.9 14.5 - -
1993 15.5 14.9 15.2 15.3 14.8 15.8 15.9 14.9 14.8 15.0 14.8 14.2 - -
1994 15.5 15.2 14.9 15.2 14.9 15.7 16.0 14.8 14.7 14.9 15.0 14.9 - -
1995 15.6 15.3 14.9 15.2 14.8 15.7 16.1 14.8 14.8 14.8 15.1 14.2 - -
1996 15.6 15.4 14.9 15.4 14.8 15.8 16.0 14.8 14.7 14.9 15.2 14.4 - -
1997 15.7 15.9 14.8 15.4 15.0 16.0 16.1 14.9 14.8 15.1 15.5 15.0 - -
1998 15.7 15.8 15.4 15.5 14.8 15.9 16.0 14.9 15.0 15.0 15.6 14.7 - -
1999 15.6 15.8 14.9 15.4 14.8 15.7 16.0 15.0 15.0 15.0 15.6 14.5 - -
2000 15.6 15.7 15.1 15.7 14.9 15.7 15.9 15.0 15.1 14.8 15.6 13.9 14.5 13.1
2001 15.7 15.5 15.2 15.4 14.9 15.9 16.0 15.2 15.3 15.1 15.7 14.1 14.5 13.1
2002 15.7 15.8 15.2 15.4 14.9 15.9 16.0 15.3 15.4 15.1 15.8 14.6 14.5 13.1
2003 15.7 15.4 15.4 15.7 15.2 15.9 15.9 15.5 15.2 15.1 15.9 14.4 14.3 13.1
2004 15.8 15.6 15.3 15.8 15.3 15.9 16.0 15.5 15.1 15.0 15.8 14.5 14.4 13.1
2005 15.9 15.7 15.3 15.6 15.3 16.1 16.2 15.5 15.1 14.9 15.7 13.8 14.1 13.3
2006 15.8 15.9 15.2 15.7 15.3 16.2 16.1 15.5 15.1 14.9 15.7 14.4 14.2 13.5
2007 15.8 15.9 15.5 15.6 15.5 16.2 16.2 15.3 15.0 14.7 15.6 14.2 14.2 13.0
2008 15.7 15.7 15.3 15.3 15.3 16.1 16.1 15.3 14.9 14.7 15.6 13.0 13.8 12.9
2009 15.8 15.7 15.4 15.4 15.2 16.1 16.2 15.3 14.8 14.8 15.6 13.1 14.5 13.6
2010 16.0 15.5 15.7 15.6 15.3 16.3 16.3 15.4 15.0 15.1 15.8 13.8 14.1 13.2
2011 16.0 15.5 15.5 15.7 15.3 16.4 16.2 15.3 15.1 15.0 15.9 14.3 14.6 12.8
2012 16.0 15.5 15.7 15.7 15.3 16.5 16.3 15.3 15.0 15.0 16.0 14.3 14.7 12.7
2013 16.1 15.7 15.6 15.8 15.4 16.5 16.4 15.3 15.1 15.1 15.9 14.3 14.7 12.7
2014 16.0 15.7 15.9 15.7 15.2 16.7 16.2 15.3 15.3 15.1 15.6 14.3 14.7 12.7
Compound Annual Growth Rates
1990-2014 0.32 0.36 0.43 0.26 0.29 0.49 0.28 0.24 0.21 0.17 0.35 - - -
1990-2000 0.51 0.87 0.54 0.62 0.46 0.55 0.45 0.36 0.37 0.27 0.89 - - -
2000-2014 0.18 -0.01 0.34 0.01 0.17 0.45 0.15 0.16 0.10 0.10 -0.03 0.19 0.09 -0.23
2000-2005 0.34 0.04 0.25 -0.18 0.59 0.46 0.45 0.64 0.09 0.12 0.02 -0.10 -0.57 0.29
2005-2014 0.11 -0.04 0.44 0.13 -0.08 0.49 -0.01 -0.12 0.12 0.10 -0.06 0.40 0.52 -0.58
Sources: CSLS calculations use CANSIM Table 2820095 for Canada and provinces.
Notes: LFS data is not available for Nunavut before 2004. Since there is no clear pattern in the yearly growth rates, estimates for 2000-2003
(italicized) are assumed to be equal to the 2004 estimate. Average educational attainment for Northwest Territories (2000) was estimated in
the same manner.

59
Appendix Table 10: GNI, Canada, Provinces and Territories, 1981-2014
Appendix Table 10a: GNI, Millions of Current Dollars, Canada, Provinces and Territories, 1981-2014
Year Canada NL PEI NS NB QC ON MB SK AB BC YT NWT NU
1981 367,121 5,247 1,072 8,066 6,624 82,453 132,336 13,839 15,101 54,491 45,999 495 .. ..
1982 386,773 5,646 1,151 9,389 7,263 87,281 139,969 14,342 15,276 58,335 45,928 486 .. ..
1983 419,691 6,056 1,335 10,627 8,292 94,115 156,545 15,381 16,225 60,239 48,540 460 .. ..
1984 460,243 6,491 1,376 11,896 9,174 102,992 175,735 17,290 17,310 64,590 50,949 473 .. ..
1985 498,075 6,813 1,437 12,894 9,758 110,084 193,511 18,848 18,189 68,906 54,868 512 .. ..
1986 524,450 7,378 1,672 14,051 10,950 119,800 212,800 19,395 17,958 59,613 57,943 655 .. ..
1987 571,926 7,977 1,771 15,066 12,044 131,308 235,504 20,772 18,496 61,564 64,039 920 .. ..
1988 624,401 8,568 1,942 15,909 12,828 143,220 260,275 22,423 19,121 65,363 70,943 1,006 .. ..
1989 669,026 9,068 2,091 17,031 13,441 150,298 282,766 23,831 20,125 69,096 77,267 1,069 .. ..
1990 692,997 9,300 2,183 17,602 13,770 155,692 287,334 24,752 21,623 75,284 81,223 1,106 .. ..
1991 699,253 9,704 2,258 18,257 13,910 157,509 288,217 24,607 21,783 75,046 83,779 1,008 .. ..
1992 716,019 9,677 2,303 18,749 14,372 160,868 293,068 25,093 21,723 76,639 89,356 1,179 .. ..
1993 744,608 9,878 2,488 18,898 15,096 164,840 302,245 25,134 23,088 82,913 96,066 958 .. ..
1994 789,507 10,398 2,543 19,247 15,762 174,054 319,986 26,640 24,670 89,886 102,426 991 .. ..
1995 828,973 10,855 2,671 19,801 16,994 181,452 337,400 27,653 26,584 93,614 107,931 1,131 .. ..
1996 857,023 10,610 2,827 20,025 17,257 184,390 347,842 29,062 29,102 100,517 111,195 1,221 .. ..
1997 903,902 10,716 2,837 20,956 17,404 192,942 368,960 30,189 29,177 109,163 117,135 1,185 .. ..
1998 937,295 11,273 2,979 21,978 18,165 200,301 389,250 31,690 29,855 109,317 118,186 1,129 .. ..
1999 1,004,456 12,347 3,160 23,771 19,693 215,431 418,245 32,780 31,117 119,077 123,959 1,144 2,432 813
2000 1,102,380 14,148 3,385 25,475 20,820 230,258 452,238 34,901 34,287 146,939 134,606 1,260 2,664 890
2001 1,140,505 14,433 3,448 26,723 21,430 238,548 469,084 36,080 33,704 154,230 136,852 1,337 3,152 933
2002 1,189,452 16,722 3,705 28,006 22,012 249,671 494,815 37,588 35,062 153,801 141,946 1,317 3,205 1,019
2003 1,250,315 18,400 3,801 29,786 23,093 259,094 509,511 38,521 37,528 173,951 149,751 1,358 3,893 1,029
2004 1,331,178 19,651 4,026 30,871 24,408 271,833 533,365 41,022 41,529 194,484 162,293 1,463 4,516 1,117
2005 1,417,028 22,249 4,257 32,127 25,552 280,133 556,635 43,082 44,889 225,460 174,855 1,572 4,445 1,161
2006 1,492,207 24,573 4,425 32,701 26,718 290,595 578,241 46,622 46,171 245,929 188,219 1,700 4,437 1,240
2007 1,573,532 29,065 4,630 33,941 28,287 306,029 601,735 49,726 52,381 260,964 198,325 1,814 4,667 1,319
2008 1,652,923 31,572 4,754 35,416 28,779 314,380 608,446 52,154 67,619 296,072 204,406 2,043 5,024 1,566
2009 1,567,365 25,001 4,927 34,931 28,857 314,541 597,882 50,804 60,080 245,690 196,250 2,134 4,012 1,535
2010 1,662,130 29,085 5,222 36,849 30,213 328,138 630,989 53,308 63,368 270,049 205,117 2,311 4,816 1,914
2011 1,769,921 33,539 5,424 37,652 31,500 344,735 659,743 56,197 74,821 299,521 216,786 2,492 4,730 2,034
2012 1,822,808 32,032 5,573 37,835 31,723 354,040 680,084 59,781 77,957 312,485 221,414 2,551 4,393 2,199
2013 1,892,193 34,991 5,783 38,576 31,857 361,211 693,210 61,897 83,496 344,452 226,605 2,550 4,490 2,339
2014 1,973,043 33,514 6,003 39,077 32,056 370,064 721,970 64,077 82,780 375,756 237,188 2,603 4,731 2,487
1991-2014 4.61 4.34 3.36 3.70 3.78 4.07 4.25 5.98 7.25 4.63 4.21 - - 5.28
1991-2000 5.19 4.60 3.77 4.58 4.31 5.13 3.96 5.17 7.75 5.41 2.51 - - 5.42
2000-2014 4.25 4.18 3.10 3.13 3.45 3.40 4.44 6.50 6.94 4.13 5.32 4.19 7.62 5.19
2000-2005 5.15 4.69 4.75 4.18 4.00 4.24 4.30 5.54 8.94 5.37 4.52 10.78 5.46 9.54
2005-2014 3.75 3.89 2.20 2.55 3.14 2.93 4.51 7.04 5.84 3.45 5.76 0.70 8.83 2.85
Sources: CANSIM table 3840001, 3800062.
Note: GNI=GDP in current dollars. 2011 CSLS estimates for provinces and territories (italicized) based on GDP projections from Appendix Table 2a multiplied by the national GNP/GDP ratio.
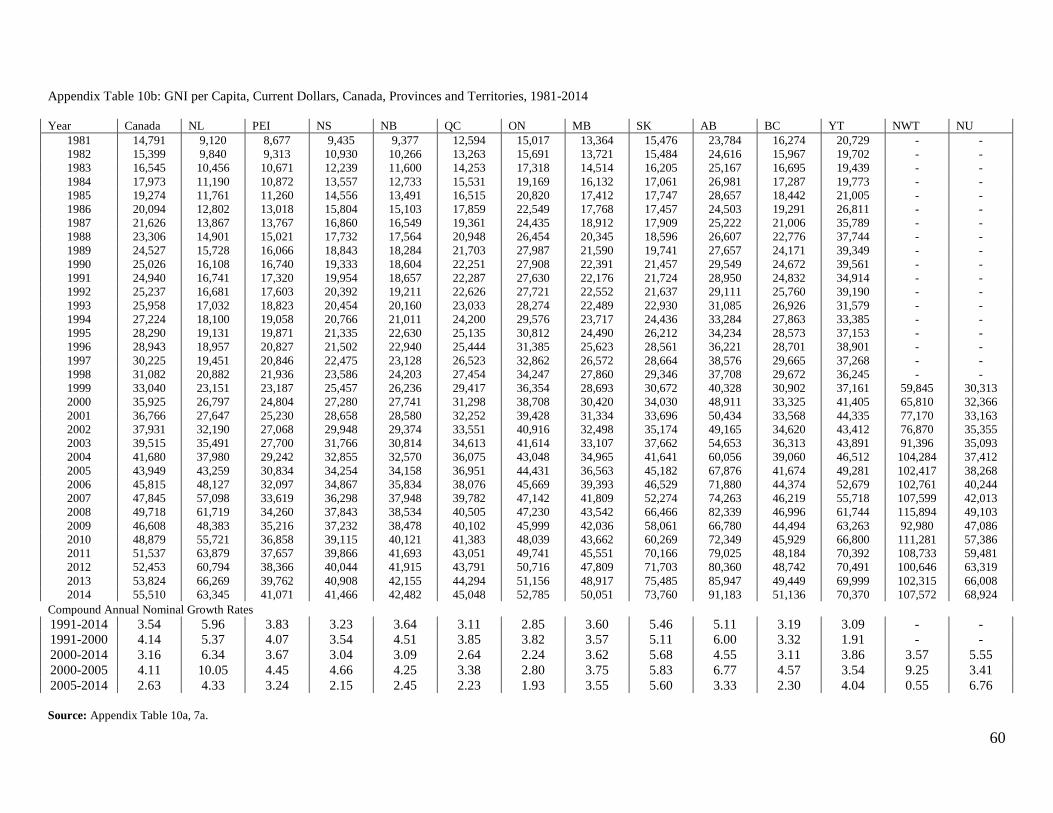
60
Appendix Table 10b: GNI per Capita, Current Dollars, Canada, Provinces and Territories, 1981-2014
Year Canada NL PEI NS NB QC ON MB SK AB BC YT NWT NU
1981 14,791 9,120 8,677 9,435 9,377 12,594 15,017 13,364 15,476 23,784 16,274 20,729 - -
1982 15,399 9,840 9,313 10,930 10,266 13,263 15,691 13,721 15,484 24,616 15,967 19,702 - -
1983 16,545 10,456 10,671 12,239 11,600 14,253 17,318 14,514 16,205 25,167 16,695 19,439 - -
1984 17,973 11,190 10,872 13,557 12,733 15,531 19,169 16,132 17,061 26,981 17,287 19,773 - -
1985 19,274 11,761 11,260 14,556 13,491 16,515 20,820 17,412 17,747 28,657 18,442 21,005 - -
1986 20,094 12,802 13,018 15,804 15,103 17,859 22,549 17,768 17,457 24,503 19,291 26,811 - -
1987 21,626 13,867 13,767 16,860 16,549 19,361 24,435 18,912 17,909 25,222 21,006 35,789 - -
1988 23,306 14,901 15,021 17,732 17,564 20,948 26,454 20,345 18,596 26,607 22,776 37,744 - -
1989 24,527 15,728 16,066 18,843 18,284 21,703 27,987 21,590 19,741 27,657 24,171 39,349 - -
1990 25,026 16,108 16,740 19,333 18,604 22,251 27,908 22,391 21,457 29,549 24,672 39,561 - -
1991 24,940 16,741 17,320 19,954 18,657 22,287 27,630 22,176 21,724 28,950 24,832 34,914 - -
1992 25,237 16,681 17,603 20,392 19,211 22,626 27,721 22,552 21,637 29,111 25,760 39,190 - -
1993 25,958 17,032 18,823 20,454 20,160 23,033 28,274 22,489 22,930 31,085 26,926 31,579 - -
1994 27,224 18,100 19,058 20,766 21,011 24,200 29,576 23,717 24,436 33,284 27,863 33,385 - -
1995 28,290 19,131 19,871 21,335 22,630 25,135 30,812 24,490 26,212 34,234 28,573 37,153 - -
1996 28,943 18,957 20,827 21,502 22,940 25,444 31,385 25,623 28,561 36,221 28,701 38,901 - -
1997 30,225 19,451 20,846 22,475 23,128 26,523 32,862 26,572 28,664 38,576 29,665 37,268 - -
1998 31,082 20,882 21,936 23,586 24,203 27,454 34,247 27,860 29,346 37,708 29,672 36,245 - -
1999 33,040 23,151 23,187 25,457 26,236 29,417 36,354 28,693 30,672 40,328 30,902 37,161 59,845 30,313
2000 35,925 26,797 24,804 27,280 27,741 31,298 38,708 30,420 34,030 48,911 33,325 41,405 65,810 32,366
2001 36,766 27,647 25,230 28,658 28,580 32,252 39,428 31,334 33,696 50,434 33,568 44,335 77,170 33,163
2002 37,931 32,190 27,068 29,948 29,374 33,551 40,916 32,498 35,174 49,165 34,620 43,412 76,870 35,355
2003 39,515 35,491 27,700 31,766 30,814 34,613 41,614 33,107 37,662 54,653 36,313 43,891 91,396 35,093
2004 41,680 37,980 29,242 32,855 32,570 36,075 43,048 34,965 41,641 60,056 39,060 46,512 104,284 37,412
2005 43,949 43,259 30,834 34,254 34,158 36,951 44,431 36,563 45,182 67,876 41,674 49,281 102,417 38,268
2006 45,815 48,127 32,097 34,867 35,834 38,076 45,669 39,393 46,529 71,880 44,374 52,679 102,761 40,244
2007 47,845 57,098 33,619 36,298 37,948 39,782 47,142 41,809 52,274 74,263 46,219 55,718 107,599 42,013
2008 49,718 61,719 34,260 37,843 38,534 40,505 47,230 43,542 66,466 82,339 46,996 61,744 115,894 49,103
2009 46,608 48,383 35,216 37,232 38,478 40,102 45,999 42,036 58,061 66,780 44,494 63,263 92,980 47,086
2010 48,879 55,721 36,858 39,115 40,121 41,383 48,039 43,662 60,269 72,349 45,929 66,800 111,281 57,386
2011 51,537 63,879 37,657 39,866 41,693 43,051 49,741 45,551 70,166 79,025 48,184 70,392 108,733 59,481
2012 52,453 60,794 38,366 40,044 41,915 43,791 50,716 47,809 71,703 80,360 48,742 70,491 100,646 63,319
2013 53,824 66,269 39,762 40,908 42,155 44,294 51,156 48,917 75,485 85,947 49,449 69,999 102,315 66,008
2014 55,510 63,345 41,071 41,466 42,482 45,048 52,785 50,051 73,760 91,183 51,136 70,370 107,572 68,924
Compound Annual Nominal Growth Rates
1991-2014 3.54 5.96 3.83 3.23 3.64 3.11 2.85 3.60 5.46 5.11 3.19 3.09 - -
1991-2000 4.14 5.37 4.07 3.54 4.51 3.85 3.82 3.57 5.11 6.00 3.32 1.91 - -
2000-2014 3.16 6.34 3.67 3.04 3.09 2.64 2.24 3.62 5.68 4.55 3.11 3.86 3.57 5.55
2000-2005 4.11 10.05 4.45 4.66 4.25 3.38 2.80 3.75 5.83 6.77 4.57 3.54 9.25 3.41
2005-2014 2.63 4.33 3.24 2.15 2.45 2.23 1.93 3.55 5.60 3.33 2.30 4.04 0.55 6.76
Source: Appendix Table 10a, 7a.

61
Appendix Table 11: Life Expectancy Dimension Data and Calculations, Canada, Provinces and Territories, 1990, 2000, and 2005-2014
Appendix Table 11a: Life Expectancy Using LFS Data, Canada, Provinces and Territories, 1990, 2000, and 2005-2014
Year Canada NL PEI NS NB QC ON MB SK AB BC YT NWT NU
1990 77.6 76.1 76.6 76.7 77.3 77.1 77.9 77.5 78.0 77.9 78.1 74.4 - -
2000 79.4 77.3 78.2 78.6 78.8 79.2 79.5 78.1 78.6 79.5 80.5 75.6 75.9 67.8
2005 80.4 78.2 79.8 79.3 79.8 80.4 80.7 79.0 79.3 80.3 81.2 77.0 78.0 72.0
2006 80.8 78.2 79.9 79.6 80.1 80.9 81.1 79.3 79.4 80.5 81.4 77.0 78.0 72.0
2007 80.9 78.5 80.9 80.2 80.1 80.8 81.2 79.6 79.8 80.7 81.0 76.7 77.4 71.6
2008 81.0 78.8 79.8 79.9 80.4 81.3 81.6 79.6 79.3 80.6 81.8 76.7 77.4 71.6
2009 81.4 79.4 79.9 80.2 80.1 81.5 81.7 79.3 79.7 80.8 82.3 76.7 77.4 71.6
2010 81.6 79.6 80.1 80.4 80.2 81.7 81.9 79.4 79.8 81.0 82.5 76.8 77.5 71.8
2011 81.8 79.7 80.3 80.5 80.4 82.0 82.1 79.5 79.9 81.1 82.7 77.0 77.6 72.0
2012 82.0 79.9 80.5 80.7 80.5 82.2 82.3 79.6 80.0 81.3 83.0 77.1 77.7 72.2
2013 82.2 80.0 80.7 80.9 80.6 82.5 82.5 79.7 80.1 81.4 83.2 77.2 77.8 72.4
2014 82.4 80.2 80.9 81.0 80.8 82.7 82.8 79.8 80.2 81.6 83.4 77.3 77.9 72.7
Note: Italicized estimates for 2010-2014 are extrapolated using compound annual growth rate from 1991-2009 for that province or for Canada. Source: Appendix Table 1
Appendix Table 12b: Proportion of Canadian Estimates that Provincial and Territorial Estimates Represent, 1990, 2000, and 2005-2014
Year Canada NL PEI NS NB QC ON MB SK AB BC YT NWT NU
1990 1.000 0.981 0.987 0.988 0.996 0.994 1.004 0.999 1.005 1.004 1.006 0.959 - -
2000 1.000 0.974 0.985 0.990 0.992 0.997 1.001 0.984 0.990 1.001 1.014 0.952 0.956 0.854
2005 1.000 0.973 0.993 0.986 0.993 1.000 1.004 0.983 0.986 0.999 1.010 0.958 0.970 0.896
2006 1.000 0.968 0.989 0.985 0.991 1.001 1.004 0.981 0.983 0.996 1.007 0.953 0.965 0.891
2007 1.000 0.970 1.000 0.991 0.990 0.999 1.004 0.984 0.986 0.998 1.001 0.948 0.957 0.885
2008 1.000 0.973 0.985 0.986 0.993 1.004 1.007 0.983 0.979 0.995 1.010 0.947 0.956 0.884
2009 1.000 0.975 0.982 0.985 0.984 1.001 1.004 0.974 0.979 0.993 1.011 0.942 0.951 0.880
2010 1.000 0.975 0.982 0.985 0.983 1.002 1.004 0.973 0.978 0.992 1.011 0.941 0.950 0.880
2011 1.000 0.974 0.982 0.984 0.982 1.002 1.004 0.972 0.976 0.991 1.011 0.941 0.948 0.880
2012 1.000 0.974 0.982 0.984 0.982 1.003 1.004 0.970 0.975 0.991 1.012 0.940 0.947 0.881
2013 1.000 0.973 0.981 0.983 0.981 1.003 1.004 0.969 0.974 0.990 1.012 0.939 0.946 0.881
2014 1.000 0.973 0.981 0.983 0.980 1.003 1.004 0.968 0.972 0.990 1.012 0.938 0.945 0.882
Source: Appendix Table 11a.

62
Appendix Table 11c: Provincial and Territorial Estimates Proportional to 2011 HDR estimates for Canada, 1990, 2000, and 2005-2014
Year Canada NL PEI NS NB QC ON MB SK AB BC YT NWT NU
1990 77.2 75.7 76.2 76.3 76.9 76.7 77.5 77.1 77.6 77.5 77.7 74.0 - -
2000 79.1 77.0 77.9 78.3 78.5 78.9 79.2 77.8 78.3 79.2 80.2 75.3 75.6 67.5
2005 80.1 77.9 79.5 79.0 79.5 80.1 80.4 78.7 79.0 80.0 80.9 76.7 77.7 71.7
2006 80.3 77.7 79.4 79.1 79.6 80.4 80.6 78.8 78.9 80.0 80.9 76.5 77.5 71.6
2007 80.5 78.1 80.5 79.8 79.7 80.4 80.8 79.2 79.4 80.3 80.6 76.3 77.0 71.2
2008 80.6 78.4 79.4 79.5 80.0 80.9 81.2 79.2 78.9 80.2 81.4 76.3 77.0 71.2
2009 80.8 78.8 79.3 79.6 79.5 80.9 81.1 78.7 79.1 80.2 81.7 76.1 76.8 71.1
2010 81.0 79.0 79.5 79.8 79.6 81.1 81.3 78.8 79.2 80.4 81.9 76.3 76.9 71.3
2011 81.2 79.1 79.7 79.9 79.8 81.4 81.5 78.9 79.3 80.5 82.1 76.4 77.0 71.5
2012 81.3 79.2 79.8 80.0 79.8 81.5 81.6 78.9 79.3 80.5 82.2 76.4 77.0 71.6
2013 81.5 79.3 80.0 80.1 79.9 81.7 81.8 79.0 79.4 80.7 82.5 76.5 77.1 71.8
2014 82.0 79.7 80.5 80.6 80.4 82.3 82.3 79.4 79.7 81.1 83.0 76.9 77.5 72.3
Source: Appendix Table 11a,b, Canada data taken from the International Human Development Indicators website (http://hdrstats.undp.org/en/indicators/69206.html)
Appendix Table 11d: Life Expectancy Index Based on 2011 HDR Proportional Estimates, Canada, Provinces and Territories, 1990, 2000, and 2005-2014
Year Canada NL PEI NS NB QC ON MB SK AB BC YT NWT NU
1990 0.880 0.857 0.865 0.866 0.875 0.872 0.885 0.878 0.886 0.885 0.888 0.831 - -
2000 0.909 0.877 0.891 0.897 0.900 0.906 0.911 0.889 0.897 0.911 0.926 0.851 0.856 0.731
2005 0.925 0.891 0.915 0.908 0.915 0.925 0.929 0.903 0.908 0.923 0.937 0.873 0.888 0.796
2006 0.928 0.888 0.914 0.909 0.917 0.929 0.932 0.905 0.906 0.923 0.937 0.870 0.885 0.793
2007 0.931 0.894 0.931 0.920 0.919 0.929 0.935 0.911 0.914 0.928 0.932 0.866 0.877 0.788
2008 0.932 0.899 0.914 0.915 0.923 0.937 0.941 0.911 0.906 0.926 0.945 0.866 0.877 0.788
2009 0.935 0.905 0.912 0.917 0.916 0.937 0.940 0.903 0.909 0.926 0.949 0.864 0.874 0.786
2010 0.938 0.907 0.915 0.920 0.918 0.941 0.943 0.905 0.911 0.929 0.952 0.865 0.876 0.789
2011 0.942 0.909 0.918 0.922 0.920 0.944 0.946 0.906 0.912 0.931 0.956 0.867 0.877 0.792
2012 0.943 0.910 0.920 0.923 0.920 0.946 0.948 0.906 0.912 0.932 0.958 0.868 0.877 0.794
2013 0.946 0.912 0.923 0.925 0.922 0.950 0.951 0.907 0.913 0.934 0.961 0.870 0.878 0.797
2014 0.954 0.919 0.930 0.932 0.929 0.958 0.959 0.913 0.919 0.941 0.969 0.876 0.884 0.804
Source: Appendix Table 11c; HDR 2011 for minimum= 20 and maximum=83.4 (Japan 2011).

63
Appendix Table 12: Average Educational Attainment Dimension Data and Calculations, Canada, Provinces and Territories, 1990, 2000, and 2005-2014
Appendix Table 12a: Estimated Average Educational Attainment Using LFS Data, Canada, Provinces and Territories, 1990, 2000, and 2005-2014
Year Canada NL PEI NS NB QC ON MB SK AB BC YT NWT NU
1990 10.5 10.7 10.7 11.2 10.9 10.9 11.4 11.0 11.0 11.6 11.7 - - -
2000 11.9 11.4 11.5 11.8 11.6 11.6 12.1 11.7 11.7 12.2 12.2 12.2 12.2 10.7
2005 12.2 11.8 12.0 12.1 11.9 12.0 12.3 12.0 12.0 12.4 12.4 12.5 11.9 10.3
2006 12.3 11.8 12.0 12.1 12.0 12.1 12.4 12.0 12.0 12.4 12.4 12.2 12.1 10.9
2007 12.3 11.8 12.0 12.2 12.0 12.1 12.5 12.0 12.1 12.5 12.5 12.4 12.2 11.2
2008 12.4 11.9 12.0 12.2 12.1 12.2 12.5 12.1 12.1 12.5 12.5 12.4 12.0 11.0
2009 12.4 11.9 12.1 12.2 12.1 12.2 12.5 12.2 12.2 12.6 12.6 12.3 11.9 10.9
2010 12.5 12.1 12.2 12.4 12.1 12.3 12.6 12.2 12.3 12.6 12.6 12.2 11.9 10.8
2011 12.5 12.1 12.3 12.4 12.1 12.3 12.6 12.3 12.3 12.6 12.7 12.5 12.2 10.9
2012 12.5 12.2 12.3 12.4 12.2 12.4 12.6 12.3 12.3 12.6 12.7 12.6 12.1 11.3
2013 12.6 12.3 12.4 12.5 12.2 12.4 12.7 12.3 12.4 12.6 12.7 12.7 12.0 11.8
2014 12.6 12.3 12.4 12.5 12.3 12.4 12.7 12.4 12.4 12.7 12.7 12.8 12.0 12.2
Source: Appendix Table 8
Appendix Table 12b: Proportion of Canadian Estimates that Provincial and Territorial Estimates Represent, 1990, 2000, and 2005-2014
Year Canada NL PEI NS NB QC ON MB SK AB BC YT NWT NU
1990 1.000 1.019 1.014 1.059 1.035 1.035 1.082 1.045 1.045 1.104 1.111 - - -
2000 1.000 0.956 0.965 0.991 0.970 0.975 1.012 0.984 0.979 1.020 1.023 1.020 1.020 0.896
2005 1.000 0.962 0.980 0.990 0.971 0.983 1.009 0.980 0.981 1.016 1.014 1.021 0.975 0.841
2006 1.000 0.962 0.981 0.988 0.976 0.985 1.010 0.978 0.979 1.013 1.011 0.995 0.985 0.887
2007 1.000 0.960 0.976 0.989 0.972 0.985 1.010 0.973 0.979 1.014 1.011 1.002 0.990 0.910
2008 1.000 0.960 0.970 0.983 0.976 0.985 1.010 0.979 0.980 1.012 1.012 1.005 0.970 0.890
2009 1.000 0.963 0.977 0.987 0.977 0.985 1.008 0.981 0.984 1.015 1.012 0.996 0.961 0.877
2010 1.000 0.968 0.980 0.992 0.974 0.985 1.008 0.982 0.984 1.012 1.012 0.976 0.958 0.863
2011 1.000 0.969 0.985 0.988 0.968 0.986 1.008 0.983 0.983 1.009 1.014 1.001 0.974 0.875
2012 1.000 0.973 0.983 0.992 0.972 0.989 1.007 0.982 0.984 1.007 1.012 1.006 0.966 0.905
2013 1.000 0.977 0.985 0.993 0.970 0.987 1.008 0.980 0.986 1.006 1.013 1.010 0.958 0.936
2014 1.000 0.974 0.985 0.996 0.978 0.988 1.006 0.982 0.987 1.007 1.012 1.016 0.951 0.968
Source: Appendix Table 12a.

64
Appendix Table 12c: Provincial and Territorial Estimates Proportional to 2011 HDR Estimates for Canada, 1990, 2000, and 2005-2014
Year Canada NL PEI NS NB QC ON MB SK AB BC YT NWT NU
1990 10.3 10.5 10.4 10.9 10.7 10.7 11.1 10.8 10.8 11.4 11.4 - - -
2000 11.1 10.6 10.7 11.0 10.8 10.8 11.2 10.9 10.9 11.3 11.4 11.3 11.3 9.9
2005 12.3 11.8 12.1 12.2 11.9 12.1 12.4 12.1 12.1 12.5 12.5 12.6 12.0 10.3
2006 12.3 11.8 12.1 12.2 12.0 12.1 12.4 12.0 12.0 12.5 12.4 12.2 12.1 10.9
2007 12.3 11.8 12.0 12.2 12.0 12.1 12.4 12.0 12.0 12.5 12.4 12.3 12.2 11.2
2008 12.3 11.8 11.9 12.1 12.0 12.1 12.4 12.0 12.1 12.5 12.4 12.4 11.9 10.9
2009 12.3 11.8 12.0 12.1 12.0 12.1 12.4 12.1 12.1 12.5 12.5 12.2 11.8 10.8
2010 12.3 11.9 12.1 12.2 12.0 12.1 12.4 12.1 12.1 12.4 12.4 12.0 11.8 10.6
2011 12.3 11.9 12.1 12.2 11.9 12.1 12.4 12.1 12.1 12.4 12.5 12.3 12.0 10.8
2012 12.3 12.0 12.1 12.2 12.0 12.2 12.4 12.1 12.1 12.4 12.4 12.4 11.9 11.1
2013 12.3 12.0 12.1 12.2 11.9 12.1 12.4 12.1 12.1 12.4 12.5 12.4 11.8 11.5
2014 13.0 12.7 12.8 12.9 12.7 12.9 13.1 12.8 12.8 13.1 13.2 13.2 12.4 12.6
Source: Appendix Table 12a,b, Canada data taken from the International Human Development Indicators website (http://hdrstats.undp.org/en/indicators/103006.html)
Appendix Table 12d: Estimated Average Educational Attainment Index Based on 2011 HDR Proportional Estimates, Canada, Provinces and Territories, 1990, 2000, and 2005-2014
Year Canada NL PEI NS NB QC ON MB SK AB BC YT NWT NU
1990 0.687 0.700 0.696 0.727 0.711 0.711 0.743 0.717 0.717 0.758 0.763 - - -
2000 0.740 0.707 0.714 0.733 0.718 0.721 0.749 0.728 0.724 0.755 0.757 0.755 0.755 0.663
2005 0.820 0.789 0.804 0.812 0.797 0.806 0.828 0.804 0.805 0.833 0.832 0.837 0.800 0.690
2006 0.820 0.789 0.804 0.810 0.801 0.808 0.828 0.802 0.803 0.831 0.829 0.816 0.807 0.728
2007 0.820 0.788 0.800 0.811 0.797 0.808 0.828 0.798 0.803 0.831 0.829 0.822 0.812 0.746
2008 0.820 0.787 0.796 0.806 0.801 0.808 0.828 0.803 0.803 0.830 0.830 0.824 0.796 0.730
2009 0.820 0.789 0.801 0.809 0.801 0.808 0.827 0.804 0.807 0.832 0.830 0.816 0.788 0.719
2010 0.820 0.794 0.804 0.814 0.799 0.808 0.827 0.805 0.807 0.829 0.830 0.800 0.785 0.708
2011 0.820 0.794 0.808 0.810 0.794 0.808 0.827 0.806 0.806 0.827 0.832 0.821 0.799 0.718
2012 0.820 0.798 0.806 0.814 0.797 0.811 0.826 0.805 0.807 0.826 0.830 0.825 0.792 0.742
2013 0.820 0.801 0.808 0.815 0.796 0.809 0.826 0.804 0.809 0.825 0.831 0.829 0.786 0.767
2014 0.867 0.845 0.854 0.863 0.848 0.857 0.873 0.851 0.855 0.873 0.877 0.881 0.825 0.840
Source: Appendix Table 12c; HDR 2011 for minimum=0 and maximum=13.1 (Czech Republic, 2005).

65
Appendix Table 13: Expected Years of Schooling Dimension Data and Calculations, Canada, Provinces and Territories, 1990, 2000, and 2005-2014
Appendix Table 13a: Estimated Expected Years of Schooling Using LFS Data, Canada, Provinces and Territories, 1990, 2000, and 2005-2014
Year Canada NL PEI NS NB QC ON MB SK AB BC YT NWT NU
1990 14.8 14.4 14.3 14.8 14.2 14.9 15.2 14.5 14.5 14.5 14.3 - - -
2000 15.6 15.7 15.1 15.7 14.9 15.7 15.9 15.0 15.1 14.8 15.6 13.9 14.5 13.1
2005 15.9 15.7 15.3 15.6 15.3 16.1 16.2 15.5 15.1 14.9 15.7 13.8 14.1 13.3
2006 15.8 15.9 15.2 15.7 15.3 16.2 16.1 15.5 15.1 14.9 15.7 14.4 14.2 13.5
2007 15.8 15.9 15.5 15.6 15.5 16.2 16.2 15.3 15.0 14.7 15.6 14.2 14.2 13.0
2008 15.7 15.7 15.3 15.3 15.3 16.1 16.1 15.3 14.9 14.7 15.6 13.0 13.8 12.9
2009 15.8 15.7 15.4 15.4 15.2 16.1 16.2 15.3 14.8 14.8 15.6 13.1 14.5 13.6
2010 16.0 15.5 15.7 15.6 15.3 16.3 16.3 15.4 15.0 15.1 15.8 13.8 14.1 13.2
2011 16.0 15.5 15.5 15.7 15.3 16.4 16.2 15.3 15.1 15.0 15.9 14.3 14.6 12.8
2012 16.0 15.5 15.7 15.7 15.3 16.5 16.3 15.3 15.0 15.0 16.0 14.3 14.7 12.7
2013 16.1 15.7 15.6 15.8 15.4 16.5 16.4 15.3 15.1 15.1 15.9 14.3 14.7 12.7
2014 16.0 15.7 15.9 15.7 15.2 16.7 16.2 15.3 15.3 15.1 15.6 14.3 14.7 12.7
Source: Appendix Table 9
Appendix Table 13b: Proportion of Canadian Estimates that Provincial and Territorial Estimates Represent, 1990, 2000, and 2005-2014
Year Canada NL PEI NS NB QC ON MB SK AB BC YT NWT NU
1990 1.000 0.970 0.966 0.996 0.959 1.005 1.023 0.975 0.980 0.975 0.966 - - -
2000 1.000 1.006 0.969 1.006 0.954 1.008 1.017 0.960 0.966 0.952 1.003 0.889 0.929 0.840
2005 1.000 0.991 0.965 0.981 0.966 1.014 1.022 0.974 0.955 0.942 0.987 0.870 0.888 0.838
2006 1.000 1.005 0.961 0.993 0.967 1.021 1.016 0.978 0.953 0.942 0.990 0.907 0.895 0.851
2007 1.000 1.003 0.981 0.987 0.982 1.022 1.022 0.969 0.946 0.930 0.985 0.898 0.896 0.821
2008 1.000 0.999 0.975 0.974 0.972 1.020 1.022 0.975 0.947 0.932 0.992 0.827 0.878 0.820
2009 1.000 0.992 0.974 0.971 0.958 1.020 1.026 0.966 0.935 0.935 0.989 0.827 0.915 0.858
2010 1.000 0.971 0.981 0.978 0.960 1.021 1.021 0.966 0.942 0.944 0.990 0.864 0.886 0.826
2011 1.000 0.972 0.968 0.983 0.956 1.027 1.016 0.961 0.943 0.940 0.997 0.894 0.917 0.801
2012 1.000 0.967 0.981 0.980 0.957 1.027 1.019 0.955 0.936 0.935 0.996 0.890 0.914 0.795
2013 1.000 0.976 0.972 0.983 0.959 1.028 1.019 0.952 0.940 0.940 0.990 0.888 0.914 0.792
2014 1.000 0.979 0.991 0.982 0.952 1.046 1.012 0.956 0.956 0.941 0.974 0.891 0.918 0.793
Source: Appendix Table 13a.

66
Appendix Table 13c: Provincial and Territorial Estimates Proportional to 2011 HDR Estimates for Canada, 1990, 2000, and 2005-2014
Year Canada NL PEI NS NB QC ON MB SK AB BC YT NWT NU
1990 16.7 16.2 16.1 16.6 16.0 16.8 17.1 16.3 16.4 16.3 16.1 - - -
2000 15.8 15.9 15.3 15.9 15.1 15.9 16.1 15.2 15.3 15.0 15.8 14.1 14.7 13.3
2005 15.9 15.8 15.3 15.6 15.4 16.1 16.3 15.5 15.2 15.0 15.7 13.8 14.1 13.3
2006 15.9 16.0 15.3 15.8 15.4 16.2 16.2 15.6 15.2 15.0 15.7 14.4 14.2 13.5
2007 15.9 16.0 15.6 15.7 15.6 16.2 16.3 15.4 15.0 14.8 15.7 14.3 14.3 13.0
2008 15.9 15.9 15.5 15.5 15.5 16.2 16.2 15.5 15.1 14.8 15.8 13.1 14.0 13.0
2009 15.9 15.8 15.5 15.4 15.2 16.2 16.3 15.4 14.9 14.9 15.7 13.1 14.5 13.6
2010 15.9 15.4 15.6 15.5 15.3 16.2 16.2 15.4 15.0 15.0 15.7 13.7 14.1 13.1
2011 15.9 15.5 15.4 15.6 15.2 16.3 16.2 15.3 15.0 15.0 15.9 14.2 14.6 12.7
2012 15.9 15.4 15.6 15.6 15.2 16.3 16.2 15.2 14.9 14.9 15.8 14.1 14.5 12.6
2013 15.9 15.5 15.5 15.6 15.2 16.3 16.2 15.1 14.9 14.9 15.7 14.1 14.5 12.6
2014 15.9 15.6 15.7 15.6 15.1 16.6 16.1 15.2 15.2 15.0 15.5 14.2 14.6 12.6
Source: Appendix Table 13a,b, Canada data taken from the International Human Development Indicators website (http://hdrstats.undp.org/en/indicators/69706.html)
Appendix Table 13d: Estimated Expected Years of Schooling Index Based on 2011 HDR Proportional Estimates, Canada, Provinces and Territories, 1990, 2000, and 2005-2014
Year Canada NL PEI NS NB QC ON MB SK AB BC YT NWT NU
1990 0.928 0.900 0.896 0.924 0.890 0.932 0.949 0.904 0.909 0.905 0.896 - - -
2000 0.878 0.883 0.851 0.883 0.837 0.885 0.893 0.842 0.848 0.836 0.880 0.781 0.816 0.737
2005 0.883 0.875 0.852 0.866 0.853 0.896 0.903 0.861 0.843 0.832 0.872 0.768 0.785 0.740
2006 0.883 0.888 0.849 0.877 0.854 0.902 0.898 0.864 0.842 0.832 0.874 0.802 0.791 0.752
2007 0.883 0.886 0.866 0.872 0.867 0.903 0.903 0.856 0.836 0.822 0.870 0.793 0.792 0.725
2008 0.883 0.882 0.861 0.860 0.859 0.901 0.902 0.861 0.837 0.824 0.877 0.730 0.776 0.724
2009 0.883 0.876 0.860 0.857 0.847 0.901 0.906 0.853 0.826 0.826 0.873 0.730 0.808 0.758
2010 0.883 0.857 0.867 0.864 0.848 0.902 0.901 0.854 0.832 0.834 0.874 0.763 0.783 0.730
2011 0.883 0.859 0.855 0.869 0.845 0.907 0.897 0.849 0.833 0.831 0.881 0.790 0.810 0.707
2012 0.883 0.855 0.866 0.866 0.846 0.908 0.900 0.844 0.827 0.826 0.880 0.786 0.808 0.702
2013 0.883 0.862 0.859 0.868 0.847 0.908 0.900 0.841 0.830 0.830 0.874 0.784 0.807 0.699
2014 0.883 0.865 0.875 0.867 0.841 0.924 0.894 0.845 0.844 0.831 0.860 0.787 0.811 0.700
Source: Appendix Table 13c; HDR 2011 for minimum=0 and maximum=18.0 (cap).
67
Appendix Table 14: Education Index Based on 2011 HDR Consistent Estimates, Canada, Provinces and Territories, 1990, 2000, and 2005-2014
Year Canada NL PEI NS NB QC ON MB SK AB BC YT NWT NU
1990 0.807 0.800 0.796 0.826 0.800 0.822 0.846 0.811 0.813 0.832 0.830 - - -
2000 0.809 0.795 0.782 0.808 0.778 0.803 0.821 0.785 0.786 0.795 0.819 0.768 0.785 0.700
2005 0.852 0.832 0.828 0.839 0.825 0.851 0.865 0.832 0.824 0.833 0.852 0.803 0.792 0.715
2006 0.852 0.839 0.827 0.844 0.827 0.855 0.863 0.833 0.822 0.831 0.852 0.809 0.799 0.740
2007 0.852 0.837 0.833 0.842 0.832 0.855 0.866 0.827 0.819 0.827 0.850 0.807 0.802 0.735
2008 0.852 0.835 0.828 0.833 0.830 0.854 0.865 0.832 0.820 0.827 0.853 0.777 0.786 0.727
2009 0.852 0.833 0.831 0.833 0.824 0.854 0.866 0.829 0.816 0.829 0.852 0.773 0.798 0.738
2010 0.852 0.825 0.835 0.839 0.824 0.855 0.864 0.830 0.820 0.832 0.852 0.782 0.784 0.719
2011 0.852 0.827 0.831 0.840 0.819 0.858 0.862 0.827 0.819 0.829 0.856 0.805 0.805 0.712
2012 0.852 0.826 0.836 0.840 0.821 0.859 0.863 0.825 0.817 0.826 0.855 0.805 0.800 0.722
2013 0.852 0.832 0.833 0.841 0.821 0.859 0.863 0.822 0.819 0.827 0.853 0.806 0.796 0.733
2014 0.875 0.855 0.865 0.865 0.844 0.890 0.883 0.848 0.850 0.852 0.869 0.834 0.818 0.770
Source: Appendix Table 12d,13d.

68
Appendix Table 15: Income Dimension Data and Calculations, Canada, Provinces and Territories, 1990, 2000, and 2005-2014
Appendix Table 15a: GNI per Capita in Current Dollars, Canada, Provinces and Territories, 1990, 2000, and 2005-2014
Year Canada NL PEI NS NB QC ON MB SK AB BC YT NWT NU
1990 25,026 16,108 16,740 19,333 18,604 22,251 27,908 22,391 21,457 29,549 24,672 - - -
2000 35,925 26,797 24,804 27,280 27,741 31,298 38,708 30,420 34,030 48,911 33,325 41,405 65,810 32,366
2005 43,949 43,259 30,834 34,254 34,158 36,951 44,431 36,563 45,182 67,876 41,674 49,281 102,417 38,268
2006 45,815 48,127 32,097 34,867 35,834 38,076 45,669 39,393 46,529 71,880 44,374 52,679 102,761 40,244
2007 47,845 57,098 33,619 36,298 37,948 39,782 47,142 41,809 52,274 74,263 46,219 55,718 107,599 42,013
2008 49,718 61,719 34,260 37,843 38,534 40,505 47,230 43,542 66,466 82,339 46,996 61,744 115,894 49,103
2009 46,608 48,383 35,216 37,232 38,478 40,102 45,999 42,036 58,061 66,780 44,494 63,263 92,980 47,086
2010 48,879 55,721 36,858 39,115 40,121 41,383 48,039 43,662 60,269 72,349 45,929 66,800 111,281 57,386
2011 51,537 63,879 37,657 39,866 41,693 43,051 49,741 45,551 70,166 79,025 48,184 70,392 108,733 59,481
2012 52,453 60,794 38,366 40,044 41,915 43,791 50,716 47,809 71,703 80,360 48,742 70,491 100,646 63,319
2013 53,824 66,269 39,762 40,908 42,155 44,294 51,156 48,917 75,485 85,947 49,449 69,999 102,315 66,008
2014 55,510 63,345 41,071 41,466 42,482 45,048 52,785 50,051 73,760 91,183 51,136 70,370 107,572 68,924
Source: Appendix Table 10b
Appendix Table 15b: GNI per Capita in 2005 PPP adjusted US Dollars, Canada, Provinces and Territories, 1990, 2000, and 2005-2014
Year Canada NL PEI NS NB QC ON MB SK AB BC YT NWT NU
1990 31,568 20,243 20,677 24,252 23,532 27,933 36,021 27,787 25,408 35,596 31,109 50,644 - -
2000 34,759 24,355 24,394 26,781 27,601 30,948 38,246 30,186 32,267 42,427 32,510 39,095 62,959 31,890
2005 40,156 36,592 28,173 31,654 31,379 34,756 41,474 33,687 40,119 57,860 37,632 44,812 100,471 36,044
2006 42,333 41,669 29,700 32,995 32,902 35,592 42,797 35,218 43,520 65,380 40,142 47,468 98,651 36,860
2007 43,292 45,477 30,329 32,947 33,861 35,980 43,154 37,223 43,967 67,922 41,930 49,778 97,102 38,028
2008 44,068 52,590 30,965 33,432 34,953 36,641 43,421 38,508 48,147 68,401 42,570 51,319 99,105 38,697
2009 44,729 55,525 30,821 34,045 34,666 36,440 42,490 39,173 59,796 74,076 42,280 55,548 104,263 44,175
2010 40,890 42,447 30,895 32,664 33,757 35,182 40,355 36,878 50,937 58,587 39,035 55,501 81,572 41,309
2011 42,309 48,232 31,904 33,857 34,728 35,820 41,582 37,793 52,168 62,625 39,756 57,821 96,323 49,673
2012 43,652 54,106 31,895 33,766 35,314 36,464 42,131 38,581 59,430 66,934 40,812 59,622 92,097 50,380
2013 43,796 50,761 32,034 33,435 34,998 36,564 42,346 39,919 59,870 67,098 40,698 58,858 84,036 52,869
2014 44,198 54,418 32,651 33,592 34,616 36,373 42,007 40,169 61,986 70,576 40,606 57,481 84,018 54,204
Source: Appendix Table 3 and 15a
69
Appendix Table 15c: Proportion of Canadian Estimates that Provincial and Territorial Estimates Represent, 1990, 2000, and 2005-2014
Year Canada NL PEI NS NB QC ON MB SK AB BC YT NWT NU
1990 1.000 0.641 0.655 0.768 0.745 0.885 1.141 0.880 0.805 1.128 0.985 1.604 - -
2000 1.000 0.701 0.702 0.770 0.794 0.890 1.100 0.868 0.928 1.221 0.935 1.125 1.811 0.917
2005 1.000 0.911 0.702 0.788 0.781 0.866 1.033 0.839 0.999 1.441 0.937 1.116 2.502 0.898
2006 1.000 0.984 0.702 0.779 0.777 0.841 1.011 0.832 1.028 1.544 0.948 1.121 2.330 0.871
2007 1.000 1.050 0.701 0.761 0.782 0.831 0.997 0.860 1.016 1.569 0.969 1.150 2.243 0.878
2008 1.000 1.193 0.703 0.759 0.793 0.831 0.985 0.874 1.093 1.552 0.966 1.165 2.249 0.878
2009 1.000 1.241 0.689 0.761 0.775 0.815 0.950 0.876 1.337 1.656 0.945 1.242 2.331 0.988
2010 1.000 1.038 0.756 0.799 0.826 0.860 0.987 0.902 1.246 1.433 0.955 1.357 1.995 1.010
2011 1.000 1.140 0.754 0.800 0.821 0.847 0.983 0.893 1.233 1.480 0.940 1.367 2.277 1.174
2012 1.000 1.239 0.731 0.774 0.809 0.835 0.965 0.884 1.361 1.533 0.935 1.366 2.110 1.154
2013 1.000 1.159 0.731 0.763 0.799 0.835 0.967 0.911 1.367 1.532 0.929 1.344 1.919 1.207
2014 1.000 1.231 0.739 0.760 0.783 0.823 0.950 0.909 1.402 1.597 0.919 1.301 1.901 1.226
Source: Appendix Table 15b.

70
Appendix Table 15d: Provincial and Territorial Estimates Proportional to 2011 HDR Estimates for Canada, 2005 PPP adjusted US dollars, 1990, 2000, and 2005-2014
Year Canada NL PEI NS NB QC ON MB SK AB BC YT NWT NU
1990 29,231 18,744 19,147 22,456 21,790 25,865 33,355 25,731 23,527 32,961 28,806 46,895 - -
2000 35,567 24,922 24,961 27,404 28,243 31,667 39,135 30,887 33,017 43,413 33,265 40,003 64,423 32,632
2005 38,660 35,228 27,123 30,474 30,210 33,461 39,929 32,432 38,624 55,704 36,229 43,142 96,727 34,701
2006 39,794 39,169 27,918 31,016 30,929 33,457 40,230 33,106 40,910 61,459 37,734 44,621 92,734 34,650
2007 40,150 42,177 28,128 30,556 31,403 33,369 40,022 34,522 40,776 62,993 38,887 46,165 90,055 35,268
2008 39,988 47,721 28,098 30,337 31,716 33,249 39,401 34,943 43,689 62,068 38,629 46,568 89,929 35,114
2009 38,343 47,598 26,421 29,185 29,717 31,238 36,424 33,580 51,259 63,501 36,244 47,618 89,378 37,869
2010 39,049 40,536 29,504 31,194 32,238 33,598 38,539 35,218 48,644 55,949 37,278 53,003 77,900 39,449
2011 41,333 47,119 31,168 33,076 33,927 34,994 40,623 36,922 50,965 61,180 38,839 56,487 94,102 48,527
2012 41,539 51,487 30,352 32,132 33,604 34,699 40,092 36,714 56,554 63,695 38,836 56,736 87,639 47,942
2013 41,887 48,548 30,638 31,978 33,472 34,970 40,500 38,179 57,260 64,173 38,924 56,292 80,373 50,564
2014 42,155 51,902 31,142 32,040 33,016 34,692 40,065 38,312 59,121 67,314 38,729 54,824 80,134 51,698
Source: Appendix Table 15b,c, Canada data taken from the International Human Development Indicators website (http://hdrstats.undp.org/en/indicators/90406.html).
Appendix Table 15e: Income Index Based on 2011 HDR Proportional Estimates, Canada, Provinces and Territories, 1990, 2000, and 2005-2014
Year Canada NL PEI NS NB QC ON MB SK AB BC YT NWT NU
1990 0.858 0.791 0.794 0.818 0.813 0.839 0.878 0.838 0.825 0.876 0.855 0.929 - -
2000 0.887 0.834 0.834 0.848 0.852 0.870 0.902 0.866 0.876 0.917 0.877 0.905 0.977 0.874
2005 0.900 0.886 0.846 0.864 0.863 0.878 0.905 0.873 0.900 0.955 0.890 0.916 1.038 0.884
2006 0.904 0.902 0.851 0.867 0.866 0.878 0.906 0.876 0.908 0.970 0.896 0.922 1.032 0.883
2007 0.906 0.913 0.852 0.864 0.868 0.878 0.905 0.883 0.908 0.974 0.901 0.927 1.028 0.886
2008 0.905 0.932 0.852 0.863 0.870 0.877 0.903 0.885 0.918 0.971 0.900 0.928 1.027 0.885
2009 0.899 0.931 0.842 0.857 0.860 0.868 0.891 0.879 0.943 0.975 0.890 0.931 1.026 0.897
2010 0.901 0.907 0.859 0.867 0.872 0.879 0.899 0.886 0.935 0.956 0.894 0.948 1.006 0.903
2011 0.910 0.930 0.867 0.876 0.880 0.885 0.907 0.893 0.942 0.969 0.901 0.957 1.034 0.934
2012 0.911 0.943 0.863 0.872 0.879 0.884 0.905 0.892 0.957 0.975 0.901 0.958 1.024 0.932
2013 0.912 0.934 0.865 0.871 0.878 0.885 0.907 0.898 0.959 0.976 0.901 0.957 1.010 0.940
2014 0.913 0.944 0.867 0.872 0.876 0.884 0.905 0.899 0.964 0.984 0.900 0.953 1.010 0.944
Source: Appendix Table 15d; HDR 2011 for minimum=100 and maximum=107,721 (Qatar, 2011).

71
Appendix Table 16: Human Development Index Based on 2011 HDR Consistent Estimates, Canada, Provinces and Territories, 1990, 2000, and 2005-2014
Year Canada NL PEI NS NB QC ON MB SK AB BC YT NWT NU
1990 0.848 0.815 0.818 0.836 0.829 0.844 0.869 0.842 0.841 0.864 0.857 - - -
2000 0.867 0.835 0.835 0.850 0.842 0.859 0.877 0.846 0.852 0.873 0.873 0.839 0.869 0.765
2005 0.892 0.869 0.862 0.870 0.867 0.884 0.899 0.869 0.876 0.902 0.892 0.863 0.901 0.795
2006 0.894 0.876 0.863 0.873 0.869 0.887 0.900 0.871 0.878 0.906 0.894 0.865 0.900 0.803
2007 0.895 0.881 0.871 0.875 0.872 0.887 0.902 0.873 0.879 0.907 0.894 0.865 0.897 0.801
2008 0.896 0.887 0.864 0.870 0.873 0.889 0.903 0.875 0.880 0.906 0.898 0.855 0.891 0.798
2009 0.895 0.889 0.861 0.869 0.866 0.886 0.899 0.870 0.888 0.908 0.896 0.854 0.895 0.804
2010 0.896 0.879 0.869 0.875 0.870 0.891 0.902 0.873 0.887 0.904 0.899 0.862 0.884 0.800
2011 0.900 0.887 0.872 0.879 0.872 0.895 0.905 0.875 0.889 0.908 0.903 0.874 0.900 0.808
2012 0.901 0.892 0.873 0.878 0.872 0.896 0.905 0.874 0.893 0.909 0.903 0.875 0.896 0.812
2013 0.902 0.892 0.873 0.879 0.873 0.897 0.906 0.875 0.895 0.910 0.904 0.875 0.891 0.819
2014 0.913 0.905 0.887 0.889 0.882 0.910 0.915 0.886 0.910 0.924 0.912 0.886 0.901 0.836 Compound Annual Growth Rate
1990-2014 0.31 0.44 0.34 0.26 0.26 0.31 0.22 0.21 0.33 0.28 0.26 - - -
1990-2000 0.23 0.23 0.21 0.17 0.15 0.17 0.09 0.04 0.13 0.10 0.18 - - -
2000-2014 0.37 0.58 0.44 0.32 0.34 0.42 0.31 0.33 0.47 0.41 0.31 0.39 0.25 0.64
2000-2005 0.55 0.82 0.66 0.46 0.59 0.58 0.51 0.55 0.57 0.67 0.44 0.55 0.71 0.77
2005-2014 0.27 0.45 0.31 0.25 0.20 0.32 0.20 0.22 0.42 0.27 0.24 0.30 0.00 0.56
Source: Appendix Table 11d, 14, 15d.

72
Appendix Table 17: International Rankings from 2014 HDR with Provinces and Territories Inserted on an Individual Basis, HDI and Component Indicators, 2014
Table 17a: International Rankings for
Life Expectancy
Table 17b: International Rankings for
Average Educational Attainment
Table 17c: International Ranking
for Expected Years of Schooling
Table 17d: International Rankings for
GNI per capita Table 17e: International Rankings for HDI
Rank Country
Life
Expectancy
at Birth,
years
Rank Country
Average
Educational
Attainment,
years
Rank Country
Expected
Years of
Schooling
Rank Country
GNI per
capita
(2005
PPP
adjusted
US
dollars)
Rank Country
Human
Development
Index (HDI)
value
1 Hong Kong,
China (SAR) 84.0 1 YT 13.4 1 Australia 20.2 1 Qatar 123,124 1 Norway 0.944
2 Japan 83.5 1 BC 13.2 2 New Zealand 19.2 2 Kuwait 83,961 2 Australia 0.935
3 Italy 83.1 1 AB 13.1 3 Iceland 19.0 3 NWT 80,134 3 Switzerland 0.930
4 Switzerland 83.0 1 ON 13.1 4 Denmark 18.7 3 Liechtenstein 79,851 4 AB 0.924
5 Singapore 83.0 1 Germany 13.1 5 Ireland 18.6 4 Singapore 76,628 4 Denmark 0.923
6 BC 83.0 2 United
Kingdom 13.1 6 Argentina 17.9 5 Brunei Darussalam 72,570 5 Netherlands 0.922
6 Iceland 82.6 3 Canada 13.0 7 Netherlands 17.9 6 AB 67,314 6 Germany 0.916
7 Spain 82.6 4 Australia 13.0 8 Greece 17.6 6 Norway 64,992 7 Ireland 0.916
8 Australia 82.4 5 NS 13.0 9 Norway 17.5 7 United Arab
Emirates 60,868 8 ON 0.915
9 Israel 82.4 5 United States 12.9 10 Spain 17.3 8 SK 59,121 8 United States 0.915
10 ON 82.3 6 QC 12.9 11 Finland 17.1 8 Luxembourg 58,711 9 New Zealand 0.913
10 QC 82.3 6 NWT 12.9 12 Korea
(Republic of) 16.9 9 Switzerland 56,431 9 Canada 0.913
10 Sweden 82.2 6 SK 12.8 13 Slovenia 16.8 10 YT 54,824 11 BC 0.912
11 France 82.2 6 Switzerland 12.8 14 QC 16.6 10 Hong Kong, China
(SAR) 53,959 11 Singapore 0.912
12 Canada 82.0 7 PEI 12.8 14 Estonia 16.5 11 United States 52,947 12 SK 0.910
13 Korea (Republic
of) 81.9 7 MB 12.8 15 United States 16.5 12 Saudi Arabia 52,821 12 QC 0.910
14 New Zealand 81.8 7 Denmark 12.7 16 Germany 16.5 13 NFLD 51,902 12 Hong Kong, China
(SAR) 0.910
15 Luxembourg 81.7 8 NB 12.7 17 Czech
Republic 16.4 13 NU 51,698 13 Liechtenstein 0.908
16 Chile 81.7 8 NFLD 12.7 18 Lithuania 16.4 13 Sweden 45,636 14 Sweden 0.907
17 Norway 81.6 8 Norway 12.6 19 Belgium 16.3 14 Netherlands 45,435 15 NWT 0.907
18 Netherlands 81.6 9 Israel 12.5 20 Portugal 16.3 15 Denmark 44,025 15 United Kingdom 0.907

73
Table 17a: International Rankings for
Life Expectancy
Table 17b: International Rankings for
Average Educational Attainment
Table 17c: International Ranking
for Expected Years of Schooling
Table 17d: International Rankings for
GNI per capita Table 17e: International Rankings for HDI
Rank Country
Life
Expectancy
at Birth,
years
Rank Country
Average
Educational
Attainment,
years
Rank Country
Expected
Years of
Schooling
Rank Country
GNI per
capita
(2005
PPP
adjusted
US
dollars)
Rank Country
Human
Development
Index (HDI)
value
19 Austria 81.4 10 New Zealand 12.5 21 Saudi Arabia 16.3 16 Andorra 43,978 16 NFLD 0.905
20 Andorra 81.3 11 Estonia 12.5 22 United
Kingdom 16.2 17 Germany 43,919 16 Iceland 0.899
21 AB 81.1 12 Lithuania 12.4 23 ON 16.1 18 Austria 43,869 17 Korea (Republic of) 0.898
21 Germany 80.9 13 Palau 12.3 23 Italy 16.0 19 Australia 42,261 18 Israel 0.894
22 Ireland 80.9 14 Czech
Republic 12.3 24 France 16.0 20 Canada 42,155 19 Luxembourg 0.892
23 Greece 80.9 15 Slovakia 12.2 25 Israel 16.0 21 Belgium 41,187 20 Japan 0.891
24 Portugal 80.9 16 Ireland 12.2 26 Canada 15.9 22 ON 40,065 21 Belgium 0.890
25 Belgium 80.8 17 Georgia 12.1 27 Sweden 15.8 22 Ireland 39,568 22 NS 0.889
26 Finland 80.8 18 Sweden 12.1 28 Grenada 15.8 23 United Kingdom 39,267 22 YT 0.888
27 United Kingdom 80.7 19 Belarus 12.0 29 PEI 15.8 24 BC 38,729 22 France 0.888
28 NS 80.6 20 Russian
Federation 12.0 29 Switzerland 15.8 24 Finland 38,695 23 PEI 0.887
28 Malta 80.6 21 Slovenia 11.9 30 Austria 15.7 25 Bahrain 38,599 23 MB 0.886
29 PEI 80.5 22 Korea
(Republic of) 11.9 31 Fiji 15.7 26 MB 38,312 23 Austria 0.885
29 Slovenia 80.4 23 Netherlands 11.9 32 Belarus 15.7 26 France 38,056 24 Finland 0.883
30 NB 80.4 24 Liechtenstein 11.8 33 NS 15.6 27 Japan 36,927 25 NB 0.882
30 Denmark 80.2 25 Poland 11.8 33 NFLD 15.6 28 Iceland 35,182 25 Slovenia 0.880
31 Cyprus 80.2 26 Luxembourg 11.7 33 Hong Kong, China (SAR)
15.6 29 Oman 34,858 26 Spain 0.876
32 Liechtenstein 80.0 27 Hungary 11.6 34 Mauritius 15.6 30 QC 34,692 27 Italy 0.873
33 SK 79.7 28 Cyprus 11.6 35 Uruguay 15.5 30 Korea (Republic of) 33,890 28 Czech Republic 0.870
33 NFLD 79.7 29 Japan 11.5 36 BC 15.5 31 Italy 33,030 29 Greece 0.865
33 Cuba 79.4 30 Cuba 11.5 36 Poland 15.5 32 NB 33,016 30 Estonia 0.861
34 Costa Rica 79.4 31 Latvia 11.5 37 Barbados 15.4 32 New Zealand 32,689 31 Brunei Darussalam 0.856
35 MB 79.4 32 Kazakhstan 11.4 38 Singapore 15.4 33 Spain 32,045 32 Qatar 0.850
35 Lebanon 79.3 33 Ukraine 11.3 39 Hungary 15.4 34 NS 32,040 33 Cyprus 0.850
36 United States 79.1 34 Belgium 11.3 40 Japan 15.3 34 PEI 31,142 34 Andorra 0.845

74
Table 17a: International Rankings for
Life Expectancy
Table 17b: International Rankings for
Average Educational Attainment
Table 17c: International Ranking
for Expected Years of Schooling
Table 17d: International Rankings for
GNI per capita Table 17e: International Rankings for HDI
Rank Country
Life
Expectancy
at Birth,
years
Rank Country
Average
Educational
Attainment,
years
Rank Country
Expected
Years of
Schooling
Rank Country
GNI per
capita
(2005
PPP
adjusted
US
dollars)
Rank Country
Human
Development
Index (HDI)
value
37 Brunei
Darussalam 78.8 35
Moldova
(Republic of) 11.2 41 Chile 15.2 34 Israel 30,676 35 Slovakia 0.844
38 Czech Republic 78.6 36 Hong Kong, China (SAR)
11.2 42 Latvia 15.2 35 Cyprus 28,633 36 Poland 0.843
39 Qatar 78.2 37 Azerbaijan 11.2 43 MB 15.2 36 Malta 27,930 37 Lithuania 0.839
40 Albania 77.8 38 Montenegro 11.2 43 SK 15.2 37 Slovenia 27,852 38 Malta 0.839
41 Dominica 77.8 39 France 11.1 43 Brazil 15.2 38 Czech Republic 26,660 39 Saudi Arabia 0.837
42 Panama 77.6 40 Croatia 11.0 44 Montenegro 15.2 39 Trinidad and
Tobago 26,090 40 Argentina 0.836
43 NWT 77.5 35 NU 10.9 45 Ukraine 15.1 40 Slovakia 25,845 41 United Arab
Emirates 0.835
43 Poland 77.4 41 Bahamas 10.9 46 NB 15.1 41 Portugal 25,757 42 Chile 0.832
44 Croatia 77.3 42 Trinidad and
Tobago 10.9 46
Iran (Islamic
Republic of) 15.1 42 Estonia 25,214 43 Portugal 0.830
45 Uruguay 77.2 43 Armenia 10.9 47 Slovakia 15.1 43 Greece 24,524 44 Hungary 0.828
46 United Arab
Emirates 77.0 44 Uzbekistan 10.9 48 Kazakhstan 15.0 44 Lithuania 24,500 45 Bahrain 0.824
47 YT 76.9 45 Austria 10.8 49 AB 15.0 45 Seychelles 23,300 46 NU 0.819
47 Estonia 76.8 46 Sri Lanka 10.8 49 Liechtenstein 15.0 46 Poland 23,177 46 Latvia 0.819
48 Oman 76.8 47 Romania 10.8 50 Croatia 14.8 47 Hungary 22,916 47 Croatia 0.818
49 Mexico 76.8 48 Tonga 10.7 51 Kuwait 14.7 48 Malaysia 22,762 48 Kuwait 0.816
50 Maldives 76.8 49 Singapore 10.6 52 Tonga 14.7 49 Russian Federation 22,352 49 Montenegro 0.802
51 Bahrain 76.6 50 Iceland 10.6 53 Russian
Federation 14.7 50 Latvia 22,281 50 Belarus 0.798
52 Bosnia and
Herzegovina 76.5 51 Kyrgyzstan 10.6 54 Tunisia 14.6 51 Argentina 22,050 51 Russian Federation 0.798
53 Slovakia 76.3 52 Bulgaria 10.6 55 NWT 14.6 52 Bahamas 21,336 52 Oman 0.793
54 Argentina 76.3 53 Belize 10.5 55 Mongolia 14.6 53 Chile 21,290 53 Romania 0.793
55 Montenegro 76.2 54 Serbia 10.5 56 Turkey 14.5 54 Equatorial Guinea 21,056 54 Uruguay 0.793
56 Antigua and
Barbuda 76.1 55 Barbados 10.5 57
Brunei
Darussalam 14.5 55 Kazakhstan 20,867 55 Bahamas 0.790
57 Ecuador 75.9 56 Tajikistan 10.4 58 Malta 14.4 56 Saint Kitts and
Nevis 20,805 56 Kazakhstan 0.788

75
Table 17a: International Rankings for
Life Expectancy
Table 17b: International Rankings for
Average Educational Attainment
Table 17c: International Ranking
for Expected Years of Schooling
Table 17d: International Rankings for
GNI per capita Table 17e: International Rankings for HDI
Rank Country
Life
Expectancy
at Birth,
years
Rank Country
Average
Educational
Attainment,
years
Rank Country
Expected
Years of
Schooling
Rank Country
GNI per
capita
(2005
PPP
adjusted
US
dollars)
Rank Country
Human
Development
Index (HDI)
value
58 China 75.8 57 Malta 10.3 59 Bahrain 14.4 57 Antigua and
Barbuda 20,070 57 Barbados 0.785
59 Viet Nam 75.8 58 Samoa 10.3 60 Serbia 14.4 58 Croatia 19,409 58 Antigua and
Barbuda 0.783
60 Jamaica 75.7 59 Finland 10.3 61 Bulgaria 14.4 59 Uruguay 19,283 59 Bulgaria 0.782
61 Barbados 75.6 60 Greece 10.3 62
Venezuela
(Bolivarian Republic of)
14.2 60 Turkey 18,677 60 Palau 0.780
62 Bahamas 75.4 61 Italy 10.1 63 Romania 14.2 61 Panama 18,192 61 Panama 0.780
63 Iran (Islamic Republic of)
75.4 62 Malaysia 10.0 64 Ecuador 14.2 62 Romania 18,108 62 Malaysia 0.779
64
The former
Yugoslav
Republic of Macedonia
75.4 63 South Africa 9.9 65 YT 14.2 63 Mauritius 17,470 63 Mauritius 0.777
65 Turkey 75.3 64 Fiji 9.9 65 Libya 14.0 64 Belarus 16,676 64 Seychelles 0.772
66 Hungary 75.2 65 Jordan 9.9 66 Cyprus 14.0 65 Botswana 16,646 65 Trinidad and
Tobago 0.772
67 Saint Lucia 75.1 66 Turkmenistan 9.9 67 Algeria 14.0 66 Lebanon 16,509 66 Serbia 0.771
68 Serbia 74.9 67 Argentina 9.8 68 Antigua and
Barbuda 14.0 67 Azerbaijan 16,428 67 Cuba 0.769
69 Sri Lanka 74.9 68 Chile 9.8 69 Luxembourg 13.9 68 Gabon 16,367 68 Lebanon 0.769
70 Georgia 74.9 69 Micronesia (Federated
States of)
9.7 70 Costa Rica 13.9 69 Venezuela (Bolivarian
Republic of)
16,159 69 Costa Rica 0.766
71 Nicaragua 74.9 70 Jamaica 9.7 71 Cuba 13.8 70 Mexico 16,056 70 Iran (Islamic
Republic of) 0.766
72 Algeria 74.8 71 Spain 9.6 72 Georgia 13.8 71 Suriname 15,617 71
Venezuela
(Bolivarian
Republic of)
0.762
73 Tunisia 74.8 72 Andorra 9.6 73 Qatar 13.8 72 Bulgaria 15,596 72 Turkey 0.761
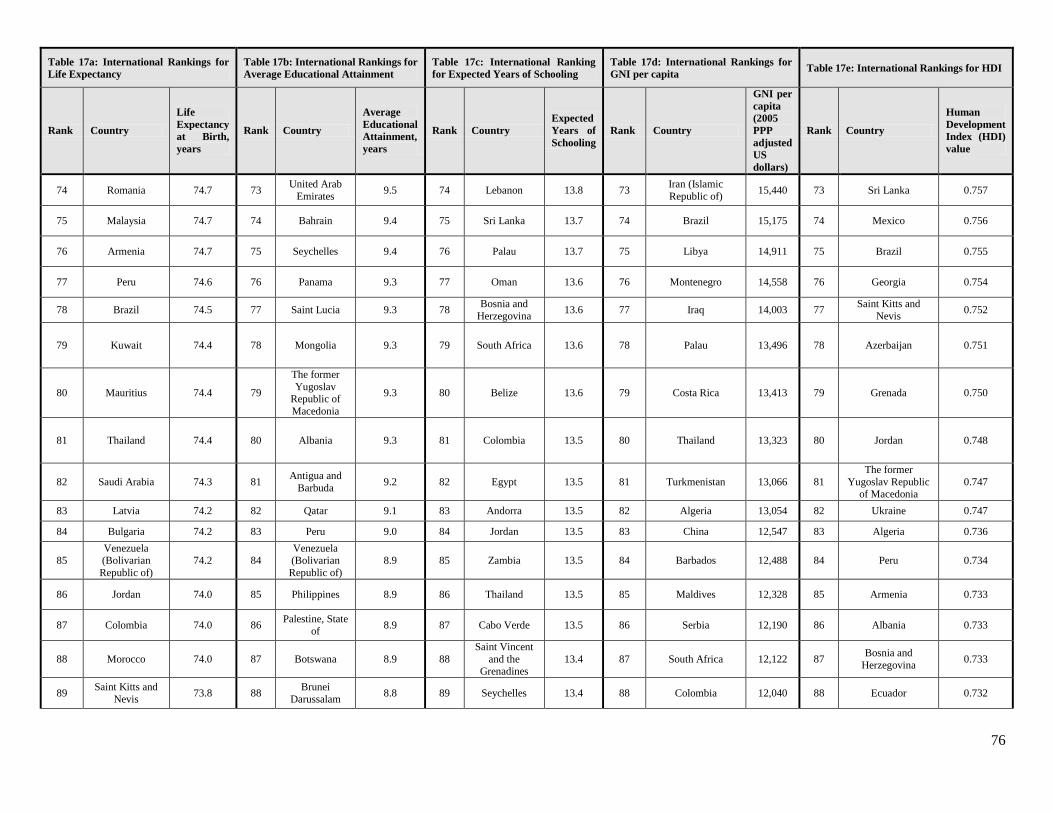
76
Table 17a: International Rankings for
Life Expectancy
Table 17b: International Rankings for
Average Educational Attainment
Table 17c: International Ranking
for Expected Years of Schooling
Table 17d: International Rankings for
GNI per capita Table 17e: International Rankings for HDI
Rank Country
Life
Expectancy
at Birth,
years
Rank Country
Average
Educational
Attainment,
years
Rank Country
Expected
Years of
Schooling
Rank Country
GNI per
capita
(2005
PPP
adjusted
US
dollars)
Rank Country
Human
Development
Index (HDI)
value
74 Romania 74.7 73 United Arab
Emirates 9.5 74 Lebanon 13.8 73
Iran (Islamic
Republic of) 15,440 73 Sri Lanka 0.757
75 Malaysia 74.7 74 Bahrain 9.4 75 Sri Lanka 13.7 74 Brazil 15,175 74 Mexico 0.756
76 Armenia 74.7 75 Seychelles 9.4 76 Palau 13.7 75 Libya 14,911 75 Brazil 0.755
77 Peru 74.6 76 Panama 9.3 77 Oman 13.6 76 Montenegro 14,558 76 Georgia 0.754
78 Brazil 74.5 77 Saint Lucia 9.3 78 Bosnia and
Herzegovina 13.6 77 Iraq 14,003 77
Saint Kitts and
Nevis 0.752
79 Kuwait 74.4 78 Mongolia 9.3 79 South Africa 13.6 78 Palau 13,496 78 Azerbaijan 0.751
80 Mauritius 74.4 79
The former
Yugoslav Republic of
Macedonia
9.3 80 Belize 13.6 79 Costa Rica 13,413 79 Grenada 0.750
81 Thailand 74.4 80 Albania 9.3 81 Colombia 13.5 80 Thailand 13,323 80 Jordan 0.748
82 Saudi Arabia 74.3 81 Antigua and
Barbuda 9.2 82 Egypt 13.5 81 Turkmenistan 13,066 81
The former
Yugoslav Republic of Macedonia
0.747
83 Latvia 74.2 82 Qatar 9.1 83 Andorra 13.5 82 Algeria 13,054 82 Ukraine 0.747
84 Bulgaria 74.2 83 Peru 9.0 84 Jordan 13.5 83 China 12,547 83 Algeria 0.736
85 Venezuela (Bolivarian
Republic of)
74.2 84 Venezuela (Bolivarian
Republic of)
8.9 85 Zambia 13.5 84 Barbados 12,488 84 Peru 0.734
86 Jordan 74.0 85 Philippines 8.9 86 Thailand 13.5 85 Maldives 12,328 85 Armenia 0.733
87 Colombia 74.0 86 Palestine, State
of 8.9 87 Cabo Verde 13.5 86 Serbia 12,190 86 Albania 0.733
88 Morocco 74.0 87 Botswana 8.9 88
Saint Vincent
and the Grenadines
13.4 87 South Africa 12,122 87 Bosnia and
Herzegovina 0.733
89 Saint Kitts and
Nevis 73.8 88
Brunei
Darussalam 8.8 89 Seychelles 13.4 88 Colombia 12,040 88 Ecuador 0.732

77
Table 17a: International Rankings for
Life Expectancy
Table 17b: International Rankings for
Average Educational Attainment
Table 17c: International Ranking
for Expected Years of Schooling
Table 17d: International Rankings for
GNI per capita Table 17e: International Rankings for HDI
Rank Country
Life
Expectancy
at Birth,
years
Rank Country
Average
Educational
Attainment,
years
Rank Country
Expected
Years of
Schooling
Rank Country
GNI per
capita
(2005
PPP
adjusted
US
dollars)
Rank Country
Human
Development
Index (HDI)
value
90 Dominican
Republic 73.5 89 Saudi Arabia 8.7 90
The former
Yugoslav
Republic of Macedonia
13.4 89 Dominican
Republic 11,883 89 Saint Lucia 0.729
91 Grenada 73.4 90
Saint Vincent
and the Grenadines
8.6 91 United Arab
Emirates 13.3 90
The former
Yugoslav Republic of Macedonia
11,780 90 China 0.727
92 Samoa 73.4 91 Grenada 8.6 92 Panama 13.3 91 Jordan 11,365 91 Fiji 0.727
93 Lithuania 73.3 92 Mauritius 8.5 93
Bolivia
(Plurinational State of)
13.2 92 Peru 11,015 92 Mongolia 0.727
94 Cabo Verde 73.3 93 Guyana 8.5 94 Dominican
Republic 13.1 93 Grenada 10,939 93 Thailand 0.726
95 Seychelles 73.1 94 Mexico 8.5 95 China 13.1 94 Mongolia 10,729 94 Libya 0.724
96 Honduras 73.1 95 Uruguay 8.5 96 Peru 13.1 95 Ecuador 10,605 95 Dominica 0.724
97 El Salvador 73.0 96 Saint Kitts and
Nevis 8.4 97 Mexico 13.1 96 Egypt 10,512 96 Tunisia 0.721
98 Saint Vincent
and the
Grenadines
72.9 97 Costa Rica 8.4 98 Palestine, State
of 13.0 97 Tunisia 10,404 97 Colombia 0.720
99 Paraguay 72.9 98 Bosnia and
Herzegovina 8.3 99 Indonesia 13.0 98 Dominica 9,994 98
Saint Vincent and
the Grenadines 0.720
100 Palestine, State
of 72.9 99 Portugal 8.2 100 Maldives 13.0 99 Albania 9,943 99 Jamaica 0.719
101 Tonga 72.8 100 Iran (Islamic
Republic of) 8.2 101 Samoa 12.9 100
Saint Vincent and
the Grenadines 9,937 100 Tonga 0.717
102 Palau 72.7 101
Bolivia
(Plurinational
State of)
8.2 102 Saint Kitts and
Nevis 12.9 101 Indonesia 9,788 101
Dominican Republic
0.715
103 NU 72.3 102 Oman 8.0 103 Malaysia 12.7 102 Sri Lanka 9,779 102 Belize 0.715
103 Vanuatu 71.9 103 Lebanon 7.9 104 Suriname 12.7 103 Saint Lucia 9,765 103 Suriname 0.714
104 Guatemala 71.8 104 Dominica 7.9 105 Dominica 12.7 104 Bosnia and
Herzegovina 9,638 104 Maldives 0.706
105 Libya 71.6 105 Kiribati 7.8 106 Bhutan 12.6 105 Namibia 9,418 105 Samoa 0.702
106 Moldova
(Republic of) 71.6 106 Gabon 7.8 107 NU 12.6 106 Ukraine 8,178 106 Botswana 0.698

78
Table 17a: International Rankings for
Life Expectancy
Table 17b: International Rankings for
Average Educational Attainment
Table 17c: International Ranking
for Expected Years of Schooling
Table 17d: International Rankings for
GNI per capita Table 17e: International Rankings for HDI
Rank Country
Life
Expectancy
at Birth,
years
Rank Country
Average
Educational
Attainment,
years
Rank Country
Expected
Years of
Schooling
Rank Country
GNI per
capita
(2005
PPP
adjusted
US
dollars)
Rank Country
Human
Development
Index (HDI)
value
107 Bangladesh 71.6 107 Paraguay 7.7 107 Bahamas 12.6 107 Armenia 8,124 107 Moldova (Republic
of) 0.693
108 Belarus 71.3 108 Brazil 7.7 108 Saint Lucia 12.6 108 Philippines 7,915 108 Egypt 0.690
109 Suriname 71.1 109 Suriname 7.7 109 Kyrgyzstan 12.5 109 Paraguay 7,643 109 Turkmenistan 0.688
110 Egypt 71.1 110 Algeria 7.6 110 Gabon 12.5 110 Belize 7,614 110 Indonesia 0.684
111 Ukraine 71.0 111 Indonesia 7.6 111 Botswana 12.5 111 Fiji 7,493 111 Gabon 0.684
112 Azerbaijan 70.8 112 Ecuador 7.6 112 Jamaica 12.4 112 Jamaica 7,415 112 Paraguay 0.679
113 Kyrgyzstan 70.6 113 Turkey 7.6 113 Nepal 12.4 113 El Salvador 7,349 113 Palestine, State of 0.677
114 Trinidad and
Tobago 70.4 114
Dominican
Republic 7.6 114
Trinidad and
Tobago 12.3 114 Cuba 7,301 114 Uzbekistan 0.675
115 Russian
Federation 70.1 115 China 7.5 115 Kiribati 12.3 115 Bhutan 7,176 115 Philippines 0.668
116 Fiji 70.0 116 Viet Nam 7.5 116 Armenia 12.3 116 Georgia 7,164 116 South Africa 0.666
117 Belize 70.0 117 Colombia 7.3 117 Syrian Arab
Republic 12.3 117 Guatemala 6,929 117 El Salvador 0.666
118 Syrian Arab
Republic 69.6 118 Thailand 7.3 118 El Salvador 12.3 118 Morocco 6,850 118 Viet Nam 0.666
119 Nepal 69.6 119 Libya 7.3 119 Togo 12.2 119 Angola 6,822 119
Bolivia
(Plurinational State of)
0.662
120 Bhutan 69.5 120 Zimbabwe 7.3 120 Azerbaijan 11.9 120 Guyana 6,522 120 Kyrgyzstan 0.655
121 Kazakhstan 69.4 121 Kuwait 7.2 121 Paraguay 11.9 121 Cabo Verde 6,094 121 Iraq 0.654
122 Mongolia 69.4 122 Swaziland 7.1 122 Viet Nam 11.9 122 Congo 6,012 122 Cabo Verde 0.646
123 Iraq 69.4 123 Ghana 7.0 123 Moldova
(Republic of) 11.9 123
Bolivia (Plurinational State
of)
5,760 123 Micronesia
(Federated States
of)
0.640
124 Tajikistan 69.4 124 Tunisia 6.8 124 Albania 11.8 124 Uzbekistan 5,567 124 Guyana 0.636
125
Micronesia
(Federated States of)
69.1 125 Vanuatu 6.8 125 India 11.7 125 Swaziland 5,542 125 Nicaragua 0.631
126 Indonesia 68.9 126 Zambia 6.6 126 Micronesia
(Federated 11.7 126 India 5,497 126 Morocco 0.628

79
Table 17a: International Rankings for
Life Expectancy
Table 17b: International Rankings for
Average Educational Attainment
Table 17c: International Ranking
for Expected Years of Schooling
Table 17d: International Rankings for
GNI per capita Table 17e: International Rankings for HDI
Rank Country
Life
Expectancy
at Birth,
years
Rank Country
Average
Educational
Attainment,
years
Rank Country
Expected
Years of
Schooling
Rank Country
GNI per
capita
(2005
PPP
adjusted
US
dollars)
Rank Country
Human
Development
Index (HDI)
value
States of)
127 Uzbekistan 68.4 127 Egypt 6.6 127 Timor-Leste 11.7 127 Timor-Leste 5,363 127 Namibia 0.628
128 Cambodia 68.4 128 El Salvador 6.5 128 Morocco 11.6 128 Nigeria 5,341 128 Guatemala 0.627
129 Bolivia
(Plurinational
State of)
68.3 129 Iraq 6.4 129 Uzbekistan 11.5 129 Samoa 5,327 129 Tajikistan 0.624
130 Philippines 68.2 130 Kenya 6.3 130 Nicaragua 11.5 130 Moldova (Republic
of) 5,223 130 India 0.609
131 Timor-Leste 68.2 131 Syrian Arab
Republic 6.3 131 Ghana 11.5 131 Viet Nam 5,092 131 Honduras 0.606
132 India 68.0 132 Namibia 6.2 132 Comoros 11.5 132 Tonga 5,069 132 Bhutan 0.605
133 Solomon Islands 67.9 133 Congo 6.1 133 Angola 11.4 133 Pakistan 4,866 133 Timor-Leste 0.595
134 Sao Tome and
Principe 66.5 134 Madagascar 6.0 134 Namibia 11.3 134 Palestine, State of 4,699 134 Vanuatu 0.594
135 Senegal 66.5 135
Congo
(Democratic Republic of
the)
6.0 135 Swaziland 11.3 135
Lao People's
Democratic
Republic
4,680 135 Syrian Arab
Republic 0.594
136 Guyana 66.4 136 Nicaragua 6.0 136 Sao Tome and
Principe 11.3 136 Myanmar 4,608 136 Congo 0.591
137
Lao People's
Democratic
Republic
66.2 137 Cameroon 6.0 137 Philippines 11.3 137 Nicaragua 4,457 137 Kiribati 0.590
138 Pakistan 66.2 138 Nigeria 5.9 138 Tajikistan 11.2 138 Honduras 3,938 138 Equatorial Guinea 0.587
139 Kiribati 66.0 139 Lesotho 5.9 139 Lesotho 11.1 139 Ghana 3,852 139 Zambia 0.586
140 Myanmar 65.9 140 Maldives 5.8 140 Congo 11.1 140 Sudan 3,809 140 Ghana 0.579
141 Turkmenistan 65.6 141 Guatemala 5.6 141 Honduras 11.1 141 Zambia 3,734 141
Lao People's
Democratic Republic
0.575
142 Madagascar 65.1 142 Honduras 5.5 142 Benin 11.1 142 Mauritania 3,560 142 Bangladesh 0.570
143
Tanzania
(United Republic of)
65.0 143 Equatorial
Guinea 5.5 143 Kenya 11.0 143 Yemen 3,519 143
Sao Tome and
Principe 0.555

80
Table 17a: International Rankings for
Life Expectancy
Table 17b: International Rankings for
Average Educational Attainment
Table 17c: International Ranking
for Expected Years of Schooling
Table 17d: International Rankings for
GNI per capita Table 17e: International Rankings for HDI
Rank Country
Life
Expectancy
at Birth,
years
Rank Country
Average
Educational
Attainment,
years
Rank Country
Expected
Years of
Schooling
Rank Country
GNI per
capita
(2005
PPP
adjusted
US
dollars)
Rank Country
Human
Development
Index (HDI)
value
144 Namibia 64.8 144 Uganda 5.4 144 Cambodia 10.9 144
Micronesia
(Federated States
of)
3,432 144 Cambodia 0.555
145 Botswana 64.5 145 India 5.4 145 Zimbabwe 10.9 145 Lesotho 3,306 145 Kenya 0.548
146 Gabon 64.4 146 South Sudan 5.4 146 Turkmenistan 10.8 146 Djibouti 3,276 146 Nepal 0.548
147 Rwanda 64.2 147
Tanzania
(United
Republic of)
5.1 147 Malawi 10.8 147 Bangladesh 3,191 147 Pakistan 0.538
148 Ethiopia 64.1 148 Bangladesh 5.1 148 Guatemala 10.7 148 Côte d'Ivoire 3,171 148 Myanmar 0.536
149 Yemen 63.8 149 Solomon
Islands 5.0 149 Vanuatu 10.6 149 Kyrgyzstan 3,044 149 Angola 0.532
150 Eritrea 63.7 150 Lao People's Democratic
Republic
5.0 150 Lao People's Democratic
Republic
10.6 150 Cambodia 2,949 150 Swaziland 0.531
151 Sudan 63.5 151 Haiti 4.9 151 Cameroon 10.4 151 Sao Tome and
Principe 2,918 151
Tanzania (United
Republic of) 0.521
152 Comoros 63.3 152 Pakistan 4.7 152 Madagascar 10.3 152 Cameroon 2,803 152 Nigeria 0.514
153 Mauritania 63.1 153 Angola 4.7 153 Guyana 10.3 153 Vanuatu 2,803 153 Cameroon 0.512
154 Haiti 62.8 154 Cabo Verde 4.7 154 Rwanda 10.3 154 Kenya 2,762 154 Madagascar 0.510
155 Malawi 62.8 155 Sao Tome and
Principe 4.7 155 Burundi 10.1 155
Syrian Arab Republic
2,728 155 Zimbabwe 0.509
156 Papua New
Guinea 62.6 156 Comoros 4.6 156 Iraq 10.1 156 Tajikistan 2,517 156 Mauritania 0.506
157 Congo 62.3 157 Togo 4.5 157 Bangladesh 10.0 157 Papua New Guinea 2,463 157 Solomon Islands 0.506
158 Djibouti 62.0 158 Timor-Leste 4.4 158 Papua New
Guinea 9.9 158 Kiribati 2,434 158 Papua New Guinea 0.505
159 Kenya 61.6 159 Cambodia 4.4 159 Uganda 9.8 159 Tanzania (United
Republic of) 2,411 159 Comoros 0.503
160 Ghana 61.4 160 Morocco 4.4 160
Congo
(Democratic Republic of
the)
9.8 160 South Sudan 2,332 160 Yemen 0.498
161 Niger 61.4 161 Malawi 4.3 161 Liberia 9.5 161 Nepal 2,311 161 Lesotho 0.497
162 Liberia 60.9 162 Côte d'Ivoire 4.3 162 Mozambique 9.3 162 Senegal 2,188 162 Togo 0.484

81
Table 17a: International Rankings for
Life Expectancy
Table 17b: International Rankings for
Average Educational Attainment
Table 17c: International Ranking
for Expected Years of Schooling
Table 17d: International Rankings for
GNI per capita Table 17e: International Rankings for HDI
Rank Country
Life
Expectancy
at Birth,
years
Rank Country
Average
Educational
Attainment,
years
Rank Country
Expected
Years of
Schooling
Rank Country
GNI per
capita
(2005
PPP
adjusted
US
dollars)
Rank Country
Human
Development
Index (HDI)
value
163 Afghanistan 60.4 163
Central
African
Republic
4.2 163 Afghanistan 9.3 163 Chad 2,085 163 Haiti 0.483
164 Gambia 60.2 164 Myanmar 4.1 164 Solomon
Islands 9.2 164 Afghanistan 1,885 164 Rwanda 0.483
165 Zambia 60.1 165 Liberia 4.1 165
Tanzania
(United
Republic of)
9.2 165 Sierra Leone 1,780 165 Uganda 0.483
166 Togo 59.7 166 Papua New
Guinea 4.0 166 Yemen 9.2 166 Benin 1,767 166 Benin 0.480
167 Benin 59.6 167 Eritrea 3.9 167 Guinea-Bissau 9.0 167 Haiti 1,669 167 Sudan 0.479
168 Guinea 58.8 168 Djibouti 3.8 168 Nigeria 9.0 168 Zimbabwe 1,615 168 Djibouti 0.470
169
Congo
(Democratic Republic of the)
58.7 169 Mauritania 3.8 169 Equatorial
Guinea 9.0 169 Uganda 1,613 169 South Sudan 0.467
170 Burkina Faso 58.7 170 Rwanda 3.7 170 Côte d'Ivoire 8.9 170 Burkina Faso 1,591 170 Senegal 0.466
171 Uganda 58.5 171 Nepal 3.3 171 Gambia 8.8 171 Mali 1,583 171 Afghanistan 0.465
172 Mali 58.0 172 Benin 3.3 172 Guinea 8.7 172 Solomon Islands 1,540 172 Côte d'Ivoire 0.462
173 Equatorial
Guinea 57.6 173 Mozambique 3.2 173 Haiti 8.7 173 Gambia 1,507 173 Malawi 0.445
174 Zimbabwe 57.5 174 Afghanistan 3.2 174 Myanmar 8.6 174 Rwanda 1,458 174 Ethiopia 0.442
175 South Africa 57.4 175 Sudan 3.1 175 Sierra Leone 8.6 175 Comoros 1,456 175 Gambia 0.441
176 Burundi 56.7 176 Sierra Leone 3.1 176 Mauritania 8.5 176 Ethiopia 1,428 176 Congo (Democratic
Republic of the) 0.433
177 South Sudan 55.7 177 Bhutan 3.0 177 Ethiopia 8.5 177 Guinea-Bissau 1,362 177 Liberia 0.430
178 Cameroon 55.5 178 Guinea-Bissau 2.8 178 Mali 8.4 178 Madagascar 1,328 178 Guinea-Bissau 0.420
179 Guinea-Bissau 55.2 179 Gambia 2.8 179 Senegal 7.9 179 Togo 1,228 179 Mali 0.419
180 Mozambique 55.1 180 Burundi 2.7 180 Pakistan 7.8 180 Eritrea 1,130 180 Mozambique 0.416
181 Nigeria 52.8 181 Yemen 2.6 181 Burkina Faso 7.8 181 Mozambique 1,123 181 Sierra Leone 0.413
182 Angola 52.3 182 Senegal 2.5 182 South Sudan 7.6 182 Guinea 1,096 182 Guinea 0.411
183 Chad 51.6 183 Guinea 2.4 183 Chad 7.4 183 Niger 908 183 Burkina Faso 0.402

82
Table 17a: International Rankings for
Life Expectancy
Table 17b: International Rankings for
Average Educational Attainment
Table 17c: International Ranking
for Expected Years of Schooling
Table 17d: International Rankings for
GNI per capita Table 17e: International Rankings for HDI
Rank Country
Life
Expectancy
at Birth,
years
Rank Country
Average
Educational
Attainment,
years
Rank Country
Expected
Years of
Schooling
Rank Country
GNI per
capita
(2005
PPP
adjusted
US
dollars)
Rank Country
Human
Development
Index (HDI)
value
184 Côte d'Ivoire 51.5 184 Ethiopia 2.4 184
Central
African
Republic
7.2 184 Liberia 805 184 Burundi 0.400
185 Sierra Leone 50.9 185 Mali 2.0 185 Sudan 7.0 185 Burundi 758 185 Chad 0.392
186 Central African
Republic 50.7 186 Chad 1.9 186 Djibouti 6.4 186 Malawi 747 186 Eritrea 0.391
187 Lesotho 49.8 187 Niger 1.5 187 Niger 5.4 187 Congo (Democratic
Republic of the) 680 187
Central African
Republic 0.350
188 Swaziland 49.0 188 Burkina Faso 1.4 188 Eritrea 4.1 188 Central African
Republic 581 188 Niger 0.348
Source: most recent HDR.