the hotspot matrix: a framework for the spatio-temporal targeting · pdf filepolice practice...
TRANSCRIPT

Police Practice and Research,Vol. 5, No. 1, March 2004, pp. 05–23
The Hotspot Matrix: A Framework for the Spatio-Temporal Targeting of Crime ReductionJerry H. Ratcliffe
Taylor & Francis LtdGPPR5102.sgm10.1080/Police Practice and Research: An International Journal1561-4263 (print)/1477-271X (online)Special Issue2004Taylor & Francis Ltd51126March 2004JerryH.RatcliffeAssociate Professor Department of Criminal Justice Temple University1115 W Berks StreetPhiladelphiaPA [email protected]
The growth of intelligence-led policing has placed even greater emphasis on the clear iden-tification of crime hotspots as well as the choice of the crime reduction or detection strategyidentified to combat a problem. Crime hotspots are becoming central to policing strategy inmany locations, as they enable an operational commander to focus resources into the areasof highest need. This paper outlines the techniques used to identify the spatial and temporalcomponents of crime hotspots, and utilizes these methods to identify three broad categoriesof temporal hotspot and three broad categories of spatial hotspot. These categories aredescribed in the form of a Hotspot Matrix. Real examples show how the spatial and tempo-ral characteristics combine within the hotspot matrix, and the paper concludes by showinghow operational commanders and crime prevention practitioners might employ the hotspotmatrix to determine an appropriate prevention or detection strategy.
Keywords: Intelligence-led Policing; Hotspots; Crime Reduction; GIS
The Increasing Use of Hotspots in Crime Reduction
The use of hotspots to determine policing and crime prevention strategies has grownover recent years. Crime hotspots—areas of high crime intensity—have appeal toboth crime prevention practitioners and police managers. With the development ofplanning solutions such as Crime Prevention through Environmental Design
Jerry H. Ratcliffe is an Associate Professor in the Department of Criminal Justice at Temple University, Philadelphia.Correspondence to: J. H. Ratcliffe, Associate Professor, Dept. of Criminal Justice, Temple University, PhiladelphiaPA, USA. Email: [email protected].
ISSN 1561–4263 (print)/ISSN 1477–271X online/04/010005-19 © 2004 Taylor & Francis LtdDOI: 10.180/1561426042000191305

6
Jerry H. Ratcliffe
(CPTED) (Jeffery & Zahm, 1993) and situational crime prevention (Brantingham &Brantingham, 1990; Clarke, 1992; Ekblom & Tilley, 2000), there have been greaterclaims on the crime prevention budgets of local authorities and city planners.Hotspots allow local councillors to determine the areas of greatest need. Similarly inpolicing there has been a considerable shift towards greater use of hotspots as thefoundation for problem-oriented policing (Goldstein, 1990) and as a focal point forthe identification of ‘problems’ which can be resolved with the SARA problem-solving technique (Eck & Spelman, 1987; Greene, 2000). More recently, hotspotpolicing has gained prominence as an operational tactic, most notably in the Britishdrive toward intelligence-led policing (see, for example, Audit Commission, 1993;Heaton, 2000; HMIC, 1997; Maguire, 2000; Ratcliffe, 2002c; Smith, 1997), but also inthe USA with the growth of both intelligence and crime analysis practice (Andrews &Peterson, 1990; Carter, 1990; Gottlieb, Arenberg, & Singh, 1998) and in Australia(AFP, 2001; CJC, 1996; Seddon & Napper, 1999). In times of fiscal constraint, bothcrime prevention practitioners and police find appeal in a mechanism that allowsthem to focus resources on the areas of most need and to have a process for explain-ing their objective decision-making to others.
Beyond the immediate practical applications, academic interest in hotspots hascome from two directions: different theoretical explanations for hotspots and tech-niques for the detection of crime hotspots. In the first area, a number of researchershave worked to find theoretical explanations for hotspots, including the developmentof places as crime attractors or crime generators (Brantingham & Brantingham,1995a), a better understanding of offender spatial behaviour (Brantingham & Brant-ingham, 1981; Rossmo, 2000), and the development of our understanding of thespatial dynamics of drug markets (Rengert, 1996). The US National Institute ofJustice’s Drug Market Analysis Program placed significant emphasis on hotspots ofdrug activity by mapping the spatial characteristics and the police response withcomputer mapping programs, and the research sites produced a number of paperswith implications for spatial policing strategies, including the work of Weisburd andGreen (1995) on control strategies for drug market hotspots. A useful summary ofenvironmental criminology can be found in the work of Bottoms and Wiles (2002),while evaluation of some hotspot crime prevention strategies is summarized in thework of Eck (1998).
As the use of geographic information systems (GIS) has grown within the practi-tioner community it has also grown in the academic environment beyond the origi-nal field of geography, enabling criminal justice professionals and criminologists toexplore questions of spatial criminology in greater detail than ever before. To answerthese more specific questions of spatial crime location has required improvements inthe available methods for the description of crime hotspots, and these are discussedbelow. The paper then outlines some broad categories of spatial and temporalhotspots in the form of a hotspot matrix. Some applications of the hotspot matrix asa practitioner tool in the determination of crime prevention and detection tactics willalso be discussed. The paper begins by outlining the techniques that are available toresearchers for the description of spatial and temporal hotspots.
Police Practice and Research: An International Journal
7
Spatial Hotspot Identification Processes
Techniques for the detection of crime hotspots have been developed for a number ofyears, though are by no means at the stage where they are both definitive and easilyapplicable. The real innovations have taken place in recent years with the improve-ments in computing power associated with the information technology (IT) revolu-tion. Some spatial techniques that have been applied include the use of locationquotients (Brantingham & Brantingham, 1995b), the development of kernel surfaceestimation algorithms (McLafferty, Williamson, & McGuire, 2000), and Local Indica-tors of Spatial Association (LISA) such as Getis and Ord Gi and Moran Local I(Mencken & Barnett, 1999; Messner et al., 1999). The limitation with these techniquesis that they are generally applied to administrative areal units such as block groups,police divisional boundaries or census tracts. Spatial analysis of crime when aggregatedto administrative units runs the risk of falling foul of the Modifiable Areal Unit Prob-lem (MAUP). The MAUP occurs when the result of an analysis changes when thespatial arrangement of the study units is varied (Bailey & Gatrell, 1995; Openshaw,1984; Unwin, 1996). In other words, an analysis of crime hotspots may look differentif the crimes are aggregated to police beats or to census tracts. Some spatial analyses ofcrime hotspots use an underlying social phenomenon with which to calculate a rate ofcrime, and this necessitates the use of administrative boundary units, such as censustracts or police beats. However, some researchers have also recognized that a simplespatial concentration of crime can also be valuable. For example, although it might beinteresting to count the robbery rate per 1,000 residents in an area, this does notprovide much information for the commander of a city centre police station. The lackof a residential population in the central business district of most cities negates thevalue of a rate per 1,000 residents. The operational commander in this situation istherefore simply interested in the resource allocation issue and wants to know where tofind the greatest concentration of robberies. Police need does not necessarily coincidewith that of the researcher, and a simple map of hotspots can have great operationalpolicing benefit.
Policing adoption of computer mapping processes has been swift in comparison toIT uptake in other areas (Weisburd, 2001), and mapping crime hotspots has beenapplied to general crime analysis (Canter, 1998; Harries, 1999; LaVigne & Wartell,1998; Rich, 1995, 2001), vehicle crime analysis (Ratcliffe & McCullagh, 1998a; Rengert,1997), serial crime investigations (Cook, 1998; Hubbs, 1998; Rossmo, 1995), and gangactivity (Kennedy, Braga, & Piehl, 1998). One of the more well-known techniques fordetermining a crime hotspot has been a computer program for analysing the Spatialand Temporal Analysis of Crime (STAC). STAC analyses point data-sets to determineareas of higher intensity. These are displayed for output as standard deviational ellipses(Harries, 1999; ICJIA, 1996). Although the limitation of output as standard deviationalellipses and the rather arbitrary selection of program parameters have come in for somecriticism (Bowers & Hirschfield, 1999; Craglia, Haining, & Wiles, 2000; Ratcliffe,2002b) the program has been utilized by a number of law enforcement agencies in theUSA, attracted by the ability to determine specific hotspot areas, albeit elliptical ones.

8
Jerry H. Ratcliffe
A number of other programs are available which will not dictate a specific shape butwill produce a hotspot surface map, rather similar to a temperature map one might seeon the evening weather report (McLafferty et al., 2000). These surface maps actuallyshow a kernel density surface map of crime intensity, by dividing the map into a finegrid and calculating a value for each grid cell based on an intensity value calculatedfrom the number and proximity of crime points in the surrounding area. These mapsare advantageous because the flow of hotspots mimics the underlying crime patternsand often follows urban geographic features that are known to police officers and otherusers. Only a few attempts have been made to establish a methodology that enablesusers to determine a statistically significant hotspot that does not conform to a prede-termined shape, but that more closely matches the shape of the underlying crimehotspot. Both of the following groups applied LISA statistics to an existing grid pattern.Chakravorty (1995) used local Moran I on grid cells of crime in Philadelphia, findingthe technique worked in general, but not so well on his example data. Ratcliffe andMcCullagh (1999) used Getis and Ord statistics on crime patterns in Nottingham (UK)and established some basic parameters for determination of statistically significanthotspot regions. Although this appears to be more applicable, the technique stillrequires custom-written software and an appreciation for the influence of differentparameters on the analytical outcome.
While there are therefore a number of methods for the determination of crimehotspots, each have their strengths and weaknesses. Location quotients require arbi-trary administrative units and are susceptible to the MAUP, but are also easy to calcu-late and map. STAC ellipses are tied to one type of shaped output, yet have theadvantage of showing definitive hotspot regions. Surface maps are fairly easy to createand interpret, but show a gradual change from a hotspot area to a less dense crime areawith no indication of cut-off points, and while the use of LISA statistics with grid mapsgets around most of these problems by creating fine grid maps with definitive regionsthat are statistically sound, they are difficult to create. It is clear from this that a consid-erable research effort has gone into the detection of spatial clusters of crime, but whatabout temporal factors?
Temporal Hotspot Identification Processes
While considerable research effort has been expended in the search for statistically deter-mined spatial hotspots, much less effort has gone into the temporal dynamics of localcrime patterns. Some work has examined crime changes over lengthy periods of time,either to examine seasonality (Block, 1984) or to look at long-term changes (Cohen &Felson, 1979; LeBeau, 1992), while others have examined the influence of days or weekson the risk of repeat victimization (the significant bibliography includes Anderson,Chenery, & Pease, 1995; Bowers, Hirschfield, & Johnson, 1998; Farrell & Pease, 1993;Johnson, Bowers, & Hirschfield, 1997; Polvi, Looman, Humphries, & Pease, 1991;Ratcliffe & McCullagh, 1998b; Robinson, 1998). Few studies have looked at the changingvictimization throughout the day, with the work of George Rengert being a notableexception (Rengert, 1997). The main sticking point appears to be the lack of detail in

Police Practice and Research: An International Journal
9
many police crime databases, the source of much of the raw data for crime studies. Giventhat police are rarely in attendance when a property crime occurs, the police are left torecord a start (or ‘from’) time and an end (or ‘to’) time for an offence, being the timeswhen the victim last saw the property and when they returned to find it stolen. Whilecrime analysts have been aware of a method of weighting a crime event based on the‘start’ and ‘end’ time to determine a possible time of offence (Gottlieb et al., 1998), Ratc-liffe and McCullagh (1998a) initially proposed the development of temporal weightingto include the spatial component, an idea further refined for analytical and mappingpurposes and referred to as ‘aoristic analysis’ (Ratcliffe, 2000, 2002a).
The basic premise of the method is that if a time of an event is not known, then thestart and end time can be used to estimate a probability matrix for each crime event foreach hour of the day. The start and end time of crime events are extracted and the prob-ability of the event happening in each hour (or whatever time period the user wishes)is determined. So, for example, if a victim parked their car at 10 a.m. and returned at 1p.m. to find it missing, the ‘time span’ of the theft is three hours. Each of the hourblocks is allocated 0.33 (one crime event divided by the time span). This event iscombined with others to determine the ‘aoristic signature’ for vehicle theft in the studyregion. This process is explained in greater depth in Ratcliffe (2002a), and shown inFigure 1 where the first crime is the example event here.Aoristic Temporal Analysis Method. In the Top Part of the Figure, Five Horizontal Bars Indicate Five Vehicle Thefts (a–e) where the Time of the Offence is Unknown, Running Across a Timeline that Runs from Left to Right Covering the Period 10 a.m. to 2 p.m., Split into Hour Blocks. In Offence (a) the Owner of the Car Last Saw the Vehicle when it was Parked at 10 a.m. and the Theft was Discovered when the Victim Returned to the CarPark at 1 p.m. This Offence has a Time Span of Three Hours, so Each Hour Block of the Offence is Allocated 1/3 = 0.33. Offence (b) was Known to Happen between 11 a.m. and Noon, so this Hour Block is Allocated the Full Value of the Crime = 1.0, and So On. The Lower Half of the Diagram Shows the Graph of the Summed Values for all Crimes. For Example, the 0.91 for Offences between 10 a.m. and 11 a.m. is Constructed from 0.33 fromCrime (a), 0.25 from Crime (c), and 0.33 from Crime (e). This Represents the Probabilistic Amount of Vehicle Crime that Could be Attributed to this Time Period.
Figure 1 shows that crime events with a shorter time span are able to influence thefinal outcome more than crimes with longer time spans, as it is easier to determine the
Figure 1 Aoristic Temporal Analysis Method. In the top part of the figure, five horizontal bars indicate five vehiclethefts (a–e) where the time of the offence is unknown, running across a timeline that runs from left to right cover-ing the period 10 a.m. to 2 p.m., split into hour blocks. In offence (a) the owner of the car last saw the vehicle whenit was parked at 10 a.m. and the theft was discovered when the victim returned to the car park at 1 p.m. This offencehas a time span of three hours, so each hour block of the offence is allocated 1/3 = 0.33. Offence (b) was known tohappen between 11 a.m. and noon, so this hour block is allocated the full value of the crime = 1.0, and so on. Thelower half of the diagram shows the graph of the summed values for all crimes. For example, the 0.91 for offencesbetween 10 a.m. and 11 a.m. is constructed from 0.33 from crime (a), 0.25 from crime (c), and 0.33 from crime(e). This represents the probabilistic amount of vehicle crime that could be attributed to this time period.

10
Jerry H. Ratcliffe
possible time of the offence. The shorter time span events have a higher weighting asthe numerator for any weighting is the number of crime events (on an individual basisalways one) and the denominator is the time span. If the time span is short then theweighting component for each hour in the analysis will be correspondingly higher. Anevent of known time of occurrence will have a value of one. Aoristic analysis enablesthe user to determine a temporal pattern for a crime hotspot (or any study region)based on an objective analysis of the data, where crimes with a known time of occur-rence will have greater influence over the final shape of the graph.
Aoristic analysis lends itself to policing strategies, as crime hotspots are areas ofsignificant policing concern, yet policing tactics must also reflect the realities of polic-ing within a budget. Aoristic analysis allows operational managers the opportunity todetermine the best times for patrols for high volume crime problem areas (Ratcliffe,2002a). Aoristic analysis also enables the broad categorization of high volume crimehotspots based on temporal characteristics, as will be seen in the next section.
The Hotspot Matrix
The combination of spatial and temporal techniques allows us the possibility of estab-lishing a typology of spatio-temporal characteristics of hotspots, as the spatial featuresof the crime patterns within the hotspot can be established, and each crime hotspot canbe queried to determine its ‘aoristic signature’ (Ratcliffe, 2002a). While there are theo-retically infinite spatial arrangements of crime events within a crime hotspot, analyticalwork in this area over the last few years has established three broad categories of within-hotspots spatial patterns. Similarly, there are considerable variations in the temporalpatterns that could occur in a given region. This paper proposes three broad categoriesof temporal pattern. We start with spatial events.
Dispersed
This is a type of crime hotspot where the points that generate the hotspot are spreadthroughout the hotspot area. They are still more concentrated than in other areas of thestudy (or else they would not be a hotspot) but do not cluster or congregate in anyparticular part of the hotspot region. An example might be a housing estate whereburglary events are spread throughout the estate, due to poor design of the properties.The events within the hotspot do not cluster as each property is as vulnerable as thenext.
Clustered
This is a type of hotspot where the events that make the hotspot tend to cluster at oneor more particular areas within the hotspot region. An example of this might be ahotspot region that includes a sports stadium. While the stadium may be the focus of anumber of vehicle crimes, it does not preclude the possibility that other areas in thevicinity are also victimized by auto crime.

Police Practice and Research: An International Journal
11
Hotpoint
This is a particular type of crime hotspot generated by one single criminogenic feature.This feature would no doubt be considered a crime attractor or generator (Branting-ham & Brantingham, 1995a). An example of this might be a shopping centre car parkin the middle of a busy city. All of the available cars for vehicle crime are concentratedin the shopping centre car park, making all of the crime events that generate thathotspot occur in one place. This differs from the clustered hotspot in that clusteredevents still have a high concentration in one or more areas, but can also have numerouscrime events happen elsewhere in the hotspot.
Examples of these spatial patterns can be seen in Figure 2. In each of the three imagesa single hotspot shape is shown with 12 crime events within the hotspot. In the first two,all 12 points are visible and are respectively dispersed and clustered. Some readers willnote that this terminology springs from terms used to describe nearest neighbour anal-ysis, and there are some similarities. It should be pointed out however that dispersed interms of a hotspot indicates the points are dispersed within the hotspot, and are stillhighly concentrated with regard to the rest of the study area (otherwise there would beno hotspot). In the third image (C) the shape of the hotspot more reflects the fact thatall 12 points are co-located at the same site within the hotspot. In these circumstances,the hotspots tend to be circular in shape.Three Types of Spatial Hotspot: Dispersed (A), Clustered (B), and Hotpoint (C). Each Image Shows 12 Crime Points Located within a Hotspot. In (A) the Points are Dispersed Throughout the Hotspot. In (B) there are Points Throughout the Hotspot but there is Clear Evidence of Clustering at One Point in the Top Left of the Hotspot. In (C), all 12 Points are Co-located at the Same Point in the Centre of a Circular Hotspot.
Temporal events can be broadly distinguished in three ways.
Diffused
These are crime hotspots where the crime events could happen at any time over the24-hour period of a day, or because the time span of events is so large that it is notpossible to determine any significant peaks of activity. This does not preclude thediffused hotspot from having some peaks and troughs, but it does mean that none aresignificant enough to be considered useful from a crime prevention perspective.
Figure 2 Three Types of Spatial Hotspot: Dispersed (A), Clustered (B), and Hotpoint (C). Each image shows 12crime points located within a hotspot. In (A) the points are dispersed throughout the hotspot. In (B) there arepoints throughout the hotspot but there is clear evidence of clustering at one point in the top left of the hotspot.In (C), all 12 points are co-located at the same point in the centre of a circular hotspot.

12
Jerry H. Ratcliffe
Focused
This type of crime hotspot may have crime happen throughout the day, but there aretimes when there is significantly more activity than at other times. The determinationof significance may be statistical, or may be judged on its value from a crime reductionperspective. In other words, a police inspector, examining the aoristic signature of acrime pattern, may determine that the peak over a three-hour period is strong enoughto warrant the deployment of extra officers at that time.
Acute
This is a rare group of hotspots where the temporal activity is confined to a smallperiod of time, or where the aoristic signature almost negates the possibility of criminalactivity at some time periods. This does not mean that some events cannot occur inother periods, except that unlike the focused hotspot, there are few events happeningoutside the acute time.
These types of temporal hotspot are shown in Figure 3 where vertical bars indicatethe level of risk for each hour of the day, running from midnight through to midnightagain. In the first, there is a general level of crime risk throughout the day and night,suggesting a diffused temporal hotspot. In the second, although there is a general risk,there is also a period of heightened risk focused during the evening, suggesting afocused temporal hotspot. Finally in the last image (C) the risk is concentrated in theperiod of early evening, suggesting an acute temporal hotspot.Three Temporal Hotspot Categories. In Each Figure, the Probabilistically Weighted Offence Times are Shown as Vertical Bars. Each Bar Represents One Hour, Running Left to Right from 00:00–00:59 to 23:00–23:59 Hours, or More Simply, Hourly from Midnight to Midnight. The Three Temporal Hotspot Types are Diffused (A), Focused (B), and Acute (C). In (A) it can be Seen that while the Risk of Crime Rises and Falls there is a GeneralRisk Throughout the Hours of the Day and Night. In (B), Although there is a General Level of Risk, there is also a Period in the Evening of Significantly Higher Crime Risk. In (C) it Can be Seen that the Risk of Crime is Most Acute in the Early Evening Only.
Examples of Hotspot Types
To demonstrate some of the hotspot types suggested here, the following section showstwo example crime hotspots using real data. It should be noted that this paper describesspatio-temporal crime hotspots by describing the temporal component first, followed
Figure 3 Three Temporal Hotspot Categories. In each figure, the probabilistically weighted offence times areshown as vertical bars. Each bar represents one hour, running left to right from 00:00–00:59 to 23:00–23:59hours, or more simply, hourly from midnight to midnight. The three temporal hotspot types are diffused (A),focused (B), and acute (C). In (A) it can be seen that while the risk of crime rises and falls there is a general riskthroughout the hours of the day and night. In (B), although there is a general level of risk, there is also a periodin the evening of significantly higher crime risk. In (C) it can be seen that the risk of crime is most acute in theearly evening only.

Police Practice and Research: An International Journal
13
by the spatial component. Figure 4 shows one burglary hotspot from an analysis of allburglaries at shops in the city of Canberra, Australia for 1999 and 2000. This analysisgenerated a number of statistically significant hotspots, one of which was located in thecommercial area of Fyshwick in the south-east of the city. The hotspot is shown, alongwith the 197 crime events that make up the crime hotspot. The regular sides of thehotspot are a function of the grid cell size used to determine the hotspot area. Furtherdetails of the technique can be found in Ratcliffe and McCullagh (1999). Due to repeatvictimization at a number of locations, the sizes of the grey points (used to indicate thelevel of repeat victimization) varies. It can be seen that although there are a few loca-tions that were targeted more than others, there is a spread of targeted propertiesthroughout the hotspot. This suggests a spatially dispersed range of events within thehotspot. The chart of incidence by time of the day below the map shows that there islittle activity during the day. From midnight, the first vertical bar, there is a high levelof activity that reduces rapidly by the time the shops open, then returns to higher valuesagain after closing time and into the evening. This suggests a temporally focused crimehotspot. This hotspot is therefore best described as a focused, dispersed hotspot.A Focused, Dispersed Hotspot of Burglaries and Attempted Burglaries at Shops in the Fyshwick Area of Canberra, Australia during 1999 and 2000. The Map Shows the Locations of Properties Affected over a Two-year Period. Repeat Incidents are Indicated by Larger Symbol Sizes. The Chart Shows the Aoristic Signature of the Events in Fyshwick, Suggesting a Strong Focus for Overnight Offences with Little Burglary Activity during the Day.
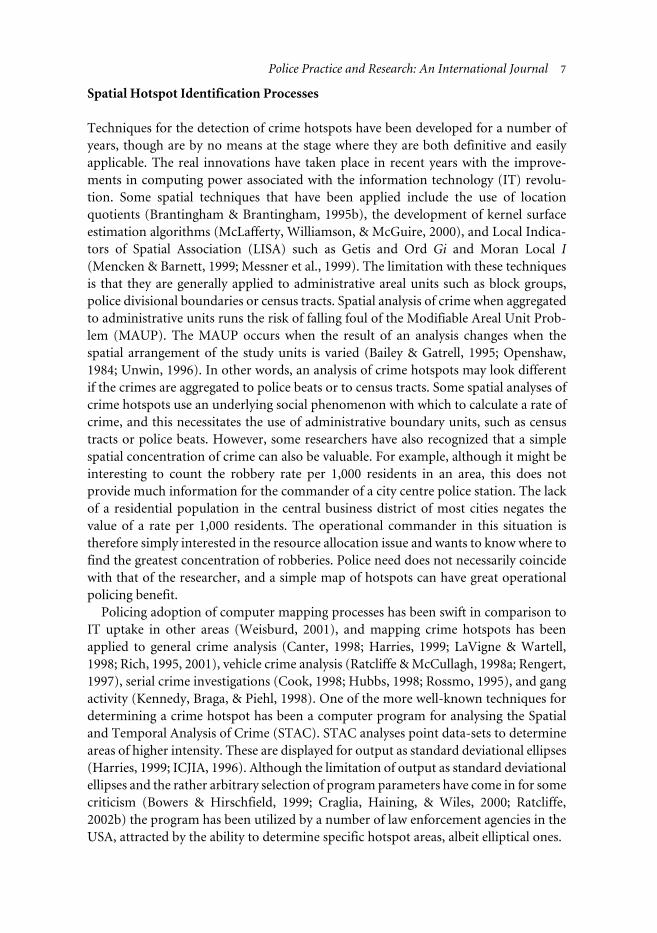
The second map and graph show a different type of hotspot (Figure 5). The patternof thefts from motor vehicles in the Eastern Beaches area of Sydney, Australia alsoproduced a number of statistically significant hotspots, and one of these was in the carpark of the East Gardens shopping centre. This hotspot, shown in Figure 5, does havea couple of other crime points nearby, however, the hotspot is dominated by the shop-ping centre car park. This suggests a hotpoint type spatial pattern. The temporal patternof activity for the offences at the car park is shown in the graph below the map. Thisaoristic analysis shows that there is an acute period of five to six hours where most ofthe activity takes place. It could be argued that this could also represent a focus typetemporal hotspot, however, the lack of crime during other times suggests that this is anacute pattern. Had there been a significant degree of crime during other times, with astrong peak in the afternoon, then a focus type temporal hotspot might have beenappropriate. This hotspot is therefore best described as an acute, hotpoint hotspot.An Acute, Hotpoint Hotspot of Thefts from Vehicles at a Shopping Centre in the Eastern Beaches of Sydney, Australia. Data Drawn from Two Three-month Periods (April–June and October–December 1998). The Hotspot is Dominated Spatially by the Shopping Centre, and Although there are a Couple of Other Points, the Central Shopping Centre is the Single Most Important Area, Suggesting a Hotpoint. The Temporal Pattern in the GraphBelow the Map Shows that there is a Significant Block of Six Hours where the Vast Majority of Incidents Occur. Although it Could be Argued that this Could be Interpreted as a Focus, there is Negligible Activity Outside this Period, More Suggestive of an Acute Temporal Hotspot.
These real examples demonstrate two types of hotspot found in the matrix, and indi-vidually show two of the three types of spatial and temporal hotspot. The paper nowgoes on to discuss practical applications of the hotspot matrix.
Application of a Hotspot Matrix
Where is the value in such classification systems as the hotspot matrix? Simple typolo-gies have an advantage in the area of crime reduction where practitioners do not havethe training opportunities that are afforded academic researchers with time on theirhands. For example, a simple typology of hotspots can be created alongside a list ofpossible remedies. This may be easier to teach a police crime analyst as a limited set ofsystems, rather than attempt to communicate the complexity of environmental theoryand the whole gamut of prevention literature and publications such as the extensive‘What works?’ report from the National Institute of Justice (Sherman et al., 1998).While this paper does not claim that every possible hotspot structure can be easily

14
Jerry H. Ratcliffe
Figure 4 A focused, dispersed hotspot of burglaries and attempted burglaries at shops in the Fyshwick area ofCanberra, Australia during 1999 and 2000. The map shows the locations of properties affected over a two-yearperiod. Repeat incidents are indicated by larger symbol sizes. The chart shows the aoristic signature of the eventsin Fyshwick, suggesting a strong focus for overnight offences with little burglary activity during the day.
Police Practice and Research: An International Journal
15
Figure 5 An acute, hotpoint hotspot of thefts from vehicles at a shopping centre in the eastern beaches of Sydney,Australia. Data drawn from two three-month periods (April–June and October–December 1998). The hotspot isdominated spatially by the shopping centre, and although there are a couple of other points, the central shoppingcentre is the single most important area, suggesting a hotpoint. The temporal pattern in the graph below the mapshows that there is a significant block of six hours where the vast majority of incidents occur. Although it could beargued that this could be interpreted as a focus, there is negligible activity outside this period, more suggestive ofan acute temporal hotspot.

16
Jerry H. Ratcliffe
contained within three spatial and three temporal patterns, there is value in advancinga simple hotspot typology so that in the future researchers and practitioners can discusspractical crime reduction with regard to a specific, commonly agreed view of hotspots.Once an established set of hotspot typologies can be communicated, it allows practitio-ners the advantage of being able to evaluate specific crime prevention strategies withregard to different types of hotspot. The following section explores how one suchhotspot matrix might operate.
Policing Solution Hotspot Matrix
The development of crime reduction partnerships in the UK, formed as a result of the1998 Crime and Disorder Act (Bowers, Jennings, & Hirschfield, 2002; Hough & Tilley,1998), suggests that there is a realization that law enforcement is unable to combat theproblem of crime on its own. While there is a consciousness that policing does notaddress the root causes of crime, there is also an understanding that certain policingtactics can influence the short-term patterns of crime. Indeed, the use of local commu-nity partnerships can take some time to coordinate and organize, and some lawenforcement tactics can be implemented at short notice to fill the gap. These includecrackdowns (Sherman, 1990), intelligence-led operations (Ratcliffe, 2001), and prob-lem-oriented policing (Goldstein, 1990; Leigh, Read, & Tilley, 1996). These strategiesare part of a whole toolbox of possible tactics that an operational commander canemploy, including flooding an area with uniform patrols, deploying surveillance units,using car patrols, and in some countries deterring offenders by setting up randombreath tests in high crime areas. Some of these tactics are geared more towards crimeprevention, while others (such as the use of surveillance units) have a crime detectionfocus. All of these tactics have an associated outlay, and the job of the operationalcommander is to balance the potential results with the specific costs that will beincurred. Successful tactics can be shared so that particular types of hotspot can betackled with strategies that have been successfully employed elsewhere. Alternativelypolice commanders can try a number of tactics and establish for themselves what workswith a particular hotspot type.
Figure 6 shows one potential hotspot matrix that could be created for a solution tothe different types of hotspot explained earlier. The solutions in Figure 6 could, forexample, be applied to a crime hotspot on a problem housing estate.1 Choice of appro-priate measures would clearly be a decision for operational commanders based on avariety of factors, including availability of units, cost and likelihood of success. It canbe seen from Figure 6 that there is a shift in tactics as the hotspots become more tempo-rally and spatially concentrated, the shift moving from visible uniform patrols and highvisibility tactics such as roadblocks and breath testing, to tactics more likely to result inarrests, including surveillance units and unmarked patrols. This can be described as amore general shift in focus from prevention to detection. These are just some sugges-tions for policing strategy, where the police have an option to choose between preven-tion and more aggressive measures.

Police Practice and Research: An International Journal
17
An Example Hotspot Matrix for a Housing Estate (Possible Strategies Indicated are Examples Only and are not Indicative of Strategies Evaluated for these Types of Spatio-temporal Hotspot).
The hotspot matrix also considers longer term strategies that could be put into placein conjunction with short-term police operations. A number of police agencies havebeen experimenting for many years with the inclusion of a crime prevention officer aspart of their sworn staff, and in some UK police services the crime prevention officerhas been an established figure for many years. Again, cost and likelihood of successcome into the decision-making process of the crime prevention officer. The hotspotmatrix will look the same in shape and composition, but the range of options for acrime prevention officer may be different. Longer-term options may include closed
Figure 6 An example hotspot matrix for a housing estate (possible strategies indicated are examples only and arenot indicative of strategies evaluated for these types of spatio-temporal hotspot).

18
Jerry H. Ratcliffe
circuit television (CCTV) systems, increased guards, improved lighting and architec-tural changes to enable better natural surveillance of the housing estate. Again, deci-sions regarding cost may be made in the light of the spatial and temporal signature ofthe hotspot problem. For example, it might be prohibitively expensive to install CCTVthroughout the estate, negating the use of CCTV for a temporally ‘diffused’ andspatially ‘dispersed’ hotspot. CCTV may, however, be an option to prevent problems ata key location where introduction of one CCTV camera may not be beyond the avail-able budget. CCTV therefore becomes a possibly viable option for an ‘acute hotpoint’hotspot.
Discussion
For many readers, the introduction of the temporal component will be the new featureof the paper, as many readers will be familiar with the various techniques for establish-ing spatial hotspot areas. This paper has not sought to provide detailed explanations ofthe spatial hotspot techniques as these methods are more thoroughly explainedelsewhere, and references are indicated earlier in this paper for further reading. Thetemporal component has received less research attention yet is arguably of equal valueto an operational police commander or crime prevention officer. For the policecommander, a significant resource that he or she will have is personnel, but personnelcost money. This cost is both a factor of extra officers and extra patrol time. Under-standing the spatial dynamics of hotspots enables a commander to limit the spatial areaof patrol, reducing the number of officers. Greater understanding of the temporaldynamics of hotspots will enable the commander to limit the time costs of extra patrols,if patrols are the chosen crime reduction method. Most usefully, the aoristic analysismethod for temporal analysis referred to in this paper, is not required for all crimetypes. Victims of assault generally know when they were assaulted and police “start’ and‘end’ times tend to be the same. It would appear, from statistical tests shown in Ratcliffe(2002a), that the aoristic method is only required for high volume property offencessuch as burglary and vehicle crime, while assault and robbery can be easily calculatedsimply from the time of offence.
Categorization of crime hotspots, both spatially and temporally, will to some degreebe a subjective decision. It may be argued that a significant distinction may existbetween a focused and an acute temporal hotspot, but it is recognized that a degree ofsubjectivity may creep into this type of analysis. The main point, however, is that theaim of this work is to enable operational police officers to include spatial and temporalfactors in their thinking. Although there may be some disagreement between officers asto the exact nature of a crime hotspot, chances are that the discussion will still generatepositive thinking about the best operational tactic to employ to combat the particularhotspot problem. Within the framework of SARA (Eck & Spelman, 1987; Greene,2000), the hotspot matrix may be useful, resulting from the SARA analysis stage, as amethod of determining the most appropriate response.
This has been a first attempt to describe a typology of crime hotspots in a spatio-temporal manner. It is possible that some types of hotspot, such as an acute, dispersed

Police Practice and Research: An International Journal
19
hotspot are quite rare. It may also be the case that later work by other researchers mayreveal different types of hotspot by adding to (or removing) either the spatial or thetemporal typologies. It is recognized that this is a first step toward a broader descriptivecapacity for crime hotspots.
Although there is the option of adding hotspot typologies and increasing the defini-tions, the main aim of this paper is to describe hotspots in a practical way so that prac-titioners such as crime analysts, police managers, and crime prevention practitionerscan discuss and evaluate crime reduction strategies that are targeted to the spatial andtemporal characteristics of the problem. It would be possible to describe a wholemyriad of crime hotspot shapes and patterns, but significant additions to the relativelysimple typology presented here may prove counter-productive to the aim of a simpletool for collaboration and crime reduction. Academia does sometimes struggle toconvey its message to practitioners, and this paper attempts to reduce the complexityof space-time high-volume crime interactions to a practical level.
Finally, the choice of strategies proposed in the matrices are merely shown as exam-ples, and empirical evaluation of strategies that have been employed in the past is likelyto yield a more beneficial list of options. The move in Figure 6 from prevention todetection is likely to remain in most policing matrices, given the higher costs in main-taining surveillance of plain clothes units in large areas over long time periods. Thereare some strategies mentioned, such as roadblocks and random breath tests, that arenot available or legal in some places. The onus is therefore on the practitioner readingthis to replace the tactics with more acceptable local strategies.
Conclusion
Any discussion of crime hotspots is of clear interest to police managers, interested asthey are in devising suitable strategies for crime reduction in high crime areas. As the‘gatekeepers’ (Ericson & Haggerty, 1997) to most crime knowledge for the rest of thecriminal justice system, they are both at the forefront of providing pertinent infor-mation to other agencies in a digestible form, as well as being required to formulateoperational policy to combat crime hotspots themselves. Up until this point nearly alldiscussions of crime hotspots have focused entirely on spatial characteristics.However the introduction of a methodology for examining the temporal characteris-tics allows us to see a different dimension to the composition of hotspots, and thisadditional feature has clear benefits for policing strategy.
Resources are usually required to combat a crime problem, and resources incur acost. Law enforcement managers may wish to identify the temporal patterns of crimehotspots as well as the spatial patterns in order to utilize their resources at the mostappropriate times, getting the best ‘bang’ for their ‘buck.’ After all, there is little valuein having night-duty officers perform high visibility patrols on overtime in a crimehotspot if the temporal pattern suggests that the middle of the day is the highest crimetime. In times of fiscal constraint where police are being asked to do more with thesame, or fewer, resources (Ratcliffe, 2001), justifying a policing strategy based on objec-tive analysis of spatial and temporal characteristics of high crime areas is an attractive

20
Jerry H. Ratcliffe
option. While the choice of an appropriate strategy is more subjective at present, overtime there will grow a bank of knowledge regarding the most appropriate strategy fordifferent scenarios within the hotspot matrix and this will similarly provide the objec-tive ammunition for operational police commanders to combat the holders of thedepartmental purse strings. Well-considered crime reduction policy, based on anobjective assessment of crime hotspots combined with an objective choice of crimereduction strategy, is a difficult thing to argue against.
Notes1.[1] It should be stressed that the strategies that populate the example matrix here are examples
only, and do not necessarily represent empirically evaluated crime reduction tactics.
References
AFP [Australian Federal Police]. (2001) Anchorage: An excellent example of intelligence-led policing,592/2001 Australian Federal Police ACT Policing media release, Canberra.
Anderson, D., Chenery, S. and Pease, K. (1995) Biting back: Tackling repeat burglary and car crime.,Police Research Group: Crime Detection and Prevention Series, Paper 58, 1–57.
Andrews, P. P. and Peterson, M. B. (1990) Criminal intelligence analysis. Loomis, CA: PalmerEnterprises.
Audit Commission (1993) Helping with enquiries: Tackling crime effectively. London: HMSO.Bailey, T. C. and Gatrell, A. C. (1995) Interactive spatial data analysis. London: Longman.Block, C. R. (1984) Is crime seasonal? Chicago: Illinois Criminal Justice Information Authority.Bottoms, A. E. and Wiles, P. (2002) Environmental criminology. In M. Maguire, R. Morgan, & R.
Reiner (Eds.), The Oxford handbook of criminology. London: Oxford University Press.Bowers, K. J. and Hirschfield, A. (1999) Exploring the link between crime and disadvantage in north-
west England: An analysis using geographical information systems, International Journal ofGeographical Information Science, 13(2), 159–184.
Bowers, K. J., Hirschfield, A. and Johnson, S. D. (1998) Victimization revisited, British Journal ofCriminology, 38(3), 429–452.
Bowers, K. J., Jennings, J. and Hirschfield, A. (2002) The Crime and Disorder Audit process: A post-mortem on the first round, Crime Prevention and Community Safety, 4(2), 19–32.
Brantingham, P. L. and Brantingham, P. J. (1981) Environmental criminology. Prospect Heights, IL:Waveland Press.
Brantingham, P. L. and Brantingham, P. J. (1990) Situational crime prevention in practice., Cana-dian Journal of Criminology, 32(1), 17–40.
Brantingham, P. L. and Brantingham, P. J. (1995a) Criminality of place: Crime generators and crimeattractors, European Journal of Criminal Policy and Research, 3(3), 5–26.
Brantingham, P. L. and Brantingham, P. J. (1995b) Location quotients and crime hotspots in thecity. In C. Block, M. Dabdoub, & S. Fregly (Eds.), Crime analysis through computer mapping.Washington, DC: Police Executive Research Forum.
Canter, P. R. (1998) Geographical information systems and crime analysis in Baltimore County,Maryland. In D. Weisburd & T. McEwen (Eds.), Crime mapping and crime prevention(pp. 158–190). Monsey, NY: Criminal Justice Press.
Carter, D. L. (1990) Law enforcement intelligence operations: An overview of concepts, issues and terms.Washington, DC: National Institute of Justice.
Chakravorty, S. (1995) Identifying crime clusters: The spatial principles, Middle States Geographer,28, 53–58.

Police Practice and Research: An International Journal
21
CJC [Criminal Justice Commission] (1996) Intelligence at work inside the CJC., Criminal JusticeCommission Issue Paper Series,, 3(1), 12.
Clarke, R. V. (1992) Situational crime prevention: Successful case studies. Albany, NY: Harrow &Heston.
Cohen, L. E. and Felson, M. (1979) Social change and crime rate trends: A routine activity approach,American Sociological Review, 44, 588–608.
Cook, P. (1998) Mapping a murderer’s path. In N. LaVigne and J. Wartell (Eds.), Crime mappingcase studies: Successes in the field (pp. 123–128). Washington, DC: Police Executive ResearchForum.
Craglia, M., Haining, R. and Wiles, P. (2000) A comparative evaluation of approaches to urbancrime pattern analysis, Urban Studies, 34(4), 711–729.
Eck, J. (1998) Preventing crime at places. Chapter 7, Preventing crime: What works, what doesn’t,what’s promising. Washington, DC: National Institute of Justice.
Eck, J. and Spelman, W. (1987) Problem solving: Problem-oriented policing in Newport News.Washington, DC: Police Executive Research Forum.
Ekblom, P. and Tilley, N. (2000) Going equipped: Criminology, situational crime prevention andthe resourceful offender, British Journal of Criminology, 40(3), 376–398.
Ericson, R. V. and Haggerty, K. D. (1997) Policing the risk society. Oxford: Clarendon Press.Farrell, G. and Pease, K. (1993) Once bitten, twice bitten: Repeat victimisation and its implications
for crime prevention., Police Research Group: Crime Prevention Unit Series, Paper 46.Goldstein, H. (1990) Problem-oriented policing. New York: McGraw-Hill.Gottlieb, S., Arenberg, S. and Singh, R. (1998) Crime analysis: From first report to final arrest.
Montclair: Alpha Publishing.Greene, J. R. (2000) Community policing in America: Changing the nature, structure, and function
of the police. In J. Horney (Ed.), Criminal justice 2000: Policies, processes, and decisions of thecriminal justice system (pp. 299–370). Washington, DC: National Institute of Justice.
Harries, K. (1999) Mapping crime: Principles and practice. Washington, DC: National Institute ofJustice.
Heaton, R. (2000) The prospects for intelligence-led policing: Some historical and quantitativeconsiderations, Policing and Society, 9(4), 337–356.
HMIC [Her Majesty’s Inspectorate of Constabulary] (1997) Policing with intelligence. London: HerMajesty’s Inspectorate of Constabulary.
Hough, M. and Tilley, N. (1998) Auditing crime and disorder: Guidance for local partnerships.,Police Research Group: Crime Detection and Prevention Series, 91.
Hubbs, R. (1998) The Greenway rapist case: Matching repeat offenders with crime locations. In N.LaVigne & J. Wartell (Eds.), Crime mapping case studies: Successes in the field (pp. 93–97).Washington, DC: Police Executive Research Forum.
ICJIA [Illinois Criminal Justice Information Authority] (1996) STAC user manual. Chicago: ICJIA.Jeffery, C. R. and Zahm, D. L. (1993) Crime prevention through environmental design, opportunity
theory, and rational choice models. In R. V. Clarke & M. Felson (Eds.), Routine activity andrational choice (pp. 323–350). New Brunswick, NJ: Transaction Publishers.
Johnson, S. D., Bowers, K. and Hirschfield, A. (1997) New insights into the spatial and temporaldistribution of repeat victimization., British Journal of Criminology, 37(2), 224–241.
Kennedy, D. M., Braga, A. A. and Piehl, A. M. (1998) The (un) known universe: Mapping gangs andgang violence in Boston. In D. Weisburd & T. McEwen (Eds.), Crime mapping and crimeprevention (pp. 219–262). Monsey, NY: Criminal Justice Press.
LaVigne, N. and Wartell, J. (1998) Crime mapping case studies: Successes in the field. Washington, DC:Police Executive Research Forum.
LeBeau, J. L. (1992) Four case studies illustrating the spatial–temporal analysis of serial rapists, PoliceStudies, 15, 124–145.
Leigh, A., Read, T. and Tilley, N. (1996) Problem-oriented policing., Police Research Group: CrimeDetection and Prevention Series, 75.

22
Jerry H. Ratcliffe
Maguire, M. (2000) Policing by risks and targets: Some dimensions and implications of intelligence-led crime control, Policing and Society, 9(4), 315–336.
McLafferty, S., Williamson, D. and McGuire, P. G. (2000) Identifying crime hot spots using kernelsmoothing. In V. Goldsmith; P. G. McGuire; J. H. Mollenkopf, & T. A. Ross (Eds.), Analyzingcrime patterns: Frontiers of practice (pp. 77–85). Thousand Oaks, CA: Sage.
Mencken, F. C. and Barnett, C. (1999) Murder, non-negligent manslaughter and spatial autocorrela-tion in mid-South counties, Journal of Quantitative Criminology, 15(4), 407–422.
Messner, S. F., Anselin, L., Baller, R. D., Hawkins, D. F., Deane, G. and Tolnay, S. E. (1999) Thespatial patterning of county homicide rates: An application of Exploratory Spatial DataAnalysis, Journal of Quantitative Criminology, 15(4), 423–450.
Openshaw, S. (1984) The modifiable areal unit problem., Concepts and Techniques in ModernGeography, 38.
Polvi, N., Looman, T., Humphries, C. and Pease, K. (1991) The time course of repeat burglaryvictimization, British Journal of Criminology, 31(4), 411–414.
Ratcliffe, J. H. (2000) Aoristic analysis: The spatial interpretation of unspecific temporal events,International Journal of Geographical Information Science, 14(7), 669–679.
Ratcliffe, J. H. (2001) Policing urban burglary., Trends and Issues in Crime and Criminal Justice, 213.Ratcliffe, J. H. (2002a) Aoristic signatures and the temporal analysis of high volume crime patterns,
Journal of Quantitative Criminology, 18(1), 23–43.Ratcliffe, J. H. (2002b) Damned if you don’t, damned if you do: Crime mapping and its implications
in the real world, Policing and Society, 12(3), 211–225.Ratcliffe, J. H. (2002c) Intelligence-led policing and the problems of turning rhetoric into practice,
Policing and Society, 12(1), 53–66.Ratcliffe, J. H. and McCullagh, M. J. (1998a) Aoristic crime analysis, International Journal of
Geographical Information Science, 12(7), 751–764.Ratcliffe, J. H. and McCullagh, M. J. (1998b) Identifying repeat victimisation with GIS, British
Journal of Criminology, 38(4), 651–662.Ratcliffe, J. H. and McCullagh, M. J. (1999) Hotbeds of crime and the search for spatial accuracy,
Geographical Systems, 1(4), 385–398.Rengert, G. F. (1996) The geography of illegal drugs. Boulder, CO: Westview Press.Rengert, G. F. (1997) Auto theft in Philadelphia. In R. Homel (Ed.), Policing for prevention: Reducing
crime, public intoxication and injury (pp. 199–219). Monsey, NY: Criminal Justice Press.Rich, T. F. (1995) The use of computerized mapping in crime control and prevention programs.
Washington, DC: National Institute of Justice.Rich, T. F. (2001) Crime mapping and analysis in community organization in Hartford, Connecticut.
Washington, DC: National Institute of Justice.Robinson, M. (1998) Burglary re-victimization—the time period of heightened risk British Journal
of Criminology 38(1), 78–87.Rossmo, D. K. (1995) Place, space, and police investigations: Hunting serial violent criminals. In D.
Weisburd & J. E. Eck (Eds.), Crime and place (pp. 217–235). Monsey, NY: Criminal JusticePress.
Rossmo, D. K. (2000) Geographic profiling. Boca Raton, FL: CRC Press.Seddon, K. and Napper, R. (1999) Integrated crime management model discussion paper.
Unpublished, New South Wales Police Service, Sydney.Sherman, L. W. (1990) Police crackdowns: Initial and residual deterrence. In M. Tonry & N. Morris
(Eds.), Crime and justice: An annual review of research (pp. 1–48). Chicago: University ofChicago Press.
Sherman, L. W., Gottfredson, D., MacKenzie, D., Eck, J., Reuter, P. and Bushway, S. (1998) Prevent-ing crime: What works, what doesn’t, what’s promising. Washington, DC: National Institute ofJustice.
Smith, A. (1997) Intelligence led policing. International Association of Law Enforcement IntelligenceAnalysts, Inc.

Police Practice and Research: An International Journal
23
Unwin, D. J. (1996) GIS, spatial analysis and spatial statistics, Progress in Human Geography, 20(4),540–551.
Weisburd, D. (2001) Translating research into practice: Reflections on the diffusion of innovation incrime mapping., International Crime Mapping Research Conference, Dallas, TX, keynoteseminar, December 2001.
Weisburd, D. and Green, L. (1995) Policing drug hot spots: The Jersey City drug market analysisexperiment, Justice Quarterly, 12, 711–735.