the hongkong and shanghai banking corporation limited€¦ · · 2017-01-02the hongkong and...
TRANSCRIPT

The Hongkong and Shanghai Banking Corporation Limited (Incorporated in Hong Kong SAR with limited liability)
Basel III – Pillar 3 disclosures of India Branches For the period ended 30 June 2016
1
1 Scope of Application
The capital adequacy framework applies to The Hongkong and Shanghai Banking
Corporation Limited – India Branches (‘the Bank’) as per RBI Basel III guidelines. The
Bank has a subsidiary, HSBC Agency (India) Private Limited, which is consolidated in line
with AS 21 and full capital deduction is taken for stand-alone financials. The Bank does not
have any other Group company where a pro-rata consolidation is done or any deduction is
taken. The Bank holds minority interests (2.07% shareholding) in a Group entity HSBC
Professional Services (India) Private Limited which is neither consolidated nor is capital
deducted. The investment in this company is appropriately risk weighted.
(i) Capital in all subsidiaries not included in the consolidation
The aggregate amount of capital held by the Bank in HSBC Agency (India) Private
Limited of Rs. 0.1 million is not included in the consolidation and is deducted from
capital.
(ii) Bank’s total interest in insurance entities
The Bank has no interest in any of the insurance entities of the Group.
(iii) List of Group entities in India not considered for consolidation both under the
accounting and regulatory scope of consolidation : (Rs ‘000)
Name of Entity /Country of
Incorporation
Principle activity of the
entity
Total balance sheet
equity*
Total
balance
sheet assets*
HSBC Asset Management (India)
Private Limited
Asset management/portfolio
management 615,909 964,768
HSBC Electronic Data Processing
India Private Limited
Back office / data processing
/ call centre activities 3,554,678 24,659,528
HSBC Global Shared Services
(India) Private Limited Non-operating company 25,000 47,287
HSBC InvestDirect (India) Limited Holding company for HSBC
InvestDirect Group 712,713 4,908,045
HSBC InvestDirect Employees'
Welfare Trust Non-operating company 15 18,548
HSBC InvestDirect Financial
Services (India) Limited
Non-banking Finance
company 1,462,847 4,289,412
HSBC InvestDirect Sales &
Marketing (India) Limited Non-operating company 1000 36,796
HSBC InvestDirect Securities (India)
Private Limited.
Retail securities broking and
related activities
(Discontinued)
Equity - 875,112
0.001% Compulsory
Convertible Preference
shares - 870,000
198,077
HSBC Professional Services (India)
Private Limited
Providing internal audit
services to Group companies 4,838 168,671
HSBC Securities and Capital
Markets (India) Private Limited
Stock broking and corporate
finance & advisory
Equity - 4,701,139
Preference – 250,000 6,655,670
HSBC Software Development
(India) Private Limited
Software design,
development and
maintenance
327,264 21,578,616

The Hongkong and Shanghai Banking Corporation Limited (Incorporated in Hong Kong SAR with limited liability)
Basel III – Pillar 3 disclosures of India Branches (Continued) For the period ended 30 June 2016
2
Canara HSBC Oriental Bank of
Commerce Life Insurance Company
Limited
Life insurance 9,500,000 103,017,014
* As stated in the accounting balance sheet of the legal entity as at 31 March 2015 Note 1: The Bank does not hold any stake in the total equity of the entities mentioned above with the exception of HSBC Professional Services (India) Private Limited. Note 2: Since the Bank does not hold any stake in the total equity of the entities, the same have not been considered for any regulatory treatment.
2 Capital Adequacy & Structure
a. Capital Adequacy
The Bank’s capital management framework is shaped by its structure, business model and
strategic direction. The Bank carefully assesses its growth opportunities relative to the
capital available to support them, particularly in light of the economic environment and
tightening of regulations around capital requirements. The Bank’s EXCO, Risk
management Meeting and ALCO maintains an active oversight over the Capital and Risk
Management framework.
Under Pillar 1 of the RBI guidelines on Basel III, the Bank currently follows Standardised
Approach for Credit Risk, Standardised Duration Approach for Market Risk and Basic
Indicator Approach for Operational risk capital charge for computation and reporting capital
adequacy locally to RBI. Further, the Bank has a comprehensive Internal Capital Adequacy
Assessment Process (‘ICAAP’), which covers the capital management policy of the Bank,
sets the process for assessment of the adequacy of capital to meet regulatory requirements,
supports current and future activities and meet the Pillar I and material Pillar II risks to
which the bank is exposed to. The ICAAP also involves stress testing of extreme but
plausible scenarios to assess the Bank’s resilience to adverse economic or political
developments and resultant impact on the Bank’s risk profile and capital position for current
and future periods. This ensures that the bank has robust, forward looking capital planning
processes that account for unique and systemic risks. In addition to the above, the Bank is
also subject to Capital Buffers as prescribed by RBI from time to time.
As per the transitional arrangement, at June 30, 2016, the Bank is required to maintain
minimum capital requirement including capital buffers as mentioned below:

The Hongkong and Shanghai Banking Corporation Limited (Incorporated in Hong Kong SAR with limited liability)
Basel III – Pillar 3 disclosures of India Branches (Continued) For the period ended 30 June 2016
3
2 Capital Adequacy & Structure (Continued)
a. Capital Adequacy
Regulatory Minimum in % as per RBI guidelines As at June 2016
Common Equity Tier I (CET1)(i) 5.5%
Capital Conservation Buffer (CCB) (ii) – (Refer note I) 0.625%
Counter-cyclical Buffer (CCCB) (iii) -(Refer note II) NA
Domestically Systemically Important Bank (D-SIB) (iv) (Refer note III) 0.661%
Minimum Common Equity Tier I (i+ii+iii+iv) 6.78%
Minimum Tier I Capital 8.28%
Total Capital Adequacy Ratio 10.28%
Notes:
I. The CCB is designed to ensure that banks build up capital buffers during normal times, which can be drawn down during
a stressed period. Banks in India are required to maintain a capital conservation buffer of 2.5%, comprised of CET1
capital, over and above the regulatory minimum capital requirement. The CCB has been implemented w.e.f 31 March
2016 starting with 0.625% in 2016, increasing in a phased-in manner and reaching 2.5% by March 2019.
II. RBI issued guidelines on CCCB framework for banks in India in February 2015. The CCCB may vary from 0 to 2.5% of
total RWA and the decision would normally be pre-announced with a lead time of 4 quarters. The activation of CCCB
will depend upon Credit to GDP gap in India (difference between Credit to GDP ratio and the long-term trend value of
such ratio of any point in time) along with supplementary indicators such as Credit-Deposit ratio for a moving period of 3
years, industry outlook assessment index and interest coverage ratio. As stated by RBI in First Bi-monthly Monetary
Policy Statement, 2016-17 issued on 05April2016, a review of CCCB indicators was carried out by the RBI and it has
been decided that it is not necessary to activate CCCB in India at this point in time.
III. The Reserve Bank of India (RBI) released the framework on D-SIB requirements for banks operating in India in July
2014. Banks may become systemically important due to their size, cross-jurisdictional activity, complexity,
interconnectedness and lack of substitutability. As per the RBI guidelines, for a foreign bank having branch presence in
India (such as the Bank) which is classified as Globally Systemically Important Bank (G-SIB) by Financial Stability
Board (FSB), it has to maintain additional CET1 capital surcharge in India as applicable to it as a G-SIB, proportionate to
its Risk Weighted Assets (RWAs) in India. This requirement has been implemented from 31 March 2016 in phased-in
manner, to become fully effective from 31 March 19.
The Bank continues to monitor developments and believe that current robust capital
adequacy position means the bank is well placed for continuing compliance with the Basel
III framework.

The Hongkong and Shanghai Banking Corporation Limited (Incorporated in Hong Kong SAR with limited liability)
Basel III – Pillar 3 disclosures of India Branches (Continued) For the period ended 30 June 2016
4
2 Capital Adequacy & Structure (Continued)
b. Capital Structure
(i) Composition of Tier 1 capital
(Rs ‘000)
At 30 June 2016 At 31 March 2016
Capital 44,991,660 44,991,660
Eligible Reserves 123,423,391 123,423,391
Less: Deductions from Tier I Capital (912,384) (1,021,393)
- Intangible Assets ( Deferred Tax Asset -
DTA)(Note 1)
- -
- Investment in subsidiaries in India (111) (111)
- Debit Value Adjustments (DVA) (912,272) (1,021,282)
- Defined Benefit Pension Fund Asset - -
Tier I Capital
167,502,666
167,393,657
Of Which Common Equity Tier I Capital
167,502,666
167,393,657
Additional Tier I Capital - -
Total Tier I Capital 167,502,666 167,393,657
Note1: As per RBI guidelines as on 01 March 2016, DTA which was deducted from CET1 capital, can be recognised in the
CET1 with a limit of 10% of net CET1 (after deducting DTA). Currently DTA is 4.16% of net CET1 capital. Further, property
revaluation reserve which was included in Tier II Capital is now part of Tier I Capital
(ii) Tier 2 capital
(Rs ‘000)
At 30 June 2016 At 31 March 2016
General Loss Provisions / Other Eligible Reserves
7,541,766 7,438,746
Total Tier II Capital (Note 2)
7,541,766
7,438,746
Note 2: There is no debt capital instrument and subordinated debt outstanding as at 30 June 2016 included in Tier II Capital.
The Hongkong and Shanghai Banking Corporation Limited (Incorporated in Hong Kong SAR with limited liability)
Basel III – Pillar 3 disclosures of India Branches (Continued) For the period ended 30 June 2016
5
2 Capital Adequacy & Structure (Continued)
b. Capital Adequacy (Continued)
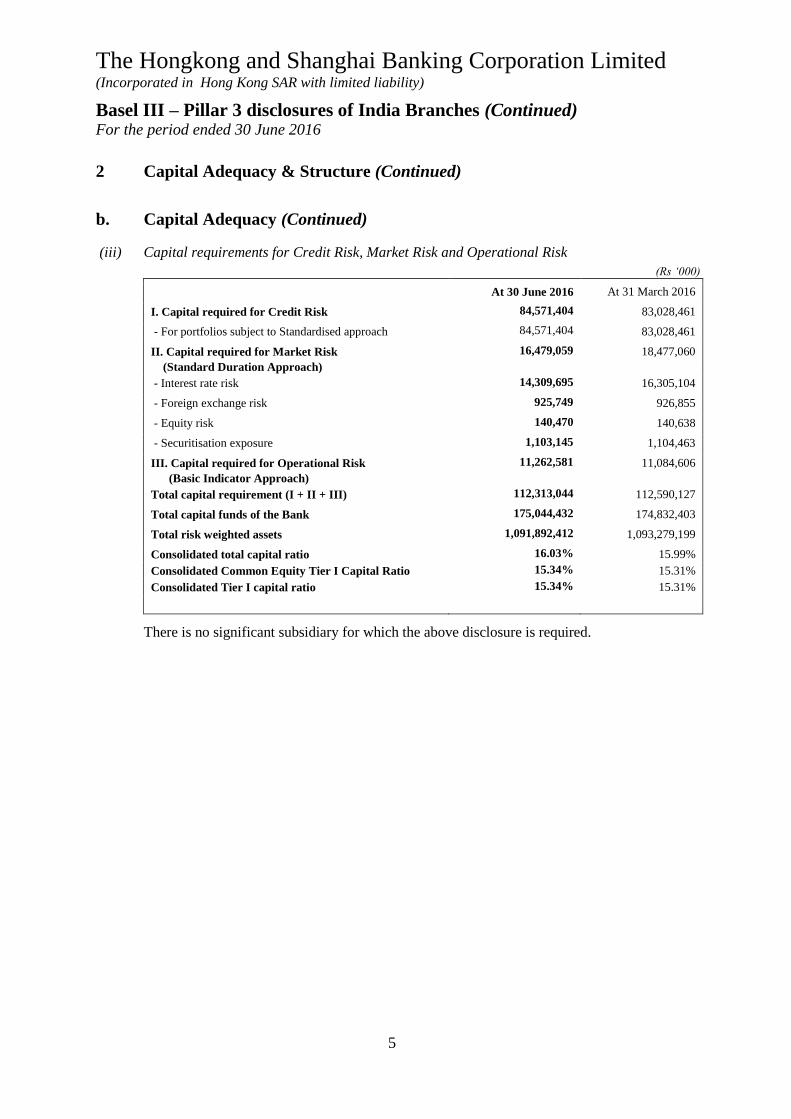
(iii) Capital requirements for Credit Risk, Market Risk and Operational Risk
(Rs ‘000)
At 30 June 2016 At 31 March 2016
I. Capital required for Credit Risk 84,571,404 83,028,461
- For portfolios subject to Standardised approach 84,571,404 83,028,461
II. Capital required for Market Risk
(Standard Duration Approach)
16,479,059 18,477,060
- Interest rate risk 14,309,695 16,305,104
- Foreign exchange risk 925,749 926,855
- Equity risk 140,470 140,638
- Securitisation exposure 1,103,145 1,104,463
III. Capital required for Operational Risk
(Basic Indicator Approach)
11,262,581 11,084,606
Total capital requirement (I + II + III) 112,313,044 112,590,127
Total capital funds of the Bank 175,044,432 174,832,403
Total risk weighted assets 1,091,892,412 1,093,279,199
Consolidated total capital ratio 16.03% 15.99%
Consolidated Common Equity Tier I Capital Ratio 15.34% 15.31%
Consolidated Tier I capital ratio 15.34% 15.31%
There is no significant subsidiary for which the above disclosure is required.

The Hongkong and Shanghai Banking Corporation Limited (Incorporated in Hong Kong SAR with limited liability)
Basel III – Pillar 3 disclosures of India Branches (Continued) For the period ended 30 June 2016
6
3 Credit risk
a. General
Credit Risk is the risk of financial loss if a customer or counterparty fails to meet an
obligation under a contract. It arises principally from direct lending, trade finance, marked-
to-market exposure from derivative contracts and certain off-balance sheet products such as
guarantees and from the Bank’s holdings of assets in the form of debt securities.
The principal objectives of our credit risk management function are:
to maintain a strong culture of responsible lending, and a robust credit risk policy and
control framework;
to both partner and challenge our businesses in defining, implementing and continually
re-evaluating our credit risk appetite under actual and stress scenario conditions; and
to ensure there is independent, expert scrutiny of credit risks, their costs and their
mitigation.
Strategy and Processes
HSBC Holdings plc (HSBC Group Head Office) formulates high-level risk management
policies for the HSBC Group entities worldwide. The Bank has also formulated local credit
guidelines consistent with HSBC policy and RBI guidelines. The Bank’s risk management
policies and procedures are subject to a high degree of oversight and guidance to ensure that
all types of risk are systematically identified, measured, analyzed and actively managed. The
Bank remains a full service bank, servicing all major business groups- Global Banking and
Markets (GBM), Commercial Banking (CMB), Retail Banking and Wealth Management
(RBWM), and Global Private Banking (GPB).
The Bank has standards, policies and procedures dedicated to the sanctioning, monitoring
and management of various risks, which include the following:
The Board of The Hongkong and Shanghai Banking Corporation Limited in Hongkong
SAR (HBAP) has established the India Executive Committee (EXCO) to assist the
Board in the running of the Bank. The EXCO is authorized to exercise all the powers,
authorities and discretions of the HBAP on the management and day to day running of
the Bank, in accordance with the policies and directions set by the Board from time to
time. EXCO approves all the policies including credit policies. A Risk Management
Meeting (RMM) consisting of senior executives, reviews overall portfolio risks and key
risks faced by the bank in India on a monthly basis.
A Wholesale Credit and Market Risk Management (WMR) unit independent of business
with a matrix of delegated approval authorities, undertaking independent reviews and
objective assessment of the credit risk for all customers. The WMR function has the
responsibility of setting and managing strategy, policy, appetite, expectations and
standards for wholesale credit and market risk.

The Hongkong and Shanghai Banking Corporation Limited (Incorporated in Hong Kong SAR with limited liability)
Basel III – Pillar 3 disclosures of India Branches (Continued) For the period ended 30 June 2016
7
3 Credit risk (Continued)
a. General (Continued)
Strategy and Processes (Continued)
The RBWM Risk function is responsible for monitoring the quality of the Retail
Banking and Wealth Management (RBWM) lending portfolio. For retail lending, INM
has developed credit application scorecards, which make use of statistical models &
historical data to scientifically assess the borrowers. This may also be supplemented
with judgmental lending as appropriate. Policy rules are built into the system to enable
online checks. The Bank also deploys other tools like external verifications, negative
customer database search & most importantly credit bureau checks through the Credit
Information Bureau (India) Limited (CIBIL). The judgmental aspect also tries to
identify the financial strength, ability and intentions of borrowers for repayment.
For retail risk, the INM RBWM risk and Acquisition and Account Risk Management
Team reviews and communicates the various internal risk policies. The RRPs (Risk
reward program) defines the product parameters for RBWM.
A robust framework for Risk Appetite Statements (RAS) and Risk Tolerance triggers for
all material risks. The Risk Management committee reviews and regularly monitors the
compliance with RAS. The Bank has stipulated Credit Risk Appetite and tolerance
triggers for asset quality, impairments, risk weighted assets, risk adjusted returns and
concentration risks.
Designing of comprehensive credit risk policies for management of Exposure norms and
Country Risk Plan. These policies delineates the Bank’s risk appetite and maximum
permissible exposures to individual customers, customer groups, industries, sensitive
sectors and other forms of credit risk concentrations.
The bank also has comprehensive policies for valuation, end use monitoring, real estate
exposures, management of intra-group exposures, provisioning, distressed assets and
recovery and sale of NPA.
Sustainability risk policies to ensure sustainable financing in accordance with the group
guidelines.
Stress Testing Policy & Framework for rigorous risk specific and Enterprise-wide stress
testing and reporting.
Managing exposures to debt securities by establishing controls in respect of the liquidity
of securities held for trading and setting issuer limits for financial investments. Separate
portfolio limits are established for asset-backed securities and similar instruments.
Controlling of cross-border exposures to manage country and cross-border risk through
the imposition of country limits with sub-limits by maturity and type of business.

The Hongkong and Shanghai Banking Corporation Limited (Incorporated in Hong Kong SAR with limited liability)
Basel III – Pillar 3 disclosures of India Branches (Continued) For the period ended 30 June 2016
8
3 Credit risk (Continued)
a. General (Continued)
Strategy and Processes (Continued)
Maintaining and developing HSBC’s risk rating framework and systems to classify
exposures meaningfully and facilitate focused management of the risks involved. Rating
methodologies are based upon a wide range of financial analytics together with market
data-based tools, which are core inputs to the assessment of customer risk. For larger
facilities, while full use is made of automated risk rating processes, the ultimate
responsibility for setting risk ratings rests with the final approving executive. Risk
grades are reviewed frequently and amendments, where necessary, are implemented
promptly.
Structure and Organisation
The Risk function is responsible for the quality and performance of its credit portfolios and
for monitoring and controlling all credit risks in its portfolios.
Credit underwriting is processed at different levels (country, region, Group) depending on
size and complexity of proposals and by different teams (F.Is / Corporate / Trade / Cross-
Border Approvals). Credit approval authorities are delegated from the Chief Risk Officer at
the Regional Head Office in Hong Kong to the CEO, India and the CRO, India. The CRO in
India maintains a functional reporting line to the CRO in Hong Kong. The CRO of India
further delegates lending authorities to WMR and RBWM Risk executives. For certain
customer types, the approval is granted either ASP Risk/ Group Risk basis the
recommendation of India WMR. Relationship management of problem accounts or
downgrades in certain internal ratings are transferred to LMU (Loan Management Unit)
within Risk.
Scope and nature of risk reporting, measurement, monitoring and mitigation
The Bank manages and directs credit risk management systems initiatives. HSBC has
constructed a centralised database covering substantially all of the Group’s direct lending
exposures, to deliver an increasingly granular level of management reporting.
The Bank performs regular reporting on its credit risk portfolio (wholesale & retail), to
include information on large credit exposures, concentrations, industry exposures, levels of
impairment provisioning, delinquencies, LTVs and country exposures to various internal
governance forums. The analysis of the portfolio is also presented to the RMM monthly.

The Hongkong and Shanghai Banking Corporation Limited (Incorporated in Hong Kong SAR with limited liability)
Basel III – Pillar 3 disclosures of India Branches (Continued) For the period ended 30 June 2016
9
3 Credit risk (Continued)
a. General (Continued)
Non-performing advances (Continued)
Non-performing advances are identified by periodic appraisals of the portfolio by
management or in accordance with RBI guidelines, whichever is earlier.
Specific provisions are made on a case by case basis based on management’s assessment of
the degree of impairment of the advances (including mortgage loans but excluding other
homogeneous retail loans), subject to the minimum provisioning levels prescribed by the
RBI. Where there is no longer any realistic prospect of recovery, the outstanding advance is
written off.
Special attention is paid to high risk exposures, which are subject to more frequent and
intensive review and reporting, in order to accelerate remedial action. The bank engages
with customers closely to work out of distress situations.
Subject to the minimum provisioning levels prescribed by the RBI, the provision on
homogeneous unsecured loans relating to retail business is assessed on a portfolio basis
using the historical loss and/or net flow rate method.
b. Quantitative disclosures for portfolios under the standardised approach
(i) Total gross credit risk exposures by geography
(Rs ‘000)
At 30 June 2016
Fund based Note 1 Non fund based Note 2 Total
Overseas - - -
Domestic 767,372,888 441,572,516 1,208,945,404
Total 767,372,888 441,572,516 1,208,945,404
(Rs ‘000)
At 31 March 2016
Fund based Note 1 Non fund based Note 2 Total
Overseas - - -
Domestic 795,500,976 446,638,086 1,242,139,062
Total 795,500,976 446,638,086 1,242,139,062
Note 1: Amount represents funded exposure before credit risk mitigants.
Note 2: Amount represents non-funded exposure after applying credit conversion factor and before credit
risk mitigants.
The Hongkong and Shanghai Banking Corporation Limited (Incorporated in Hong Kong SAR with limited liability)
Basel III – Pillar 3 disclosures of India Branches (Continued) For the period ended 30 June 2016
10
3 Credit risk (Continued)
b. Quantitative disclosures for portfolios under the standardized approach (Continued)
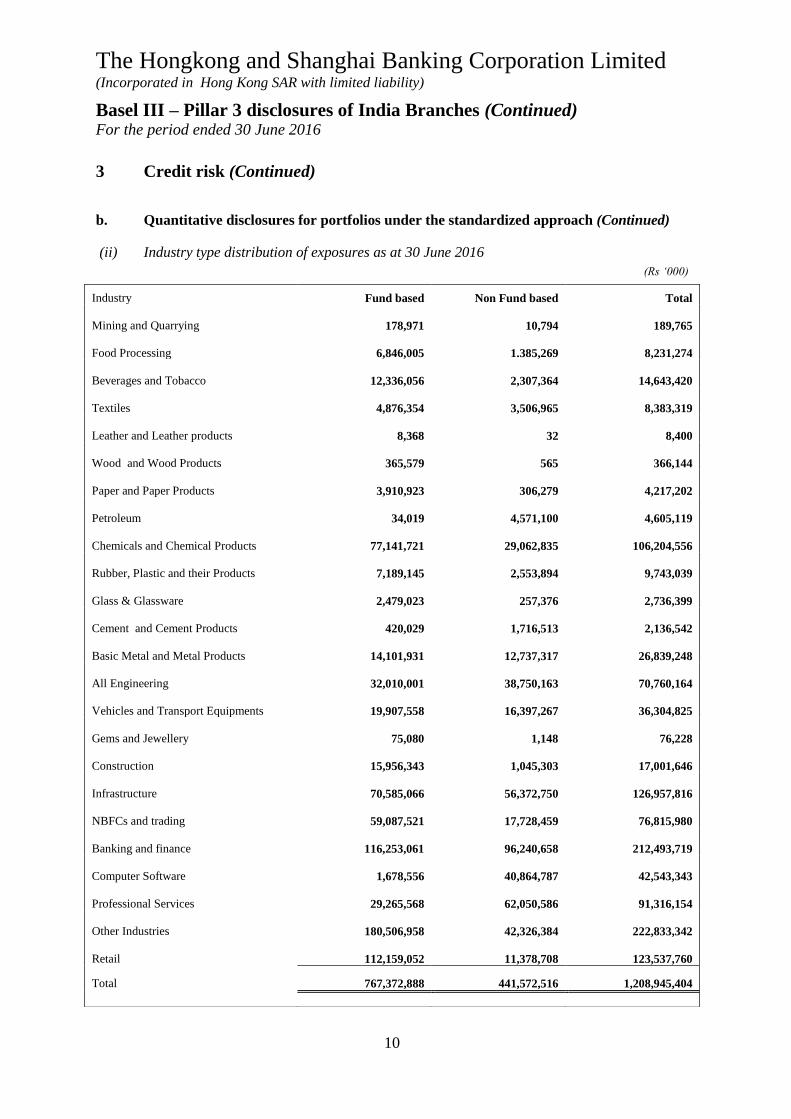
(ii) Industry type distribution of exposures as at 30 June 2016
(Rs ‘000)
Industry Fund based Non Fund based Total
Mining and Quarrying 178,971 10,794 189,765
Food Processing 6,846,005 1.385,269 8,231,274
Beverages and Tobacco 12,336,056 2,307,364 14,643,420
Textiles 4,876,354 3,506,965 8,383,319
Leather and Leather products 8,368 32 8,400
Wood and Wood Products 365,579 565
366,144
Paper and Paper Products 3,910,923 306,279
4,217,202
Petroleum 34,019 4,571,100
4,605,119
Chemicals and Chemical Products 77,141,721 29,062,835 106,204,556
Rubber, Plastic and their Products 7,189,145 2,553,894 9,743,039
Glass & Glassware 2,479,023 257,376
2,736,399
Cement and Cement Products 420,029 1,716,513 2,136,542
Basic Metal and Metal Products 14,101,931 12,737,317
26,839,248
All Engineering 32,010,001 38,750,163
70,760,164
Vehicles and Transport Equipments 19,907,558 16,397,267
36,304,825
Gems and Jewellery 75,080 1,148 76,228
Construction 15,956,343 1,045,303
17,001,646
Infrastructure 70,585,066 56,372,750
126,957,816
NBFCs and trading 59,087,521 17,728,459
76,815,980
Banking and finance 116,253,061 96,240,658
212,493,719
Computer Software 1,678,556 40,864,787
42,543,343
Professional Services 29,265,568 62,050,586 91,316,154
Other Industries 180,506,958 42,326,384 222,833,342
Retail 112,159,052 11,378,708 123,537,760
Total 767,372,888 441,572,516 1,208,945,404

The Hongkong and Shanghai Banking Corporation Limited (Incorporated in Hong Kong SAR with limited liability)
Basel III – Pillar 3 disclosures of India Branches (Continued) For the period ended 30 June 2016
11
3 Credit risk (Continued)
b. Quantitative disclosures for portfolios under the standardized approach (Continued)
Industry type distribution of exposures as at 31 March 2016
(Rs ‘000)
Industry Fund based Non Fund based Total
Mining and Quarrying 185,547 49,560 235,107
Food Processing 10,811,609 2,419,630 13,231,239
Beverages and Tobacco 11,974,377 2,221,228 14,195,605
Textiles 5,470,786 5,451,995 10,922,781
Leather and Leather products 32,001 32 32,033
Wood and Wood Products 225,406 565 225,971
Paper and Paper Products 3,668,791 293,317 3,962,108
Petroleum 123,908 7,720,136 7,844,044
Chemicals and Chemical Products 74,664,832 27,541,696 102,206,528
Rubber, Plastic and their Products 7,859,341 1,498,459 9,357,800
Glass & Glassware 2,681,077 256,475 2,937,552
Cement and Cement Products 1,134,793 1,624,935 2,759,728
Basic Metal and Metal Products 11,965,606 14,358,506 26,324,112
All Engineering 34,170,977 39,749,616 73,920,593
Vehicles and Transport Equipments 19,813,316 17,375,569 37,188,885
Gems and Jewellery 205,150 1,391 206,541
Construction 14,772,689 547,627 15,320,316
Infrastructure 74,197,448 57,024,517 131,221,965
NBFCs and trading 51,955,256 19,792,743 71,747,999
Banking and finance 152,005,200 94,604,954 246,610,154
Computer Software 1,894,350 40,567,424 42,461,774
Professional Services 30,629,887 59,630,782 90,260,669
Other Industries 173,903,510 42,528,221 216,431,731
Retail 111,155,119 11,378,708 122,533,827
Total 795,500,976 446,638,086 1,242,139,062

The Hongkong and Shanghai Banking Corporation Limited (Incorporated in Hong Kong SAR with limited liability)
Basel III – Pillar 3 disclosures of India Branches (Continued) For the period ended 30 June 2016
12
3 Credit risk (Continued)
b. Quantitative disclosures for portfolios under the standardised approach (Continued)
(iii) Residual contractual maturity breakdown of total assets
(Rs‘000)
At 30 June 2016
At 31 March 2016
1 day 298,637,484 208,146,711
2 to 7 days 52,278,739 174,547,354
8 to 14 days 39,944,280 84,779,999
15 to 28 days 132,093,461 134,754,893
29 days & up to 3 months 124,375,456 135,842,120
Over 3 months and up to 6 months 65,763,635 107,026,679
Over 6 months and up to 1 year 93,402,534 147,988,870
Over 1 year and up to 3 years 150,113,702 112,308,089
Over 3 years and up to 5 years 123,537,006 87,237,238
Over 5 years 239,393,382 216,944,594
Total
1,319,539,679
1,409,576,548
(iv) Amount of Non-Performing Assets (NPAs) (Gross)
(Rs‘000)
At 30 June 2016 At 31 March 2016
Substandard 1,611,132 1,869,059
Doubtful 1 2,505,999 2,375,865
Doubtful 2 1,921,328 1,885,410
Doubtful 3 1,225,470 1,232,100
Loss 997,337 995,426
Total 8,261,266 8,357,860
(v) Net NPAs
The net NPAs are Rs.2,076 million (as at 31 March 2016- Rs. 2,113 million). Please see
table (vii) below.
(vi) NPA ratios
At 30 June 2016 At 31 March 2016
Gross NPAs to gross advances 1.47% 1.50%
Net NPAs to net advances 0.37% 0.38%

The Hongkong and Shanghai Banking Corporation Limited (Incorporated in Hong Kong SAR with limited liability)
Basel III – Pillar 3 disclosures of India Branches (Continued) For the period ended 30 June 2016
13
3 Credit risk (Continued)
b. Quantitative disclosures for portfolios under the standardised approach (Continued)
(vii) Movement of NPAs
(Rs‘000)
At 30 June 2016
Gross NPA’s Provision Net NPA
Opening balance as at 1 April 2016 8,357,860 6,244,737 2,113,123
Additions during the period 721,144 23,900 697,244
Reductions during the period (817,738) (83,350) (734,388)
Closing balance as at 30 June 2016 8,261,266 6,185,287 2,075,979
(Rs‘000)
At 31 March 2016
Gross NPA’s Provision Net NPA
Opening balance as at 1 April 2015 7,914,574 5,533,401 2,381,173
Additions during the period 3,383,758 1,448,979 1,934,779
Reductions during the period (2,940,472) (737,643) (2,202,829)
Closing balance as at 31 March 2016 8,357,860 6,244,737 2,113,123
(viii) General Provisions
General provisions comprises of provision towards standard assets and Unhedged Foreign
Currency Exposure (UFCE) in accordance with RBI Master Circular DBR No.
BP.BC.2/21.04.048/2015-16 dated 01 July 2015.
(ix) Non-performing investments
Non-performing investments as at 30 June 2016 are Rs. 3 (as at 31 March 2016 Rs. 3).This
represents 3 preference share investments which have each been written down to Re.1.
(x) Movement of provisions for depreciation on investments
(Rs‘000)
At 30 June
2016
At 31 March
2016
Opening balance 389 300
Provisions during the year 15,753 89
Write offs during the year - -
Write back of excess provisions during
the year - -
Closing balance 16,142 389

The Hongkong and Shanghai Banking Corporation Limited (Incorporated in Hong Kong SAR with limited liability)
Basel III – Pillar 3 disclosures of India Branches (Continued) For the period ended 30 June 2016
14
3 Credit risk (Continued)
b. Quantitative disclosures for portfolios under the standardised approach (Continued)
(xi) Classification (by major industry) of NPA, Provision, past due loans as at 30 June 2016 and
Specific Provision and Write off during the quarter.
(Rs ‘000)
NPA Past Due Loans Provision Specific
Provision
during the
quarter
Write off
during the
quarter
1.Agriculture - - - - -
1.1 Direct Agriculture - - - - -
1.2 Indirect Agriculture - - - - -
2. Advances to Industries sector
of which:
3,233,788 3,693,346 2,756,096 58,595 -
2.1 Glass & Glassware 2,078,006 - 1,593,826 54,300 -
2.2 Infrastructure 433,947 - 436,755 - -
2.3 Textiles 420,610 116,422 421,004 2,952 -
3. Services
of which:
2,387,944 233,969 2,396,724 36,740 -
3.1 Trade 1,813,126 74,624 1,822,165 26,696 -
3.2 Computer Software 230,640 - 230,638 4,338 -
3.2 NBFC 217,779 - 218,801 397 -
4. Retail 2,639,534 2,717,918 1,032,467 149 98,499
Total 8,261,266 6,645,233 6,185,287 95,484 98,499

The Hongkong and Shanghai Banking Corporation Limited (Incorporated in Hong Kong SAR with limited liability)
Basel III – Pillar 3 disclosures of India Branches (Continued) For the period ended 30 June 2016
15
3 Credit risk (Continued)
b. Quantitative disclosures for portfolios under the standardised approach (Continued)
Classification (by major industry) of NPA, Provision, past due loans as at 31 March 2016 and
Specific Provision and Write off during the year
(Rs ‘000)
NPA Past Due Loans Provision Specific
Provision during
the year
Write off
during the
year
1.Agriculture - - - - -
1.1 Direct Agriculture - - - - -
1.2 Indirect Agriculture - - - - -
2. Advances to Industries sector
of which:
3,233,947 1,219,547 2,715,013 790,626 13,579
2.1 Glass & Glassware 2,078,006 - 1,556,968 746,743 -
2.2 Infrastructure 433,947 - 436,755 - -
2.3 Textiles 417,616 121,102 418,052 9,053 -
3. Services
of which:
2,352,361 175,498 2,359,922 132,692 158,553
3.1 Trade 1,788,255 64,324 1,795,469 78,957 -
3.2 Computer Software 226,302 - 226,300 17,954 -
3.2 NBFC 219,738 - 218,494 7,634 158,553
4. Retail 2,771,553 2,184,000 1,169,802 525,661 452,119
Total 8,357,860 3,579,044 6,244,737 1,448,979 624,251

The Hongkong and Shanghai Banking Corporation Limited (Incorporated in Hong Kong SAR with limited liability)
Basel III – Pillar 3 disclosures of India Branches (Continued) For the period ended 30 June 2016
16
3 Credit risk (Continued)
b. Quantitative disclosures for portfolios under the standardised approach (Continued)
(xii) Write offs and recoveries directly booked to income statement.
(Rs ‘000)
At 30 June 2016 At 31 March 2016
Write offs 124,337 475,507
Recoveries 41,503 172,762
(xiii) Ageing of past due loans
(Rs ‘000)
At 30 June 2016 At 31 March 2016
Overdue less than 30 days 4,978,614 3,111,246
Overdue for 30 to 60 days 1,214,945 379,632
Overdue for 60 to 90 days 451,674 88,166
Total 6,645,233 3,579,044
(xiv) Amount of NPAs and past due loans by significant geographic areas as at 30 June 2016
(Rs ‘000)
NPA Past Due Loans
Overseas - -
Domestic 8,261,266 6,645,233
Total 8,261,266 6,645,233
Amount of NPAs and past due loans by significant geographic areas as at 31 March 2016
(Rs ‘000)
NPA Past Due Loans
Overseas - -
Domestic 8,357,860 3,579,044
Total 8,357,860 3,579,044

The Hongkong and Shanghai Banking Corporation Limited (Incorporated in Hong Kong SAR with limited liability)
Basel III – Pillar 3 disclosures of India Branches (Continued) For the period ended 30 June 2016
17
4. Disclosures for portfolios under the standardised approach
The Bank uses the following External Credit Assessment Institutions (ECAIs) approved by
RBI to calculate its capital adequacy requirements under the standardised approach to credit
risk for Corporate, Bank and Sovereign counterparties.
Domestic ECAIs for external ratings of Indian Corporates:
a) Credit Analysis and Research Limited (CARE)
b) CRISIL Limited
c) India Ratings and Research Private Limited (FITCH)
d) ICRA Limited
e) Brickwork Ratings India Pvt Limited
f) SMERA Ratings Limited (SMERA)
The Bank used the ratings issued by the ECAIs (for both long term and short term facilities)
to risk weight both funded as well as non-funded exposures to corporate customers.
The process used by the Bank to transfer public issue ratings onto comparable assets in the
banking book is in line with RBI Master Circular on Basel-III Capital Regulations dated 01
July 2015.
The mapping of external credit ratings and risk weights for corporate exposures is provided
in the grids below:
Risk weight mapping of Long term and short term corporate ratings
Long Term
Ratings of all
ECAIs
Risk
weights
AAA 20%
AA 30%
A 50%
BBB 100%
BB & Below
150%
Unrated 100%
Short Term Ratings Risk
weights
CARE CRISIL FITCH ICRA BRICKWORK SMERA
CARE A1 + CRISIL A1 + FITCH A1 + ICRA A1 + BRICKWORK A1+ SMERA A1+ 20%
CARE A1 CRISIL A1 FITCH A1 ICRA A1 BRICKWORK A1 SMERA A1 30%
CARE A2 CRISIL A2 FITCH A2 ICRA A2 BRICKWORK A2 SMERA A2 50%
CARE A3 CRISIL A3 FITCH A3 ICRA A3 BRICKWORK A3 SMERA A3 100%
CARE A4 CRISIL A4 FITCH A4 ICRA A4 BRICKWORK A4 SMERA A4 150%
CARE D CRISIL D FITCH D ICRA D BRICKWORK D SMERA D 150%
Unrated Unrated Unrated Unrated Unrated Unrated 100%

The Hongkong and Shanghai Banking Corporation Limited (Incorporated in Hong Kong SAR with limited liability)
Basel III – Pillar 3 disclosures of India Branches (Continued) For the period ended 30 June 2016
18
4 Disclosures for portfolios under the standardised approach (Continued)
The claims on banks incorporated in India and foreign banks branches in India, excluding
investment in equity shares and other instruments eligible for capital status (Investments
referred to in paragraph 5.6.1 (i) & (ii) of RBI Master circular on Basel-III Capital
Regulations dated 01 July 2015), are risk weighted as shown below:
Claims on Banks Incorporated in India and Foreign Bank Branches in
India Risk Weights%
Level of Common Equity Tier 1 capital (CET1) including applicable
capital conservation buffer (CCB) (%) of the investee bank (where
applicable)
Scheduled
Banks Other Banks
Applicable Minimum CET1 + Applicable CCB and above 20% 100%
Applicable Minimum CET1 + CCB = 75% and <100% of applicable CCB 50% 150%
Applicable Minimum CET1 + CCB = 50% and <75% of applicable CCB 100% 250%
Applicable Minimum CET1 + CCB = 0% and <50% of applicable CCB 150% 350%
Minimum CET1 less than applicable minimum 625% 625%
International ECAIs for external ratings of Foreign Banks, Foreign Sovereigns, Foreign
Public Sector Entities and Non-Resident Corporates:
a) Fitch Ratings;
b) Moodys; and
c) Standard & Poor’s Ratings Services (S&P)
The process used by the Bank to transfer public issue ratings onto comparable assets in the
banking book is in line with RBI Guidelines. The mapping of external credit ratings and risk
weights for the above entities are provided in the grids below:
Risk weight mapping of foreign banks
S&P and Fitch ratings AAA to AA A BBB BB to B Below B Unrated
Moody’s rating Aaa to Aa A Baa Ba to B Below B Unrated
Risk weight 20% 50% 50% 100% 150% 50%
Risk weight mapping of foreign sovereigns
S&P and Fitch ratings AAA to AA A BBB BB to B Below B Unrated
Moody’s rating Aaa to Aa A Baa Ba to B Below B Unrated
Risk weight 0% 20% 50% 100% 150% 100%
Risk weight mapping of foreign public sector entities
S&P and Fitch ratings AAA to AA A BBB Below BB Unrated
Moody’s rating Aaa to Aa A Baa to Ba Below Ba Unrated
Risk weight 20% 50% 100% 150% 100%

The Hongkong and Shanghai Banking Corporation Limited (Incorporated in Hong Kong SAR with limited liability)
Basel III – Pillar 3 disclosures of India Branches (Continued) For the period ended 30 June 2016
19
4 Disclosures for portfolios under the standardised approach (Continued)
Risk weight mapping of non resident corporates
S&P and Fitch ratings AAA to AA A BBB Below BB Unrated
Moody’s rating Aaa to Aa A Baa to Ba Below Ba Unrated
Risk weight 20% 50% 100% 150% 100%
Exposure under various risk buckets (post Credit Risk Mitigants)
(Rs‘000)
At 30 June
2016
At 31 March
2016
Below 100% risk weight 673,314,101 726,180,194
100% risk weight 424,354,099 404,365,425
Above 100% risk weight 53,163,144 51,476,734
Deductions* (912,273) (1,021,282)
Total 1,149,919,071 1,181,001,070
*Deduction represents amounts deducted
from Tier I Capital
Note: As per RBI guidelines as on 01 March 2016, DTA which was deducted from CET1 capital, can be recognised in the
CET1 with a limit of 10% of net CET1 (after deducting DTA). Currently DTA is 4.16% of net CET1 capital. Accordingly,
there is no deduction as on 30 June 2016.

The Hongkong and Shanghai Banking Corporation Limited (Incorporated in Hong Kong SAR with limited liability)
Basel III – Pillar 3 disclosures of India Branches (Continued) For the period ended 30 June 2016
20
5. Leverage Ratio
(Rs ‘000)
Particulars
At 30 September 2015 At 31 December 2015 At 31 March 2016 At 30 June 2016
Tier 1 Capital
151,693,191 150,310,995
167,393,650 167,502,666
Exposure
Measure
1,712,809,735 1,663,504,724
1,872,382,327 1,823,718,279
Leverage Ratio*
8.86% 9.04%
8.94% 9.18%
*As per RBI Master circular no. DBR.No.BP.BC.1/21.06.201/2015-16 dated 01 July 2015.