the herschel -atlas data release 1 paper ii: multi
TRANSCRIPT

MNRAS 000, 1–24 (2016) Preprint 27 June 2016 Compiled using MNRAS LATEX style file v3.0
The Herschel?-ATLAS Data Release 1 Paper II:Multi-wavelength counterparts to submillimetre sources
N. Bourne,1†L. Dunne,1,2 S. J. Maddox,1,2 S. Dye,3 C. Furlanetto,3,4
C. Hoyos,3,5,6 D. J. B. Smith,7 S. Eales,2 M. W. L. Smith,2 E. Valiante,2
M. Alpaslan,8,9 E. Andrae,10 I. K. Baldry,11 M. E. Cluver,12 A. Cooray,13
S. P. Driver,8,9 J. S. Dunlop,1 M. W. Grootes,10 R. J. Ivison,1,14 T. H. Jarrett,15
J. Liske,16 B. F. Madore,17 C. C. Popescu,18 A. G. Robotham,8,9 K. Rowlands,8
M. Seibert,17 M. A. Thompson,7 R. J. Tuffs,10 S. Viaene,19 A. H. Wright91 SUPA‡, Institute for Astronomy, University of Edinburgh, Royal Observatory, Edinburgh, EH9 3HJ, UK2 School of Physics and Astronomy, Cardiff University, The Parade, Cardiff, CF24 3AA, UK3 School of Physics and Astronomy, University of Nottingham, University Park, Nottingham, NG7 2RD, UK4 CAPES Foundation, Ministry of Education of Brazil, Brasılia/DF, 70040-020, Brazil5 Departamento de Fısica Teorica, Universidad Autonoma de Madrid, Crta de Colmenar Viejo. km 15.600. 28049 Madrid, Spain6 Departamento de Fısica, Universidad Carlos III de Madrid, Campus de Leganes, Avda. Universidad 30. 28911 Madrid, Spain7 Centre for Astrophysics Research, School of Physics, Astronomy and Mathematics, University of Hertfordshire, College Lane,Hatfield, AL10 9AB, UK8 SUPA, School of Physics and Astronomy, University of St Andrews, North Haugh, St Andrews, Fife, KY16 9SS, UK9 International Centre for Radio Astronomy (ICRAR), University of Western Australia, Crawley, WA6009, Australia10 Max-Planck-Institut fuer Kernphysik (MPIK), Saupfercheckweg 1, 69117 Heidelberg, Germany11 Astrophysics Research Institute, Liverpool John Moores University, IC2, Liverpool Science Park, 146 Brownlow Hill, Liverpool,L3 5RF, UK12 University of the Western Cape, Robert Sobukwe Road, Bellville, 7535, South Africa13 Department of Physics and Astronomy, University of California, Irvine, CA 9269714 ESO, Karl Schwarzschild Strasse 2, D-85748 Garching, Germany15 Department of Astronomy, University of Cape Town, Private Bag X3, Rondebosch, 7701, South Africa16 Hamburger Sternwarte, Universitat Hamburg, Gojenbergsweg 112, 21029 Hamburg, Germany17 The Observatories, Carnegie Institute of Washington, 813 Santa Barbara Street, Pasadena, CA 9110118 Jeremiah Horrocks Institute, University of Central Lancashire, Preston, PR1 2HE, UK19 Sterrenkundig Observatorium, Universiteit Gent, Krijgslaan 281, B-9000 Gent, Belgium
Accepted XXX. Received YYY; in original form ZZZ
ABSTRACTThis paper is the second in a pair of articles presenting data release 1 (DR1) of theHerschel Astrophysical Terahertz Large Area Survey (H-ATLAS), the largest singleopen-time key project carried out with the Herschel Space Observatory. The H-ATLASis a wide-area imaging survey carried out in five photometric bands at 100, 160, 250,350 and 500µm covering a total area of 600 deg2. In this paper we describe the iden-tification of optical counterparts to submillimetre sources in DR1, comprising an areaof 161 deg2 over three equatorial fields of roughly 12 × 4.5 centred at 9h, 12h and14.5h respectively. Of all the H-ATLAS fields, the equatorial regions benefit from thegreatest overlap with current multi-wavelength surveys spanning ultraviolet (UV) tomid-infrared regimes, as well as extensive spectroscopic coverage. We use a likelihood-ratio technique to identify SDSS counterparts at r < 22.4 for 250-µm-selected sourcesdetected at ≥ 4σ (≈28 mJy). We find ‘reliable’ counterparts (reliability R ≥ 0.8) for44,835 sources (39 per cent), with an estimated completeness of 73.0 per cent andcontamination rate of 4.7 per cent. Using redshifts and multi-wavelength photometryfrom GAMA and other public catalogues, we show that H-ATLAS-selected galaxiesat z < 0.5 span a wide range of optical colours, total infrared (IR) luminosities, andIR/UV ratios, with no strong disposition towards mid-IR-classified AGN in compar-ison with optical selection. The data described herein, together with all maps andcatalogues described in the companion paper (Valiante et al. 2016), are available fromthe H-ATLAS website at www.h-atlas.org.
Key words: catalogues – methods: statistical – submillimetre: galaxies – submil-limetre: stars
c© 2016 The Authors

2 N. Bourne et al.
1 INTRODUCTION
The Herschel Astrophysical Large Area Survey (H-ATLAS;Eales et al. 2010) is the largest-area submillimetre (submm)survey conducted with the Herschel Space Observatory (Pil-bratt et al. 2010), imaging around 600 deg2 at 100 and160µm with PACS (Poglitsch et al. 2010) and 250, 350 and500µm with SPIRE (Griffin et al. 2010), as described by Ibaret al. (2010), Pascale et al. (2011) and Valiante et al. (2016;hereafter Paper I). Data release 1(DR1) covers 161 deg2 inthree equatorial fields at RA of approximately 9h, 12h and14.5h (GAMA9, GAMA12, GAMA15), and benefits fromextensive multi-wavelength coverage in the Sloan DigitalSky Survey (SDSS; York et al. 2000), the Galaxy Evolu-tion Explorer (GALEX ; Martin et al. 2005), the UK In-frared Deep Sky Survey Large Area Survey (UKIDSS-LAS;Lawrence et al. 2007), the Wide-field Infrared Survey Ex-plorer (WISE ; Wright et al. 2010), the VISTA Kilo-degreeInfrared Galaxy Survey (VIKING; Edge et al. 2013), andthe VST Kilo-Degree Survey (KiDS; de Jong et al. 2013).These fields are especially valuable due to the extensive sup-porting data and analysis provided by the Galaxy and MassAssembly (GAMA) survey (Driver et al. 2011), includinghighly complete spectroscopic redshifts (Liske et al. 2015)and matched-aperture photometry from far-UV to submm(Driver et al. 2016).
In order to unlock the scientific capabilities of these richdata-sets, one of the first challenges is to identify counter-parts across the various surveys, a problem of particular dif-ficulty in the submm due to poor angular resolution and therelatively flat redshift distribution of sources in contrast withother wavebands. A popular approach to this problem is thelikelihood ratio (LR) technique (Richter 1975; Sutherland& Saunders 1992; Ciliegi et al. 2003), which was adoptedfor the identification of SDSS counterparts in the H-ATLASscience demonstration phase (SDP) by Smith et al. (2011;hereafter S11); Spitzer -IRAC counterparts in SDP by Kimet al. (2012); VIKING counterparts in the DR1 GAMA9field by Fleuren et al. (2012); and WISE counterparts inGAMA15 by Bond et al. (2012).
In this paper we apply the LR technique to H-ATLASDR1 to find counterparts in SDSS DR7 (Abazajian et al.2009) and DR9 (Ahn et al. 2012), using additional datafrom UKIDSS-LAS and GAMA. For counterparts withinthe GAMA main survey (primarily r < 19.8), we take ad-vantage of matched far-UV-to-mid-IR photometry providedby GAMA, combining data from SDSS, GALEX, VIKINGand WISE (Driver et al. 2016). We use the results to deter-mine the multi-wavelength properties and physical nature of250-µm-detected sources above ∼30 mJy, including magni-tude distributions, optical/infrared colours, redshift distri-bution, and infrared luminosities. Throughout the paper wequote magnitudes in the AB system unless otherwise stated,and assume a cosmology with ΩΛ = 0.73, ΩM = 0.27 andH0 = 71 km s−1Mpc−1.
?Herschel is an ESA space observatory with science instruments
provided by European-led Principal Investigator consortia andwith important participation from NASA.† [email protected]‡ Scottish Universities Physics Alliance
Table 1. Statistics of SDSS candidates within the SPIRE masksof the three fields
Sample GAMA9 GAMA12 GAMA15
SPIRE SNR250 ≥ 4 37612 36906 39479
Mask area (deg2) 53.42 53.47 54.53
SDSS rmodel < 22.4 1127518 976822 1105073
After cleaning 1126510 975630 1103891Stars 540739 365708 488648
Galaxies 754598 603327 603578
QSOs (spectroscopic) 3545 2921 5769QSOs (photometric) 7628 3674 5896
Spectroscopic redshifts 66368 72868 81464H-ATLAS zp 1107539 963395 1092258
2 DATA
2.1 Submillimetre catalogues
We use the H-ATLAS DR1 source catalogues described inPaper I, which are extracted from the 250-µm maps us-ing MADX (Maddox in preparation) with a matched-filtertechnique (Chapin et al. 2011) to minimize instrumentaland confusion noise. The source catalogues used for match-ing contain 37612, 36906 and 39472 sources detected with250-µm signal-to-noise ratio (SNR) ≥ 4 in the GAMA9,GAMA12 and GAMA15 fields respectively. The 4σ detec-tion limit is 24 mJy for a point source in the deepest re-gions of the maps (where tiles overlap), or 29 mJy for a pointsource in the non-overlapping regions (the average 4σ point-source detection has S250 = 27.8 mJy). The catalogues alsocontain a small fraction of sources selected at 350 or 500µm,which have 250µm SNR < 4. We exclude these from thisanalysis because their red submm colours indicate a highredshift, and any identification with an SDSS source is likelyto be false, resulting from either chance alignment or lensing(Negrello et al. 2010; Pearson et al. 2013).
For the LR calculations we treat all 250-µm detectionsas point sources (see Section 3.2) but for the discussion ofmulti-wavelength properties in Section 6 we use the best fluxmeasurement for each source in each band, as described inPaper I.
2.2 Optical catalogues and classifications
2.2.1 Sample selection
We opt to search for counterparts in SDSS because this iscurrently the deepest comprehensive survey of the full DR1sky area. We use all primary objects in SDSS DR7 withrmodel < 22.4 (see Table 1 for numbers). We use DR7 be-cause, unlike later releases, it contains size information thatis used for identifying H-ATLAS sources requiring extendedflux measurements. We found that 163 and 433 additionalobjects were present in DR9 (in GAMA9 and GAMA12 re-spectively), close to bright stars that were masked in DR7.These sources were added to our optical catalogue to max-imise the completeness. We cleaned the catalogue by re-moving a total of 3749 spurious objects, which are gener-ally either galaxies which have been deblended into mul-tiple primary objects (for example where a spiral arm orbright region has been identified as a separate object from
MNRAS 000, 1–24 (2016)

Multi-wavelength IDs for H-ATLAS 3
the galaxy) or stars with diffraction spikes which are de-tected as multiple objects. These cases were identified byvisually inspecting all SDSS objects with r < 19 that haddeblend flags and were within 10 arcsec of a SPIRE source;in each case only the brightest central object was retainedin the cleaned catalogue (see also S11). The total of 3749also includes spurious objects identified by performing a self-match on SDSS coordinates with a search radius of 1 arcsec,since these close pairs are always the result of incorrect de-blending in the SDSS catalogue rather than genuine pairs ofseparate sources.
2.2.2 Redshifts
Spectroscopic redshifts (zs) were obtained from theGAMA II redshift catalogue (SpecCat v27 ), which is closeto 100 per cent complete for r < 19.8 (Liske et al. 2015).In addition to GAMA redshifts from the AAO and LT,we include redshifts collected from SDSS DR7 and DR10(both galaxy and QSO targets; Ahn et al. 2013); WiggleZ(Drinkwater et al. 2010); 2SLAQ-LRG (Cannon et al. 2006);2SLAQ-QSO (Croom et al. 2009); 6dFGS (Jones et al. 2009);MGC (Driver et al. 2005); 2QZ (Croom et al. 2004); 2dF-GRS (Colless et al. 2001); UZC (Falco et al. 1999); andNED.1 The GAMA redshifts cover two samples, the mainsample and the filler sample. The main sample is based onSDSS galaxy selection to rpetro < 19.8 primarily. In addi-tion to these, H-ATLAS-selected galaxies were added as fillertargets from February 2011. Filler targets were selected forH-ATLAS sources with reliable optical counterparts (relia-bility R > 0.8), that were part of the GAMA input catalogue(selected from SDSS with rpetro < 20.0 or rmodel < 20.6). Inaddition, the same masking and star-galaxy separation wereapplied to select the filler sample as per the GAMA mainsample (Baldry et al. 2010). Redshifts were considered reli-able if they had quality nQ ≥ 3. The main sample is highlycomplete with over 98 per cent meeting this criterion, while86 per cent of the H-ATLAS fillers were observed spectro-scopically with 63 per cent having nQ ≥ 3. Completenessat r & 20 is lower, although the SDSS DR10 and WiggleZsurveys provide a considerable contribution here (see alsoSection 5.1). We discarded GAMA redshifts with low quality(nQ < 3) and SDSS redshifts with any spectroscopic flags set.For objects with redshifts in multiple surveys we favouredthe one with the highest quality flag, and where this wasnot possible we selected in order of preference (i) GAMA,(ii) SDSS DR10, (iii) WiggleZ, (iv) other surveys. The dis-tribution and origins of redshifts in our final catalogue aredescribed in more detail in Section 5.1.
The optical catalogues also contain photometric red-shifts measured from the SDSS ugriz and UKIDSS Y JHKphotometry for all candidates in our optical catalogue, al-though these are not used for the LR analysis. The photo-metric redshifts are described in detail in S11. They wereestimated by empirical regression using the neural network
1 The NASA/IPAC Extragalactic Database, http://ned.ipac.
caltech.edu/, is operated by the Jet Propulsion Laboratory, Cal-ifornia Institute of Technology, under contract with the National
Aeronautics and Space Administration.
technique of annz (Collister & Lahav 2004), by construct-ing a training set of spectroscopic redshifts from GAMA I(Driver et al. 2011), SDSS DR7, 2SLAQ, AEGIS (Davis et al.2007) and zCOSMOS (Lilly et al. 2007), which covers mag-nitudes r < 23 (with >1000 galaxies per unit magnitude) andredshifts z < 1 (with >1000 in each ∆z=0.1 bin). In Fig. 1we analyse the accuracy of these photometric redshifts, andcompare them against those from the SDSS (DR7/DR9)Photoz table2. The annz redshifts show less bias and smallerscatter than the SDSS ones, showing the benefit of includingnear-IR photometry from UKIDSS.
2.2.3 Separating stars, galaxies and quasars
Star-galaxy separation was carried out using similar con-straints to S11 and the GAMA input catalogue (Baldry et al.2010). Specifically, galaxies were defined as objects satisfy-ing any of the following constraints, indicating that they areeither extended or have colours inconsistent with stars:
(i) ∆sg > 0.25 and not zs < 0.001(ii) ∆sg > 0.05 and ∆sg jk > 0.40 and not zs < 0.001(iii) ∆sg > fsg and not zs < 0.001(iv) GAMA Kron ellipse defined and not zs < 0.001
The ∆sg parameter quantifies the fraction of extended fluxin the r-band,
∆sg = rpsf − rmodel, (1)
while the ∆sg jk parameter quantifies the near-IR colour ex-cess,
∆sg jk = Jc − Kc − f jk , (2)
in relation to the colour sequence of stars,
f jk =
− 0.7172 [gc − ic < 0.3]
− 0.89 + 0.615(gc − ic ) − 0.13(gc − ic )2
[0.3 < gc − ic < 2.3]
− 0.1632 [gc − ic > 2.3]. (3)
Finally, fsg provides a stricter threshold on the extendedflux fraction at fainter magnitudes where low-surface-brightness emission might otherwise be missed:
fsg =
0.25 [rmodel < 19]
0.25 −(rmodel − 19)
15[19 < rmodel < 20.5]
0.15 [rmodel > 20.5]. (4)
The colour constraints are illustrated in Fig. 2. We usedmodel magnitudes in g and i from SDSS and 2-arcsec aper-ture magnitudes (apermag3) in J and K from UKIDSS-LAS;3 the subscript c denotes correction for Galactic ex-tinction following Baldry et al. (2010), using the extinctionmaps from Schlegel et al. (1998).
2 See http://www.sdss.org/dr7/algorithms/photo-z.html3 Note that GAMA aperture photometry is only available for
r < 19.8 galaxies.
MNRAS 000, 1–24 (2016)

4 N. Bourne et al.
Figure 1. Left: comparison of the H-ATLAS photometric redshifts (zp from ugr izY JHK) and available spectroscopic redshifts (zs):
black points show the zp of all galaxies with a zs , and blue show the subset with measurement errors ∆zp/(1 + zp ) < 0.02. Middle:
comparison of the SDSS photometric redshifts (from ugr iz) and available spectroscopic redshifts: black points show the zp of all galaxieswith a zs and red show the subset with measurement errors ∆zp/(1 + zp ) < 0.02. Right: direct comparison of the H-ATLAS and SDSS
photometric redshifts: grey points show all data with both zp measurement errors ∆zp/(1 + zp ) < 0.1, and green show those with both
zp measurement errors ∆zp/(1 + zp ) < 0.02. The lower panels show the respective fractional deviations in zp . To reduce crowding weplot only one quarter of available data in each panel.
Quasars (QSOs) were identified as SDSS objects whichdo not satisfy any of the criteria (i–iv) above (i.e. unresolvedin the r-band and with non-stellar colours), and which havesecure spectroscopic redshifts z > 0.001. We also classifiedas quasars all objects which had been classified as quasarsby their SDSS spectra, defined by the criteria class=‘QSO’and zwarning=0 in the SpecObj table of SDSS DR12. Inaddition to these ‘spectroscopic’ QSOs, we identified pho-tometric QSO candidates as objects which do not satisfy(i–iv), have no spectroscopic redshift, but have ∆sg jk > 0.40(i.e. non-stellar colour). The numerical results of each clas-sification are shown in Table 1.
3 LIKELIHOOD RATIO ANALYSIS
The identification of counterparts (‘IDs’) to submm sourcescan be tackled in a statistical way using the LR tech-nique to assign a probability (‘reliability’) to each potentialmatch, and thus distinguish robust counterparts from chancealignments with background sources. The LR method relieson knowledge of the intrinsic positional uncertainty of thesources as well as the magnitude distributions of true coun-terparts and background sources. When the sample size issufficiently large it is preferable to divide the matching cat-alogue into different source classifications to measure thesestatistics for each class of object (Sutherland & Saunders1992; S11; Chapin et al. 2011; Fleuren et al. 2012). We there-fore calculate magnitude statistics separately for stars and
Figure 2. Star-galaxy separation using SDSS and UKIDSS
colours. The dashed line given by equation (3) describes the se-quence of stars. Galaxies (magenta contours) are separated from
stars (blue contours) using the criteria described in Section 2.2.3,
based on redshift and size information as well as the colours.Quasars are identified as unresolved objects with spectroscopic
redshifts > 0.001 (turqoise circles), and this sample is supple-
mented with candidate quasars (blue points) which are unresolvedobjects with non-star-like colours but no secure spectroscopic red-
shift available.
MNRAS 000, 1–24 (2016)
Multi-wavelength IDs for H-ATLAS 5
for extragalactic objects (galaxies and QSOs, both spectro-scopic and photometric). We assume that positional errorsare independent of the source classification, but we take intoaccount the potential bias for redder submm sources thatwas highlighted by Bourne et al. (2014), as we shall describein Section 3.2.
The LR of each counterpart is defined as a function ofr-band magnitude (m) and radial separation (r), as
L =q(m,c) f (r)
n(m,c), (5)
where q(m,c) represents the magnitude distribution of coun-terparts in class c (i.e. stars or galaxies), n(m,c) representsthe background magnitude distribution in class c, and f (r)represents the positional offset distribution due to positionalerrors in both catalogues (in this case we can assume thatthe optical positional errors are negligible compared withthose of SPIRE). We will describe the measurement of eachof these quantities in the following subsections.
3.1 Magnitude distributions
The normalized magnitude distribution n(m) of SDSS ob-jects (either stars or galaxies) describes the probability den-sity that a given optical source has magnitude m. We mustalso measure the distribution q(m), which describes theprobability density that the true optical counterpart to agiven SPIRE source has magnitude m. This is given by nor-malizing the magnitude histogram of all true counterparts,nreal(m), and scaling by the overall probability Q0 that thecounterpart is detected in SDSS:
q(m) = Q0nreal(m)∑m nreal(m)
. (6)
The top panel of Fig. 3 illustrates the magnitude histogramsof various samples used to estimate this. The magnitudedistribution of true counterparts, nreal(m), was measuredby taking the magnitude histogram of all optical sourceswithin 10 arcsec of any SPIRE position [solid histograms;ntotal(m)], and subtracting the background magnitude his-togram of all optical sources scaled to the same search area[dotted histograms; nbkgrd(m)]. Each of these histograms ismeasured separately for stars and extragalactic sources asshown in Fig. 3, since the optical magnitudes of submm-detected stars and of submm-detected galaxies are very dif-ferent (as shown in the middle panel).
3.1.1 The normalization Q0
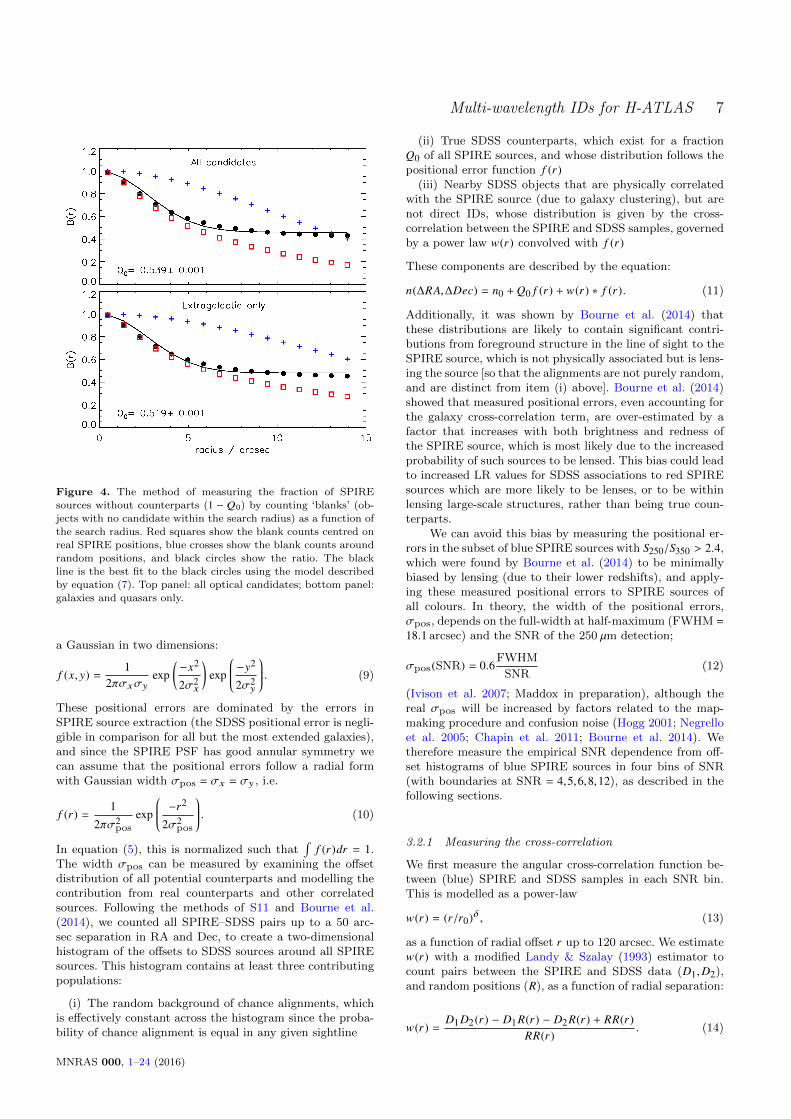
The normalization of the probability distribution q(m) is Q0,which is equal to the fraction of all true counterparts whichare above the SDSS magnitude limit. This was calculatedseparately for stars and for extragalactic objects followingthe method of Fleuren et al. (2012). This method involvesmeasuring 1−Q0 by counting blanks (sources without coun-terparts) as a function of search radius, thus removing thepossibility of bias due to clustering or multiple counterparts(which would boost a direct measurement of Q0). The num-ber of blanks as a function of search radius is plotted inFig. 4, and we fit this with the model
B(r) = 1 − Q0F (r) (7)
(Fleuren et al. 2012), where F (r) is the distribution of radialoffsets to counterparts, given by
F (r) =∫ r
02πr′ f (r′)dr′ = 1 − exp(−r2/2σ2), (8)
and f (r) is the Gaussian positional error function defined byequation (10) in Section 3.2. We thus measure Q0 = 0.519 ±0.001 for QSOs and galaxies, while for stars we measureQ0 = 0.020± 0.002. In comparison, S11 measured Q0 = 0.583for galaxies and Q0 = 0.010 for unresolved sources (bothstars and QSOs), using about 10 per cent of the data usedhere. The decrease in Q0 for galaxies between the SDP (S11)and the current DR1 data can be explained by the increaseddepth of the catalogues (28mJy on average compared with32mJy in SDP, leading to a higher fraction of high-redshiftsubmm sources without SDSS counterparts), combined withthe fact that our method accounts for the bias caused byclustering and multiple sources (while S11 did not), whichis likely to affect the Q0 for galaxies.
We can show this by instead calibrating Q0 from thenormalization of the magnitude histograms (as in S11), giv-ing Q0 = 0.616 for galaxies, suggesting that the level of biasfrom clustering and multiple sources is significant. A furtherindependent measurement can be obtained from the normal-ization of the positional offset histograms (see Section 3.2).This measurement is Q0 = 0.548 ± 0.009 for galaxies, whichaccounts for clustering via a cross-correlation term but canstill be boosted by multiple counterparts, unlike the blanksmethod. Comparing the various methods, we might suggestthat Q0 can be boosted by 0.03 due to multiplicity, and by afurther 0.07 due to clustering, although these estimates arerough and dependent on the models assumed (for examplethe power-law correlation function assumed in Section 3.2).We will discuss the sensitivity of the results to the value ofQ0 in Section 4.4.
Field-to-field variance is also likely to be significant be-tween the 16 deg2 SDP field and the 161 deg2 in DR1, andthis probably accounts for the different measurements forstars. The three GAMA fields sample quite different Galac-tic latitudes and hence sight-lines through the disk and haloof the Milky Way: GAMA9 is at b = +28, GAMA12 is atb = +60 and GAMA15 is at b = +54. The standard deviationin Q0 from the blanks method between the three DR1 fields(each ≈53 deg2) is 0.011 for galaxies and 0.011 for stars.
3.1.2 Application to the likelihood ratios
We take the difference between the SPIRE-centred and back-ground magnitude histograms, nreal(m), and normalize thisto Q0 to give q(m), as shown in the middle panel of Fig. 3.In calculating the LR for extragalactic candidates, we usethe measured q(m)/n(m) distribution for r-band magnitudesm > 14.0, but at brighter magnitudes the distribution is notwell sampled and we assume a constant q(m)/n(m) equal tothe average of q(m)/n(m) at m < 14.0. The same method isused for stellar candidates, except that the threshold mustbe set at m = 21.5 because there are too few to measure themagnitude distributions at m < 21.5. The measured distri-butions of q(m)/n(m) are shown by the histograms on thelower panel of Fig. 3, while the constant values adopted forbright magnitudes are indicated by the horizontal dashed
MNRAS 000, 1–24 (2016)

6 N. Bourne et al.
lines. In this respect our method differs from S11, who as-sumed a constant q(m) for stars [as opposed to constantq(m)/n(m)], which would lead to a higher LR for brighterstars compared with fainter ones since n(m) rises towardsfainter magnitudes. Our assumption of flat q(m)/n(m) atm < 21.5 instead leads stars to have an LR independentof magnitude. Our motivations for this choice are (i) thatthe use of a constant q(m) [hence non-constant q(m)/n(m)]at m < 21.5 would lead to a discontinuity in the lower panelof Fig. 3 where the decreasing q(m)/n(m) at increasing mmeets the measurements at m > 21.5 which are relativelyhigh; and (ii) that we do not necessarily expect any corre-spondence between optical magnitude and the detectabilityof a star at 250µm.
This last point deserves some explanation. The submmemission associated with stars is likely to come from debrisdiscs or dust in outflows and so may not be directly re-lated to the photospheric optical luminosity. We might stillexpect a correlation between optical and submm fluxes be-cause the dust emission in these systems is simply repro-cessed starlight, and also because the flux in both wave-bands depends on distance. However, there is a large amountof scatter in the masses and temperatures of debris discsaround stars of a given spectral type (Hillenbrand et al.2008; Carpenter et al. 2009), and H-ATLAS will detect onlythe brightest of these (Thompson et al. 2010). The statisticsof H-ATLAS-detected stars will therefore be highly stochas-tic and any correlation between submm detectability andoptical magnitude is likely to be broken. The effect of thisassumption on LR statistics is discussed in Section 4.5.
Finally, in Section 4.2 we visually check the positionsof bright stars to ensure none are missing from the ID cata-logue. We find that the few bright stars detected at 250µmare successfully identified by the LR procedure, and noneof them are missing from the SDSS catalogue. This indi-cates that the measured q(m) for bright stars is not under-estimated due to incompleteness of SDSS at bright magni-tudes.
3.2 Positional offset distributions
The final ingredient for measuring the LR of each poten-tial counterpart is the probability that a real counterpart isfound at the measured radial separation r from the SPIREsource. For the purposes of assigning likelihood ratios tocounterparts we make the simplifying assumption that allH-ATLAS sources are point-like in the 250 µm maps fromwhich they were extracted, with a beam full-width at half-maximum of 18.1 arcsec. This assumption is justified by thefact that a maximum of two per cent of the sources are re-solved,4 and that these will be galaxies at z < 0.05 withbright, unambiguous SDSS counterparts.
The distribution of angular separations (∆RA,∆Dec) oftrue counterparts follows the probability distribution func-tion of random positional errors, which can be described by
4 This is the fraction (2572/113997) of SPIRE 250-µm sourceswhich have reliable optical counterparts with r < 19 and ISOA r>
10 arcsec, although only 710 of them are treated as resolved forphotometry purposes in Paper I, while the number of sources that
are significantly extended beyond a single beam is much smaller.
Figure 3. The method of measuring the r -band magnitude distri-
bution of true counterparts. Top panel: magnitude distribution ofSDSS objects within 10 arcsec of all SPIRE positions (solid lines)
divided into galaxies and quasars (magenta) and stars (blue), andthe total (heavy black line). The background magnitude distribu-
tions of SDSS (normalized to the same search area) are given
by the dashed lines (the background distribution of stars closelyfollows that of SPIRE centres). Middle panel: the magnitude dis-
tribution of true counterparts q (m) is given by the difference be-
tween SPIRE and random distributions above, normalized to Q0.Bottom panel: the ratio of the magnitude distribution of true
counterparts to that of background objects is used in the calcula-
tion of LR in equation (5). At magnitudes m < 14.0 (galaxies) andm < 21.5 (stars) the value of q (m)/n(m) is fixed at the average
within this range, as shown by the horizontal dashed lines.
MNRAS 000, 1–24 (2016)
Multi-wavelength IDs for H-ATLAS 7
Figure 4. The method of measuring the fraction of SPIRE
sources without counterparts (1 − Q0) by counting ‘blanks’ (ob-jects with no candidate within the search radius) as a function of
the search radius. Red squares show the blank counts centred on
real SPIRE positions, blue crosses show the blank counts aroundrandom positions, and black circles show the ratio. The black
line is the best fit to the black circles using the model describedby equation (7). Top panel: all optical candidates; bottom panel:
galaxies and quasars only.
a Gaussian in two dimensions:
f (x, y) =1
2πσxσyexp
(−x2
2σ2x
)exp
−y2
2σ2y
. (9)
These positional errors are dominated by the errors inSPIRE source extraction (the SDSS positional error is negli-gible in comparison for all but the most extended galaxies),and since the SPIRE PSF has good annular symmetry wecan assume that the positional errors follow a radial formwith Gaussian width σpos = σx = σy , i.e.
f (r) =1
2πσ2pos
exp
−r2
2σ2pos
. (10)
In equation (5), this is normalized such that∫
f (r)dr = 1.The width σpos can be measured by examining the offsetdistribution of all potential counterparts and modelling thecontribution from real counterparts and other correlatedsources. Following the methods of S11 and Bourne et al.(2014), we counted all SPIRE–SDSS pairs up to a 50 arc-sec separation in RA and Dec, to create a two-dimensionalhistogram of the offsets to SDSS sources around all SPIREsources. This histogram contains at least three contributingpopulations:
(i) The random background of chance alignments, whichis effectively constant across the histogram since the proba-bility of chance alignment is equal in any given sightline
(ii) True SDSS counterparts, which exist for a fractionQ0 of all SPIRE sources, and whose distribution follows thepositional error function f (r)
(iii) Nearby SDSS objects that are physically correlatedwith the SPIRE source (due to galaxy clustering), but arenot direct IDs, whose distribution is given by the cross-correlation between the SPIRE and SDSS samples, governedby a power law w(r) convolved with f (r)
These components are described by the equation:
n(∆RA,∆Dec) = n0 +Q0 f (r) + w(r) ∗ f (r). (11)
Additionally, it was shown by Bourne et al. (2014) thatthese distributions are likely to contain significant contri-butions from foreground structure in the line of sight to theSPIRE source, which is not physically associated but is lens-ing the source [so that the alignments are not purely random,and are distinct from item (i) above]. Bourne et al. (2014)showed that measured positional errors, even accounting forthe galaxy cross-correlation term, are over-estimated by afactor that increases with both brightness and redness ofthe SPIRE source, which is most likely due to the increasedprobability of such sources to be lensed. This bias could leadto increased LR values for SDSS associations to red SPIREsources which are more likely to be lenses, or to be withinlensing large-scale structures, rather than being true coun-terparts.
We can avoid this bias by measuring the positional er-rors in the subset of blue SPIRE sources with S250/S350 > 2.4,which were found by Bourne et al. (2014) to be minimallybiased by lensing (due to their lower redshifts), and apply-ing these measured positional errors to SPIRE sources ofall colours. In theory, the width of the positional errors,σpos, depends on the full-width at half-maximum (FWHM =18.1 arcsec) and the SNR of the 250 µm detection;
σpos(SNR) = 0.6FWHM
SNR(12)
(Ivison et al. 2007; Maddox in preparation), although thereal σpos will be increased by factors related to the map-making procedure and confusion noise (Hogg 2001; Negrelloet al. 2005; Chapin et al. 2011; Bourne et al. 2014). Wetherefore measure the empirical SNR dependence from off-set histograms of blue SPIRE sources in four bins of SNR(with boundaries at SNR = 4,5,6,8,12), as described in thefollowing sections.
3.2.1 Measuring the cross-correlation
We first measure the angular cross-correlation function be-tween (blue) SPIRE and SDSS samples in each SNR bin.This is modelled as a power-law
w(r) = (r/r0)δ , (13)
as a function of radial offset r up to 120 arcsec. We estimatew(r) with a modified Landy & Szalay (1993) estimator tocount pairs between the SPIRE and SDSS data (D1,D2),and random positions (R), as a function of radial separation:
w(r) =D1D2(r) − D1R(r) − D2R(r) + RR(r)
RR(r). (14)
MNRAS 000, 1–24 (2016)
8 N. Bourne et al.
The results are combined across all fields and are shown inFig. 5 for each SNR bin. The expected power-law behaviouris seen at large radii, although the apparent steepening atsmall radii may be due to bias from the offsets to true asso-ciations, which would follow the distribution f (r). To avoidthis possibility we fit the data at r > 10 arcsec and finda power-law index consistent with −0.7 ± 0.1 in each SNRbin (equal to the expected value for galaxies, e.g. Connollyet al. 2002). We therefore fix the index to this value and ob-tain best-fitting values for the correlation length as shownin Table 2.
3.2.2 Measuring the positional errors
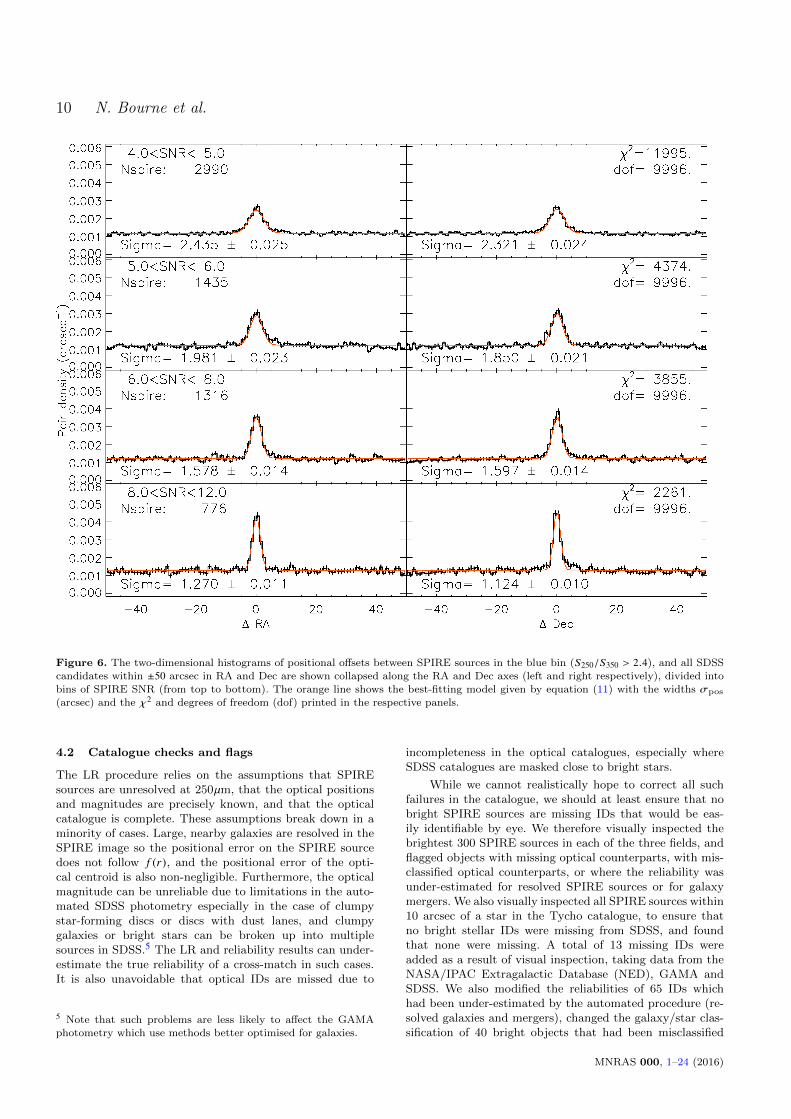
Finally we fit the two-dimensional histograms of ∆RA and∆Dec separations with the model in equation (11), fixingw(r) with the power-law parameters described above, andsolving for the widths (σpos,RA,σpos,Dec) of the Gaussianf (r), the background level n0 and the normalization Q0. Wedo this in each of the SNR bins, using only blue sources withS250/S350 > 2.4, to avoid the lensing-related biases discussedin Bourne et al. (2014) and in Section 3.2 above. The fit-ting is performed on the two-dimensional histograms, andin Fig. 6 we show the histograms and best-fitting modelscollapsed along the ∆RA and ∆Dec axes for visual inspec-tion. The fitting results are summarised in Table 2. Notethat the normalization (Q0) fitted to these histograms dif-fers from the results in Section 3.1.1 because it depends onboth SPIRE colour and SNR, but this normalization canalso be boosted by the existence of multiple counterparts.We will investigate the dependence of our ID results on themeasurement of Q0 in Section 4.4.
Bourne et al. (2014) showed the colour dependence ofthe width σpos by dividing the sample into six bins of colourand four of SNR. We repeat this analysis on the matched-filter catalogues used here and show the best-fitting σpos val-ues in each bin in Fig. 7. In this analysis the bluest colour bincontains the results shown in Fig. 6. The increasing σpos andweakening SNR dependence in redder colour bins demon-strates the bias which is likely due to lensing, and the needto measure the true value of σpos using blue SPIRE sourcesonly.
To describe the SNR dependence of the positional errorwe fit the best-fitting σpos values as a function of mean SNRwith the function
σpos(SNR) = σpos(5) [SNR/5]α . (15)
The dotted lines in Fig. 7 show the best-fitting power-lawmodels in each colour bin. Combining results from the ∆RAand ∆Dec offsets in the bluest bin (S250/S350 > 2.4), we con-clude that the positional error for SPIRE sources at SNR = 5is σpos(5) = 2.10 ± 0.01 arcsec and that this decreases withSNR raised to the power α = −0.88 ± 0.01. This empiricalSNR dependence is very close to the theoretical inverse re-lation of equation (12), shown by the the thick grey linelabelled σth in Fig. 7. The fact that it is slightly shallowercould be explained by additional positional errors affectingthe brightest sources, such as a non-Gaussian PSF, the 6-arcsec pixel resolution of the 250µm map from which sourceswere extracted, and the fact that bright sources are not trulypoint-like at scales of . 3 arcsec. We use these measuredparameters in equation (15) to compute f (r) for the LR
Table 2. Best-fitting parameters in modelling SDSS positionaloffsets to blue SPIRE sources with S250/S350 > 2.4 in bins of
250 µm SNR
SNR NSPIRE r0/arcseca σpos/arcsecb,c Q0b
4–5 2990 0.20 ± 0.02 2.38 ± 0.02 0.792 ± 0.0085–6 1435 0.61 ± 0.05 1.91 ± 0.02 0.846 ± 0.0106–8 1316 0.38 ± 0.05 1.59 ± 0.01 0.944 ± 0.0088–12 776 0.38 ± 0.08 1.19 ± 0.01 0.985 ± 0.008
Notes: (a) normalization of the cross-correlation function, equa-
tion (13), with index δ = −0.7; (b) width σpos and normal-
ization Q0 in equation (11); (c) circularized values equal to√σpos (RA)σpos (Dec).
calculations, but we assign a minimum positional error of1 arcsec since the formula above would give unrealisticallysmall errors for the brightest sources. We also allow for largerpositional errors for more extended galaxies, which may beextended in the submm as well as having a larger uncertaintyon the optical position. For galaxies with r-band magnitudem < 20.5 we add (in quadrature) a positional error equalto five per cent of the r-band ISOA parameter (isophotalsemimajor axis) from SDSS.
3.2.3 Robustness of the positional errors
The positional error for a 5-σ source given above (2.10 ±0.01 arcsec) differs from the value of 2.40 ± 0.09 arcsec usedin the SDP (S11) for the following reasons: firstly S11 mea-sured σpos for all sources with SNR> 5, rather than binningby SNR and colour, which would lead them to measure alarger overall σpos due to the bias from red sources as dis-cussed above. Additionally, the use of a matched filter in theDR1 source extraction has improved the positional accuracycompared with the PSF-filtering used in SDP (Paper I), andthis reduces the measured σpos. We validated our σpos mea-surement by using the same flux cut as S11 on cataloguesmade from PSF-filtered DR1 maps, with no SNR/colour bin-ning, and found a value of σpos = 2.39 arcsec, consistent with2.40 arcsec in S11.
It is apparent in Fig. 5 that there is the potential fordegeneracy between the parameters of the cross-correlation(which dominates radial separations on large scales) andthose of the positional error (which dominates on smallscales). To test what effect the fit to the cross-correlationhas on the fit for σpos, we compare the results given byfitting the cross-correlation on different scales. The resultsgiven above were obtained from a cross-correlation fit witha slope of δ = −0.7 on scales r > 10 arcsec. If we fit the cross-correlation to scales of r > 5 arcsec we obtain a slope of −1.9(r0 = 5.23 arcsec) and the resulting change in the fit for thepositional error with this alternative w(r) is such that σpos
is reduced by a factor 0.91, and f (r) and L would thereforebe boosted by a factor 0.97. We therefore conclude that ourresults are not strongly affected by the choice of correlationfunction assumed.
MNRAS 000, 1–24 (2016)

Multi-wavelength IDs for H-ATLAS 9
Figure 5. Cross correlations between the SPIRE 250-µm positions in bins of SNR and the SDSS positions across the three fields. Error
bars represent Poisson counting errors. The power-law fits shown include only the data at r > 10 arcsec in order to remove any bias from
the true counterparts which are at smaller radii. In these fits the slopes are fixed to −0.7 and the best-fitting normalization parametersare given in Table 2.
4 RESULTS
4.1 Likelihood ratios and reliabilities
The likelihood ratio of every potential match within 10 arc-sec of each SPIRE source was calculated using equation (5),and the reliability Rj of each potential match was then com-puted as the ratio of its likelihood ratio L j to the sum oflikelihood ratios of all potential matches in addition to theprobability that there is no match; thus
Rj =L j∑
i Li + (1 − Q0)(16)
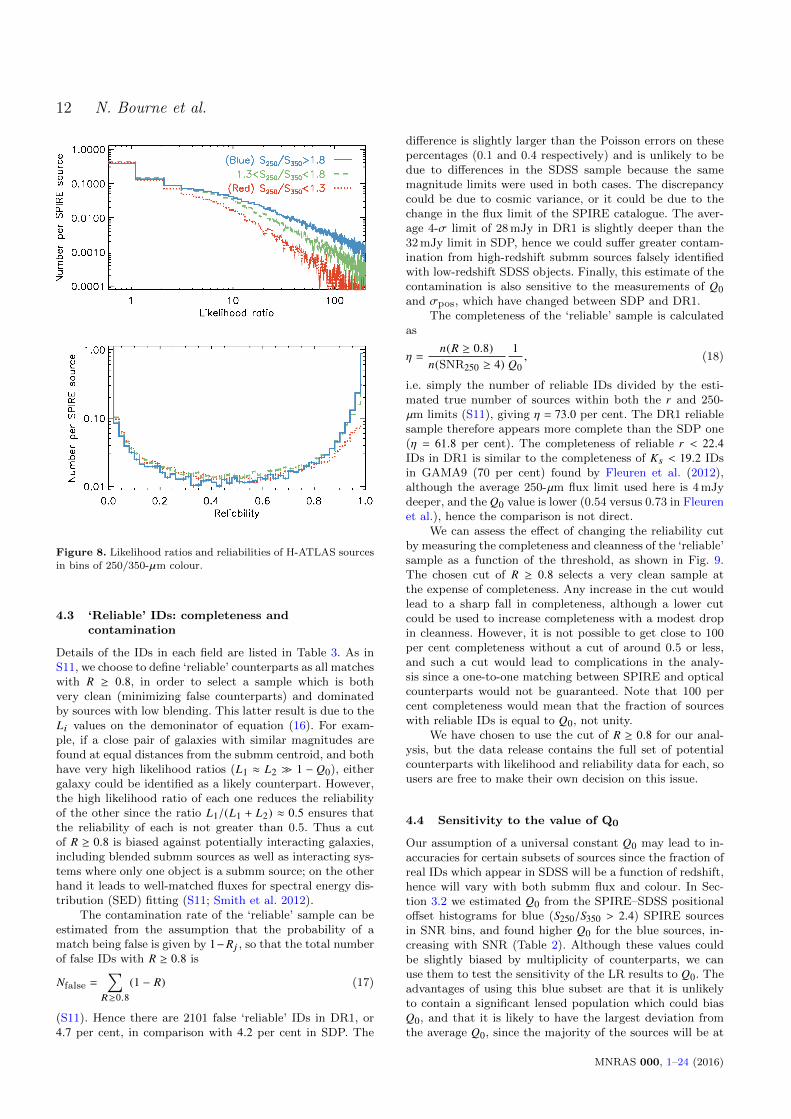
(Sutherland & Saunders 1992). The reliability of a matchtherefore takes into account other possible matches as wellas the probability (1 − Q0) that the true counterpart wasnot detected in the optical survey. The likelihood ratios andreliabilities of all potential counterparts are shown in Fig. 8
for three bins of submm colour. These show that the fractionof SPIRE sources with high-reliability counterparts is muchhigher for blue SPIRE sources than for red ones, which maybe explained by the increased probability that a red SPIREsource lies at high redshift, and/or by the increased probabil-ity that a red SPIRE source is the result of a blend betweentwo galaxies (both of which would therefore have lower re-liability than if there were only one). The figure also showsthat SPIRE sources of all colours have a large number oflow-reliability matches which are mostly likely to be chancealignments or correlated galaxies, but could still contributeto confusion noise in the submm (if they are submm emit-ters) since these matches are all within 10 arcsec.
MNRAS 000, 1–24 (2016)
10 N. Bourne et al.
Figure 6. The two-dimensional histograms of positional offsets between SPIRE sources in the blue bin (S250/S350 > 2.4), and all SDSS
candidates within ±50 arcsec in RA and Dec are shown collapsed along the RA and Dec axes (left and right respectively), divided intobins of SPIRE SNR (from top to bottom). The orange line shows the best-fitting model given by equation (11) with the widths σpos
(arcsec) and the χ2 and degrees of freedom (dof) printed in the respective panels.
4.2 Catalogue checks and flags
The LR procedure relies on the assumptions that SPIREsources are unresolved at 250µm, that the optical positionsand magnitudes are precisely known, and that the opticalcatalogue is complete. These assumptions break down in aminority of cases. Large, nearby galaxies are resolved in theSPIRE image so the positional error on the SPIRE sourcedoes not follow f (r), and the positional error of the opti-cal centroid is also non-negligible. Furthermore, the opticalmagnitude can be unreliable due to limitations in the auto-mated SDSS photometry especially in the case of clumpystar-forming discs or discs with dust lanes, and clumpygalaxies or bright stars can be broken up into multiplesources in SDSS.5 The LR and reliability results can under-estimate the true reliability of a cross-match in such cases.It is also unavoidable that optical IDs are missed due to
5 Note that such problems are less likely to affect the GAMA
photometry which use methods better optimised for galaxies.
incompleteness in the optical catalogues, especially whereSDSS catalogues are masked close to bright stars.
While we cannot realistically hope to correct all suchfailures in the catalogue, we should at least ensure that nobright SPIRE sources are missing IDs that would be eas-ily identifiable by eye. We therefore visually inspected thebrightest 300 SPIRE sources in each of the three fields, andflagged objects with missing optical counterparts, with mis-classified optical counterparts, or where the reliability wasunder-estimated for resolved SPIRE sources or for galaxymergers. We also visually inspected all SPIRE sources within10 arcsec of a star in the Tycho catalogue, to ensure thatno bright stellar IDs were missing from SDSS, and foundthat none were missing. A total of 13 missing IDs wereadded as a result of visual inspection, taking data from theNASA/IPAC Extragalactic Database (NED), GAMA andSDSS. We also modified the reliabilities of 65 IDs whichhad been under-estimated by the automated procedure (re-solved galaxies and mergers), changed the galaxy/star clas-sification of 40 bright objects that had been misclassified
MNRAS 000, 1–24 (2016)

Multi-wavelength IDs for H-ATLAS 11
Figure 7. Dependence of the positional error on SPIRE SNR and colour. Top panels: the best-fitting σpos values (RA, Dec, and thegeometric mean thereof) from the two-dimensional offset histograms, as a function of SPIRE SNR, for sources in six bins of 250-/350-µm
colour. The bluest bin is the data plotted in Fig. 6. Bottom: the same data plotted as a function of colour in the four SNR bins. The
dotted lines show the best-fitting power-law models for σpos as a function of SNR in each colour bin (top panels), and as a function ofcolour in each SNR bin (bottom panels).
Table 3. Results of ID analysis by field
H-ATLAS sample GAMA9 GAMA12 GAMA15 Total
SPIRE SNR250 ≥ 4 37612 36906 39479 113997SDSS candidates ≤ 10′′ 42770 40462 44898 128130
Reliable IDs (R ≥ 0.8) 14280 14900 15655 44835
Stars 95 224 103 422Galaxies 13864 14389 15199 43452
QSOs (spectroscopic) 159 203 248 610
QSOs (photometric) 162 84 105 351Spec-z 7422 7727 8589 23738
GAMA FUV detections 3618 4089 4698 12405
GAMA NUV detections 5344 5543 6449 17336GAMA r detections 7472 7655 8371 23498
GAMA K detections 7494 7669 8381 23544
GAMA W1 detections 7168 7457 8116 22741GAMA W4 detections 1587 1963 2786 6336
Note: photometric detections are defined as SNR ≥ 3 in the GAMA photometric catalogue (Driver et al. 2016). All counterparts are
detected in SDSS r by definition, but GAMA data are available only for counterparts with r < 19.8 which are classified as galaxies by
Baldry et al. (2010).
(mostly bright stars with saturated optical photometry), andremoved 28 optical counterparts that were found to be arte-facts or duplicates resulting from the breaking up of largegalaxies or bright stars in the SDSS catalogue (in generalthese had not been given high reliability, but occasionallythey affected the reliability of the true counterpart). Sinceall of these problems are associated with bright objects weare confident that their effect on the IDs of fainter sourcesthat were not inspected is small or negligible. In additionto those visually inspected, we searched SDSS DR8 for anymatches within 10 arcsec of SPIRE sources with no potentialcounterpart in the original optical catalogue (leading to 1105
additional optical candidates, all of which were visually con-firmed).6 The LR and reliability values were recalculated forall potential counterparts to SPIRE sources affected by theseadditions. The numbers in Table 3 reflect these changes, butthey are not included in the input samples described in Ta-ble 1.
6 Full details of all additions and flags are provided as part of thedata release.
MNRAS 000, 1–24 (2016)
12 N. Bourne et al.
Figure 8. Likelihood ratios and reliabilities of H-ATLAS sources
in bins of 250/350-µm colour.
4.3 ‘Reliable’ IDs: completeness andcontamination
Details of the IDs in each field are listed in Table 3. As inS11, we choose to define ‘reliable’ counterparts as all matcheswith R ≥ 0.8, in order to select a sample which is bothvery clean (minimizing false counterparts) and dominatedby sources with low blending. This latter result is due to theLi values on the demoninator of equation (16). For exam-ple, if a close pair of galaxies with similar magnitudes arefound at equal distances from the submm centroid, and bothhave very high likelihood ratios (L1 ≈ L2 1 − Q0), eithergalaxy could be identified as a likely counterpart. However,the high likelihood ratio of each one reduces the reliabilityof the other since the ratio L1/(L1 + L2) ≈ 0.5 ensures thatthe reliability of each is not greater than 0.5. Thus a cutof R ≥ 0.8 is biased against potentially interacting galaxies,including blended submm sources as well as interacting sys-tems where only one object is a submm source; on the otherhand it leads to well-matched fluxes for spectral energy dis-tribution (SED) fitting (S11; Smith et al. 2012).
The contamination rate of the ‘reliable’ sample can beestimated from the assumption that the probability of amatch being false is given by 1−Rj , so that the total numberof false IDs with R ≥ 0.8 is
Nfalse =∑
R≥0.8
(1 − R) (17)
(S11). Hence there are 2101 false ‘reliable’ IDs in DR1, or4.7 per cent, in comparison with 4.2 per cent in SDP. The
difference is slightly larger than the Poisson errors on thesepercentages (0.1 and 0.4 respectively) and is unlikely to bedue to differences in the SDSS sample because the samemagnitude limits were used in both cases. The discrepancycould be due to cosmic variance, or it could be due to thechange in the flux limit of the SPIRE catalogue. The aver-age 4-σ limit of 28 mJy in DR1 is slightly deeper than the32 mJy limit in SDP, hence we could suffer greater contam-ination from high-redshift submm sources falsely identifiedwith low-redshift SDSS objects. Finally, this estimate of thecontamination is also sensitive to the measurements of Q0and σpos, which have changed between SDP and DR1.
The completeness of the ‘reliable’ sample is calculatedas
η =n(R ≥ 0.8)
n(SNR250 ≥ 4)1
Q0, (18)
i.e. simply the number of reliable IDs divided by the esti-mated true number of sources within both the r and 250-µm limits (S11), giving η = 73.0 per cent. The DR1 reliablesample therefore appears more complete than the SDP one(η = 61.8 per cent). The completeness of reliable r < 22.4IDs in DR1 is similar to the completeness of Ks < 19.2 IDsin GAMA9 (70 per cent) found by Fleuren et al. (2012),although the average 250-µm flux limit used here is 4 mJydeeper, and the Q0 value is lower (0.54 versus 0.73 in Fleurenet al.), hence the comparison is not direct.
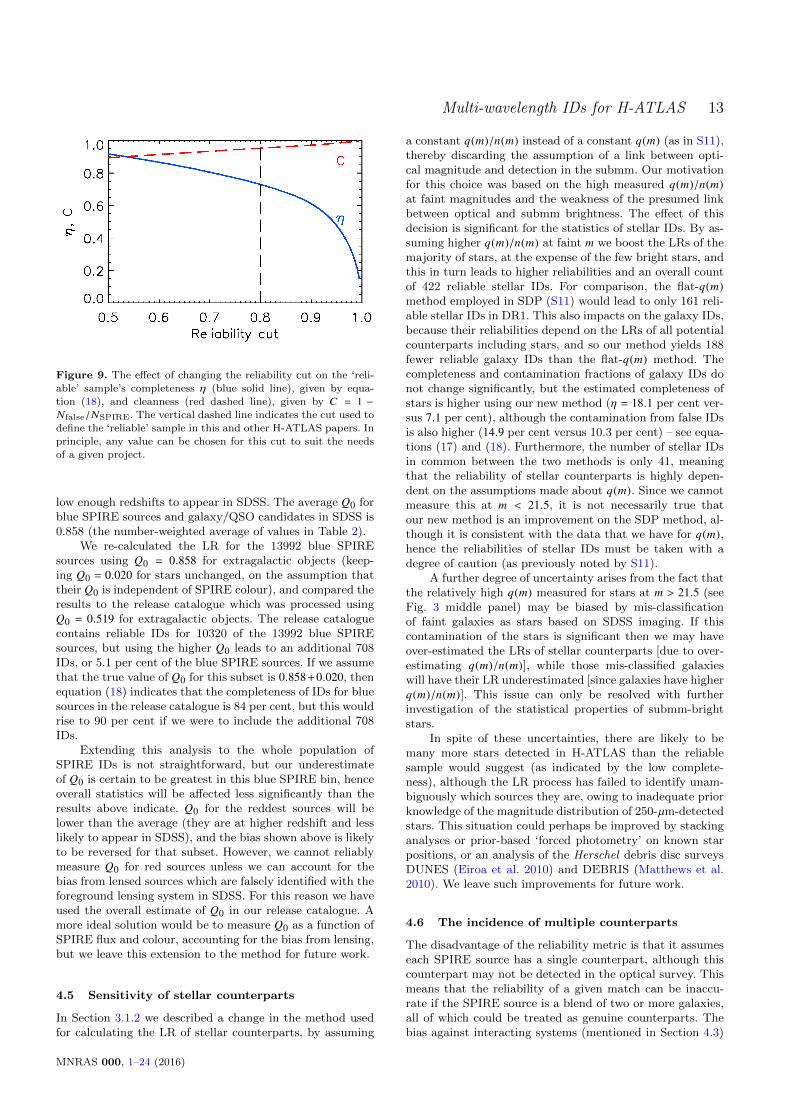
We can assess the effect of changing the reliability cutby measuring the completeness and cleanness of the ‘reliable’sample as a function of the threshold, as shown in Fig. 9.The chosen cut of R ≥ 0.8 selects a very clean sample atthe expense of completeness. Any increase in the cut wouldlead to a sharp fall in completeness, although a lower cutcould be used to increase completeness with a modest dropin cleanness. However, it is not possible to get close to 100per cent completeness without a cut of around 0.5 or less,and such a cut would lead to complications in the analy-sis since a one-to-one matching between SPIRE and opticalcounterparts would not be guaranteed. Note that 100 percent completeness would mean that the fraction of sourceswith reliable IDs is equal to Q0, not unity.
We have chosen to use the cut of R ≥ 0.8 for our anal-ysis, but the data release contains the full set of potentialcounterparts with likelihood and reliability data for each, sousers are free to make their own decision on this issue.
4.4 Sensitivity to the value of Q0
Our assumption of a universal constant Q0 may lead to in-accuracies for certain subsets of sources since the fraction ofreal IDs which appear in SDSS will be a function of redshift,hence will vary with both submm flux and colour. In Sec-tion 3.2 we estimated Q0 from the SPIRE–SDSS positionaloffset histograms for blue (S250/S350 > 2.4) SPIRE sourcesin SNR bins, and found higher Q0 for the blue sources, in-creasing with SNR (Table 2). Although these values couldbe slightly biased by multiplicity of counterparts, we canuse them to test the sensitivity of the LR results to Q0. Theadvantages of using this blue subset are that it is unlikelyto contain a significant lensed population which could biasQ0, and that it is likely to have the largest deviation fromthe average Q0, since the majority of the sources will be at
MNRAS 000, 1–24 (2016)
Multi-wavelength IDs for H-ATLAS 13
Figure 9. The effect of changing the reliability cut on the ‘reli-
able’ sample’s completeness η (blue solid line), given by equa-tion (18), and cleanness (red dashed line), given by C = 1 −Nfalse/NSPIRE. The vertical dashed line indicates the cut used to
define the ‘reliable’ sample in this and other H-ATLAS papers. Inprinciple, any value can be chosen for this cut to suit the needs
of a given project.
low enough redshifts to appear in SDSS. The average Q0 forblue SPIRE sources and galaxy/QSO candidates in SDSS is0.858 (the number-weighted average of values in Table 2).
We re-calculated the LR for the 13992 blue SPIREsources using Q0 = 0.858 for extragalactic objects (keep-ing Q0 = 0.020 for stars unchanged, on the assumption thattheir Q0 is independent of SPIRE colour), and compared theresults to the release catalogue which was processed usingQ0 = 0.519 for extragalactic objects. The release cataloguecontains reliable IDs for 10320 of the 13992 blue SPIREsources, but using the higher Q0 leads to an additional 708IDs, or 5.1 per cent of the blue SPIRE sources. If we assumethat the true value of Q0 for this subset is 0.858+0.020, thenequation (18) indicates that the completeness of IDs for bluesources in the release catalogue is 84 per cent, but this wouldrise to 90 per cent if we were to include the additional 708IDs.
Extending this analysis to the whole population ofSPIRE IDs is not straightforward, but our underestimateof Q0 is certain to be greatest in this blue SPIRE bin, henceoverall statistics will be affected less significantly than theresults above indicate. Q0 for the reddest sources will belower than the average (they are at higher redshift and lesslikely to appear in SDSS), and the bias shown above is likelyto be reversed for that subset. However, we cannot reliablymeasure Q0 for red sources unless we can account for thebias from lensed sources which are falsely identified with theforeground lensing system in SDSS. For this reason we haveused the overall estimate of Q0 in our release catalogue. Amore ideal solution would be to measure Q0 as a function ofSPIRE flux and colour, accounting for the bias from lensing,but we leave this extension to the method for future work.
4.5 Sensitivity of stellar counterparts
In Section 3.1.2 we described a change in the method usedfor calculating the LR of stellar counterparts, by assuming
a constant q(m)/n(m) instead of a constant q(m) (as in S11),thereby discarding the assumption of a link between opti-cal magnitude and detection in the submm. Our motivationfor this choice was based on the high measured q(m)/n(m)at faint magnitudes and the weakness of the presumed linkbetween optical and submm brightness. The effect of thisdecision is significant for the statistics of stellar IDs. By as-suming higher q(m)/n(m) at faint m we boost the LRs of themajority of stars, at the expense of the few bright stars, andthis in turn leads to higher reliabilities and an overall countof 422 reliable stellar IDs. For comparison, the flat-q(m)method employed in SDP (S11) would lead to only 161 reli-able stellar IDs in DR1. This also impacts on the galaxy IDs,because their reliabilities depend on the LRs of all potentialcounterparts including stars, and so our method yields 188fewer reliable galaxy IDs than the flat-q(m) method. Thecompleteness and contamination fractions of galaxy IDs donot change significantly, but the estimated completeness ofstars is higher using our new method (η = 18.1 per cent ver-sus 7.1 per cent), although the contamination from false IDsis also higher (14.9 per cent versus 10.3 per cent) – see equa-tions (17) and (18). Furthermore, the number of stellar IDsin common between the two methods is only 41, meaningthat the reliability of stellar counterparts is highly depen-dent on the assumptions made about q(m). Since we cannotmeasure this at m < 21.5, it is not necessarily true thatour new method is an improvement on the SDP method, al-though it is consistent with the data that we have for q(m),hence the reliabilities of stellar IDs must be taken with adegree of caution (as previously noted by S11).
A further degree of uncertainty arises from the fact thatthe relatively high q(m) measured for stars at m > 21.5 (seeFig. 3 middle panel) may be biased by mis-classificationof faint galaxies as stars based on SDSS imaging. If thiscontamination of the stars is significant then we may haveover-estimated the LRs of stellar counterparts [due to over-estimating q(m)/n(m)], while those mis-classified galaxieswill have their LR underestimated [since galaxies have higherq(m)/n(m)]. This issue can only be resolved with furtherinvestigation of the statistical properties of submm-brightstars.
In spite of these uncertainties, there are likely to bemany more stars detected in H-ATLAS than the reliablesample would suggest (as indicated by the low complete-ness), although the LR process has failed to identify unam-biguously which sources they are, owing to inadequate priorknowledge of the magnitude distribution of 250-µm-detectedstars. This situation could perhaps be improved by stackinganalyses or prior-based ‘forced photometry’ on known starpositions, or an analysis of the Herschel debris disc surveysDUNES (Eiroa et al. 2010) and DEBRIS (Matthews et al.2010). We leave such improvements for future work.
4.6 The incidence of multiple counterparts
The disadvantage of the reliability metric is that it assumeseach SPIRE source has a single counterpart, although thiscounterpart may not be detected in the optical survey. Thismeans that the reliability of a given match can be inaccu-rate if the SPIRE source is a blend of two or more galaxies,all of which could be treated as genuine counterparts. Thebias against interacting systems (mentioned in Section 4.3)
MNRAS 000, 1–24 (2016)

14 N. Bourne et al.
is especially relevant since many bright far-IR sources areknown to be interacting (e.g. Bettoni et al. 2012).
It is difficult to reliably estimate the fraction of SPIREsources which have multiple genuine counterparts. One canstart by comparing the results of using the likelihood ratio(LR) instead of the reliability to define counterparts (S11),since the LR contains no information on the existence ofother potential counterparts but simply gives the ratio of theprobability of a single potential match to that of a chancealignment. In cases where there is only one potential ID,equation (16) implies that an LR of 1.924 corresponds to thethreshold R = 0.8 for galaxy matches (Q0 = 0.519). Hence,to avoid the effects of multiplicity on the reliable IDs wecould apply this LR cut and find 50421 extragalactic IDs, ofwhich 6539 (13.0 per cent) fail the R ≥ 0.8 threshold. Theseadditional IDs could be considered candidates for sourceswith multiple counterparts which have been missed by thereliability cut, although in reality these will be a mixtureof true multiples (mergers, pairs and close groups) as wellas chance alignments where the single true counterpart isambiguous.
An alternative approach is to suggest that multiplecounterparts are missed by the requirement for a singlematch to have R ≥ 0.8, but can be recovered by assum-ing that the sum of their reliabilities meets this threshold(Fleuren et al. 2012). In DR1, 3483 SPIRE sources havemultiple extragalactic counterparts whose
∑R ≥ 0.8, but for
which no single counterpart meets the threshold. This esti-mate for the missed multiple counterparts is smaller thanthat from the LR threshold (6539), because there will besystems where multiple low-reliability (but high-LR) coun-terparts do not have a high combined reliability. FollowingFleuren et al. (2012), we can further clean this list of can-didate multiple counterparts by selecting only those withspectroscopic redshifts which agree within five per cent, orphotometric redshifts within ten per cent, in order to excludechance alignments. This requirement reduces the numberto 2071 SPIRE sources with multiple extragalactic counter-parts at the same redshift. This is a small fraction of thetotal number of reliable IDs, so we can conclude that mostSPIRE sources in H-ATLAS have single galaxy IDs.7
A related issue is the incompleteness of the sample dueto multiplicity, which results from the fact that additionalcandidates in the search radius reduce the reliability of thetrue counterpart. Fleuren et al. (2012) estimated this incom-pleteness by comparing the fraction of reliable IDs amongall SPIRE sources with one candidate, those with two can-didates, and so on. In Table 4 we show these fractions forSPIRE 250-µm sources with between 0 and 10 candidates,including either all candidates or only extragalactic ones.For example, 49057 SPIRE sources have only one potentialcounterpart within 10 arcsec from the full optical catalogue,and of these 52 per cent are reliable IDs; 24194 have twopotential counterparts but of these 58 per cent are reliable,suggesting that sources are more likely to be assigned an IDif there are two candidates in the search radius. The frac-tion of reliable counterparts then falls for increasing numbers
7 Note that the fraction of submm sources with multiple IDs willdepend on the flux density regime being considered and on the
redshifts of the sources.
Table 4. Number of SPIRE sources and the subset of those withreliable IDs, as a function of the number (p) of candidate IDs
within the 10-arcsec search radius [counting either all candidatesor extragalactic (xgal) candidates only].
With p candidates: With p xgal candidates:
p NSPIRE Nrel NSPIRE Nrel
0 31394 0 (0%) 41142 0 (0%)
1 49057 25648 (52%) 49898 30669 (61%)
2 24194 14026 (58%) 18013 11043 (61%)3 7365 4075 (55%) 4109 2245 (55%)
4 1661 897 (54%) 722 366 (51%)
5 280 123 (44%) 96 41 (43%)6 39 18 (46%) 12 5 (42%)
7 4 2 (50%) 2 1 (50%)
8 3 1 (33%) 3 1 (33%)9 0 0 (–) 0 0 (–)
of potential candidates. Looking at extragalactic candidatesonly, the fraction of reliable counterparts is 61 per cent whenthere is only one candidate, and this fraction falls when morecandidates are available. One might ask why the fall was notseen when counting all candidates, and we suggest that thereason is that the reliable fraction of sources with only onecandidate ID is depressed by the fact that a disproportion-ate number of stellar IDs fall in this bin (stars tend to beisolated), and their reliabilities are generally lower.
The falling reliable fraction with increased number ofextragalactic candidates can be interpreted as incomplete-ness resulting from multiplicity. We can estimate this byadding up the total number of missing ‘reliable’ counterpartsfrom each row of the table, assuming that in each case theintrinsic number is 61 per cent of NSPIRE, and the result is408 missing IDs. Hence we conclude that the incompletenessof IDs resulting from multiplicity is small.
5 OPTICAL PROPERTIES OF H-ATLAS IDSIN SDSS
In this section we explore the properties of H-ATLAS sourceswith ‘reliable’ optical counterparts, using optical photome-try from SDSS and redshifts from the sources described inSection 2.2.2.
5.1 Redshifts and magnitudes
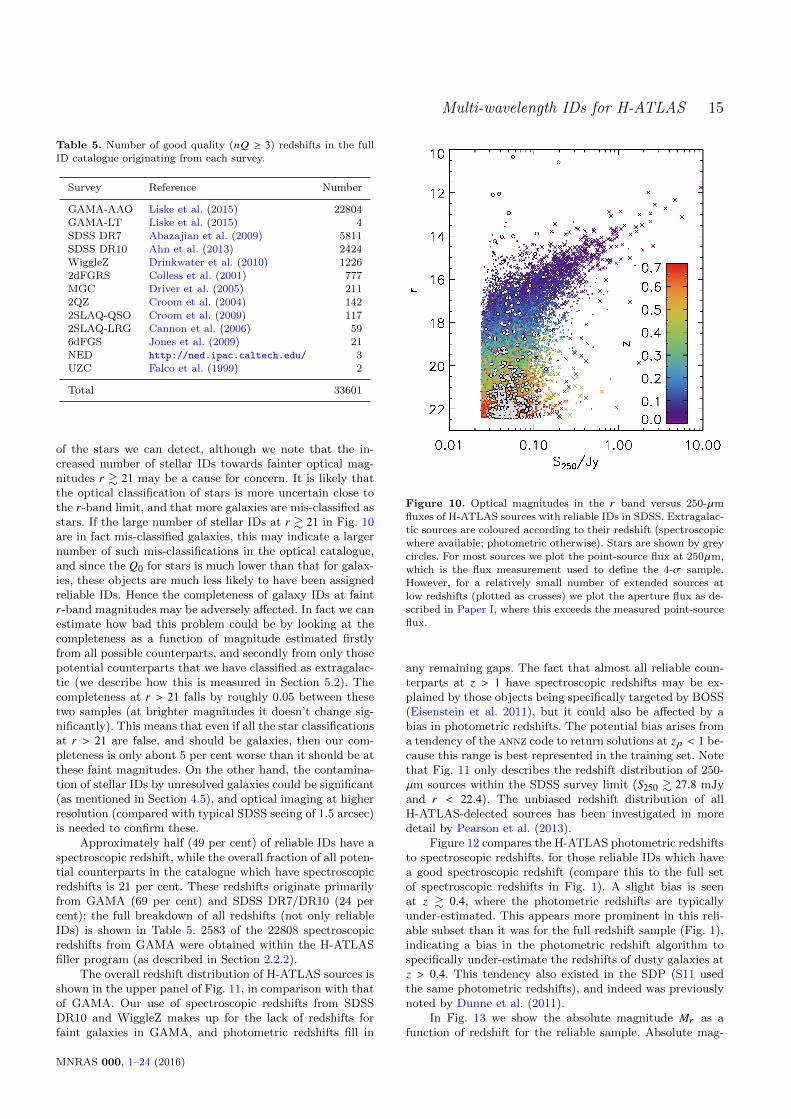
Figure 10 shows the relationship between optical magnitudeof all reliable SDSS counterparts, 250-µm flux and redshift(for extragalactic counterparts). The 250-µm flux is weaklycorrelated with redshift, in contrast with the optical magni-tude which is a strong function of redshift; this is a result ofthe differential k-corrections. Almost all of the bright sourcesin H-ATLAS with S250 & 200 mJy are at z < 0.1, but at lowerfluxes, sources are detected at all redshifts up to z ∼ 0.7 andthe upper limit in the redshift distribution is clearly a resultof the depth of SDSS rather than that of H-ATLAS.
Stellar counterparts, shown by grey circles on Fig. 10,exhibit no correlation between their optical and submmfluxes. As discussed in Section 3.1.2, we do not necessarilyexpect a correlation between the optical and submm fluxes
MNRAS 000, 1–24 (2016)
Multi-wavelength IDs for H-ATLAS 15
Table 5. Number of good quality (nQ ≥ 3) redshifts in the full
ID catalogue originating from each survey.
Survey Reference Number
GAMA-AAO Liske et al. (2015) 22804GAMA-LT Liske et al. (2015) 4
SDSS DR7 Abazajian et al. (2009) 5811
SDSS DR10 Ahn et al. (2013) 2424WiggleZ Drinkwater et al. (2010) 1226
2dFGRS Colless et al. (2001) 777
MGC Driver et al. (2005) 2112QZ Croom et al. (2004) 142
2SLAQ-QSO Croom et al. (2009) 117
2SLAQ-LRG Cannon et al. (2006) 596dFGS Jones et al. (2009) 21
NED http://ned.ipac.caltech.edu/ 3UZC Falco et al. (1999) 2
Total 33601
of the stars we can detect, although we note that the in-creased number of stellar IDs towards fainter optical mag-nitudes r & 21 may be a cause for concern. It is likely thatthe optical classification of stars is more uncertain close tothe r-band limit, and that more galaxies are mis-classified asstars. If the large number of stellar IDs at r & 21 in Fig. 10are in fact mis-classified galaxies, this may indicate a largernumber of such mis-classifications in the optical catalogue,and since the Q0 for stars is much lower than that for galax-ies, these objects are much less likely to have been assignedreliable IDs. Hence the completeness of galaxy IDs at faintr-band magnitudes may be adversely affected. In fact we canestimate how bad this problem could be by looking at thecompleteness as a function of magnitude estimated firstlyfrom all possible counterparts, and secondly from only thosepotential counterparts that we have classified as extragalac-tic (we describe how this is measured in Section 5.2). Thecompleteness at r > 21 falls by roughly 0.05 between thesetwo samples (at brighter magnitudes it doesn’t change sig-nificantly). This means that even if all the star classificationsat r > 21 are false, and should be galaxies, then our com-pleteness is only about 5 per cent worse than it should be atthese faint magnitudes. On the other hand, the contamina-tion of stellar IDs by unresolved galaxies could be significant(as mentioned in Section 4.5), and optical imaging at higherresolution (compared with typical SDSS seeing of 1.5 arcsec)is needed to confirm these.
Approximately half (49 per cent) of reliable IDs have aspectroscopic redshift, while the overall fraction of all poten-tial counterparts in the catalogue which have spectroscopicredshifts is 21 per cent. These redshifts originate primarilyfrom GAMA (69 per cent) and SDSS DR7/DR10 (24 percent); the full breakdown of all redshifts (not only reliableIDs) is shown in Table 5. 2583 of the 22808 spectroscopicredshifts from GAMA were obtained within the H-ATLASfiller program (as described in Section 2.2.2).
The overall redshift distribution of H-ATLAS sources isshown in the upper panel of Fig. 11, in comparison with thatof GAMA. Our use of spectroscopic redshifts from SDSSDR10 and WiggleZ makes up for the lack of redshifts forfaint galaxies in GAMA, and photometric redshifts fill in
Figure 10. Optical magnitudes in the r band versus 250-µmfluxes of H-ATLAS sources with reliable IDs in SDSS. Extragalac-
tic sources are coloured according to their redshift (spectroscopic
where available; photometric otherwise). Stars are shown by greycircles. For most sources we plot the point-source flux at 250µm,
which is the flux measurement used to define the 4-σ sample.
However, for a relatively small number of extended sources atlow redshifts (plotted as crosses) we plot the aperture flux as de-
scribed in Paper I, where this exceeds the measured point-source
flux.
any remaining gaps. The fact that almost all reliable coun-terparts at z > 1 have spectroscopic redshifts may be ex-plained by those objects being specifically targeted by BOSS(Eisenstein et al. 2011), but it could also be affected by abias in photometric redshifts. The potential bias arises froma tendency of the annz code to return solutions at zp < 1 be-cause this range is best represented in the training set. Notethat Fig. 11 only describes the redshift distribution of 250-µm sources within the SDSS survey limit (S250 & 27.8 mJyand r < 22.4). The unbiased redshift distribution of allH-ATLAS-delected sources has been investigated in moredetail by Pearson et al. (2013).
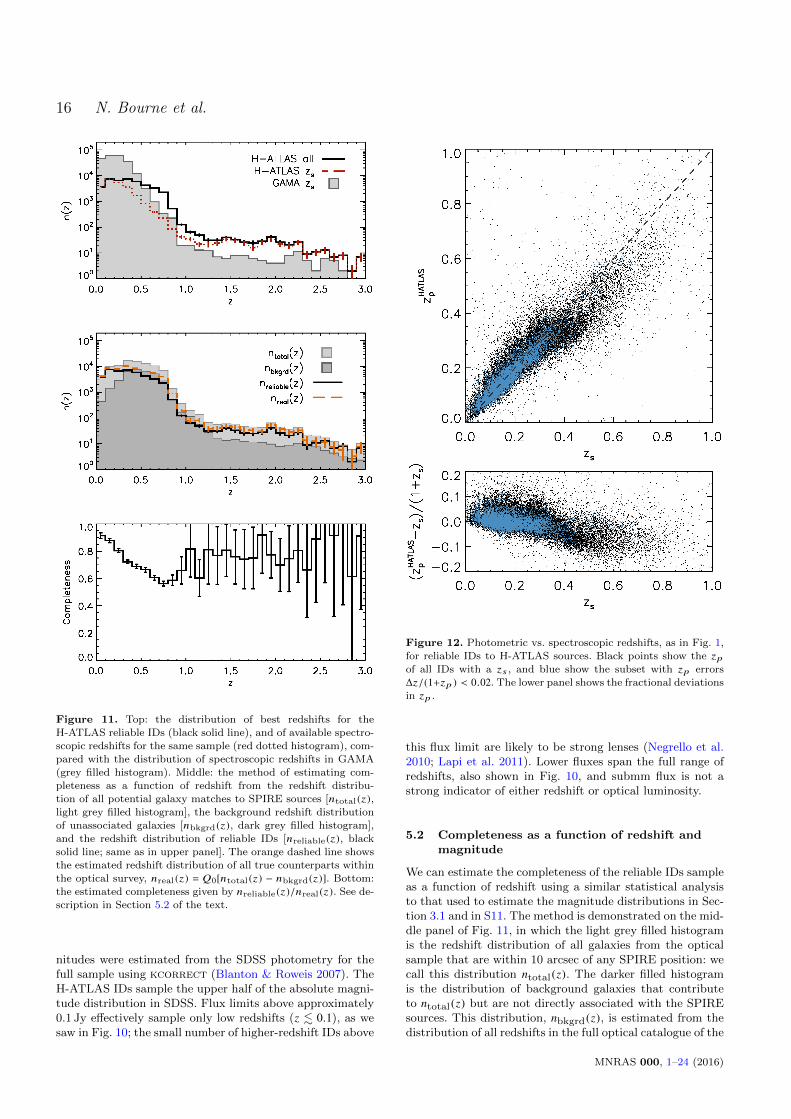
Figure 12 compares the H-ATLAS photometric redshiftsto spectroscopic redshifts, for those reliable IDs which havea good spectroscopic redshift (compare this to the full setof spectroscopic redshifts in Fig. 1). A slight bias is seenat z & 0.4, where the photometric redshifts are typicallyunder-estimated. This appears more prominent in this reli-able subset than it was for the full redshift sample (Fig. 1),indicating a bias in the photometric redshift algorithm tospecifically under-estimate the redshifts of dusty galaxies atz > 0.4. This tendency also existed in the SDP (S11 usedthe same photometric redshifts), and indeed was previouslynoted by Dunne et al. (2011).
In Fig. 13 we show the absolute magnitude Mr as afunction of redshift for the reliable sample. Absolute mag-
MNRAS 000, 1–24 (2016)
16 N. Bourne et al.
Figure 11. Top: the distribution of best redshifts for the
H-ATLAS reliable IDs (black solid line), and of available spectro-
scopic redshifts for the same sample (red dotted histogram), com-pared with the distribution of spectroscopic redshifts in GAMA
(grey filled histogram). Middle: the method of estimating com-
pleteness as a function of redshift from the redshift distribu-tion of all potential galaxy matches to SPIRE sources [ntotal (z),light grey filled histogram], the background redshift distribution
of unassociated galaxies [nbkgrd (z), dark grey filled histogram],and the redshift distribution of reliable IDs [nreliable (z), black
solid line; same as in upper panel]. The orange dashed line shows
the estimated redshift distribution of all true counterparts withinthe optical survey, nreal (z) = Q0[ntotal (z) − nbkgrd (z)]. Bottom:
the estimated completeness given by nreliable (z)/nreal (z). See de-scription in Section 5.2 of the text.
nitudes were estimated from the SDSS photometry for thefull sample using kcorrect (Blanton & Roweis 2007). TheH-ATLAS IDs sample the upper half of the absolute magni-tude distribution in SDSS. Flux limits above approximately0.1 Jy effectively sample only low redshifts (z . 0.1), as wesaw in Fig. 10; the small number of higher-redshift IDs above
Figure 12. Photometric vs. spectroscopic redshifts, as in Fig. 1,
for reliable IDs to H-ATLAS sources. Black points show the zpof all IDs with a zs , and blue show the subset with zp errors
∆z/(1+zp ) < 0.02. The lower panel shows the fractional deviations
in zp .
this flux limit are likely to be strong lenses (Negrello et al.2010; Lapi et al. 2011). Lower fluxes span the full range ofredshifts, also shown in Fig. 10, and submm flux is not astrong indicator of either redshift or optical luminosity.
5.2 Completeness as a function of redshift andmagnitude
We can estimate the completeness of the reliable IDs sampleas a function of redshift using a similar statistical analysisto that used to estimate the magnitude distributions in Sec-tion 3.1 and in S11. The method is demonstrated on the mid-dle panel of Fig. 11, in which the light grey filled histogramis the redshift distribution of all galaxies from the opticalsample that are within 10 arcsec of any SPIRE position: wecall this distribution ntotal(z). The darker filled histogramis the distribution of background galaxies that contributeto ntotal(z) but are not directly associated with the SPIREsources. This distribution, nbkgrd(z), is estimated from thedistribution of all redshifts in the full optical catalogue of the
MNRAS 000, 1–24 (2016)

Multi-wavelength IDs for H-ATLAS 17
Figure 13. Optical absolute magnitudes in the r band as a func-
tion of redshift and 250-µm flux of reliable H-ATLAS IDs (all
extragalactic IDs in SDSS), with the background distribution ofSDSS shown in contours. The redshifts used are spectroscopic
where available, or photometric otherwise. To reduce crowding
we only plot one quarter of the reliable IDs.
three fields, normalized by the ratio of the combined searcharea around SPIRE positions (π × 10′′ 2 × NSPIRE) to thetotal field area covered by the optical catalogue. The differ-ence ntotal(z) − nbkgrd(z) therefore gives the estimated trueredshift distribution of SPIRE counterparts, nreal(z), whichis plotted as a dashed orange line, after normalizing by Q0(the fraction of true counterparts which are within the opti-cal catalogue). The completeness as a function of redshift ofthe reliable IDs is estimated by the ratio nreliable(z)/nreal(z),where nreliable(z) is the solid black line shown in both the up-per and middle panels. The completeness fraction is shownin the lower panel, with error bars based on the assumptionof Poisson counting statistics. The completeness of each red-shift bin up to z = 3 is shown in Table 6. Compared withthe same statistics for SDP (S11), the DR1 completeness isbroadly similar, although slightly higher at z > 0.3. This dif-ference may be partly due to cosmic variance, and perhapsdue to the greater availability of spectroscopic redshifts inthe current work. It is noticeable that the completeness re-mains relatively high at high redshifts, and in fact appearsto be higher at z > 1 than at z ≈ 0.7. This may relate toa dearth of spectroscopic redshifts at 0.5 < z < 1 combinedwith inaccuracies in photometric redshifts in this range (es-pecially the bias discussed in the previous section). It is alsopossible that the probability for reliably matching a SPIREsource with its SDSS counterpart (given that it is detectedin both surveys) is higher at z > 1 compared to lower red-shifts because the magnitude-limited SDSS catalogue is lesslikely to contain correlated neighbours within the 10 arcsecsearch radius. Such neighbours would of course reduce thereliability given by equation (16). Equally, the completenessat z < 0.5 is high because the search radius corresponds
Table 6. Completeness of the reliable sample as a percentage ofthe total number of true counterparts with r < 22.4, as a function
of redshift
z Completeness (per cent)
0.0 – 0.1 91.3 ± 2.20.1 – 0.2 87.7 ± 1.50.2 – 0.3 80.4 ± 1.50.3 – 0.4 72.2 ± 1.30.4 – 0.5 68.9 ± 1.50.5 – 0.6 66.4 ± 1.80.6 – 0.7 60.5 ± 1.70.7 – 0.8 56.2 ± 1.80.8 – 0.9 58.8 ± 3.90.9 – 1.0 65.9 ± 9.91.0 – 1.5 76.1 ± 9.11.5 – 2.0 78.9 ± 9.92.0 – 2.5 76.0 ± 14.02.5 – 3.0 99.6 ± 31.4
Table 7. Completeness of the reliable sample as a function of r
magnitude, for all SDSS IDs and for extragalactic (xgal) IDs.
r All optical IDs (per cent) xgal IDs (per cent)
10.0 – 14.8 65.2 ± 15.6 106.3 ± 13.014.8 – 15.2 91.2 ± 15.5 101.2 ± 12.415.2 – 15.6 96.6 ± 14.3 98.6 ± 10.215.6 – 16.0 103.1 ± 11.9 100.0 ± 8.216.0 – 16.4 100.8 ± 8.0 101.0 ± 6.416.4 – 16.8 99.3 ± 6.1 97.5 ± 4.916.8 – 17.2 94.7 ± 4.4 95.8 ± 3.917.2 – 17.6 93.8 ± 3.6 94.0 ± 3.217.6 – 18.0 92.4 ± 3.0 92.2 ± 2.718.0 – 18.4 88.0 ± 2.7 88.3 ± 2.418.4 – 18.8 83.7 ± 2.4 82.9 ± 2.218.8 – 19.2 77.1 ± 2.1 77.6 ± 1.919.2 – 19.6 73.2 ± 1.8 72.5 ± 1.719.6 – 20.0 65.4 ± 1.6 65.3 ± 1.520.0 – 20.4 60.4 ± 1.5 61.2 ± 1.420.4 – 20.8 54.4 ± 1.3 54.3 ± 1.220.8 – 21.2 48.6 ± 1.2 48.3 ± 1.221.2 – 21.6 45.7 ± 1.2 47.2 ± 1.121.6 – 22.0 42.8 ± 1.2 45.4 ± 1.222.0 – 22.4 41.5 ± 1.3 45.5 ± 1.4
to a smaller physical scale which is likely to contain fewerneighbours.
A similar analysis of the magnitude histograms of truecounterparts and of reliable IDs allows us to plot the IDcompleteness as a function of r-band magnitude in Fig. 14.We see that the completeness is at least 90 per cent forr < 18, but falls to around 65 per cent at r=19.8 (the limitingmagnitude of GAMA), and is below 50 per cent for r & 21(the results are tabulated in Table 7).
MNRAS 000, 1–24 (2016)

18 N. Bourne et al.
Figure 14. The method of estimating completeness as a func-
tion of r -band magnitude from the distribution of all potential
extragalactic matches to SPIRE sources [ntotal (m), light greyfilled histogram], the background distribution of unassociated
galaxies [nbkgrd (m), dark grey filled histogram], and the distribu-
tion of reliable IDs [nreliable (m), black solid line]. The differencentotal (m)−nbkgrd (m) gives the estimated magnitude distribution
of true counterparts [nreal (m), orange dashed line]. The estimated
completeness given by nreliable (m)/nreal (m) is shown in the lowerpanel.
6 MULTI-WAVELENGTH PROPERTIES OFH-ATLAS GALAXIES IN GAMA
In this section we explore the multi-wavelength properties ofthe subset of H-ATLAS sources with ‘reliable’ counterpartsin GAMA, i.e. those with r < 19.8 which are classified asgalaxies by Baldry et al. (2010).
6.1 Magnitude distributions
Figure 15 shows the magnitude distributions in four bandsfrom the UV, optical, near-IR and mid-IR, for reliable IDswith available photometry in each band. For the r-band wecan compare both to SDSS and GAMA, but for the otherbands we compare to the GAMA photometric catalogue only(Driver et al. 2016). It is noticeable that the H-ATLAS sam-ple selects GAMA sources in the NUV down to a magnitudeof around 20, and in W4 down to about 15, with roughly con-stant efficiency as a function of magnitude. This indicatesthat H-ATLAS is not biased against blue (UV-bright) star-forming galaxies or hot (22-µm-bright) LIRGs (which mayhave been suspected due to the tendency for submm selec-tion to favour cold dusty galaxies). In the r band, H-ATLAS
detects and IDs a small fraction of all SDSS sources at allmagnitudes, but a large fraction of the galaxies in GAMAat r < 18. Most of the brighter SDSS objects missing fromH-ATLAS are stars, which are relatively few in the ID cat-alogue.
6.2 Optical and infrared colours
The stellar population age of a galaxy is roughly traced by itsoptical colour, since quiescent elliptical galaxies are knownto reside in the ‘red sequence’ while active star-forming discsare most likely to appear in the ‘blue cloud’. It has previouslybeen shown (e.g. Dariush et al. 2011) that H-ATLAS selectsgalaxies in both regions of the colour-magnitude diagram,and in Fig. 16 we show that this is indeed the case in theDR1 sample, both in terms of NUV −r and g−r (rest-frame)colours. The colours have been k-corrected to the rest-frameby fitting the FUV−K photometry with kcorrect (Blanton& Roweis 2007). The redder galaxies in H-ATLAS are likelyto be reddened by dust attenuation in the optical (Smithet al. 2012), although we also know that a small number oftruly passive galaxies are detected in the H-ATLAS sample(Rowlands et al. 2012; Agius et al. 2013). We can infer thisby predicting the U − V and V − J colours of the reliableIDs, using kcorrect to reconstruct the colours in the rest-frame SED. The UV J diagram in Fig. 17 can then be used todefine passive galaxies as those falling within the upper-leftregion (Williams et al. 2009). Figure 17 shows that a smallfraction (8.9 per cent) of sources in the reliable ID samplefall within this region, and these are generally optically lu-minous. The fraction of the full GAMA sample that fallswithin the passive region is 35 per cent.
Mid-IR colours in the WISE bands can be used to clas-sify galaxies according to the emission features resultingfrom star-formation and dust-obscured active galactic nu-clei (AGN). In Fig. 18 we show one such classification dia-gram for galaxies in the reliable ID sample and those in themain GAMA sample that are detected in the W1-W3 bands.The region bounded by the dashed line was defined by Jar-rett et al. (2011) to select AGN-dominated mid-IR SEDs,which are generally flat in νLν (λ) while the SEDs of purestar-forming galaxies are rising in the mid-IR. We find that4.0 per cent of H-ATLAS galaxies are AGN-dominated inthe mid-IR, similar to the fraction (6.3 per cent) of GAMAgalaxies, although galaxies at higher redshift are clearlymore likely to fall within the AGN classification. The WISEcolours are not k-corrected, although Cluver et al. (2014)showed that the k-corrected colours in the GAMA samplehave a similar distribution to observed colours. Our resultsare similar to the fraction (5.7 per cent) found in the smallerH-ATLAS SDP sample (Bond et al. 2012) using the samediagnostic.
These fractions relate to the subset of galaxies detectedin the three WISE bands plotted. An alternative classifi-cation was proposed by Messias et al. (2012) based on theK − [4.5] and [4.5] − [8.0] colours from Spitzer/IRAC pho-tometry, providing a cleaner separation of AGN and star-formation dominated SEDs at a wide range of redshifts. Forthe GAMA/H-ATLAS sample, which is predominantly atredshifts z < 0.5, a single colour cut of K − [4.6] > 0.2 shouldbe sufficient to separate SEDs dominated by AGN emissionat 4.6µm (see fig. 3 of Messias et al. 2012). This cut se-
MNRAS 000, 1–24 (2016)
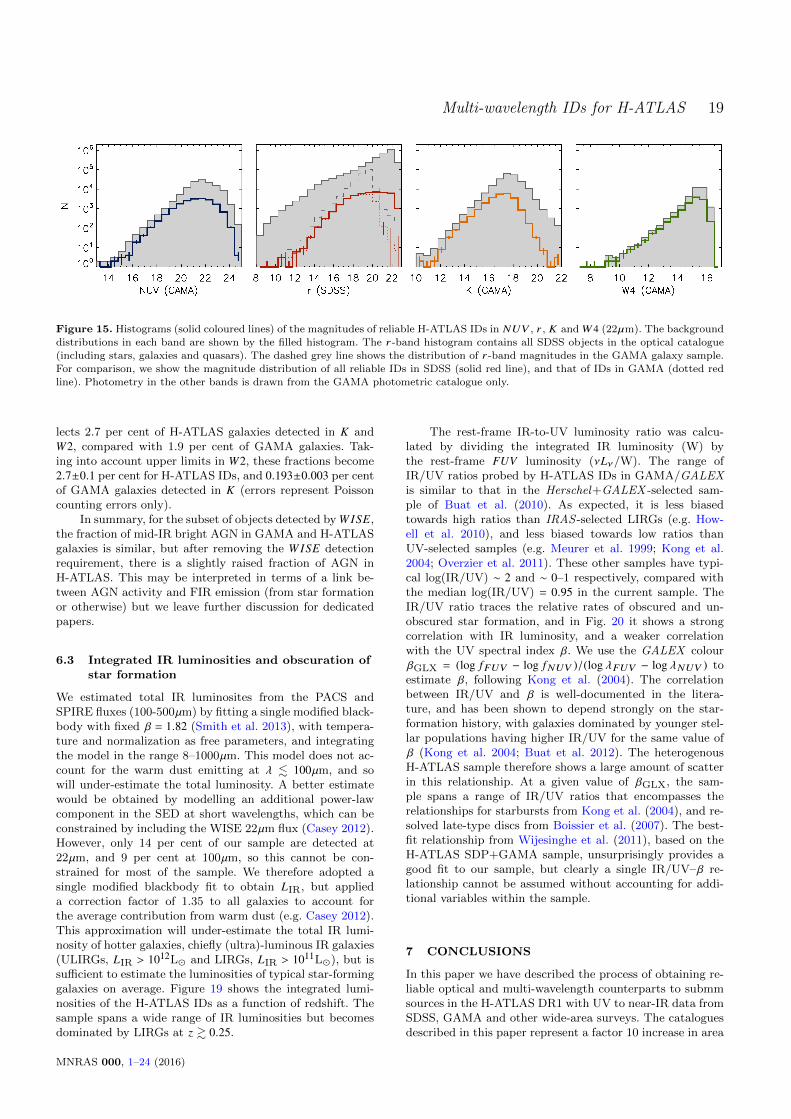
Multi-wavelength IDs for H-ATLAS 19
Figure 15. Histograms (solid coloured lines) of the magnitudes of reliable H-ATLAS IDs in NUV , r , K and W4 (22µm). The backgrounddistributions in each band are shown by the filled histogram. The r -band histogram contains all SDSS objects in the optical catalogue
(including stars, galaxies and quasars). The dashed grey line shows the distribution of r -band magnitudes in the GAMA galaxy sample.
For comparison, we show the magnitude distribution of all reliable IDs in SDSS (solid red line), and that of IDs in GAMA (dotted redline). Photometry in the other bands is drawn from the GAMA photometric catalogue only.
lects 2.7 per cent of H-ATLAS galaxies detected in K andW2, compared with 1.9 per cent of GAMA galaxies. Tak-ing into account upper limits in W2, these fractions become2.7±0.1 per cent for H-ATLAS IDs, and 0.193±0.003 per centof GAMA galaxies detected in K (errors represent Poissoncounting errors only).
In summary, for the subset of objects detected by W ISE,the fraction of mid-IR bright AGN in GAMA and H-ATLASgalaxies is similar, but after removing the W ISE detectionrequirement, there is a slightly raised fraction of AGN inH-ATLAS. This may be interpreted in terms of a link be-tween AGN activity and FIR emission (from star formationor otherwise) but we leave further discussion for dedicatedpapers.
6.3 Integrated IR luminosities and obscuration ofstar formation
We estimated total IR luminosites from the PACS andSPIRE fluxes (100-500µm) by fitting a single modified black-body with fixed β = 1.82 (Smith et al. 2013), with tempera-ture and normalization as free parameters, and integratingthe model in the range 8–1000µm. This model does not ac-count for the warm dust emitting at λ . 100µm, and sowill under-estimate the total luminosity. A better estimatewould be obtained by modelling an additional power-lawcomponent in the SED at short wavelengths, which can beconstrained by including the WISE 22µm flux (Casey 2012).However, only 14 per cent of our sample are detected at22µm, and 9 per cent at 100µm, so this cannot be con-strained for most of the sample. We therefore adopted asingle modified blackbody fit to obtain LIR, but applieda correction factor of 1.35 to all galaxies to account forthe average contribution from warm dust (e.g. Casey 2012).This approximation will under-estimate the total IR lumi-nosity of hotter galaxies, chiefly (ultra)-luminous IR galaxies(ULIRGs, LIR > 1012L and LIRGs, LIR > 1011L), but issufficient to estimate the luminosities of typical star-forminggalaxies on average. Figure 19 shows the integrated lumi-nosities of the H-ATLAS IDs as a function of redshift. Thesample spans a wide range of IR luminosities but becomesdominated by LIRGs at z & 0.25.
The rest-frame IR-to-UV luminosity ratio was calcu-lated by dividing the integrated IR luminosity (W) bythe rest-frame FUV luminosity (νLν/W). The range ofIR/UV ratios probed by H-ATLAS IDs in GAMA/GALEXis similar to that in the Herschel+GALEX -selected sam-ple of Buat et al. (2010). As expected, it is less biasedtowards high ratios than IRAS -selected LIRGs (e.g. How-ell et al. 2010), and less biased towards low ratios thanUV-selected samples (e.g. Meurer et al. 1999; Kong et al.2004; Overzier et al. 2011). These other samples have typi-cal log(IR/UV) ∼ 2 and ∼ 0–1 respectively, compared withthe median log(IR/UV) = 0.95 in the current sample. TheIR/UV ratio traces the relative rates of obscured and un-obscured star formation, and in Fig. 20 it shows a strongcorrelation with IR luminosity, and a weaker correlationwith the UV spectral index β. We use the GALEX colourβGLX = (log fFUV − log fNUV )/(log λFUV − log λNUV ) toestimate β, following Kong et al. (2004). The correlationbetween IR/UV and β is well-documented in the litera-ture, and has been shown to depend strongly on the star-formation history, with galaxies dominated by younger stel-lar populations having higher IR/UV for the same value ofβ (Kong et al. 2004; Buat et al. 2012). The heterogenousH-ATLAS sample therefore shows a large amount of scatterin this relationship. At a given value of βGLX, the sam-ple spans a range of IR/UV ratios that encompasses therelationships for starbursts from Kong et al. (2004), and re-solved late-type discs from Boissier et al. (2007). The best-fit relationship from Wijesinghe et al. (2011), based on theH-ATLAS SDP+GAMA sample, unsurprisingly provides agood fit to our sample, but clearly a single IR/UV–β re-lationship cannot be assumed without accounting for addi-tional variables within the sample.
7 CONCLUSIONS
In this paper we have described the process of obtaining re-liable optical and multi-wavelength counterparts to submmsources in the H-ATLAS DR1 with UV to near-IR data fromSDSS, GAMA and other wide-area surveys. The cataloguesdescribed in this paper represent a factor 10 increase in area
MNRAS 000, 1–24 (2016)

20 N. Bourne et al.
Figure 16. Rest-frame colour-magnitude diagrams in NUV − r
and g − r for reliable IDs in GAMA, in comparison to the full
GAMA sample (greyscale contours). The thick dashed line in
each panel shows the red sequence derived from the GAMA sam-ple in Bourne et al. (2012). Note that H-ATLAS selects galaxies
throughout the full locus of GAMA galaxies.
compared with the previous data release (SDP; S11) andan even greater increase in the number of sources due toimprovements in the source extraction described in Paper I.
We searched for counterparts within a radius of 10 arc-sec around all ≥ 4σ SPIRE sources in the H-ATLAS cat-alogues, corresponding to an average flux limit of 27.8 mJyat 250µm. For the matching catalogue, we used primary ob-jects from SDSS DR7 and DR9 with rmodel < 22.4, remov-ing spurious deblends by visual inspection of objects withdeblend flags. We used likelihood ratios to measure the re-liability of all potential matches in this catalogue, and wealso inspected by eye a subset of bright sources to validatethe automated process and correct missing ID informationfor bright galaxies and stars.
The intrinsic fraction of H-ATLAS sources which havea counterpart in the SDSS r < 22.4 catalogue (irrespectiveof whether the counterpart could be reliably identified) isQ0 = 0.539± 0.001 overall (0.519± 0.001 for extragalactic ob-
Figure 17. Rest-frame UVJ colour-colour diagrams for reliableIDs in GAMA, in comparison to the full GAMA sample (greyscale
contours). H-ATLAS galaxies are colour-coded by the total IR lu-
minosity estimated from the 100-500µm photometry as describedin Section 6.3. Note that H-ATLAS selects galaxies throughout
the full locus of the GAMA sample, including both passive and
star-forming galaxies according to the diagnostic given by thedashed line (Williams et al. 2009). The sharp edge seen in the
top-left locus of the data is artificial and results from the library
of model SEDs within kcorrect, which limit the range of coloursin these reconstructed photometric bands.
jects; 0.020 ± 0.002 for stars). The extragalactic value is sig-nificantly lower than that found by S11 in the SDP release,but this can be explained by changes in the methodologyleading to an improved estimate of Q0.
While Q0 represents the theoretical maximum identifi-cation rate for H-ATLAS sources in SDSS, in reality it isnot possible to obtain reliable counterparts for this fractionof sources due to the ambiguity of matching submm sourceswith a PSF of 18 arcsec to optically detected sources, andthe poor correlation between the fluxes in these two wave-bands. We found ‘reliable’ counterparts (reliability R ≥ 0.8)for 44,835 submm sources and estimated that this samplehas an overall completeness of 73.0 per cent and cleannessof 95.3 ± 0.1 per cent. The sample is dominated by galax-ies (97 per cent), although 422 stars and 610 spectroscopi-cally identified quasars are also reliably identified, in addi-tion to 351 quasar candidates (unresolved objects withoutspectroscopy but with non-stellar colours). The stellar IDsare incomplete and uncertain as a result of poor statisticalknowledge of the magnitude distribution of submm-emittingstars; further work in this area would improve the efficiencyof the LR procedure for stars. The R ≥ 0.8 reliability cutexcludes some sources with multiple optical counterparts(chance alignments, mergers and pairs/groups with smallprojected separations can all lead to a completely blended
MNRAS 000, 1–24 (2016)
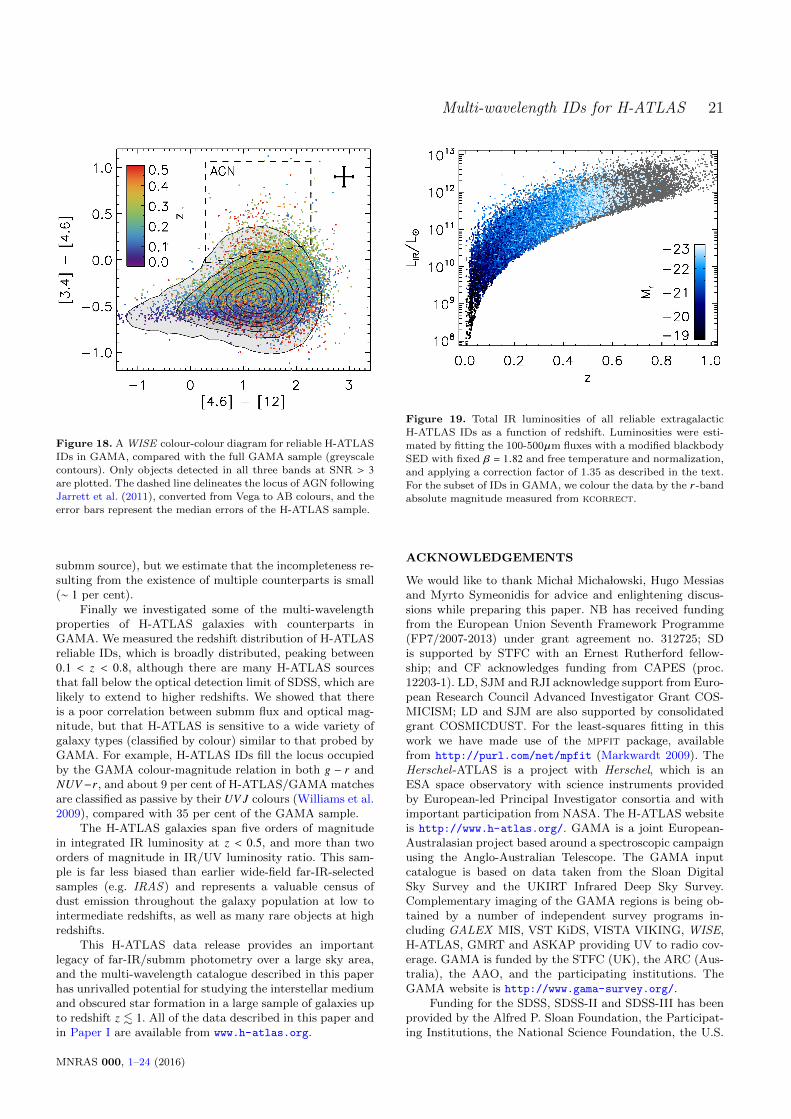
Multi-wavelength IDs for H-ATLAS 21
Figure 18. A WISE colour-colour diagram for reliable H-ATLAS
IDs in GAMA, compared with the full GAMA sample (greyscale
contours). Only objects detected in all three bands at SNR > 3are plotted. The dashed line delineates the locus of AGN following
Jarrett et al. (2011), converted from Vega to AB colours, and the
error bars represent the median errors of the H-ATLAS sample.
submm source), but we estimate that the incompleteness re-sulting from the existence of multiple counterparts is small(∼ 1 per cent).
Finally we investigated some of the multi-wavelengthproperties of H-ATLAS galaxies with counterparts inGAMA. We measured the redshift distribution of H-ATLASreliable IDs, which is broadly distributed, peaking between0.1 < z < 0.8, although there are many H-ATLAS sourcesthat fall below the optical detection limit of SDSS, which arelikely to extend to higher redshifts. We showed that thereis a poor correlation between submm flux and optical mag-nitude, but that H-ATLAS is sensitive to a wide variety ofgalaxy types (classified by colour) similar to that probed byGAMA. For example, H-ATLAS IDs fill the locus occupiedby the GAMA colour-magnitude relation in both g − r andNUV−r, and about 9 per cent of H-ATLAS/GAMA matchesare classified as passive by their UV J colours (Williams et al.2009), compared with 35 per cent of the GAMA sample.
The H-ATLAS galaxies span five orders of magnitudein integrated IR luminosity at z < 0.5, and more than twoorders of magnitude in IR/UV luminosity ratio. This sam-ple is far less biased than earlier wide-field far-IR-selectedsamples (e.g. IRAS) and represents a valuable census ofdust emission throughout the galaxy population at low tointermediate redshifts, as well as many rare objects at highredshifts.
This H-ATLAS data release provides an importantlegacy of far-IR/submm photometry over a large sky area,and the multi-wavelength catalogue described in this paperhas unrivalled potential for studying the interstellar mediumand obscured star formation in a large sample of galaxies upto redshift z . 1. All of the data described in this paper andin Paper I are available from www.h-atlas.org.
Figure 19. Total IR luminosities of all reliable extragalactic
H-ATLAS IDs as a function of redshift. Luminosities were esti-mated by fitting the 100-500µm fluxes with a modified blackbody
SED with fixed β = 1.82 and free temperature and normalization,
and applying a correction factor of 1.35 as described in the text.For the subset of IDs in GAMA, we colour the data by the r -band
absolute magnitude measured from kcorrect.
ACKNOWLEDGEMENTS
We would like to thank Micha l Micha lowski, Hugo Messiasand Myrto Symeonidis for advice and enlightening discus-sions while preparing this paper. NB has received fundingfrom the European Union Seventh Framework Programme(FP7/2007-2013) under grant agreement no. 312725; SDis supported by STFC with an Ernest Rutherford fellow-ship; and CF acknowledges funding from CAPES (proc.12203-1). LD, SJM and RJI acknowledge support from Euro-pean Research Council Advanced Investigator Grant COS-MICISM; LD and SJM are also supported by consolidatedgrant COSMICDUST. For the least-squares fitting in thiswork we have made use of the mpfit package, availablefrom http://purl.com/net/mpfit (Markwardt 2009). TheHerschel-ATLAS is a project with Herschel, which is anESA space observatory with science instruments providedby European-led Principal Investigator consortia and withimportant participation from NASA. The H-ATLAS websiteis http://www.h-atlas.org/. GAMA is a joint European-Australasian project based around a spectroscopic campaignusing the Anglo-Australian Telescope. The GAMA inputcatalogue is based on data taken from the Sloan DigitalSky Survey and the UKIRT Infrared Deep Sky Survey.Complementary imaging of the GAMA regions is being ob-tained by a number of independent survey programs in-cluding GALEX MIS, VST KiDS, VISTA VIKING, WISE,H-ATLAS, GMRT and ASKAP providing UV to radio cov-erage. GAMA is funded by the STFC (UK), the ARC (Aus-tralia), the AAO, and the participating institutions. TheGAMA website is http://www.gama-survey.org/.
Funding for the SDSS, SDSS-II and SDSS-III has beenprovided by the Alfred P. Sloan Foundation, the Participat-ing Institutions, the National Science Foundation, the U.S.
MNRAS 000, 1–24 (2016)
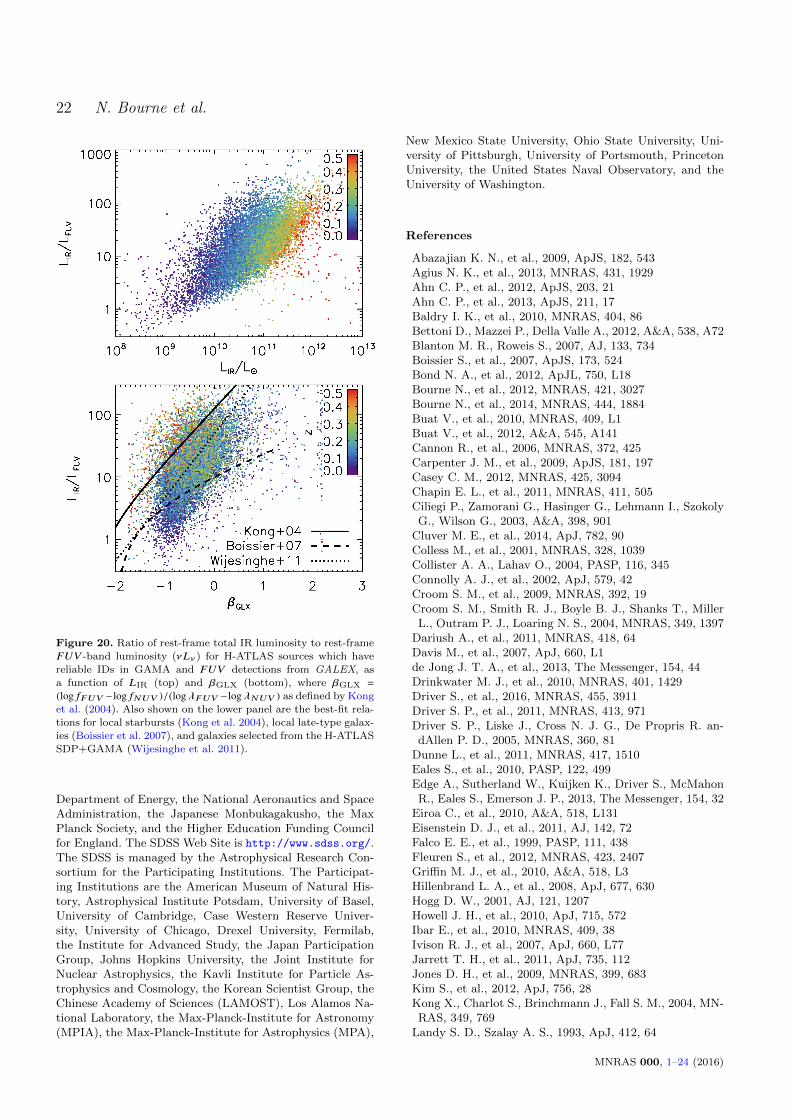
22 N. Bourne et al.
Figure 20. Ratio of rest-frame total IR luminosity to rest-frame
FUV -band luminosity (νLν ) for H-ATLAS sources which havereliable IDs in GAMA and FUV detections from GALEX, as
a function of LIR (top) and βGLX (bottom), where βGLX =
(log fFUV −log fNUV )/(log λFUV −log λNUV ) as defined by Konget al. (2004). Also shown on the lower panel are the best-fit rela-
tions for local starbursts (Kong et al. 2004), local late-type galax-
ies (Boissier et al. 2007), and galaxies selected from the H-ATLASSDP+GAMA (Wijesinghe et al. 2011).
Department of Energy, the National Aeronautics and SpaceAdministration, the Japanese Monbukagakusho, the MaxPlanck Society, and the Higher Education Funding Councilfor England. The SDSS Web Site is http://www.sdss.org/.The SDSS is managed by the Astrophysical Research Con-sortium for the Participating Institutions. The Participat-ing Institutions are the American Museum of Natural His-tory, Astrophysical Institute Potsdam, University of Basel,University of Cambridge, Case Western Reserve Univer-sity, University of Chicago, Drexel University, Fermilab,the Institute for Advanced Study, the Japan ParticipationGroup, Johns Hopkins University, the Joint Institute forNuclear Astrophysics, the Kavli Institute for Particle As-trophysics and Cosmology, the Korean Scientist Group, theChinese Academy of Sciences (LAMOST), Los Alamos Na-tional Laboratory, the Max-Planck-Institute for Astronomy(MPIA), the Max-Planck-Institute for Astrophysics (MPA),
New Mexico State University, Ohio State University, Uni-versity of Pittsburgh, University of Portsmouth, PrincetonUniversity, the United States Naval Observatory, and theUniversity of Washington.
References
Abazajian K. N., et al., 2009, ApJS, 182, 543Agius N. K., et al., 2013, MNRAS, 431, 1929Ahn C. P., et al., 2012, ApJS, 203, 21Ahn C. P., et al., 2013, ApJS, 211, 17Baldry I. K., et al., 2010, MNRAS, 404, 86Bettoni D., Mazzei P., Della Valle A., 2012, A&A, 538, A72Blanton M. R., Roweis S., 2007, AJ, 133, 734Boissier S., et al., 2007, ApJS, 173, 524Bond N. A., et al., 2012, ApJL, 750, L18Bourne N., et al., 2012, MNRAS, 421, 3027Bourne N., et al., 2014, MNRAS, 444, 1884Buat V., et al., 2010, MNRAS, 409, L1Buat V., et al., 2012, A&A, 545, A141Cannon R., et al., 2006, MNRAS, 372, 425Carpenter J. M., et al., 2009, ApJS, 181, 197Casey C. M., 2012, MNRAS, 425, 3094Chapin E. L., et al., 2011, MNRAS, 411, 505Ciliegi P., Zamorani G., Hasinger G., Lehmann I., SzokolyG., Wilson G., 2003, A&A, 398, 901
Cluver M. E., et al., 2014, ApJ, 782, 90Colless M., et al., 2001, MNRAS, 328, 1039Collister A. A., Lahav O., 2004, PASP, 116, 345Connolly A. J., et al., 2002, ApJ, 579, 42Croom S. M., et al., 2009, MNRAS, 392, 19Croom S. M., Smith R. J., Boyle B. J., Shanks T., MillerL., Outram P. J., Loaring N. S., 2004, MNRAS, 349, 1397
Dariush A., et al., 2011, MNRAS, 418, 64Davis M., et al., 2007, ApJ, 660, L1de Jong J. T. A., et al., 2013, The Messenger, 154, 44Drinkwater M. J., et al., 2010, MNRAS, 401, 1429Driver S., et al., 2016, MNRAS, 455, 3911Driver S. P., et al., 2011, MNRAS, 413, 971Driver S. P., Liske J., Cross N. J. G., De Propris R. an-dAllen P. D., 2005, MNRAS, 360, 81
Dunne L., et al., 2011, MNRAS, 417, 1510Eales S., et al., 2010, PASP, 122, 499Edge A., Sutherland W., Kuijken K., Driver S., McMahonR., Eales S., Emerson J. P., 2013, The Messenger, 154, 32
Eiroa C., et al., 2010, A&A, 518, L131Eisenstein D. J., et al., 2011, AJ, 142, 72Falco E. E., et al., 1999, PASP, 111, 438Fleuren S., et al., 2012, MNRAS, 423, 2407Griffin M. J., et al., 2010, A&A, 518, L3Hillenbrand L. A., et al., 2008, ApJ, 677, 630Hogg D. W., 2001, AJ, 121, 1207Howell J. H., et al., 2010, ApJ, 715, 572Ibar E., et al., 2010, MNRAS, 409, 38Ivison R. J., et al., 2007, ApJ, 660, L77Jarrett T. H., et al., 2011, ApJ, 735, 112Jones D. H., et al., 2009, MNRAS, 399, 683Kim S., et al., 2012, ApJ, 756, 28Kong X., Charlot S., Brinchmann J., Fall S. M., 2004, MN-RAS, 349, 769
Landy S. D., Szalay A. S., 1993, ApJ, 412, 64
MNRAS 000, 1–24 (2016)
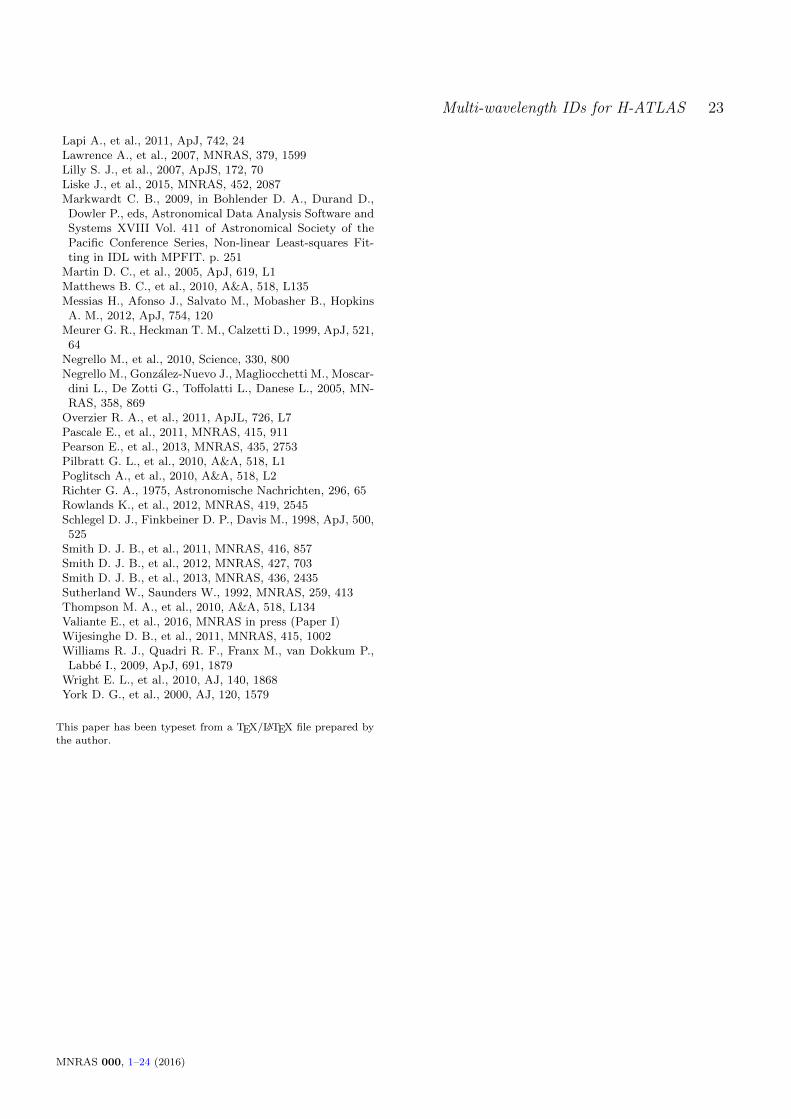
Multi-wavelength IDs for H-ATLAS 23
Lapi A., et al., 2011, ApJ, 742, 24Lawrence A., et al., 2007, MNRAS, 379, 1599Lilly S. J., et al., 2007, ApJS, 172, 70Liske J., et al., 2015, MNRAS, 452, 2087Markwardt C. B., 2009, in Bohlender D. A., Durand D.,Dowler P., eds, Astronomical Data Analysis Software andSystems XVIII Vol. 411 of Astronomical Society of thePacific Conference Series, Non-linear Least-squares Fit-ting in IDL with MPFIT. p. 251
Martin D. C., et al., 2005, ApJ, 619, L1Matthews B. C., et al., 2010, A&A, 518, L135Messias H., Afonso J., Salvato M., Mobasher B., HopkinsA. M., 2012, ApJ, 754, 120
Meurer G. R., Heckman T. M., Calzetti D., 1999, ApJ, 521,64
Negrello M., et al., 2010, Science, 330, 800Negrello M., Gonzalez-Nuevo J., Magliocchetti M., Moscar-dini L., De Zotti G., Toffolatti L., Danese L., 2005, MN-RAS, 358, 869
Overzier R. A., et al., 2011, ApJL, 726, L7Pascale E., et al., 2011, MNRAS, 415, 911Pearson E., et al., 2013, MNRAS, 435, 2753Pilbratt G. L., et al., 2010, A&A, 518, L1Poglitsch A., et al., 2010, A&A, 518, L2Richter G. A., 1975, Astronomische Nachrichten, 296, 65Rowlands K., et al., 2012, MNRAS, 419, 2545Schlegel D. J., Finkbeiner D. P., Davis M., 1998, ApJ, 500,525
Smith D. J. B., et al., 2011, MNRAS, 416, 857Smith D. J. B., et al., 2012, MNRAS, 427, 703Smith D. J. B., et al., 2013, MNRAS, 436, 2435Sutherland W., Saunders W., 1992, MNRAS, 259, 413Thompson M. A., et al., 2010, A&A, 518, L134Valiante E., et al., 2016, MNRAS in press (Paper I)Wijesinghe D. B., et al., 2011, MNRAS, 415, 1002Williams R. J., Quadri R. F., Franx M., van Dokkum P.,Labbe I., 2009, ApJ, 691, 1879
Wright E. L., et al., 2010, AJ, 140, 1868York D. G., et al., 2000, AJ, 120, 1579
This paper has been typeset from a TEX/LATEX file prepared by
the author.
MNRAS 000, 1–24 (2016)