the helena project – ii. abundance distribution trends of...
TRANSCRIPT

MNRAS 476, 4501–4509 (2018) doi:10.1093/mnras/sty534Advance Access publication 2018 February 27
The hELENa project – II. Abundance distribution trends of early-typegalaxies: from dwarfs to giants
A. Sybilska,1,2‹ H. Kuntschner,2 G. van de Ven,3 A. Vazdekis,4,5 J. Falcon-Barroso,4,5
R. F. Peletier6 and T. Lisker7
1Baltic Institute of Technology, al. Zwycistwa 96/98, PL-81-451 Gdynia, Poland2European Southern Observatory, Karl-Schwarzschild-Strasse 2, D-85748 Garching bei Munchen, Germany3Max Planck Institute for Astronomy, Konigstuhl 17, D-69117 Heidelberg, Germany4Instituto de Astrofısica de Canarias, Vıa Lactea s/n, E-38205 La Laguna, Tenerife, Spain5Departamento de Astrofısica, Universidad de La Laguna, E-38200 La Laguna, Tenerife, Spain6Kapteyn Astronomical Institute, University of Groningen, Postbus 800, NL-9700 AV Groningen, the Netherlands7Astronomisches Rechen-Institut, Zentrum fur Astronomie der Universitat Heidelberg, Monchhofstrasse 12-14, D-69120 Heidelberg, Germany
Accepted 2018 February 15. Received 2018 February 1; in original form 2017 August 2
ABSTRACTIn this second paper of The role of Environment in shaping Low-mass Early-type Nearbygalaxies (hELENa) series we study [Mg/Fe] abundance distribution trends of early-type galax-ies (ETGs) observed with the Spectrographic Areal Unit for Research on Optical Nebulaeintegral field unit, spanning a wide range in mass and local environment densities: 20 low-mass early types (dEs) of Sybilska et al. and 258 massive early types (ETGs) of the ATLAS3D
project, all homogeneously reduced and analysed. We show that the [Mg/Fe] ratios scale withvelocity dispersion (σ ) at fixed [Fe/H] and that they evolve with [Fe/H] along similar paths forall early types, grouped in bins of increasing local and global σ , as well as the second velocitymoment Vrms, indicating a common inside-out formation pattern. We then place our dEs onthe [Mg/Fe] versus [Fe/H] diagram of Local Group galaxies and show that dEs occupy thesame region and show a similar trend line slope in the diagram as the high-metallicity stars ofthe Milky Way and the Large Magellanic Cloud. This finding extends the similar trend foundfor dwarf spheroidal versus dwarf irregular galaxies and supports the notion that dEs haveevolved from late-type galaxies that have lost their gas at a point of their evolution, whichlikely coincided with them entering denser environments.
Key words: galaxies: abundances – galaxies: dwarf – galaxies: evolution – galaxies: stellarcontent – galaxies: structure.
1 IN T RO D U C T I O N
Detailed studies of galaxy properties as a function of redshift arehampered by the low signal-to-noise ratio (SNR) and low spatialresolution of high-redshift data. In order to study galaxy evolutionwe thus often turn to nearby galaxies to perform detailed studiesof their stellar populations, with the hope to unveiling their evolu-tionary details through their star formation histories (SFHs). Thisso-called ‘stellar archaeology’ method has traditionally been lim-ited by the age–metallicity degeneracy when deriving populationproperties from broad-band colours. Using absorption line indicesmakes it possible, in principle, to lift the degeneracy, though herethe challenge lies in ensuring that the derived metallicities are notaffected by inherent abundance ratios. This, in turn, can be tack-
� E-mail: [email protected]
led by using abundance-ratio-independent index combinations (e.g.Kuntschner et al. 2010) and stellar population models specificallyallowing for varying abundance ratios (e.g. Thomas et al. 2005).
The relation between element abundance ratios and metallicityhas been studied in detail (through resolved observations) mostlyfor dwarf spheroidal galaxies (dSphs) of the Milky Way (MW) dueto their proximity to our Galaxy (see e.g. Kirby et al. 2011b orthe review of Tolstoy, Hill & Tosi 2009). Some data also exist forLocal Group (LG) dwarf irregular galaxies (dIrrs), however, ow-ing to their larger line-of-sight distances we are not able to studyindividual stars as faint as in the case of the closer dSphs, mean-ing the available samples do not cover comparably low-metallicityregimes.
Beyond the LG the situation is yet more complicated. Unable toobtain spectroscopic data for individual stars we need to resort tointegrated measurements of stellar population parameters. These donot allow for the same level of detail to be examined since at each
C© 2018 The Author(s)Published by Oxford University Press on behalf of the Royal Astronomical Society
Downloaded from https://academic.oup.com/mnras/article-abstract/476/4/4501/4911542by European Southern Observatory useron 27 July 2018

4502 A. Sybilska et al.
Table 1. Basic details of the literature samples used in the study.
Data type Source Sample info Instrument Mass range (M�)
Unresolved/IFU Sybilska et al. (2017) 20 dEs, Virgo and field SAURON/WHT 1.68 × 10⁹–8.18 × 10⁹ a
Scott et al. (2013) 258 ETGs, Virgo and field SAURON/WHT 3.86 × 10⁹–5.96 × 10¹¹ b
Resolved Tolstoy et al. (2009)g Sculptor UVES/VLT 1.3 ± 0.3, 2.3 ± 0.2 × 10⁷ c
Fornax UVES/VLT, FLAMES/VLT 5.3 ± 0.6, 7.4 ± 0.4 × 10⁷ c
Carina UVES/VLT 0.6 ± 0.2, 1.0 ± 0.1 × 10⁷ c
Sagittarius HIRES/Keck, FLAMES/VLT, UVES/VLT 1 × 10⁹ d
Kirby et al. (2011a) Sculptor DEIMOS/Keck 1.3 ± 0.3, 2.3 ± 0.2 × 10⁷ c
Leo I DEIMOS/Keck 1.2 ± 0.3, 2.2 ± 0.2 × 10⁷ c
Pompeia et al. (2008) LMC FLAMES/VLT 1.7 ± 0.7 × 10¹⁰ e
Bensby et al. (2014) Milky Way FEROS/ESO 1.5 m, 2.2 m; SOFIN, FIES/NOT; 1.39 ± 0.49 × 10¹² f
UVES/VLT; HARPS/ESO 3.6 m;MIKE/Magellan Clay Telescope
Notes. aMvir mass range based on Re and σ values of Sybilska et al. (2017).bMJAM mass range from Cappellari et al. (2013).cM1/2 from Collins et al. (2014) and Wolf et al. (2010), respectively.dTotal mass of the best-fitting cuspy/core model from Majewski et al. (2013).eM (8.7 kpc) from van der Marel & Kallivayalil (2014).fM100 mass of Watkins, Evans & An (2010).gCompiled from Shetrone et al. (2003), Geisler et al. (2005), McWilliam & Smecker-Hane (2005), Letarte (2007), Sbordone et al. (2007), and Koch et al.(2008).
spatial point we get integrated, light-weighted information on all theunderlying populations at that location. Nevertheless, with the helpof stellar population models and various SFH recovery techniqueswe may still get insight into the assembly of those galaxies acrossthe cosmic time.
[Mg/Fe] abundance ratio is one of the fundamental measures ofchemical enrichment in galaxies since different elements are pro-duced in processes of different time-scales, in this case Type Iaversus Type II supernovae (SNe), each having progenitors of dif-ferent masses. Thus, the relation between [Mg/Fe] and [Fe/H] canprovide information on the amount of feedback from the variousSNe types and is expected to be constant for the lowest metallicityvalues, i.e. before Type Ia SNe start contributing to the chemicalevolution producing α elements. The downward turn of the [Mg/Fe]versus [Fe/H] trend seen in the resolved MW data is known as a‘knee’ and is an indication of the metal enrichment achieved up tothat point in time (i.e. how efficient star formation was during thefirst ∼1 Gyr of the galaxy evolution), thus, for example, a lower[Fe/H] at the knee location means lower feedback from star forma-tion. This could be due to more mass being locked up in low-massstars or e.g. galactic winds causing outflow of metal-enhanced ma-terial (e.g. Tolstoy et al. 2009).
The knee location can only be determined for galaxies for whichvery metal-poor stars can be spectroscopically observed, which hasso far only been achieved for the MW. Such metal-poor stars are stillmostly out of reach for extragalactic objects, even those in the LG.Their large line-of-sight distances mean only the brightest stars canbe observed, which dramatically limits the lookback time. Muchoutside of the LG we do not even have the luxury of individual starspectroscopic measurements and need to rely on integrated spectra.Theoretically, we would be able to obtain very low metallicity mea-surements only if the entire probed galaxy region was composed ofthe oldest, metal-poorest stars.1
1 We note, however, that with the use of techniques such as full-spectrumfitting (e.g. Koleva et al. 2009) one could, in principle, be able to detect anold, metal-poor underlying population if it were sufficiently massive.
Nevertheless, we can still benefit from the analysis of the [Mg/Fe]versus [Fe/H] profiles and trends of various galaxy types across largemass ranges and different environments. Differences in the observedabundances contain clues as to the efficiency of internal enrichmentmechanisms or the influence of environmental factors such as ac-cretion or mergers. For example, a low [α/Fe] at low [Fe/H] couldindicate accretion of stellar material from objects where star for-mation efficiency was lower (e.g. Wyse 2010). The analysis of theloci of points and locations of the [Mg/Fe] versus [Fe/H] profiles (atthe high-metallicity end) can thus provide insight into differencesbetween SFHs of the studied objects.
2 SA M P L E SE L E C T I O N
Below we provide a description of the literature samples used inthe present study, which includes integral field unit (IFU) spectro-scopic data for a total of 278 galaxies in the Virgo Cluster and thegroup/field environment, as well as resolved data for MW and anumber of LG galaxies. Individual references are provided belowand in Table 1.
2.1 Integrated-light data
All our IFU data have been obtained with the SpectrographicAreal Unit for Research on Optical Nebulae (SAURON) IFU atthe William Herschel Telescope (WHT) in La Palma, Spain. Thedata reach out to ca. 1 effective radius (Re) and their spatial extentis limited either by field of view (FoV) of the SAURON instru-ment [for most of the ATLAS3D sample and some dwarf ellipticalgalaxies (dEs)] or the per-spaxel SNR (for dEs set to 7 and roughlycorresponding to surface brightness of μV ≈ 23.5 mag at the edge ofthe field). For details on the sample selection and data reduction seethe relevant papers cited below. Below we provide a short summaryfor the reader’s convenience.
Our low-mass early-type sample consists of 20 dwarf early types(dEs; Sybilska et al. 2017, hereafter S17), 17 of which are locatedin the Virgo Cluster and three in the field. The galaxies have beendrawn from the high-mass end of the dE luminosity function and
MNRAS 476, 4501–4509 (2018)Downloaded from https://academic.oup.com/mnras/article-abstract/476/4/4501/4911542by European Southern Observatory useron 27 July 2018

The hELENa project – II. 4503
comprise objects of various dE subtypes (discy, blue core, as wellas nucleated and non-nucleated galaxies), as well as a range ofellipticities and locations within the Virgo Cluster.
The massive early-type sample consists of 258 ATLAS3D galax-ies: 58 Virgo Cluster and 200 field/group objects. The populationparameters presented here are, as described in S17, based on theline strength measurements of Scott et al. (2013), which were trans-formed from the Lick to the Line Index System (LIS) system ofVazdekis et al. (2010) and for which stellar population estimateswere then derived using MILES stellar population models (Vazdekiset al. 2015) in order to ensure maximal homogeneity. We also com-pare these population measurements to those for the same samplebut derived with the use of Schiavon (2007) models (Kuntschneret al., in preparation) to check for consistency – see the appendix ofS17 for details.
2.2 Resolved data
Data for LG dSphs were taken from the works of Tolstoy et al. (2009)and Kirby et al. (2011b). For these data sets we either directly tookthe provided moving averages/average profiles or calculated themourselves. Additionally, we include the data from Pompeia et al.(2008) on the Large Magellanic Cloud (LMC) and from Bensby,Feltzing & Oey (2014) for the MW. We average the values of thelatter so that an average trend line similar to those for early typescould be shown. The moving averages for the MW and the IFUsample were created by using a fixed subset with the size dependenton the number of available points.
3 M E T H O D S
3.1 Deriving radial profiles
Similar to stellar population profiles of S17, radial profiles of σ ,Vrms = √
V 2 + σ 2 were obtained from the S17 kinematic maps byaveraging bins2 in elliptical annuli (i.e. along the lines of con-stant surface brightness) of increasing width, equal in log space.The same method was used by Kuntschner et al. (2006, 2010) forthe SAURON survey and subsequently by Scott et al. (2013) forthe ATLAS3D sample, with which we compare our results here.The errors on the averaged quantities were then obtained by takinga standard deviation of the values corresponding to the individualbins included in a given annulus. Population parameters were thenderived from these annuli-averaged values.
3.2 Determining stellar population parameters of the IFUsamples
The methods for the derivation of [M/H] and [Mg/Fe] abun-dance ratios are described in sections 3.6 and 3.7 of S17. Inshort, we use the abundance ratio insensitive index combination[MgFe50]’ of Kuntschner et al. (2010) and the optimized H βo
index defined by Cervantes & Vazdekis (2009), which is less de-pendent on metallicity than the traditional Hβ index. We thenderive age and metallicity ([M/H]) with the help of MILES stel-lar population models of Vazdekis et al. (2015), linearly inter-polating between the available model prediction. To reduce theeffects of grid discretization, we oversample the original models
2 The maps were Voronoi binned to a minimum of S/N = 30; see S17 formore details.
using a linear interpolation in the age–[M/H]-[index] space. [Fe/H]values are subsequently calculated using the following formula:[Fe/H] = [M/H] − 0.75 × [Mg/Fe] (ibid.).
To derive the [Mg/Fe] abundance ratios we interpolate betweenthe predictions of MILES scaled-solar and α-enhanced models onthe Mg b–Fe5015 plane. For each line strength measurement weextract Mg b and Fe5015 index pairs from both sets of models,corresponding to the best-fitting single stellar population (SSP) ageand metallicity derived by interpolating between model predictionsin the Hβo–[MgFe50] plane. We then calculate the distance betweenthe two points and the distance between the points and our measuredvalue to obtain the estimate of the [Mg/Fe] enhancement.
While in principle the Fe5270 is more commonly chosen forthe derivation of population parameters, the SAURON wavelengthrange is such that the index can only be measured for a smallsubsample of our galaxies (depending on their redshift). Kuntschneret al. (2010, their fig. 4) have, however, shown for central aperturesof their galaxies that the abundance ratios derived with the help ofthe two metal lines give consistent results.
We do note that the choice of models can influence the derivedstellar population parameters values and introduce systematic bias.For example, a grid that is less orthogonal (i.e. shows a larger age–metallicity correlation) is able to systematically bias the derivedparameters towards older ages or lower metallicities, and as a resultinfluence the shape of the derived population profiles, an exampleof which can be seen in fig. 3 of Kuntschner et al. (2010). On theother hand, as shown in fig. 6 of the same paper, metallicity andabundance ratio do not suffer from a degeneracy (error correlation)when analysed together, hence the choice of these two stellar pop-ulation parameters is justified and the [Mg/Fe] versus [Fe/H] planeis a robust one to work with. This is further substantiated for therelative comparison of all our IFU data, given the same instrumentand analysis approach for the entire sample.
For a comparison between the stellar population values obtainedfor the ATLAS3D sample using the Lick system and Schiavon (2007)models versus the values presented here, see the appendix of S17.
3.3 Comparing resolved and unresolved observations
3.3.1 Globular cluster studies
A number of recent studies have investigated the issue of com-parability of metallicity and abundance ratio values obtainedusing integrated-light (IL) spectroscopic measurements versushigh-resolution spectroscopy of individual stars in Galactic or LGglobular clusters (GCs).
Based on a sample of 23 Galactic GCs Pipino & Danziger (2011)provide empirical calibrations for a conversion of Lick indices intoabundances for the IL of old SSPs for a large range of observed[Fe/H] and [α/H]. Their discussion on problems with the derivationof true [Mg/Fe] ratio applies only to the very low (<−1) [Fe/H]regime, not applicable in our case (except for one galaxy). Theexpected underestimation of [Mg/Fe] is 0.05 dex, which is withinour measurement errors.
Sakari & Wallerstein (2016) analyse 25 M31 GCs comparingresults from their H-band IL spectral measurements and high-resolution optical values from Colucci, Bernstein & Cohen (2014).The relation showing the difference in the [Mg/Fe] values obtainedusing the two data sets as a function of [Fe/H] is shown in theirfig. 8 and has a mean offset of −0.02 and a standard deviation of0.16. Additionally, a comparison of their H-band results to low-resolution Lick index values from Schiavon et al. (2013) shows a
MNRAS 476, 4501–4509 (2018)Downloaded from https://academic.oup.com/mnras/article-abstract/476/4/4501/4911542by European Southern Observatory useron 27 July 2018

4504 A. Sybilska et al.
Figure 1. [Mg/Fe] abundance ratio as a function of [M/H] of the 20 low-mass early-type galaxies of S17 from the Virgo Cluster and the field/group environment.The galaxy centres have been marked with filled circles, error bars are shown for central points (the outermost profile points have error bars typically ∼twiceas large as the central ones – for the full profiles with uncertainties see the appendix of the above paper).
similarly good agreement between the two (mean offset: 0.0; stan-dard deviation: 0.12).
We note that Colucci, Bernstein & McWilliam (2017) find sys-tematically lower (−0.24 ± 0.07 dex) [Mg/Fe] values from IL thanfrom individual star measurements. However, the offset is less se-vere (ca. −0.15) for higher (>−1.0) [Fe/H] values. As a possibleexplanation of the discrepancy they give large abundance differ-ences that might exist in a small fraction of luminous cool giantsthat dominate IL measurements but perhaps are not represented inthe individual stars comparison sample.
The [Fe/H] values measured by Larsen, Brodie & Strader (2017)agree well with the literature values for individual stars from lit-erature compilation (see their table 4 for sources). For [Mg/Fe]they find that their IL values are systematically lower than thoseof Carretta et al. (2009), the average difference is ca. −0.15 dex,but again, the largest (>0.2 dex) discrepancies are for the very low(<−2) values of [Fe/H], with the average offset for more metal-richGCs being on average 0.1 dex. A comparison with other sources(Pritzl, Venn & Irwin 2005; Roediger et al. 2014) shows the twotypes of measurements to agree to within the errors. Additionally,the authors point out that even high-resolution spectroscopy of indi-vidual stars have systematic uncertainties of the order of ca. 0.1 dexassociated with them, hence an agreement of IL versus individ-ual stars measurements within this tolerance should be consideredsatisfactory.
3.3.2 Galaxy studies
More generally, the question of the feasibility of IL versus individ-ual star measurements comparison has also been discussed in thecontext of dwarf and more massive galaxy studies. Makarova et al.(2010) compare resolved Hubble Space Telescope (HST)/AdvancedCamera for Surveys (ACS) and IL data from the 6-m telescope ofthe Special Astrophysical Observatory of Russian Academy of Sci-ences for dSps/dEs in the M81 group and find that the two methods(colour–magnitude diagram versus full-spectrum fitting) give con-sistent [Fe/H] results for both galaxies ([Fe/H] ≈ −1.5), albeit with
some discrepancy for the younger, more metal-rich component inone of the objects.
In terms of much younger objects, Garcıa-Benito & Perez-Montero (2012) compare SFHs for a nearby blue compact dwarfgalaxy NGC 6789 obtained through the analysis of HST/WideField and Planetary Camera 2 (WFPC2) photometric andWHT/Intermediate dispersion Spectrograph and Imaging System(ISIS) spectroscopic data and find that they agree to within theerrors.
More recently, Ruiz-Lara et al. (2015) carried out a similar testbut expanded to systems with more complex SFHs. For a regionin the LMC, they compare SFHs based on long-slit data from ESO3.6 m/EFOSC2 with SFHs based on photometry from HST/WFPC2.They conclude that a full-spectrum analysis of IL data is a reliableway of recovering SFHs even in SFH-wise complex systems, pro-viding that a proper set of spectral templates is used.
4 R ESULTS
4.1 Virgo and field early-type galaxies
Fig. 1 shows the [Mg/Fe] abundance ratio as a function of [M/H]for each our dE galaxy individually. Looking at these profiles wesee that the [Mg/Fe] ratios evolve with metallicity along nearly thesame paths for all our dEs (see Kirby et al. 2011b for a similar resultfor LG dSphs). The values of [Mg/Fe] tend to increase outwards,though the associated gradients are mostly shallow or null to withinthe errors. [Fe/H] gradients, on the other hand, are all negative, withthe majority not negligible to within the errors. This has alreadybeen shown and quantified in S17 (Paper I of this series) and agreeswith the literature (e.g. Koleva et al. 2009 who analysed long-slitdata for 16 dEs, belonging to the Fornax Cluster or nearby groupsand find strong metallicity gradients for the majority of their sample,as well as Mentz et al. 2016 who show Multi Unit SpectroscopicExplorer (MUSE) IFU data for one Virgo dE and find a gradient inboth [Fe/H] and [Mg/Fe]).
MNRAS 476, 4501–4509 (2018)Downloaded from https://academic.oup.com/mnras/article-abstract/476/4/4501/4911542by European Southern Observatory useron 27 July 2018

The hELENa project – II. 4505
Figure 2. Upper panel: [Mg/Fe] abundance ratio as a function of [Fe/H] for all the profile points from the S17 sample and ATLAS3D galaxies, colour codedby σ local values as explained in the legend, with the number of points falling into each bin provided next to the bin ranges. Lower panel: running averages ofall the profile points for the above defined σ bins (same colour coding). [Fe/H] values have been obtained from [M/H] using the formula of Vazdekis et al.(2015): [Fe/H] = [M/H] − 0.75 × [Mg/Fe]. Note that the running averages are not averaged profiles as they combine points based on their [Fe/H] value andnot location in a galaxy: for example, individual galaxies with flat [Mg/Fe] profiles are still able to produce a non-flat running average if their [Mg/Fe] and[Fe/H] values differ among the said galaxies; also, points belonging to one galaxy may be included in running averages for different σ bins.
Fig. 2 shows the [Mg/Fe] versus [Fe/H] relation for all individualprofile points (upper panel) and running averages (lower panel)for all early-type galaxies (ETGs) in our sample, grouped by localvelocity dispersion σ local. Note that, as also explained in the figurecaption, these trend lines show averages for given [Fe/H] values,irrespective of the galaxy regions these correspond to (hence are notprofiles in the traditional sense), though as we move towards higherσ , the same [Fe/H] do typically correspond to regions further awayfrom galaxy centres.
We see that the shape of these [Fe/H]-averaged trend lines is qual-itatively similar for all early types, indicating comparable (inside-out) internal evolution. This has been shown earlier for the [Fe/H]–σ
and [Mg/Fe]–σ relations separately for these samples (McDermidet al. 2015; S17). However, even compared at fixed metallicity val-ues, the [Mg/Fe] abundance ratios scale with velocity dispersion.
Here we also show that the massive galaxies’ outskirts, while com-parable in metallicity to the centres of dEs, are significantly moreMg enhanced. On the other hand, similar levels of [Mg/Fe] areobserved in e.g. outskirts of low-σ as in central parts of high-σgalaxies, with the metallicities of the former significantly belowthose of the latter.
4.2 Virgo and field ETGs versus Local Group late- andearly-types
Our findings expand on those of Mentz et al. (2016) who showedMUSE IFU data for one Virgo dE juxtaposed on literature datafor the LG galaxies. Thanks to the much larger wavelength rangeavailable in MUSE, the authors were able to study not only Mg butalso Na and Ca abundance ratios. In the present work, while limited
MNRAS 476, 4501–4509 (2018)Downloaded from https://academic.oup.com/mnras/article-abstract/476/4/4501/4911542by European Southern Observatory useron 27 July 2018

4506 A. Sybilska et al.
to magnesium, we are able to show [Mg/Fe] versus [Fe/H] profilesfor a much larger sample of both low- and high-mass early types.
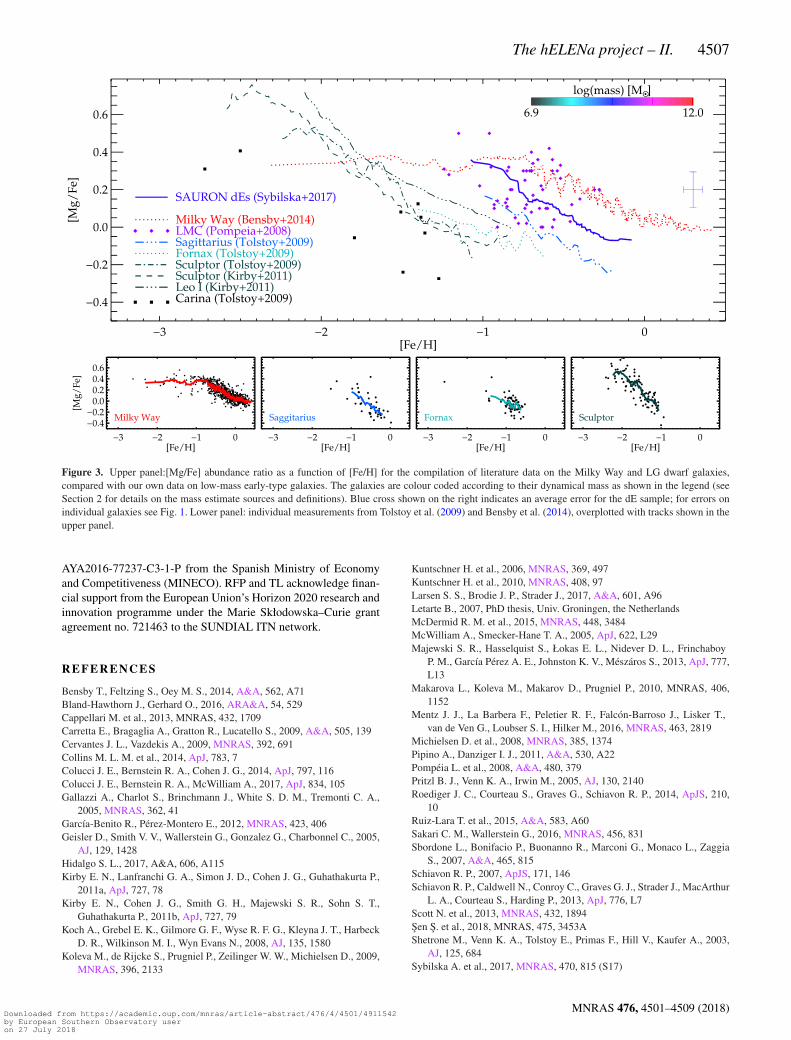
Fig. 3 shows the comparison between the dE galaxies of theprevious subsection with the LG dwarfs and the MW. We havetransformed the individual literature data points to the shown trendsby calculating their running averages as described in Section 2.
We see that LG dEs/dSphs do not reach the [Fe/H] levels of moremassive cluster dEs, which is expected from the mass–metallicityrelation [see e.g. Tremonti et al. 2004 or Gallazzi et al. 2005 forrelations derived from Sloan Digital Sky Survey (SDSS) data forgas phase and stellar metallicities, respectively – which relations,however, do not reach the dSph low-mass levels; as well as Hidalgo2017 for a M∗–[Fe/H]RGB relation for LG dwarfs covering the103–108.5 M∗ mass range].
To a first degree of approximation LG dSphs, do, however, showsimilar levels of [Mg/Fe] enhancement as more massive clusterdEs of the SAURON sample. We also see that the shape of the[Mg/Fe] versus [Fe/H] trend lines is similar for cluster dEs and LGdSphs that are up to two orders of magnitude less massive. Thiscomplements the findings of Kirby et al. (2011b) who found thatMW dSph satellites’ abundance ratios follow roughly the same pathwith increasing [Fe/H]. We note that our data do not reach as high[Mg/Fe] values as those of LG dSphs. This can possibly stem fromthe SNR limitations of the IFU data set: if we were to probe regionsmuch beyond 1 Re (for which most of the IL would likely comefrom oldest, i.e. high-[Mg/Fe] and low-[Fe/H] stars), it is possiblethat we would be seeing values of [Mg/Fe] as high as the above alsofor dEs.
Our dEs occupy roughly the same region of the [Mg/Fe] versus[Fe/H] diagram as the LMC stars and the high-metallicity regionsof the MW. A similar finding but for dSPh versus dIrrs was shownin Tolstoy et al. (2009) for (see their fig. 17) which they interpretedas dSphs being consistent with dIrrs that lost their gas at a late stageof their evolution.
5 D ISCUSSION AND SUMMARY
We have shown that the chemical enrichment histories of our galax-ies resemble those of the MW disc3 and the LG late-type dwarfLMC in that they occupy the same region in the [Mg/Fe] versus[Fe/H] diagram and the slopes of their [Mg/Fe] versus [Fe/H] trendlines are similar. Following up on the Tolstoy et al. (2009) findingfor dSphs and dIrrs discussed earlier, we could argue that dEs ex-tend the trend for late-type galaxies of comparable or higher massesand thus support the notion that dEs have evolved from late-typegalaxies that have lost their star-forming material at a point in theirevolutionary history, which likely coincided with entering regionsof higher environmental density (either groups or clusters). How-ever, with the current data we are unable to put a time stamp onsuch an event happening.
Low-mass ETGs are known to have lower [Mg/Fe] ratios thanmassive ETGs (Michielsen et al. 2008; S17) but an even strongerrelation exists between mass/σ and metallicity. Thanks to our spa-tially resolved data, i.e. the availability of local [Fe/H] and [Mg/Fe]values, we are able to show that the relation between σ and [Mg/Fe]
3 We note here that the thin and thick discs of the MW show different trendsin [Fe/H]–[α/Fe] diagrams (with [α/Fe] being more enhanced in the latter),though the trend seems less pronounced in the [Mg/Fe]–[Fe/H] relationitself (see e.g. Bensby et al. 2014, section 6, fig. 15 and Bland-Hawthorn &Gerhard 2016, section 5.2.2, and references therein).
holds even at fixed [Fe/H]. Lower [Mg/Fe] at a given [Fe/H] inthe case of dEs and LMC indicates an overall less efficient enrich-ment mechanism(s) as compared with e.g. massive ETGs, sincesuch galaxies have not managed to produce large amounts of metalrelative to the available star-building material. This means lowermass galaxies (exhibiting low [Mg/Fe] ratios) are either inefficientat turning gas into stars or they do produce metals but are unable toretain them (and so the new generations of stars are not enriched),either due to galactic winds, or environmental factors such as tidalforces or starvation that are able to stop the star forming process.
For galaxies of similar masses, differences in [Mg/Fe] ratios atfixed [Fe/H] can provide clues on the galaxies’ merger histories.Zolotov et al. (2010) find in their simulations that accreted stars,coming from lower mass objects, have lower [O/Fe] values (usedas proxy for [α/Fe]) at the high-[Fe/H] end than those stars thatwere formed in situ. The authors show that differences in [O/Fe]at similar [Fe/H] result from the different potential wells withinwhich in situ and accreted halo stars formed. While the various[α/Fe] versus [Fe/H] relations might differ quantitatively, they allshow the same (qualitative) behaviour in that the shape of the aboverelation shows a downturn at high [Fe/H] ratios (e.g. Tolstoy et al.2009; Mentz et al. 2016). Therefore, for galaxies of equal massesto have similar [α/Fe] ratios at fixed [Fe/H] would mean that theylikely have had similar merger histories – their stars having formedin similarly deep potential wells (unless the processes that affectedthe ratios managed to cancel each other out): alternatively, a galaxyfrom the above hypothetical pair but with lower [Mg/Fe], i.e. with alarger portion of its mass contained in stars of lower [Mg/Fe] musthave obtained them from smaller mass galaxies through a (seriesof) minor merger(s). We do not find a significant difference betweendEs and LMC, suggesting that – in terms of merger histories – theirevolutionary paths could have been similar.
The results presented here are in agreement with those of Mentzet al. (2016) for one dE observed with MUSE, as well as those inSen et al. (2018) who show central [Mg/Fe] values for 11 Virgo dEsdrawn from the SMAKCED project sample (Toloba et al. 2014).Besides [Mg/Fe], these works have been able to examine [Ca/Fe]and [Na/Fe] abundance ratios and noted the difference of the formerbetween their dEs and the LMC. However, a detailed discussion ofdiscrepancies seen in different elements’ abundance distributions isbeyond the scope of this paper.
Our approach presented here is limited by the SAURON wave-length range to the Fe5015 and Mg b metallicity-tracing indices.To strengthen and expand on our findings, as well as those quotedabove, it would therefore be advisable to obtain for our samplespectroscopic data covering a larger wavelength range (such as thatavailable with MUSE) so that other α elements can be studied si-multaneously alongside magnesium.
AC K N OW L E D G E M E N T S
We thank the anonymous referee whose suggestions and com-ments helped improve the presentation of the paper results. ASacknowledges the support of the Alexander von Humboldt Foun-dation through a Humboldt Research Fellowship for post-doctoralresearchers and through a Humboldt Return Fellowship. The paperis based on observations obtained at the William Herschel Tele-scope, operated by the Isaac Newton Group in the Spanish Ob-servatorio del Roque de los Muchachos of the Instituto de As-trofısica de Canarias. We thank Nicholas Scott for making hislocal velocity dispersion measurements for the ATLAS3D sampleavailable to us. AV and JF-B acknowledge support from grant
MNRAS 476, 4501–4509 (2018)Downloaded from https://academic.oup.com/mnras/article-abstract/476/4/4501/4911542by European Southern Observatory useron 27 July 2018
The hELENa project – II. 4507
Figure 3. Upper panel:[Mg/Fe] abundance ratio as a function of [Fe/H] for the compilation of literature data on the Milky Way and LG dwarf galaxies,compared with our own data on low-mass early-type galaxies. The galaxies are colour coded according to their dynamical mass as shown in the legend (seeSection 2 for details on the mass estimate sources and definitions). Blue cross shown on the right indicates an average error for the dE sample; for errors onindividual galaxies see Fig. 1. Lower panel: individual measurements from Tolstoy et al. (2009) and Bensby et al. (2014), overplotted with tracks shown in theupper panel.
AYA2016-77237-C3-1-P from the Spanish Ministry of Economyand Competitiveness (MINECO). RFP and TL acknowledge finan-cial support from the European Union’s Horizon 2020 research andinnovation programme under the Marie Skłodowska–Curie grantagreement no. 721463 to the SUNDIAL ITN network.
R E F E R E N C E S
Bensby T., Feltzing S., Oey M. S., 2014, A&A, 562, A71Bland-Hawthorn J., Gerhard O., 2016, ARA&A, 54, 529Cappellari M. et al., 2013, MNRAS, 432, 1709Carretta E., Bragaglia A., Gratton R., Lucatello S., 2009, A&A, 505, 139Cervantes J. L., Vazdekis A., 2009, MNRAS, 392, 691Collins M. L. M. et al., 2014, ApJ, 783, 7Colucci J. E., Bernstein R. A., Cohen J. G., 2014, ApJ, 797, 116Colucci J. E., Bernstein R. A., McWilliam A., 2017, ApJ, 834, 105Gallazzi A., Charlot S., Brinchmann J., White S. D. M., Tremonti C. A.,
2005, MNRAS, 362, 41Garcıa-Benito R., Perez-Montero E., 2012, MNRAS, 423, 406Geisler D., Smith V. V., Wallerstein G., Gonzalez G., Charbonnel C., 2005,
AJ, 129, 1428Hidalgo S. L., 2017, A&A, 606, A115Kirby E. N., Lanfranchi G. A., Simon J. D., Cohen J. G., Guhathakurta P.,
2011a, ApJ, 727, 78Kirby E. N., Cohen J. G., Smith G. H., Majewski S. R., Sohn S. T.,
Guhathakurta P., 2011b, ApJ, 727, 79Koch A., Grebel E. K., Gilmore G. F., Wyse R. F. G., Kleyna J. T., Harbeck
D. R., Wilkinson M. I., Wyn Evans N., 2008, AJ, 135, 1580Koleva M., de Rijcke S., Prugniel P., Zeilinger W. W., Michielsen D., 2009,
MNRAS, 396, 2133
Kuntschner H. et al., 2006, MNRAS, 369, 497Kuntschner H. et al., 2010, MNRAS, 408, 97Larsen S. S., Brodie J. P., Strader J., 2017, A&A, 601, A96Letarte B., 2007, PhD thesis, Univ. Groningen, the NetherlandsMcDermid R. M. et al., 2015, MNRAS, 448, 3484McWilliam A., Smecker-Hane T. A., 2005, ApJ, 622, L29Majewski S. R., Hasselquist S., Łokas E. L., Nidever D. L., Frinchaboy
P. M., Garcıa Perez A. E., Johnston K. V., Meszaros S., 2013, ApJ, 777,L13
Makarova L., Koleva M., Makarov D., Prugniel P., 2010, MNRAS, 406,1152
Mentz J. J., La Barbera F., Peletier R. F., Falcon-Barroso J., Lisker T.,van de Ven G., Loubser S. I., Hilker M., 2016, MNRAS, 463, 2819
Michielsen D. et al., 2008, MNRAS, 385, 1374Pipino A., Danziger I. J., 2011, A&A, 530, A22Pompeia L. et al., 2008, A&A, 480, 379Pritzl B. J., Venn K. A., Irwin M., 2005, AJ, 130, 2140Roediger J. C., Courteau S., Graves G., Schiavon R. P., 2014, ApJS, 210,
10Ruiz-Lara T. et al., 2015, A&A, 583, A60Sakari C. M., Wallerstein G., 2016, MNRAS, 456, 831Sbordone L., Bonifacio P., Buonanno R., Marconi G., Monaco L., Zaggia
S., 2007, A&A, 465, 815Schiavon R. P., 2007, ApJS, 171, 146Schiavon R. P., Caldwell N., Conroy C., Graves G. J., Strader J., MacArthur
L. A., Courteau S., Harding P., 2013, ApJ, 776, L7Scott N. et al., 2013, MNRAS, 432, 1894Sen S. et al., 2018, MNRAS, 475, 3453AShetrone M., Venn K. A., Tolstoy E., Primas F., Hill V., Kaufer A., 2003,
AJ, 125, 684Sybilska A. et al., 2017, MNRAS, 470, 815 (S17)
MNRAS 476, 4501–4509 (2018)Downloaded from https://academic.oup.com/mnras/article-abstract/476/4/4501/4911542by European Southern Observatory useron 27 July 2018

4508 A. Sybilska et al.
Thomas D., Maraston C., Bender R., Mendes de Oliveira C., 2005, ApJ,621, 673
Toloba E., Guhathakurta P., Peletier R. F., Boselli A., Lisker T., Falcon-Barroso J., Simon J. D., van de Ven G., 2014, ApJS, 215, 17
Tolstoy E., Hill V., Tosi M., 2009, ARA&A, 47, 371Tremonti C. A. et al., 2004, ApJ, 613, 898van der Marel R. P., Kallivayalil N., 2014, ApJ, 781, 121Vazdekis A., Sanchez-Blazquez P., Falcon-Barroso J., Cenarro A. J., Beasley
M. A., Cardiel N., Gorgas J., Peletier R. F., 2010, MNRAS, 404, 1639Vazdekis A. et al., 2015, MNRAS, 449, 1177Watkins L. L., Evans N. W., An J. H., 2010, MNRAS, 406, 264Wolf J., Martinez G. D., Bullock J. S., Kaplinghat M., Geha M., Munoz
R. R., Simon J. D., Avedo F. F., 2010, MNRAS, 406, 1220Wyse R. F. G., 2010, in Cunha K., Spite M., Barbuy B., eds, Proc. IAU Symp.
Vol. 265, Chemical Abundances in the Universe: Connecting First Starsto Planets. Cambridge Univ. Press, Cambridge, p. 461
Zolotov A., Willman B., Brooks A. M., Governato F., Hogg D. W., Shen S.,Wadsley J., 2010, ApJ, 721, 738
APPENDI X A : [Mg/ Fe] VERSUS [Fe/H] AS AF U N C T I O N O F G L O BA L σ
Here we provide the [Mg/Fe] versus [Fe/H] plots for the entire sam-ple discussed in the paper (Fig. A1), analysed in bins of increasingσ local (shown in the main text), σ global, as well as the second velocitymoment Vrms, with the view to providing reference for future stud-ies and comparisons involving a variety of object and data types.We note that the plots involving the three quantities are in excellentagreement.
MNRAS 476, 4501–4509 (2018)Downloaded from https://academic.oup.com/mnras/article-abstract/476/4/4501/4911542by European Southern Observatory useron 27 July 2018

The hELENa project – II. 4509
Fig
ure
A1.
As
inFi
g.2
butf
orco
mpa
riso
nco
lour
code
dby
σgl
obal
(lef
t),σ
loca
l(m
iddl
e),a
ndV
rms
valu
es.F
orea
chof
the
quan
titie
sal
lind
ivid
ualp
rofil
epo
ints
and
runn
ing
aver
ages
are
show
n.
Thi
spa
per
has
been
type
setf
rom
aT E
X/LA
T EX
file
prep
ared
byth
eau
thor
.
MNRAS 476, 4501–4509 (2018)Downloaded from https://academic.oup.com/mnras/article-abstract/476/4/4501/4911542by European Southern Observatory useron 27 July 2018