the health and well-being of people from pakistani, indian ... health and well-being report... ·...
TRANSCRIPT

The Health and Well-Being of People from Pakistani, Indian, African and Caribbean
Backgrounds in Greater Glasgow
a report of research carried out on behalf of
Greater Glasgow NHS Board
by
Derek Heim, Susan MacAskill, John B. Davies, Susan Anderson and
Gerard Hastings
The Centre for Applied Social Psychology (University of Strathclyde) in
conjunction with The Institute for Social Marketing (University of Stirling / The
Open University)
2005

The research was commissioned and funded by Greater Glasgow NHS Board
(GGNHSB) and the views expressed do not necessarily reflect those of the
Project Advisory Group or GGNHSB.
The Advisory Group for this research consisted of:
Evelyn Borland GGNHSB – Health Promotion
Allan Boyd GGNHSB – Information Services
Eric Fiamanya Glasgow City Council Social Work Services
Dr Russell Jones (Chair) Glasgow Centre for Population Health
Margaret McGranachan GGNHSB – Health Promotion (Research and
Evaluation)
Nuzhat Mirza GGNHSB – Priority Needs Team
Tina Yu Glasgow Healthy City Partnership
Many individuals and agencies assisted in making this research possible.
Although anonymity has been applied consistently within the report and no
agencies or individuals are identified, we are grateful for their time, help and
support. The authors would also like to thank the members of the Advisory
Group and Mariegold Akomode for valuable contributions to this research.
ii

Table of Contents
1 EXECUTIVE SUMMARY 1
2 INTRODUCTION AND METHODOLOGY 8
2.1 Background 8
2.2 Research Objectives 8
2.3 Method 9 2.3.1 Recruitment of Participants 9 2.3.2 The Sample 11
2.4 Interviews, Questionnaire and Data Collection 16 2.4.1 Fieldworker Recruitment 16 2.4.2 Fieldworker Training 16 2.4.3 Questionnaire Design 17
2.5 Ethical Issues 19
2.6 About the Report 20
3 PERCEPTIONS OF HEALTH AND ILLNESS 22
3.1 Self-Perceived Health and Well-Being 22 3.1.1 General Health 22 3.1.2 Self Perceived Physical, Mental/Emotional Well-Being and Overall Quality of Life23
3.2 Illness 24 3.2.1 Treatment for Conditions 24 3.2.2 Prevalence of Long-Term Conditions Interfering with Day-To-Day Activities 26
3.3 Perceived Effects of Home on Health 28
3.4 Oral Health 29
3.5 Mental Well-Being 30 3.5.1 Perceived Stress 30 3.5.2 Feeling in Control About Decisions Affecting Life 32 3.5.3 General Health Questionnaire 32
4 HEALTH SERVICES: USE AND SATISFACTION 34
4.1 Use of Specific Health Services 34 4.1.1 GP 34 4.1.2 Accident and Emergency 35 4.1.3 Hospital Outpatient Department 36 4.1.4 Day Surgery / Overnight Stay 36 4.1.5 Hospital Attendances of 2+ Days 37 4.1.6 Total Number of Times Seeing a Doctor in the Past Year 37
4.2 Satisfaction with Health Services 38 4.2.1 Perceived Adequacy of Information About Conditions or Treatments 38
iii

4.2.2 Extent of Perceived Encouragement to Participate in Decisions Affecting Participants’ Health and Treatment 40 4.2.3 Satisfaction with ‘Say’ in Delivery of Services 41 4.2.4 Views and Circumstances Understood 41
4.3 Language Difficulties 42 4.3.1 Understanding Advice Given 42 4.3.2 Getting Views Across 43
4.4 Dental Health 44
4.5 Difficulty in Accessing Health Services 45 4.5.1 Arranging Home Visits from GP 45 4.5.2 Getting GP Appointment 46 4.5.3 Getting to GP Surgery / Health Centre 46 4.5.4 Accessing Health Services in an Emergency 47 4.5.5 Obtaining Hospital Appointment for Self 48 4.5.6 Obtaining Appointments with Health Professionals for Family Members 49
5 HEALTH BEHAVIOURS 50
5.1 Smoking 50 5.1.1 Passive Smoking 50 5.1.2 Active Smoking 51
5.2 Alcohol Consumption 53
5.3 Diet 54 5.3.1 Fruit and Vegetable Consumption 54 5.3.2 Bread Consumption 56 5.3.3 Cakes, Sweets and Pastries 57 5.3.4 Breakfast Cereal Consumption 58 5.3.5 Oily Fish Consumption 59
5.4 Body Mass Index 61 5.4.1 BMI: Classified as Overweight 62 5.4.2 BMI: Classified as Obese / Extremely Obese 63 5.4.3 BMI: Mean Scores 64
5.5 Physical Activity 65 5.5.1 Moderate Physical Activity 66 5.5.2 Vigorous Physical Activity 67 5.5.3 Physical Activities: Meeting the Target 68
5.6 Oral Health Behaviour 68 5.6.1 Frequency of Brushing Teeth 68
5.7 Health Information 69 5.7.1 Format of Information on Health Issues 71 5.7.2 Distribution of Information 71 5.7.3 Language of Information 71
6 SOCIAL HEALTH AND CAPITAL 73
6.1 Social Connectedness 73 6.1.1 Number of Close Friends 73 6.1.2 Ethnic Background of Close Friends 73 6.1.3 Isolation from Friends and Family 73
iv

6.2 Perceptions of Local Area 74 6.2.1 Feeling of Belonging to Local Area 74 6.2.2 Significance of Friendships / Associations in Local Area 75 6.2.3 Trust in People of Local Area 76 6.2.4 Help with Problems 77 6.2.5 Perceptions of Personal Safety 78
6.2.5.1 Using Public Transport 78 6.2.5.2 Walking Alone 78 6.2.5.3 Feeling Safe in Own Home 79
6.3 Racism 80 6.3.1.1 ‘Minor’ Racist Events 81 6.3.1.2 ‘Major’ Racist Events 81
6.4 Social Capital 82 6.4.1 Community Group Membership 82 6.4.2 Acting as a Volunteer 84
6.5 Individual Circumstances 84 6.5.1 Perceptions of Identity 84
6.5.1.1 Feeling Scottish/British 85 6.5.1.2 Feeling ‘Ethnic Background’ 86
6.5.2 Nationality 87 6.5.3 Place of Birth 87 6.5.4 Length of Residency in Greater Glasgow 88 6.5.5 Language Knowledge and Ability 89
6.5.5.1 Languages Spoken 89 6.5.5.2 First Spoken Language 90 6.5.5.3 Self-Rated English Language Ability 91
6.5.5.3.1 Speaking English 91 6.5.5.3.2 Writing English 92 6.5.5.3.3 Reading English 92
6.5.6 Educational Attainment 93
6.6 Home and Environment 94 6.6.1 Household Size 94 6.6.2 Marital Status 97 6.6.3 Households with Children Under 14 Years and Use of Childcare 100
6.6.3.1 Responsibility for Children Under 14 Years 101 6.6.3.2 Use of Childcare 101
6.6.4 Caring Responsibility 102 6.6.5 Internet Access 102 6.6.6 Perceived Difficulty Paying Unexpected Bill 104 6.6.7 £20 Bill 104 6.6.8 £100 Bill 104 6.6.9 £1000 Bill 104 6.6.10 Proportion of Household Income from State Benefits 105 6.6.11 Types of Benefits 107
7 GENERAL CONCLUSIONS 109
7.1 Health 109
7.2 Mental Well-Being 110
7.3 Satisfaction with Service Provision 111
7.4 Oral Health 112
v

7.5 Alcohol Consumption and Smoking 112
7.6 Diet 113
7.7 Physical Activity 114
7.8 Body Mass Index 114
7.9 Distribution of Information Relating to Health 115
7.10 Perceptions of Local Area and Identity 116
7.11 Individual Circumstances and Financial Well-Being 116
7.12 Research Limitations 117
7.13 Further Areas for Research 118
8 REFERENCES 120
9 APPENDIX 122
vi

Index of Tables Table 2.1. Age and gender breakdown of the Pakistani sample. ........................................... 15 Table 2.2. Age and gender breakdown of the Indian sample................................................. 15 Table 2.3. Age and gender breakdown of the African and Caribbean sample....................... 15 Table 3.1. Participants’ responses to the question ‘how would you describe your health over
the past year’ by ethnicity. .............................................................................................. 22 Table 3.2. Mean ratings: quality of life, physical, mental/emotional well-being...................... 24 Table 3.3 Conditions currently treated for by ethnicity ........................................................... 25 Table 3.4. Perceived effects of home on health by ethnicity and gender............................... 28 Table 3.5. Responses to the question ‘what proportion of your teeth are your own?’ by
ethnicity. .......................................................................................................................... 29 Table 3.6. Responses to the question ‘what proportion of your teeth are your own?’ in 50+
years age group by ethnicity. .......................................................................................... 30 Table 3.7. Responses to the question ‘do you feel in control of the decisions that affect your
life?’ by ethnicity.............................................................................................................. 32 Table 4.1. Responses to the question ‘when was the last time you went to the dentist?’ by
ethnicity. .......................................................................................................................... 44 Table 5.1. Self-reported exposure to cigarette smoking by ethnicity and gender. ................. 50 Table 5.2. Self-reported smoking behaviour by ethnicity and gender. ................................... 52 Table 5.3. Mean number of cigarettes smoked a day. ........................................................... 52 Table 5.4. Self-reported frequency of alcohol consumption by ethnicity and gender. ........... 53 Table 5.5. Self-reported consumption of fruit and vegetables portions per day by ethnicity.. 55 Table 5.6. Slices of bread per day consumed by ethnicity. .................................................... 56 Table 5.7. Self reported consumption of sweets, cakes, etc. per day by ethnicity................. 57 Table 5.8. Self-reported consumption of breakfast cereal per week by ethnicity................... 58 Table 5.9. Consumption of oily fish per week by ethnicity...................................................... 60 Table 5.10. Self reported weekly consumption of oily fish by ethnicity. ................................. 60 Table 5.11. Moderate physical activity per week by ethnicity. ............................................... 66 Table 5.12. Responses to the question ‘in an average week, how often do you take 20
minutes vigorous exercise?’ by ethnicity. ....................................................................... 67 Table 5.13. Responses to the question ‘how often do you brush your teeth?’ by ethnicity. .. 69 Table 5.14. Perceived necessity of further information on health issues by ethnicity. ........... 70 Table 6.1. Nationalities by ethnicity. ....................................................................................... 87 Table 6.2. Languages spoken by ethnicity. ............................................................................ 90 Table 6.3. First spoken language by ethnicity. ....................................................................... 90 Table 6.4. Highest level of self-reported highest educational achievement by ethnicity........ 93 Table 6.5. Marital status by ethnicity. ..................................................................................... 98 Table 6.6. Marital status by age and gender of the Pakistani sample.................................... 98 Table 6.7. Marital status by age and gender of the Indian sample ........................................ 99 Table 6.8. Marital status by age and gender in the African and Caribbean sample. ............. 99 Table 6.9. Children under the age of 14 years in household (Pakistani sample) by gender and
age. ............................................................................................................................... 100 Table 6.10. Children under the age of 14 years in household (Indian sample) by gender and
age. ............................................................................................................................... 101 Table 6.11. Children under the age of 14 years in household (African and Caribbean sample)
by gender and age. ....................................................................................................... 101 Table 6.12. Proportion of household income from state benefits by age and gender (Pakistani
sample). ........................................................................................................................ 105 Table 6.13. Proportion of household income from state benefits by age and gender (Indian
sample). ........................................................................................................................ 106 Table 6.14. Proportion of household income from state benefits by age and gender (African
and Caribbean sample)................................................................................................. 107 Table 6.15. Types of benefits by ethnicity. ........................................................................... 108
vii

Index of Figures Figure 2.1. The Indian and Pakistani communities in Greater Glasgow by postcode sector. 12 Figure 2.2. The African and Caribbean communities in Greater Glasgow by postcode sector.
........................................................................................................................................ 13 Figure 3.1. Perceptions of health over preceding twelve months by ethnicity and age. ........ 23 Figure 3.2. Percentage of participants reporting that they receive treatment for at least one
condition by ethnicity and age......................................................................................... 26 Figure 3.3. Percentage of participants reporting conditions /illnesses by ethnicity. ............... 26 Figure 3.4. Mean number of conditions that interfere with day-to-day activities by ethnicity
and age. .......................................................................................................................... 28 Figure 3.5. Percentage of participants having all of their own teeth by ethnicity and age. .... 29 Figure 3.6. Perceived stress by ethnicity and gender. ........................................................... 31 Figure 3.7. Mean perceived stress scores by ethnicity and age. ........................................... 31 Figure 4.1. Mean number of GP visits in the past year by ethnicity and age. ........................ 34 Figure 4.2. Mean number of visits to a doctor by ethnicity and age....................................... 38 Figure 4.3. Extent of agreement with the question ‘were you given adequate information
about your condition or treatment?’ by ethnicity and age. .............................................. 39 Figure 4.4. Mean agreement with the question ‘were you encouraged to participate in
decisions affecting your health?’ by ethnicity and age. .................................................. 40 Figure 4.5. Mean agreement with the question ‘did you feel you had a say in how these
services were delivered?’ by age.................................................................................... 41 Figure 4.6. Mean agreement with the question ‘did you feel that your views and
circumstances were understood and valued?’ by ethnicity. ........................................... 42 Figure 4.7. Mean agreement with the question ‘did you have any problems understanding the
advice given because of language difficulties?’ by ethnicity and age. ........................... 43 Figure 4.8. Mean agreement with the question ‘did you have any problems getting your views
across because of language difficulties?’ by ethnicity and age. ..................................... 44 Figure 4.9. Mean perceived difficulty arranging a home visit from GP by ethnicity and age. 45 Figure 4.10. Mean perceived difficulty getting a GP appointment by age.............................. 46 Figure 4.11. Mean perceived difficulty getting to GP surgery / health centre by gender. ...... 47 Figure 4.12. Mean perceived difficulty accessing health services in an emergency by ethnicity
and age. .......................................................................................................................... 48 Figure 4.13. Mean perceived difficulty obtaining hospital appointment for self by age.......... 48 Figure 4.14. Mean perceived difficulty getting an appointment with health professionals for
family members by ethnicity and age. ............................................................................ 49 Figure 5.1. Self-reported exposure to cigarette smoking most of the time by ethnicity and
age. ................................................................................................................................. 51 Figure 5.2. Self-reported abstinence from consuming alcohol by ethnicity and age.............. 54 Figure 5.3. Mean number of fruit and vegetable portions consumed per day by ethnicity and
gender. ............................................................................................................................ 55 Figure 5.4. Mean number of fruit and vegetable portions consumed per day by ethnicity and
age. ................................................................................................................................. 56 Figure 5.5. Mean self-reported number of bread slices consumed per day by age and gender.
........................................................................................................................................ 57 Figure 5.6. Mean number of times per week that breakfast cereal is consumed by ethnicity
and age. .......................................................................................................................... 59 Figure 5.7. Mean self-reported consumption of oily fish by ethnicity and age. ...................... 61 Figure 5.8. BMI classification scores by ethnicity................................................................... 62 Figure 5.9. BMI scores classified as overweight (BMI>25) by age and gender. .................... 63 Figure 5.10. BMI scores classified as obese /extremely obese (BMI>30) by age and gender.
........................................................................................................................................ 64 Figure 5.11. Mean BMI scores by age and gender. ............................................................... 65 Figure 5.12. Moderate physical activity per week by ethnicity and age. ................................ 67 Figure 5.13. Vigorous physical activity per week by ethnicity and age. ................................. 68 Figure 5.14. Percentage of participants brushing teeth two times or more times per day by
ethnicity and age............................................................................................................. 69 Figure 6.1. Mean agreement with the statement ‘I feel I belong to my local area’ by ethnicity
and age. .......................................................................................................................... 74
viii

Figure 6.2. Mean agreement with the statement 'the friendships/associations I have in my local area with other people mean a lot to me’ by ethnicity and age. ............................. 75
Figure 6.3. Mean agreement with the statement ‘I can trust people in my local area’ by ethnicity and age............................................................................................................. 76
Figure 6.4. Mean agreement with the statement ‘if I have a problem, there is always someone to help me’ by ethnicity and age. .................................................................... 77
Figure 6.5. Mean agreement with the statement ‘I feel safe walking alone around my local area even after dark’ by gender and age........................................................................ 79
Figure 6.6. Mean agreement with the statement ‘I feel safe in my own home’ by ethnicity and age. ................................................................................................................................. 80
Figure 6.7. Mean schedule of racist events (‘minor’) scores by ethnicity and age................. 81 Figure 6.8. Schedule of major racist events (‘major’) mean scores by ethnicity and age. ..... 82 Figure 6.9. Community group membership / acting as a volunteer by ethnicity. ................... 83 Figure 6.10. Community group membership by ethnicity and age......................................... 83 Figure 6.11. Acting as a volunteer by ethnicity and age......................................................... 84 Figure 6.12. Feeling Scottish/British by ethnicity and age...................................................... 85 Figure 6.13. Feeling Scottish/British by ethnicity and gender. ............................................... 86 Figure 6.14. Percentage of participants born in the UK by ethnicity and age. ....................... 88 Figure 6.15. Years lived in Greater Glasgow by ethnicity and age. ....................................... 89 Figure 6.16. Self-rated ability to speak English by ethnicity and age..................................... 91 Figure 6.17. Self-rated ability to write English by ethnicity and age....................................... 92 Figure 6.18. Self-rated ability to read English by ethnicity and age. ...................................... 93 Figure 6.19. Household size (Pakistani sample). ................................................................... 94 Figure 6.20. Household size (Indian sample)......................................................................... 95 Figure 6.21. Household size (African and Caribbean sample)............................................... 96 Figure 6.22. Mean household size by gender and age. ......................................................... 97 Figure 6.23. Internet access by ethnicity and age................................................................ 103 Figure 6.24. Places of Internet access (home, elsewhere, or both) by ethnicity.................. 103 Figure 6.25. Perceived problem of paying unexpected bill of £1000 by ethnicity and age. . 105
ix

1 Executive Summary
This report summarises the research findings from a health and well-being survey
of people from African, Caribbean, Indian and Pakistani backgrounds living in
Greater Glasgow. The research was commissioned because the most recent
general population health and well-being survey (RBA, 2002) was not designed to
yield sufficient information on the health and well-being of minority ethnic
communities in Greater Glasgow. A similar survey of Greater Glasgow Chinese
community was also conducted on behalf of the Chinese Healthy Living Centre
(FMR Research, 2004). This study employed a culturally sensitive methodology
to obtain information on a number of indicators of health / mental health and well-
being, as well as broader issues relating to service delivery, community
involvement, home and environment, personal details, and experiences of
racism. Purposive sampling techniques were employed and the sample (overall
n=611) was stratified by age and gender according to 2001 minority ethnic
census figures and geographic location. A team of minority ethnic fieldworkers,
drawn from the respective minority ethnic populations, collected data with
respondents’ informed consent, and informants were reimbursed for participating
in the research. Fieldworkers were trained to help ensure standardised data
collection.
Key research findings are summarised below. Where comparisons to the general
population are made, these refer to the Glasgow-wide study conducted by RBA
(2002). It should be borne in mind that the minority ethnic communities sampled
in this research have a younger age-profile than the general population, and
differences in findings between the current survey and that of the general
population may be a consequence of this.
General Health
Respondents from Pakistani backgrounds tended to have the most negative
perceptions regarding their general health and well-being, and also reported the
most contact with service providers. For example, Pakistani respondents
reported receiving treatment for a significantly greater number of conditions and
illnesses than their Indian and African and Caribbean counterparts. African and
1

Caribbean respondents, in contrast, tended to have more positive self-
perceptions regarding their general health, with 8% of African and Caribbean
participants saying that they had a long-term condition that substantially
interfered with day-to-day activities, compared to 19% of Pakistani and 18% of
Indian informants.
Oral Health
Uptake of dental healthcare was lower in all minority ethnic groups sampled than
in the general population, and Pakistani respondents were less likely to say that
they brushed their teeth twice daily than the general population and the other
ethnic groups participating in this survey. African and Caribbean respondents
(89%) were significantly more likely than Indian (78%) and Pakistani respondents
(77%) to say that all of their teeth were their own. At the same time, African and
Caribbean (32%) respondents were less likely than Pakistani (50%) and Indian
(40%) to say that they had visited a dentist within the six months preceding the
interview. The finding that across ethnic groups, participants in this survey (62%)
were less likely than the general population (67%) to have attended a dental
surgery in the 15 months prior to being interviewed suggests that there may be a
particular need to encourage minority ethnic communities in Greater Glasgow to
visit (and/or register with) a dentist.
Mental Well-Being
In terms of mental well-being, Indian participants consistently scored lower on a
range of measures of psychological distress than their Pakistani and African and
Caribbean counterparts (i.e. indicated more positive mental well-being overall).
For example, Pakistani respondents consistently reported the highest levels of
perceived stress. Whilst, in contrast, African and Caribbean (20%) reported the
lowest levels of perceived stress, they were more likely than Pakistani (16%) and
Indian (12%) informants to have scores indicative of diminished psychological
well-being using the General Health Questionnaire - 12 (GHQ-12). African and
Caribbean respondents were also most likely to say that they did not feel in
control about decisions affecting their lives. Elevated GHQ-12 scores were
2

associated with self-reported experiences of racism in all minority ethnic groups
participating in this research.
Satisfaction with Health Services and Perceived Need for Health Related Information
Participants aged 50+ years were more likely than their younger peers to be
satisfied with health services in all minority ethnic groups; examples include
perceived ease of access to health service providers, feeling adequately informed
about treatments for conditions and illnesses, and with feeling that they have a
‘say’ in how services are delivered. At the same time, however, respondents
aged 50+ years were more likely than younger participants to report language
barriers in understanding the advice given and in getting their views across.
Moreover, Pakistani respondents reported more language difficulties both in
terms of understanding the advice given as well as getting their views across than
African and Caribbean survey participants. Independent of participant age,
Indian informants felt that service providers understood their views and
circumstances to a greater degree than did their Pakistani and African and
Caribbean contemporaries.
There was a perceived need for more health-related information to be made
available, in particular amongst participants from African and Caribbean
backgrounds. Respondents from African and Caribbean backgrounds, who
tended to have lived in the Greater Glasgow area for less time than Pakistani and
Indian participants, were more likely than participants from other minority ethnic
backgrounds surveyed to say that they required general information on NHS
services and procedures.
The great majority of participants wanted health-related information to be made
available in English. Additionally, survey findings suggest that this type of
information should also be made available in Punjabi and Urdu, in particular when
targeted at individuals from Pakistani and Indian backgrounds aged 50+ years.
Widespread distribution of information via by the postal services was found to be
a popular distribution strategy amongst survey participants.
3

Diet
Self-reported intake of fruit and vegetables was particularly low amongst
Pakistani respondents, whilst African and Caribbean respondents reported
relatively high overall levels of fruit and vegetable consumption. Thus 19%
Pakistani respondents reported eating the recommended amount of five or more
portions of fruit and vegetables, compared to 34% of the general population, 33%
of Indian and 47% of African and Caribbean respondents. Future research
should investigate this finding further to determine whether low-levels of self-
reported fruit and vegetable consumption are an artefact of distinct styles of food
preparation and the manner in which fruit and vegetables are utilised in cooking
practices.
Other findings indicated that individuals of Pakistani backgrounds reported
relatively higher consumption levels of sweet foods, a significant predictor of
excess body weight. Indian participants were least likely to meet the Scottish
Diet Plan target of eating oily fish at least two times per week. The need for
culturally sensitive Scottish Diet Plan guidelines with regards to recommended
amounts of breakfast cereal and bread consumption, in particular, also emerged
as part of the research process.
Physical Activity
Pakistani (32%) respondents were less likely than Indian (50%) and African and
Caribbean (45%) respondents to undertake the recommended amount of physical
activity per week, either five periods of moderate exercise for at least thirty
minutes, or doing three sessions of at least twenty minutes vigorous exercise.
This finding suggest that the general population, 58% of which reported meeting
this target in 2002, appear to be more physically active than the minority ethnic
groups participating in this survey.
4

Body Mass Index
Results relating to Body Mass Index (BMI) indicated that respondents in this
survey had a similar likelihood of being classified as overweight as the general
population. Regardless of their respective ethnic backgrounds, participants aged
30-49 years were significantly more likely to be classified as overweight than
those aged 16-29 and 50+ years. Amongst other factors, elevated BMI scores
were associated with treatment for medical conditions, self-reported stress, low
levels of physical activity and eating sweet foods.
Findings also suggested that Pakistani (13%) and African and Caribbean (12%)
respondents were significantly more likely than Indian informants (4%) to be
classified as either obese or extremely obese. Regardless of their ethnic
background, participants aged between 16 and 29 years (3%) were less likely
than those aged 30-49 (12%) and 50+ (16%) years were less likely to be
classified in this way. Across all participating minority ethnic groups men (7%)
were less likely to be classified as obese / extremely obese than women (13%).
This gender difference was also found in the general population survey.
Smoking and Alcohol Consumption
It should be borne in mind that levels of reporting alcohol and smoking behaviour
may reflect socio-cultural sensitivities and may have also been influenced by data
being collected by minority ethnic fieldworkers since responses may have been
socially desirable rather than ‘truthful’. Recognising these social and cultural
sensitivities, 22% of Pakistani, 11% of African and Caribbean, and 10% of Indian
participants in this survey said that they smoked, compared to 33% of the general
population in 2002. The current survey also found a tendency for smoking to be
more common amongst respondents aged 50+ years than amongst those aged
less than 50 years. In terms of passive smoking no differences between
participants in this survey and the general population emerged, although this
survey found exposure to cigarette smoke to be the most frequent response to an
open-ended question concerned with perceived adverse effects of participants’
homes on their health.
5

Self-reported alcohol consumption was low in all ethnic groups, and in particular
for female respondents. Thus 91% of Pakistani (85% of males and 97% females)
of 57% Indian (34% of males and 79% of females) and 60% of African and
Caribbean (56% of males and 64% of females) participants said they never
consumed drinks containing alcohol. Moreover, the number of participants who
said that they had consumed an alcoholic drink in the month preceding the
interview (7% of the entire sample reporting very low levels of alcohol
consumption) was not sufficient to be analysed meaningfully in terms of units of
alcohol consumed.
Individual Circumstances, Feelings Towards Local Areas and Perceptions of Identity
With regards to indicators of financial well-being, African and Caribbean
communities in Greater Glasgow were found to be less well off financially than
Pakistani and Indian communities. Thus African and Caribbean respondents
were significantly more likely than Pakistani and Indian respondents to say that all
of their household income was derived from state benefits, and payment of an
unexpected bill would be more difficult. Across ethnic groups, 67% of participants
in this survey said that they were not in receipt of any state benefits, compared to
43% of the general population. Moreover, among this sample, participants who
had lived in Greater Glasgow for a comparatively longer length of time were less
likely to be in receipt of state benefits regardless of their ethnic background.
Respondents from Indian and Pakistani backgrounds were more likely than
African and Caribbean participants to have Internet access in their homes,
perhaps an indicator of financial well-being. Overall however, 62% of Pakistani,
71% of Indian and 79% of African and Caribbean respondents reported having
access to the Internet, indicating other points of access for the latter group. This
also has relevance in terms of access to health-related information.
On average, African and Caribbean were significantly less likely to report feelings
of connectedness towards the local areas in which they lived, perhaps reflecting
shorter periods of residence in Glasgow (mean=6 years) compared with their
6

Pakistani (mean=17 years) and Indian (mean=17 years) contemporaries. Thus
African and Caribbean informants trusted people living in their area to a lesser
degree and also felt comparatively less safe. With 52% of African and Caribbean
informants living in single-person households (compared to 19% of Indian and
15% of Pakistani respondents, and 20% of the general population), they were
also the most likely to say that they felt isolated from friends and family.
Moreover, these participants reported significantly more incidences of racism and
discrimination than Indian and Pakistani participants.
These findings may go towards explaining why African and Caribbean
respondents were also found to identify with being Scottish/British less strongly
than both their Pakistani and Indian counterparts. African and Caribbean
participants were also significantly more likely than Indian and Pakistani
informants to act as volunteers and to be members of community groups,
potentially valuable sources of social support in light of feelings of discontentment
outlined above.
With regards to ethnic identity, which may buffer against adverse effects of
perceived discrimination, findings indicated that regardless of ethnic background
respondents who were aged 50+ years identified less strongly with their
respective ethnic backgrounds than those aged 16-49 years. .
Conclusions
NHS Greater Glasgow encompasses the highest proportions of minority ethnic
communities in Scotland, and an overriding priority is to tackle health inequalities,
with explicit linkages between health and social inclusion agendas. This study
has provided a snap shot of health and well-being issues among three of the
larger minority ethnic communities, identifying areas of concern as well as
positive factors, which will inform planning and identify areas for future research.
It also provides a baseline against which to measure changing issues and the
impact of initiatives aimed at improving the health and well-being of minority
ethnic communities in Greater Glasgow.
7

2 Introduction and Methodology
2.1 Background
Greater Glasgow NHS Board (GGNHSB) commissioned this piece of research
concerned with the health and well-being of minority ethnic communities in
Greater Glasgow with the aim of expanding on previous studies conducted in this
area. Earlier general population surveys did not provide sufficiently large sample
sizes of minority ethnic populations in Greater Glasgow to allow for an adequate
description of health and well-being and service issues among these groups or to
enable meaningful comparisons to be drawn with the population at large.
The research aimed to provide information on indicators of health and well-being
in Pakistani, Indian, African and Caribbean communities living in Greater
Glasgow, and commissioning this study is part of a broader strategy to monitor
the impact of health initiatives over time with the aim of meeting local and national
targets. Bearing in mind well-documented inequalities in health and well-being
experienced by minority ethnic communities (e.g. Karlsen and Nazroo, 2002;
Modood et al., 1997; Nazroo, 1997), this research is part of GGNHSB’s ongoing
commitment to address the health and health service needs of black and minority
ethnic people living in Greater Glasgow (e.g. Roshan, 2002; GGNHSB, 2002).
2.2 Research Objectives Specifically, the study reported here aimed to provide information on health and
well-being issues among minority ethnic communities in GGNHSB area, namely
members of the Pakistani and Indian community and the African and Caribbean
communities. Recently, the Chinese Healthy Living Centre conducted a similar
exercise in the Chinese community. Based on a questionnaire derived from the
Health and Well-being Study questionnaire (see Appendix) used in the general
population, it obtained data utilising a culturally sensitive approach on:
• Indicators relating to progress towards local and national targets. • Indicators to inform local service delivery. • Indicators measuring social connectedness and personal circumstances.
8

The information collected was intended to allow for the description of the health
and well-being of these communities together with identification of specific health
needs and service issues, and enable comparison with the population of Greater
Glasgow as a whole.
2.3 Method
2.3.1 Recruitment of Participants A quota sample was derived (Arber, 1993; Creswell, 1994; Haslam and
McGarthy, 2003; Babbie, 1992) based on 2001 census figures (e.g. Scottish
Executive, 2004; General Register Office for Scotland, 2003) for Greater Glasgow
(e.g. Minority Ethnic Census Data, 2001) comprising 350 Pakistani and Indian
and 200 African and Caribbean respondents. Participants were recruited utilising
purposive sampling techniques on the basis of convenience and availability of
respondents (Babbie, 1992), bearing in mind difficulties (e.g. the lack of
appropriate sampling frames) of sampling minority ethnic populations randomly
(McGraw et al., 1992; Hughes et al., 1995).
Building on our existing links with minority ethnic community groups and
individuals and making use of our research experience in this field, participants
were recruited through a variety of approaches. Potential respondents were
approached on the street and in areas frequented by minority ethnic individuals at
different times during the day and evening. Additionally, we employed
‘snowballing’ methods of participant recruitment, and approached community
organisations, groups and individuals to facilitate this.
Care was taken to ensure that participants were recruited via different social
networks. Data collection was monitored on a continuous basis to stratify the
sample in terms of age, gender and geographic area.
Respondents were interviewed at a time and place convenient to themselves,
within the constraints of interviewer safety. Fieldworkers received research
training (see below) that emphasised the desirability of conducting interviews in
locations (e.g. community centres, cafes) that maximise the likelihood of
obtaining ‘private’ responses (Malseed, 1990). Our budgeting allowed for
9

fieldworkers to pay for expenses (e.g. taxi fares, light refreshments) incurred by
selection of appropriate venues.
Participants were offered reimbursement of £10.00 in recognition of time and
expense involved. A fee is now commonly offered to participants in research
studies conducted in the Departments of Psychology and Marketing (and
approved by respective ethics committees). Remuneration is likely to have had a
positive impact on response rates, but the sum was not considered significantly
large enough to coerce individuals into participation. Furthermore, bearing this
ethical consideration in mind, and the fact that fieldworkers were being paid to
conduct interviews, offering respondents reimbursement also went towards
addressing equality between the participants and researchers, in recognition of
their contribution to the study. Respondents were asked to sign a receipt that
was sealed in an envelope and kept separately from the data obtained.
The research team and a representative from GGNHSB acted as arbitrators
between participants and fieldworkers and received a number of calls from
concerned participants. These phone calls were exclusively concerned with
participants’ worries about complete confidentiality, and were relatively evenly
spread among participating ethnic groups. More specifically, participants’ unease
centred predominantly on the possibility that individual responses could be
identified as a result of signing the consent and receipt forms. In the main these
participants were afraid that their responses would be made available to
immigration officials since some participants said that they had ‘unresolved
issues’ with relevant authorities. Other interviewees expressed concerns about
details of income sources being passed on to government departments dealing
with benefits.
Before considering the research findings in more detail it is thus important to note
that - despite guarantees of anonymity - some participants may have been
reluctant to disclose personal information of this nature accurately. From this
perspective, the number of concerned phone calls from participants worried about
their personal details being passed on to authorities may have been an informally
derived measure of concerns of this nature. Other participants, in turn, may
therefore have chosen not to give accurate information in the first place.
10

A relatively large number of phone calls were also received from participants
wanting to become involved in the research as fieldworkers, and a few minority
ethnic organisations that were approached with the aim of participant recruitment
also called to verify that fieldworkers were genuine.
2.3.2 The Sample
The final samples obtained are outlined below with overall figures for Greater
Glasgow. Figure 2.1 illustrates the areas of Greater Glasgow most densely
populated by people from Indian and Pakistani backgrounds and Figure 2.2
outlines the areas of Greater Glasgow most densely populated by the African and
Caribbean communities.
11
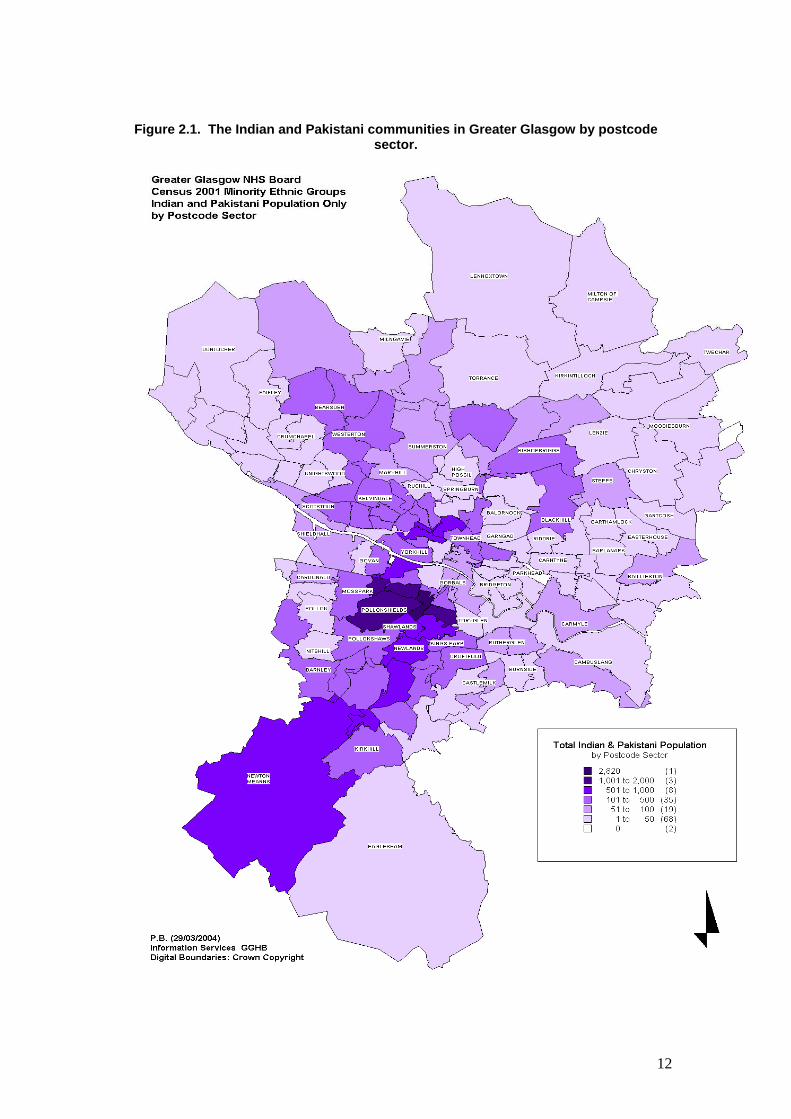
Figure 2.1. The Indian and Pakistani communities in Greater Glasgow by postcode
sector.
12

Figure 2.2. The African and Caribbean communities in Greater Glasgow by postcode
sector.
13

The overall age profile of the minority ethnic communities taking part in this
survey is younger than that of the Greater Glasgow population as a whole. This
is made clear in Tables 2.1-2.3 below which also summarise the age profile of the
Greater Glasgow general population according to the 2001 census. It is also
important to note that the official census figures of minority ethnic groups may not
be as accurate as might be hoped for, and there is dispute between Glasgow City
Council and the Scottish Executive regarding the size of the population (including
minority ethnic groups) in Glasgow (General Register Office for Scotland, 2003).
Bearing these limitations in mind, Tables 2.1-2.3 also provide the official 2001
Greater Glasgow census figures for the respective minority ethnic groups. The
achieved samples are broken down by participant gender and age. It will become
apparent that there are some slight discrepancies between the figures obtained
and the census data. Whilst these discrepancies and the lack of an accurate
sampling frame may make it impossible to be certain of the extent to which the
sample is fully representative of the populations, the analysis by age and gender
will go towards controlling for this potential limitation.
The target numbers, as detailed in the research brief, stipulated samples stratified
age and gender with 200 Pakistani, 150 Indian, 160 African and 40 Caribbean
individuals. As is illustrated in the Tables below, in terms of the total numbers of
participants the intended sample sizes were exceeded with a total of 610
individuals volunteering to participate in the research. In particular, the achieved
African and Caribbean sample size is noticeably larger than that targeted initially.
As a result of difficulties in recruiting sufficient numbers of Caribbean respondents
(n<30), it was decided on pragmatic grounds to combine these ethnic groups into
an ‘African and Caribbean’ sample.
The Pakistani sample is summarised in terms of its age and gender makeup in
Table 2.1.
14

Table 2.1. Age and gender breakdown of the Pakistani sample.
Age Group Male (n=110)
Female (n=101)
Both Genders (n=211)
Greater Glasgow Pakistani
Population
Greater Glasgow General
Population 16-24 29% 23% 26% 28% 16% 25-34 23% 29% 26% 27% 20% 35-44 16% 21% 18% 21% 20% 45-54 21% 17% 19% 12% 15% 55-64 8% 9% 9% 7% 12% 65+ 4% 2% 3% 5% 18%
The Indian sample is summarised in Table 2.2
Table 2.2. Age and gender breakdown of the Indian sample.
Age Group Male (n=74)
Female (n=81)
Both Genders (n=155)
Greater Glasgow
Indian Population
Greater Glasgow General
Population 16-24 20% 25% 23% 23% 16% 25-34 31% 31% 31% 25% 20% 35-44 15% 15% 19% 20% 20% 45-54 23% 15% 19% 15% 15% 55-64 7% 6% 7% 8% 12% 65+ 4% 9% 7% 8% 18%
Finally, Table 2.3 details the achieved African and Caribbean sample.
Table 2.3. Age and gender breakdown of the African and Caribbean sample.
Age Group Male (n=125)
Female (n=119)
Both Genders (n=244)
Greater Glasgow African &
Caribbean Population
Greater Glasgow General
Population
16-24 13% 19% 16% 22% 16% 25-34 36% 33% 34% 33% 20% 35-44 34% 27% 30% 25% 20% 45-54 10% 10% 10% 12% 15% 55-64 7% 9% 8% 5% 12% 65+ 1% 2% 1% 4% 18%
15

2.4 Interviews, Questionnaire and Data Collection
2.4.1 Fieldworker Recruitment
Conducting interviews through interpreters has been criticised for compromising
the quality of the data and using bi-, or multilingual, researchers is generally
preferred (McGraw et al., 1992: 283). Additionally, researchers are advised
strongly to involve study communities in the entire research process and ensure
diversity among researchers (McGraw et al., 1992; Gil and Bob, 1999), for
example, by recruiting minority ethnic postgraduate students as co-researchers
(Casas and Thompson, 1991) and building a research team with members of
minority ethnic groups sampled (Atkinson, 1993).
With this in mind, we built a multi-ethnic fieldwork team that included both males
and females. This was developed in three ways. First, we drew on our existing
pool of multi-lingual interviewers who have contributed to earlier studies. Second,
we recruited by email among postgraduate students from the University of
Strathclyde MSc marketing courses which have an international intake of
students, including those from Indian, Pakistani and African and Caribbean
backgrounds. Third, we approached community groups and individuals with the
aim of recruiting fieldworkers.
Thus the fieldwork team comprised 23 workers overall, including males and
females, competent in a mix of relevant languages, and with ages ranging from
16 years to 40 years. All fieldworkers were from Pakistani, Indian and African
backgrounds. Potential respondents were offered the opportunity to be
interviewed in the language of their choice and any concerns over fieldworker
gender could be accommodated.
2.4.2 Fieldworker Training
Socio-cultural sensitivities in relation to the target populations and the topic area
necessitates that interviewers comprehend and are comfortable with the
16

questionnaire and develop a range of interview strategies. Interviewers were
therefore given a comprehensive research training that promoted an awareness
of the sensitive nature of this research and prepares them for the challenges
faced. The training allowed for familiarisation with research aims and
methodology to facilitate standardised data collection, and covered the following
areas: ethical considerations, sampling, consistent data collection (minimisation
of random and systematic errors), attaining ‘private’ responses, rapport building,
probing/rephrasing, situational problems, ‘problem’ respondents, selection of
interview locations, taking field notes, impression management, safety,
fieldworker fatigue, familiarisation with research instruments (including role-play
trials) and support mechanisms (Gilbert, 1993; Creswell, 1994).
Special emphasis was given to consideration of the socio-cultural characteristics
of the target communities and cultural sensitivities in relation to health surveys
(McGraw et al., 1992). To this end we invited representatives from the Pakistani,
Indian, African and Caribbean communities to the research training, and asked
members of our fieldwork team from the respective communities to contribute.
Fieldworkers and community representatives were paid to contribute and take
part in the research training.
2.4.3 Questionnaire Design
The aims of the study meant that, in order to allow meaningful comparisons,
much of the questionnaire should as far as possible duplicate questions from the
Glasgow-wide general population health and well-being study as well as the
survey of the Chinese community. Thus question areas included:
Health
• Personal health conditions • Use of health services • Lifestyle factors (e.g. smoking, diet, exercise) • Quality of life
Community Involvement
• Participation / volunteering in local groups
17

Home and Environment
• Access to telephone / internet • Impact of home conditions on health • Feelings of neighbourliness / personal safety • Experience of racism
Personal Details
• Health information needs and preferred format / communication routes • Education experience and confidence in spoken and written languages • Indicators of financial and employment status • Family and household composition and care roles • Birthplace and nationality
However, it was also important to include questions that would reflect issues
specific to the study populations, such as experiences of racism and so on. The
questionnaire was developed with the support of the Steering Group and was
piloted among members of the appropriate communities.
Interviews were conducted in participants’ preferred language, which may not
have been English, and it was therefore essential that the questionnaire be
translated appropriately. Following best practice in minority ethnic and cross-
cultural epidemiological research, but also recognising resource limitations, a
modified back translation was used. The original instrument was translated into
Urdu, Hindi, Punjabi and French. We then had different fieldworkers verbally
translate these versions back into English, allowing for their comparison and
scrutiny. This helped ensure that the research instrument was appropriate to the
target groups in terms of use of languages, and did not make inappropriate use of
‘high’ forms of the languages in translation when more colloquial forms may be
more appropriate (Bhopal et al., 2004). This procedure also helped to ensure
that translations were equivalent in meaning and measurement in each of the
languages (Brislin, 1993). This is vital since responses obtained needed to be
conceptually alike to maximise reliability and validity, allowing for legitimate
comparisons of responses across target groups (Bhopal et al., 2004; McGraw et
al., 1992).
With the aim of enhancing reliability and validity and helping ensure equivalent
responsiveness across target groups, the research instruments were revised, as
18

appropriate, in consultation with lay people from respective minority ethnic
communities. Additionally, the instruments were piloted on individuals (males
and females of different ages) from each of the target populations with the aim of
ensuring their comprehensibility, and minimising the likelihood of questions being
socially, culturally or religiously inappropriate, offensive or irrelevant (Bhopal et
al., 2004). A number of changes to the translated versions were following these
procedures to help ensure that the different language versions were as equal in
meaning as was achievable.
In practice, the majority of interviews in the older age groups in the Pakistani and
Indian samples were conducted in a language other than English. A number of
interviews with Pakistani and Indian respondents were also conducted in English
with interviewers making use of translated versions of the questionnaire in
addition to the English version. Almost all of the African and Caribbean
participants were interviewed in English.
2.5 Ethical Issues
The research team was aware of ethical issues involved in research in general
and working with black and minority ethnic communities and were committed to
adhering to established ethical standards. The research was conducted in
accordance with the University of Strathclyde’s Code of Practice on Investigations
on Human Beings (2000) and ethical approval was obtained from the University’s
Ethics Advisory Committee following minor amendments to the information sheet,
consent form and questionnaire.
Potential participants were given a study information sheet in appropriate
languages summarising the aim of the research, stressing its confidential nature
and stating that respondents were free to terminate involvement at any point
without giving a reason. It also clearly stated that all information collected would
be made anonymous and that data would only be reported in aggregate form.
The information sheet also stated that data might be used for future analysis and
that confidentiality and anonymity would always be ensured. It also contained
contact telephone numbers for the research team to give respondents the
opportunity to make further enquiries and to comment on the study.
19

Participants were given the opportunity to ask questions about the study. To help
ensure informed consent, participants were asked to sign a consent form (also
written in appropriate languages) and tick ‘yes’ or ‘no’ boxes to indicate they had
read the information sheet, had the opportunity to ask questions, and understood
they could withdraw and that information would remain confidential. The signed
consent form was sealed in an envelope and kept separately from data obtained.
For quality control purposes, where participants were happy to provide a contact
telephone number to facilitate back checking of interviews, this was sealed in an
envelope and kept separately from data. We contacted more than 10% of
participants to confirm that interviews had been undertaken, and that key data
were collected accurately.
The data were collated on a computer database in secure files accessible only to
main researchers. In the interest of complete confidentiality no personal
information such as a person’s name or initials was recorded on that database. A
unique research number was assigned and only this was entered into the
database along with age, gender, ethnicity, and other data obtained.
2.6 About the Report
The findings detailed in this report are summarised in the following chapters:
• Perceptions of Health and Illness • Health Services: Use and Satisfaction • Health Behaviours • Social Health and Capital (including individual circumstances)
In addition, the final chapter, general conclusions, draws together the principal
research findings at a more abstract level with the aim of making
recommendations for improving the health and well-being of minority ethnic
individuals and communities in Greater Glasgow.
All data underpinning this report were analysed inferentially as a function of
ethnicity, participant age and gender using SPSS. This helped ensure that the
minority ethnic groups sampled were not treated as homogenous, and that
20

analysis would allow for consideration of more specific circumstances and
characteristics. Additional analysis linked key indicators of (mental) health and
well-being to perceptions of: (i) personal wealth, (ii) social isolation and living
conditions, (ii) experiences of racism, (iii) educational attainment and employment
status. The report details statistically significant differences (p<0.05) between
variables, in addition to providing descriptive statistics.
Where comparison is made with the population of Greater Glasgow, this refers to
the study conducted by RBA (2002).
21

3 Perceptions of Health and Illness
3.1 Self-Perceived Health and Well-Being
3.1.1 General Health
Indian and African and Caribbean participants in this survey had more positive
self-perceptions of their health than the Greater Glasgow population and
Pakistani participants in this survey. In Greater Glasgow 67% of respondents
rated their general health as ‘Excellent’ (24%) or ‘Good’ (43%). By comparison,
86% of African and Caribbean and 76% of Indian interviewees rated their health
as either excellent or good. Pakistani participants (65%), on the other hand, were
very similar to the general population. Table 3.1 summarises the ratings obtained
in this survey.
Table 3.1. Participants’ responses to the question ‘how would you describe your health
over the past year’ by ethnicity. Pakistani
(n=210) Indian
(n=155) African & Caribbean
(n=244) Entire Sample
(n=609) Greater Glasgow
(n=1802) Excellent 23% 31% 40% 32% 24%
Good 42% 45% 46% 44% 43% Fair 28% 19% 12% 19% 18% Poor 7% 6% 2% 5% 15%
There was a clear and significant trend whereby positive self-perceptions of
general health decreased with age. This is illustrated in Figure 3.1.
22

Figure 3.1. Perceptions of health over preceding twelve months by ethnicity and age.
0102030405060708090
100
16-24 25-34 35-44 45-54 55-64 65+
Age
% p
ositi
ve Pakistani (n=210)Indian (n=155)African & Caribbean (n=244)Entire Sample (n=609)
N.B. Numbers of African & Caribbean participants in the 65+ years age category are very small.
Further analysis indicated no differences in this trend as a function of gender.
However, across age groups, Indian and African and Caribbean respondents
tended to have more positive perceptions of their general well-being than do
Pakistani respondents.
3.1.2 Self Perceived Physical, Mental/Emotional Well-Being and Overall Quality of Life
Participants were asked to rate their overall quality of life; their physical and
mental/emotional well-being with the aid of the following ‘faces scale’.
A B C D E F G
When the first three ‘smiley’ faces were combined into a ‘positive perception’
category, 94% of the sample rated their overall quality of life positively, whilst
93% rated their physical well-being positively, and 90% of the overall sample
rating their mental/emotional well-being positively. The face rating did not differ
significantly as a function of ethnicity, age, or gender. When the data were
23

analysed as a seven-point continuous scale from 7 (positive) to 1 (negative), no
significant gender, age or ethnicity differences emerged. The mean ratings
across ethnic groups are summarised in Table 3.2.
Table 3.2. Mean ratings: quality of life, physical, mental/emotional well-being across the
sample (and Greater Glasgow comparison). Current
Survey Mean (SD)
Greater Glasgow
Mean (SD) Which face best rates your overall quality of life? (n=586) 6.09 (0.97) 5.56 (1.12) Which face best rates your general physical well-being? (n=586)
6.02 (1.0) 5.24 (1.35)
Which face best rates your general mental or emotional well-being? (n=579)
5.97 (1.10) 5.45 (1.29)
3.2 Illness
3.2.1 Treatment for Conditions
Participants were asked to indicate whether or not they were currently being
treated for a number of conditions (see Table 3.3). Pakistani (mean=0.69,
SD=0.07) participants reported being treated for significantly more conditions
than did African and Caribbean (mean=0.4, SD=0.68) respondents. The mean
number of conditions reported by Indian respondents for which they were
currently receiving treatment was 0.64 (0.09). There were no significant gender
differences in terms of number of conditions reported. However, the finding
outlined above that the likelihood of positive perceptions of health decreased with
age was mirrored by the finding that participants aged 50+ years (mean=1.44;
SD=1.63) reported that they were being treated for significantly more conditions
than both the younger age groups. Participants aged 16-29 years (mean=0.19,
SD=0.44), in turn, reported being currently treated for significantly less conditions
than those aged 30-49 years (mean=0.47; SD=0.9).
24

Table 3.3 Conditions currently treated for by ethnicity (number of participants in brackets). Condition Pakistani Indian African &
Caribbean Entire
Sample % (n) % (n) % (n) % (n) Coronary heart disease 3 (7) 3 (4) 1 (2) 2 (13) Stroke 2 (5) 1 (2) 0 1 (7) Arthritis or rheumatism or painful joints
6 (13) 8 (12) 4 (9) 6 (34)
Clinical depression 3 (7) 2 (3) 1 (3) 2 (13) Diabetes 9 (19) 5 (8) 2 (5) 5 (32) Cancer 0 1 (1) 1 (2) 1 (3) Asthma, bronchitis, or persistent cough
6 (12) 6 (9) 3 (8) 5 (29)
Epilepsy 0 1 (1) 0 <1 (1) Stress related conditions (e.g. difficulty sleeping or concentrating)
5 (10) 7 (10) 3 (8) 5 (28)
Hearing problems 3 (6) 3 (5) 1 (2) 2 (13) Eyesight problems 8 (17) 8 (13) 8 (19) 8 (49) Accident / injury 1 (1) 4 (6) 1 (2) 2 (9) Gastro-intestinal problems (e.g. peptic ulcer disease, irritable bowel syndrome)
5 (11) 2 (3) 3 (8) 4 (22)
High blood pressure 11 (22) 8 (13) 7 (18) 9 (53) Drug or alcohol related conditions
1 (1) 1 (2) 1 (2) 1 (5)
Other/s 6 (13) 4 (6) 4 (9) 5 (29) None 58 (121) 65 (100) 77 (188) 67 (409)
The mean number of conditions for which the Greater Glasgow population is
currently being treated is 0.8 (SD=1.2). This is somewhat higher than was found
in this survey.
Across the sample 21% of participants reported being treated for one condition,
5% of respondents reported being treated for two conditions, and 6% of
interviewees reported being treated for three or more conditions. As Table 3.3
illustrates, there is a trend by which Pakistani interviewees report being treated
for comparatively more conditions than Indian or African and Caribbean
informants. Pakistani participants reported the most conditions for which they
were currently receiving treatment, and African and Caribbean respondents the
least (see also Figure 3.2). The latter were also the most likely to say that they
were not being treated for any condition.
25

Figure 3.2. Percentage of participants reporting that they receive treatment for at least one
condition by ethnicity and age.
0102030405060708090
100
16-24 25-34 35-44 45-54 55-64 65+
Age
% in
trea
tmen
t with
at l
east
one
co
nditi
on
Pakistani (n=210)Indian (n=154)African & Caribbean (n=244)Entire Sample (n=608)
N.B. Numbers of African & Caribbean participants in the 65+ years age category are very small.
3.2.2 Prevalence of Long-Term Conditions Interfering with Day-To-Day Activities
Figure 3.3 summarises the percentage of participants who reported suffering from
distinct conditions (multiple responses were possible) that substantially interfered
with day-to-day activities by ethnicity.
Figure 3.3. Percentage of participants reporting conditions /illnesses by ethnicity (multiple
responses possible).
0
2
4
6
8
10
12
Pakistani Indian African &Caribbean
Entire Sample
Ethnicity
% re
port
ing
long
-term
co
nditi
on/il
lnes
s
Physical DisabilityLong-term IllnessMental/Emotional Health ProblemOther(s)
26

Analysis of the total number of participants reporting at least one condition
suggests that 19% (40 participants) of Pakistani, 18% (28 participants) of Indian
and 8% (19 participants) of African and Caribbean respondents said that they had
at least one long-term condition or illness that substantially interfered with their
day-to-day activities. In the Greater Glasgow population, which has an older age-
profile than the populations surveyed in this piece of research, 23% of
respondents reported having a long-term condition or illness that interfered with
day-to-day activities. This percentage is only slightly higher than that of the
Pakistani and the Indian informants in this survey. African and Caribbean
participants, in contrast, reported suffering from substantially fewer conditions
that interfered with day-to-day activities.
Consideration of the mean number of conditions reported by participants reveals
the following picture. Across the sample, participants aged 16-29 years
(mean=0.04, SD=0.23) reported significantly less conditions than those aged 30-
49 years (mean=0.12, SD=0.36). Respondents aged 50+ years (mean=0.16,
SD=0.4) reported significantly more conditions than both of the younger age
groups. The comparable figures for Greater Glasgow suggest a similar trend. In
the RBA survey (2002) respondents aged 16-20 years reported a mean of 0.29
(0.73) conditions/illnesses currently treated for, those aged 30-49 years reported
0.56 (0.99) conditions/illnesses, and those aged 50+ years reported 1.35 (1.4)
illnesses/conditions. Additionally, across the sample, African and Caribbean
participants (mean=0.08, SD=0.27) reported significantly fewer conditions than
both Indian (mean=0.21, SD=0.48) and Pakistani (mean=0.21, SD=0.44)
respondents.
As Figure 3.4 illustrates, the pattern of results also differed as a function of a
combination of both age and ethnicity. In the youngest age group of 16-29 years
Indian (mean=0.12, SD=0.38) participants reported significantly more conditions
that interfered with day-to-day activities than their Pakistani (mean=0.01,
SD=0.12) and African and Caribbean (mean=0.01, SD=0.11) counterparts.
There were no significant differences between ethnic groups in the two older age
groups.
27

Figure 3.4. Mean number of conditions that interfere with day-to-day activities by ethnicity and age.
ipants were asked whether there was anything about their home that
Table 3.4. Perceived effects of home on health by ethnicity and gender (number of
Male Genders
0
0.1
0.2
0.3
0.4
0.5
0.6
0.7
16-29 30-49 50+
Age
Mea
n nu
mbe
r of c
ondt
ions
in
terf
erin
g w
ith d
ay-to
-day
ac
tiviti
es Pakistani (n=208)
Indian (n=154)African & Caribbean (n=240)Entire Sample (n=602)
3.3 Perceived Effects of Home on Health
Partic
affected their health, and those who felt that there was something about their
home affecting their health were invited to give details. Results are summarised
by gender and ethnicity in Table 3.4, and indicate that approximately 18% of the
sample thought that something about their home affected their health adversely.
Analysis indicated no significant differences in response patterns by age (16-29,
30-59, 50+ years age groups) or ethnicity. However, the difference between
male and female participants was significant in African and Caribbean sample
(see Table 3.4), whilst the Indian and Pakistani male and female participants did
not differ in terms of their perceptions regarding whether anything about their
home affected their health. Smoking in the home was the most commonly named
perceived adverse affect on health, and mentioned by 9% of respondents.
participants in brackets). Female Both
% (n) % (n) % (n) Pakistani 20 (22) 17 (17) 19 (39) Indian 15 (11) 21 (17) 18 (28) African & Caribbean 10 (13) 24 (28) 17 (41)
28

3.4 Oral Health
Survey findings regarding the proportion of teeth participants reported as being
their own are summarised below. Table 3.5 illustrates that African and Caribbean
participants were more likely than Indian and Pakistani respondents to say that all
of their teeth were their own.
Table 3.5. Responses to the question ‘what proportion of your teeth are your own?’ by
ethnicity. Pakistani(n=211)
Indian (n=153)
African & Caribbean(n=244)
Entire Sample (n=608)
All of them 77% 78% 89% 82% Some of them 20% 20% 11% 16% None of them 2% 3% 0% 2%
Figure 3.5 illustrates that the proportion of participants reporting to have all of
their own teeth decreased with age.
Figure 3.5. Percentage of participants having all of their own teeth by ethnicity and age.
0102030405060708090
100
16-24 25-34 35-44 45-54 55-64 65+
Age
% p
artic
ipan
ts s
ayin
g al
l the
ir te
eth
are
thei
r ow
n
Pakistani (n=211)Indian (n=153)African & Caribbean (n=244)Entire Sample (n=608)
N.B. Numbers of African & Caribbean participants in the 65+ years age category are very small.
Table 3.6 summarises responses to the question ‘what proportion of your teeth
are your own?’ given by participants aged 50+ years. As Table 3.6 illustrates,
across the sample, less than 10% of participants in this age group reported that
none of their teeth were their own. In comparison, 45% of the Greater Glasgow
population, aged 50+ years, reported that none of their teeth were their own.
This finding may, in part, be explained by the comparatively younger age profile
29

of the current sample. Additionally, the findings regarding the frequency of visits
to the dentist (discussed in Chapter 4) may also influence the responses
summarised in this section, and vice versa.
Table 3.6. Responses to the question ‘what proportion of your teeth are your own?’ in 50+
years age group by ethnicity (number of participants in brackets). Pakistani Indian African & Caribbean Entire Sample % (n) % (n) % (n) % (n) All of them 43 (9) 35 (6) 67 (14) 49 (29) Some of them 48 (10) 53 (9) 33 (7) 44 (26) None of them 10 (2) 12 (2) 0 7 (4)
3.5 Mental Well-Being
3.5.1 Perceived Stress
Perceived stress was measured by means of a four-item ‘perceived stress’
questionnaire. This short scale was derived from a 14-item measure devised by
Cohen et al. (1983) as a measure of self-appraised stress. Five-point scales
ranging from 0 (Never) to 4 (Very often) were used to indicate how often in the
previous four weeks, participants had, e.g., ‘felt that things were going your way’,
‘felt that you were unable to control the important things in your life’. The
aggregate score of the four individual items determined overall perceived stress
score.
Across the entire sample, Pakistani participants (mean=6.62, SD=2.62) reported
significantly more perceived stress than their Indian (mean=5.54, SD=2.34) and
their African and Caribbean (mean=5.05, SD=3.03) counterparts. Moreover,
across the total sample female participants (mean=6.04, SD=2.8) reported
consistently higher levels of stress than male respondents (mean=5.41, SD=2.8).
These findings are illustrated in Figure 3.6.
30

Figure 3.6. Perceived stress by ethnicity and gender.
2
3
4
5
6
7
8
Pakistani Indian African &Caribbean
Entire Sample
Ethnicity
Mea
n pe
rcei
ved
stre
ss s
core
MalesFemalesBoth Genders
Further analysis, illustrated in Figure 3.7 below, indicated that in the 16-29 years
age group, Indian participants reported significantly lower levels of stress than
their Pakistani counterparts (with African and Caribbean participants being in-
between). In the 30-49 years age group, African and Caribbean informants
reported significantly lower stress levels than both Pakistani and Indian
participants. Finally, in the 50+ years age group, there was no significant
variation in perceived stress scores as a function of ethnicity.
Figure 3.7. Mean perceived stress scores by ethnicity and age.
3
3.5
4
4.5
5
5.5
6
6.5
7
7.5
16-29 30-49 50+
Age
Mea
n pe
rcei
ved
stre
ss s
cale
sco
res
Pakistani (n=209)Indian (n=153)African & Caribbean (n=241)Entire Sample (n=603)
31

3.5.2 Feeling in Control About Decisions Affecting Life
Participants were asked the degree to which they felt in control of decisions
affecting their lives, such as planning their budget, moving house or changing
jobs (see Table 3.7). African and Caribbean participants were most likely to state
that they did not feel in control of the decisions affecting their lives, with Indian
participants being the least likely to say that they felt that way. There were no
gender and age differences in the number of participants saying that they did not
feel in control of decisions affecting their lives.
Table 3.7. Responses to the question ‘do you feel in control of the decisions that affect
your life?’ by ethnicity. Pakistani
(n=207) Indian
(n=151)African & Caribbean
(n=242) Entire Sample
(n=600) Definitely 52% 62% 50% 54% To some extent 34% 31% 34% 33% No 14% 7% 17% 13%
3.5.3 General Health Questionnaire
With the aim of assessing participants’ mental well-being, participants were asked
to complete the twelve-item General Health Questionnaire (GHQ-12). The GHQ-
12 is a screening instrument that is used to detect signs of psychological distress
both in community and clinical settings. Participants are asked to think about
their general health over the past few weeks, and asked to indicate their
agreement with a number of statements (e.g. ‘have you recently lost much sleep
over worry?’) on a four-point scale from 0 (Not at all) to 4 (Much more than
usual). There are two main methods of scoring the GHQ-12. First, the bimodal
method whereby each of the statements is scored as either 0 (Not present) or 1
(Present). This method produces scores from 0–12 and a threshold score of 4
(sometimes 3) or more is usually considered to be indicative of potential
psychiatric morbidity. Second, the Likert scoring method, a more differentiated
scoring approach, whereby each statement is scored from 0-3. This method
produces scores from 0-36, and scores above 15, or so, are usually considered
to be indicative of potentially diminished psychological well-being.
The GHQ-12 was not administered in the Greater Glasgow wide health and well-
being survey (RBA, 2002). However, it featured in the 1998 Scottish Health
32

Survey (Calderwood and Park, 2000), which used the bimodal scoring method
with a threshold score of 4.
In total 202 Pakistani, 146 Indian and 236 African and Caribbean participants
completed the GHQ-12. Analysis using the bimodal scoring method indicated
that 16% of Pakistani, 12% of Indian, and 20% of African and Caribbean
respondents scored 4 or more on the GHQ-12. There were no significant
differences as a function of participants’ ethnicity or age in this pattern of results.
The Scottish Health Survey indicates that across Scotland men (13%) are
significantly less likely than woman (18%) to have GHQ-12 scores of four or
above. In this survey no significant gender differences were found.
Analysis of the GHQ-12 scores utilising the more differential Likert scoring
method, outlined above, indicated that Pakistani participants’ (mean=11.01,
SD=5.12) scores were significantly higher than those of African and Caribbean
respondents (mean=9.64, SD=5.26). The difference between Pakistani and
Indian respondents (mean=9.69, SD=5.36) failed to reach statistical significance
despite Indian respondents’ mean GHQ-12 score being similar to that of the
African and Caribbean respondents. This is likely to be the result of the smaller
sample size of Indian respondents in comparison to the African and Caribbean
group. Fifteen percent of respondents had a GHQ-12 score of 15 or above and
this did not vary to a significant degree as a function of ethnicity, gender or age.
Further analysis indicated that elevated GHQ-12 scores (Likert scoring method)
were predicted by:
• Poor perceptions of general health, physical well-being, overall quality of
life, and mental/emotional well-being.
• Experience of racism (Schedule of ‘Minor’ Racist Events Scores).
33

4 Health Services: Use and Satisfaction
4.1 Use of Specific Health Services
Participants were asked to report contacts with specific health services in the past
twelve months. Since the present survey utilised different scales than the general
population health and well-being survey, this section does not make comparison
to the Greater Glasgow population as a whole.
4.1.1 GP
Participants were asked to recall the number of visits they had made to a GP in
the twelve months. Responses are summarised by age and ethnicity in Figure
4.1.
Figure 4.1. Mean number of GP visits in the past year by ethnicity and age.
0
2
4
6
8
10
12
16-24 25-34 35-44 45-54 55-64 65+
Age
Mea
n nu
mbe
r of s
elf-r
epor
ted
GP
visi
ts p
er y
ear
Pakistani (n=208)Indian (n=153)African & Caribbean (n=237)Entire Sample (n=598)
N.B. Numbers of African & Caribbean participants in the 65+ years age category are very small.
The mean number of GP visits in the past twelve months increased significantly
for Pakistani and Indian participants with age, although it would appear that this
trend was not significant in the African and Caribbean sample. Seventeen
percent (103 respondents) of the sample reported not visiting a GP at least once.
This is similar to the Greater Glasgow population, 20% of which reported not
seeing their GP once.
34

The mean number of GP visits across the sample was 3.92 (SD=7.11) and, as
can be seen from Figure 4.1, increased significantly with age with participants
aged 16-29 years reporting 2.3 (SD=2.39), those aged 30-49 years reporting 4.16
(SD=7.94), and those respondents aged 50+ years reporting an average of 6.56
(SD=10.02) visits in the past twelve months. Mirroring the more negative
perceptions of health, outlined above, Pakistani participants (mean=5.41,
SD=10.69) reported significantly more visits to their GP over the twelve months
preceding the interview than their Indian (mean=3.51, SD=4.93) and African and
Caribbean (mean=2.87, SD=2.30) counterparts. In Greater Glasgow, as a whole,
informants said that they went saw their GP a mean of 4.3 (6.9) times. This is
somewhat higher than in the present survey. RBA (2002) found that respondents
aged 16-29 years went a mean 3.4 (6.9), those age 30-49 years reported a mean
of 4.4 (8.1) visits, whilst those aged 50+ years reportedly went 4.8 (5.5) on
average.
4.1.2 Accident and Emergency
The mean number of visits to an Accident and Emergency (A&E) department did
not vary as a function of ethnicity to a significant degree (sample mean=0.34,
SD=1.2), with 81% (490 participants) of the sample reporting no visits. As above,
the frequency of visits increased with age. Participants’ aged 50+ (mean=0.72,
SD=2.34) reported significantly more visits than those aged 16-29 (mean=0.2,
SD=0.52) and 30-49 years (mean=0.3, SD=0.76). Moreover, Pakistani men
(mean=0.6, SD=2.02) reported visiting A&E significantly more frequently than the
African and Caribbean men sampled (mean=0.19, SD=0.52). Indian males
reported 0.25 (SD=0.76) visits, and across the sample men reported on average
0.35 (1.32) visits. In contrast, no significant differences in mean frequency of
A&E attendance as a function of ethnicity were found amongst women, who
reported attending A&E about as frequently as their male counterparts
(mean=0.34, SD=1.07).
In Greater Glasgow, as a whole, informants said that they visited A&E a mean of
0.3 (0.9) times. This is very similar to the findings in the present survey.
35

4.1.3 Hospital Outpatient Department
Respondents were also asked how many times they had been to a hospital
outpatient department to see a doctor in the twelve months preceding the
interview. Across the sample, 72% (431 participants) had not been to a hospital
outpatient department, and participants had, on average, attended 0.69
(SD=1.81) times. This varied as a function of both ethnicity and age. African and
Caribbean (mean=0.94, SD=2.16) participants reported significantly more visits
than Indian (mean=0.48, SD=1.08) interviewees. Pakistani participants’ mean
number of visits was 0.56 (SD=1.76). Participants aged 50+ years (1.22,
SD=3.08) were significantly more likely to say they had attended a hospital
outpatient department than those aged 16-29 (mean=0.43, SD=0,97) and 30-49
(mean=0.68, SD=1.54) years.
In Greater Glasgow, as a whole, informants said that they went saw their GP a
mean of 0.9 (3.1) times. This is similar to the present survey. RBA (2002) found
that respondents aged 16-29 years went a mean 0.5 (2.1), those age 30-49 years
reported a mean of 0.8 (2.7) visits whilst those aged 50+ years reportedly went to
a hospital outpatient department an average of 1.4 (3.9) times.
4.1.4 Day Surgery / Overnight Stay
When asked how many times they had been admitted for day surgery or an
overnight hospital stay in the year preceding the interview, the mean number was
0.22 (SD=1.11) across the sample and did not differ significantly as a function of
gender or ethnicity. 89% (535 respondents) of the sample reported no such stay.
The mean number of reported attendances increased with age with participants
older than 50 years (mean=0.59, SD=2.29) reporting significantly more
attendances than those aged 16-29 (mean=0.09, SD=0.35) and 30-49
(mean=0.17, SD=0.57) years. In Greater Glasgow respondents had been
admitted for day surgery or an overnight hospital stay in the year preceding their
interview a mean of 0.2 (0.7) times.
36

4.1.5 Hospital Attendances of 2+ Days
A similar picture emerged for hospital attendances of two or more days. Thus
there was no significant variation as a function of gender or ethnicity with the
mean attendance across the sample being 0.19 (SD=0.81). Ninety percent (540
respondents) of the sample did not report any hospital attendance for the duration
of two or more days. The mean number of attendances of this nature increased
with age and participants aged 50+ years and above (mean=0.37, SD=1.42)
reported significantly more attendances than those aged 16-29 years
(mean=0.11, SD=0.56). Participants aged between 30 and 49 years reported a
mean number of 0.18 (SD=0.58) stays. In Greater Glasgow respondents had
been admitted for an overnight hospital stay of two or more days a mean of 0.2
(0.2) times.
4.1.6 Total Number of Times Seeing a Doctor in the Past Year
The overall number of contacts with health services reported by participants was
computed, and analysis suggested that across the sample Pakistani respondents
(mean=6.78, SD=13.11) reported significantly more contact with health services
than did their Indian (mean=4.55, SD=6.64) and African and Caribbean
(mean=4.52, SD=5.52) respondents. As Figure 4.2 illustrates, across the entire
sample respondents aged 16-29 years (mean=3.08, SD=3.28) reported
significantly less visits than those aged 30-49 years (mean=5.42, SD=9.09) and
50+ years (mean=9.29, SD=14.2).
37

Figure 4.2. Mean number of visits to a doctor by ethnicity and age.
0
2
4
6
8
10
12
14
16-29 30-49 50+
Age
Mea
n nu
mbe
r of v
isits
to a
doc
tor
Pakistani (n=209)Indian (n=154)African & Caribbean (n=242)Entire Sample (n=605)
4.2 Satisfaction with Health Services
Participants were asked to think about their recent use and experience of health
services (if applicable), and asked the extent to which they agreed with a number
of statements gauging perceptions of service delivery and issues relating to
language difficulties. A five-point scale measuring the extent to which
participants agreed with the statements ranging from 1 (Not at all) to 5 (Definitely)
was used. High scores tending towards a score of 5 thus indicate agreement
with the statements. Since the parametric scoring method used in this survey
was not utilised in the Greater Glasgow wide general population survey, no
comparisons between the two surveys are made.
4.2.1 Perceived Adequacy of Information About Conditions or Treatments
The first statement gauged the extent to which participants thought that they were
given adequate information about their condition or treatment.
38

Figure 4.3. Extent of agreement with the question ‘were you given adequate information
about your condition or treatment?’ by ethnicity and age.
00.5
11.5
22.5
33.5
44.5
5
Pakistani Indian African &Caribbean
Entire Sample
Ethnicity
Exte
nt o
f agr
eem
ent
16-29 years30-49 years50+ years
As can be seen from Figure 4.3, responses tended to indicate agreement with the
statement. This suggests that, across the sample, participants by and large felt
that they were given adequate information about their condition or treatment.
There were, however, significant differences as a function of age and ethnicity.
Across the sample, participants aged 50+ years felt significantly more satisfied
(mean=4.17, SD=1.27) that they were given adequate information than
participants aged 16-29 (mean=3.59, SD=1.42) or 30-49 years (mean=3.77,
SD=1.42). This suggests that those participants who use the health services
most frequently are also the most satisfied with them. The finding may also
indicate that older people have lower expectations, or that they are less critical
towards service delivery.
Moreover, Pakistani (mean=3.36, SD=1.4) and Indian (mean=3.57, SD=1.5)
participants aged 16-29 years agreed with the statement to a significantly lesser
degree than those aged 30-49 years [Pakistani: mean=3.83, SD=1.39; Indian:
mean=4.19, SD=1.04] or 50 years and above [Pakistani: mean=4.02, SD=1.45;
Indian: mean=4.46, SD=1.01]. In contrast, the difference between African and
Caribbean participants aged 16-29 years (mean=3.83, SD=1.35) and those aged
30-49 years (mean=3.43, SD=1.56) and 50+ years (mean=4.06, SD=1.24) did not
reach statistical significance, indicating that young African and Caribbean
participants agreed with the statement to a similar extent to older participants.
39

These findings suggest that younger Indian and Pakistani people, in particular,
feel that they are not given adequate information about their conditions /
treatments to the same extent as older Indians and Pakistanis.
4.2.2 Extent of Perceived Encouragement to Participate in Decisions Affecting Participants’ Health and Treatment
The second statement assessed the extent to which interviewees thought that
that they were encouraged to participate in decisions affecting their health and
treatment. Across the sample participants aged 50+ years (mean=4.17,
SD=1.27) were significantly more likely to agree to a larger degree than those
aged 16-29 (mean=3.59, SD=1.42) and 30-49 (mean=3.77, SD=1.42) years.
Further analysis suggested that Pakistani and Indian participants aged 50+ years
said that they were encouraged to participate in decisions affecting health or
treatment to a significantly larger degree than both those aged 16-20 and 30-49
years (see Figure 4.4). African and Caribbean participants did not differ to a
significant degree in their response patterns as a function of age.
Figure 4.4. Mean agreement with the question ‘were you encouraged to participate in
decisions affecting your health?’ by ethnicity and age.
00.5
11.5
22.5
33.5
44.5
5
Pakistani Indian African &Caribbean
Entire Sample
Ethnicity
Mea
n ag
reem
ent
16-29 years30-49 years50+ years
40

4.2.3 Satisfaction with ‘Say’ in Delivery of Services
Participants were also asked the extent to which they felt that they had a say in
how services were delivered. Across the sample there were no significant
variations in response patterns as a function of ethnicity or gender (overall
mean=3.51, SD=1.48).
Figure 4.5. Mean agreement with the question ‘did you feel you had a say in how these
services were delivered?’ by age.
33.13.23.33.43.53.63.73.83.9
4
16-29 years 30-49 years 50+ years
Age
Mea
n ag
reem
ent
Entire Sample
As Figure 4.5 illustrates, older participants aged 50 years and above (mean=3.94,
SD=1.41) agreed with the statement to a significantly larger degree that did the
respondents aged 16-29 (mean=3.37, SD=1.44) and 30-49 (mean=3.42,
SD=1.53) years.
4.2.4 Views and Circumstances Understood
When asked about the extent to which participants thought that their views and
circumstances were understood and valued, there were no significant differences
as a function of age. However, Indian participants (overall mean=4.25, SD=1.14)
consistently agreed more strongly with the statement ‘did you feel that your views
and circumstances were understood and valued?’ than did Pakistani (overall
mean=3.84, SD=1.29) and African and Caribbean (overall mean=3.78, SD=1.44)
participants (see Figure 4.6).
41

Figure 4.6. Mean agreement with the question ‘did you feel that your views and
circumstances were understood and valued?’ by ethnicity.
3.53.63.73.83.9
44.14.24.3
Pakistani Indian African &Caribbean
Ethnicity
Mea
n ag
reee
men
t
All ages
4.3 Language Difficulties
4.3.1 Understanding Advice Given
Across the sample participants aged 50+ years agreed to a significantly larger
extent with the statement gauging language difficulties in understanding advice
given than did participants in the two younger age groups (see Figure 4.7).
Pakistani participants (overall mean=2.36, SD=1.66) agreed significantly more
strongly than African and Caribbean respondents (overall mean=1.87, SD=1.47).
42

Figure 4.7. Mean agreement with the question ‘did you have any problems understanding
the advice given because of language difficulties?’ by ethnicity and age.
1
1.5
2
2.5
3
3.5
4
Pakistani Indian African &Caribbean
EntireSample
Ethnicity
Mea
n ag
reem
ent
16-29 years30-49 years50+ yearsAll ages
It is interesting to note that whilst older participants were more likely to feel that
they had been given adequate information (see above), they were also the most
likely to say that they had difficulty in understanding the advice given.
4.3.2 Getting Views Across
Across the sample participants aged 50+ years agreed to a significantly larger
extent with the statement gauging language difficulties in getting views across
than did participants in the two younger age groups (Figure 4.8). Moreover,
Pakistani participants (overall mean=2.37, SD=1.67) reported having significantly
more problems getting their views across than African and Caribbean
respondents (overall mean=1.88, SD=1.47).
43

Figure 4.8. Mean agreement with the question ‘did you have any problems getting your
views across because of language difficulties?’ by ethnicity and age.
1
1.5
2
2.5
3
3.5
4
Pakistani Indian African &Caribbean
EntireSample
Ethnicity
Mea
n ag
reem
ent
16-29 years30-49 years50+ yearsAll ages
The overall findings regarding language difficulties therefore indicate that older
people are more likely to have language difficulties in communicating with health
professionals.
4.4 Dental Health
Responses to the question asking about the last time participants had been to a
dentist are summarised in Table 4.1. The interview schedule did not include a
‘never’ option, however, a number of fieldworkers noted such responses
informally. These are included in the table below, and it is therefore important to
note that the ‘over 15 months’ category is likely also to include a number of
participants who have never been to a dentist.
Table 4.1. Responses to the question ‘when was the last time you went to the dentist?’ by
ethnicity. Pakistani
(n=200) Indian
(n=150) African & Caribbean
(n=238) Entire Sample
(n=588) Within the last 6 months 50% 40% 32% 40% Within 6 months to 15 months 17% 17% 21% 19% Over 15 months 33% 42% 41% 38% Never 1% 1% 6% 3%
From these figures it appears that African and Caribbean participants, whilst
reporting the greatest likelihood of having all their own teeth, are the least likely to
44

have attended a dentist. It is apparent that Indian and African and Caribbean
participants appear to visit the dentist less frequently than the general population,
33% of which reported not having visited a dentist in the 15 months preceding
their interview.
4.5 Difficulty in Accessing Health Services
Participants were asked to rate the difficulty of accessing health services on a
five-point scale ranging from 1 (Great difficulty) to 5 (No difficulty). Findings are
summarised below. As outlined earlier, comparisons to the general population
survey are not made as a result of differences in methodologies employed.
4.5.1 Arranging Home Visits from GP
Participants were asked the extent to which they thought that arranging a home
visit from a GP for themselves was difficult. The results summarised in Figure 4.9
indicate that, overall, Indian participants were significantly less likely to report
difficulty than both Pakistani and African and Caribbean participants. Across the
sample participants in the 50+ years age group report significantly less difficulty
arranging for home visits than those in the 30-49 years old age group.
Figure 4.9. Mean perceived difficulty arranging a home visit from GP by ethnicity and age.
1
1.5
2
2.5
3
3.5
4
4.5
5
Pakistani Indian African &Caribbean
EntireSample
Ethnicity
Ease
of o
btai
ning
GP
appo
intm
ent
16-29 years30-49 years50+ yearsAll ages
45

4.5.2 Getting GP Appointment
A similar picture emerged when participants were asked to rate the difficulty of
getting an appointment with their GP. As is illustrated in Figure 4.10, participants
aged 50+ years felt that it was significantly easier to get a GP appointment than
participants in both younger age groups. The pattern of results did not differ to a
significant degree as a function of gender or ethnicity.
Figure 4.10. Mean perceived difficulty getting a GP appointment by age.
3.63.73.83.9
44.14.24.34.44.5
16-29 years 30-49 years 50+ years
Age
Ease
of g
ettin
g G
P ap
poin
tmen
t
Entire Sample
4.5.3 Getting to GP Surgery / Health Centre
Participants were asked to assess the difficulty of getting to a GP surgery or
health centre using the five-point scale, ranging from 1 (Great difficulty) to 5 (No
difficulty). Analysis of the findings indicated no significant age differences in
response patterns, or differences as a function of ethnicity. However, as is
illustrated in Figure 4.11, regardless of ethnic background, women reported
significantly more difficulty in getting to a GP surgery or health centre than men.
46

Figure 4.11. Mean perceived difficulty getting to GP surgery / health centre by gender.
4.3
4.35
4.4
4.45
4.5
4.55
4.6
4.65
Males Females Both Genders
Gender
Ease
of g
ettin
g to
GP
surg
ery
/ he
alth
cen
tre
Entire Sample
4.5.4 Accessing Health Services in an Emergency
When asked to rate the difficulty of accessing health services in an emergency
the following picture emerged. Across the sample, there was a significant trend
whereby participants aged 50+ years reported less difficulty in accessing health
services in an emergency than those aged between 16 and 29 years. Further
analysis suggested that Pakistani participants aged 30-49 years reported
significantly more difficulty than those aged 50+ years (see Figure 4.12). There
were no significant differences in response patterns by age amongst Indian and
African and Caribbean participants.
47

Figure 4.12. Mean perceived difficulty accessing health services in an emergency by
ethnicity and age.
1
1.5
2
2.5
3
3.5
4
4.5
5
Pakistani Indian African &Caribbean
EntireSample
Ethnicity
Ease
of a
cces
sing
hea
lth s
ervi
ces
in a
n em
erge
ncy
16-29 years30-49 years50+ yearsAll ages
4.5.5 Obtaining Hospital Appointment for Self
Participants were asked to rate the difficulty of obtaining a hospital appointment
for themselves. Whilst response patterns did not differ significantly as a function
of participant ethnicity or gender, older participants (aged 50+ years) across the
sample reported less difficulty than those ages 16-49 years. These results are
summarised in Figure 4.13.
Figure 4.13. Mean perceived difficulty obtaining hospital appointment for self by age.
3.43.53.63.73.83.9
44.14.24.34.4
16-29 years 30-49 years 50+ years
Age
Ease
of o
btai
ning
hos
pita
l ap
poin
tmen
t
Entire Sample
48

4.5.6 Obtaining Appointments with Health Professionals for Family Members
Across the sample participants aged 50+ years reported less difficulty obtaining
an appointment with health professionals for family members than those aged 16-
29 years and 30-49 years. Moreover, as Figure 4.14 shows, African and
Caribbean participants reported significantly more difficulty than Indian
participants.
Figure 4.14. Mean perceived difficulty getting an appointment with health professionals for
family members by ethnicity and age.
1
1.5
2
2.5
3
3.5
4
4.5
5
Pakistani Indian African &Caribbean
Entire Sample
Ethnicity
Ease
of o
btai
ning
an
appo
intm
ent
16-29 years30-49 years50+ yearsAll ages
49

5 Health Behaviours
5.1 Smoking
5.1.1 Passive Smoking
Table 5.1 summarises responses to the question gauging the amount of time
participants thought that they were exposed to cigarette smoking by ethnicity and
gender.
Table 5.1. Self-reported exposure to cigarette smoking by ethnicity and gender.
Pakistani Indian African & Caribbean Greater Glasgow
Male (n=109)
Female (n=100)
Male (n=73)
Female (n=81)
Male (n=125)
Female (n=117)
Male Female
Most of the time 30% 12% 7% 7% 22% 19% 42% 31%
Some of the time 29% 27% 26% 26% 42% 39% 21% 21%
Seldom 15% 30% 26% 44% 19% 26% 27% 36%
Never 26% 31% 41% 22% 17% 17% 12% 12%
The analogous figures for the Greater Glasgow general population are
summarised in Table 5.1. It appears that the likelihood of participants reporting
exposure to cigarette smoking some or most of the time shows similarities
between the general population and Pakistani, African and Caribbean participants
in this survey. Indian participants appear to report considerably less exposure to
smoking.
50

Figure 5.1. Self-reported exposure to cigarette smoking most of the time by ethnicity and
age.
0
5
10
15
20
25
30
35
40
16-24 25-34 35-44 45-54 55-64 65+
Age
% re
port
ing
expo
sure
mos
t of t
he
time
Pakistani (n=209)Indian (n=154)African & Caribbean (n=242)Entire Sample (n=605)
N.B. Numbers of African & Caribbean participants in the 65+ years age category are very small.
As Figure 5.1 indicates, there appears to be a trend whereby self-reported
exposure to cigarette smoking is highest in the youngest age group and shows a
tendency to decrease with age. In the African and Caribbean samples there
appears to be a tendency for exposure to cigarette smoking to increase from
about the age of 35-55 years. The figures for Greater Glasgow indicate a broadly
similar trend with 25-34 year-olds reporting the highest exposure most of the time
(49%), and those aged over 65 years reporting the lowest (21%) exposure most
of the time. This may be an indication of different lifestyle choices.
5.1.2 Active Smoking
Table 5.2 summarises self-reported smoking behaviours by ethnicity and age. It
should be noted, however, that these responses may have been influenced by
the fact that the team of fieldworkers were exclusively from black and minority
ethnic backgrounds, and that this may have impacted on the responses obtained
as a result of respondents giving socially desirable - rather than ‘truthful’ –
accounts of their drinking behaviour.
51

Table 5.2. Self-reported smoking behaviour by ethnicity and gender.
Pakistani Indian African & Caribbean Greater Glasgow
Male (n=110)
Female(n=97)
Male (n=68)
Female(n=77)
Male (n=124)
Female (n=119)
Male (n=846) (n=946)
Female
I have never smoked tobacco 52% 93% 71% 91% 69% 82% 42% 52% I have only tried smoking once or twice 8 % 2% 6% 5% 8% 8% 4% 4% I have given up smoking 4% 0% 7% 0% 7% 4% 18% 13% I smoke some days 7% 0% 6% 1% 3% 2% 4% 4% I smoke every day 29% 5% 10% 3% 13% 3% 31% 28%
Overall, 22% of Pakistani, 10% of Indian and 11% of African and Caribbean
participants said that they smoked at least some days. This compares to 33% for
the Greater Glasgow population. As the above table illustrates, there were
marked gender differences with men consistently being less likely to say that they
had never smoked tobacco. This gender difference is most marked in the
Pakistani sample.
The mean number of cigarettes smoked per day is summarised in Table 5.3 and
did not differ as a function of ethnicity to a significant degree. The trend by which
men smoked more cigarettes per day than women was also non-significant,
probably owing to the low number of female smokers in the sample. Across the
sample, however, there was an effect of participant age, with smokers aged 50+
years and above smoking significantly more cigarettes per day than those aged
16-29 years and 30-49 years.
Table 5.3. Mean number of cigarettes smoked a day.
Mean number of cigarettes smoked per day (SD)
Pakistani (n=40) 13.95 (22.24) Indian (n=13) 7.24 (6.49) African & Caribbean (25)
11.09 (10.23)
Entire Sample (n=78) 11.92 (17.2) Entire Sample: men (n=67) 10.60(8.89) Entire Sample: women (n=11)
19.91 (40.92)
Entire Sample: 16-29 years (n=30) 8.38 (8.84) Entire Sample: 30-49 years (n=30) 10.35 (5.52) Entire Sample: 50+ years (n=18) 20.41 (32.43)
In Greater Glasgow smokers reportedly smoked 18.5 (SD=17.5) cigarettes per
day. This is markedly higher than the responses in this survey. However, in
Greater Glasgow, as a whole, smokers aged 30-49 years (mean number of
cigarettes=21.2, SD=20.3) smoked significantly more cigarettes than those aged
52

16-29 (mean=13.4, SD=12.6). Smokers aged 50+ years reported smoking an
average of 18.3 (SD=15.2) cigarettes per day.
5.2 Alcohol Consumption
Participants were questioned about the consumption of alcohol and responses
are summarised by gender in Table 5.4 and by age in Figure 5.2. As noted
earlier with regards to cigarette smoking, however, that socio-cultural sensitivities
with regards to smoking, as well as the ethnic makeup of the team of fieldworkers
may have influenced the ‘truth’ of responses given.
Table 5.4. Self-reported frequency of alcohol consumption by ethnicity and gender
(M=Male; F=Female). Pakistani M
(n=110) Pakistani F (n=101)
Pakistani M&F
(n=211)
Indian M (n=74)
Indian F (n=80)
Indian M&F
(n=154)
African & Caribbean M (n=125)
African & Caribbean F (n=119)
African & Caribbean
M&F (n=244)
Entire Sample (n=609)
Never 85% 97.0% 91% 34% 79% 57% 56% 64% 60% 70% < once a month
8% 2.0% 5% 22% 15% 18% 12% 14% 13% 12%
> once a month but not weekly
4% 1.0% 2% 20% 5% 12% 6% 9% 7% 7%
1-2 days per week
2% 0% 1% 11% 1% 6% 15% 11% 13% 7%
3-5 days per week
1% 0% 1% 8% 0% 4% 9% 2% 5% 3%
6-7 days per week
1% 0% 1% 5% 0% 3% 2% 0% 1% 1%
Participants who said that they consumed alcohol were asked whether or not they
had drunk alcohol in the week preceding the interview. Out of the 20 Pakistani
participants who said that they consumed alcohol only 4 participants (20%) said
that they had done so in the past week. This figure was substantially higher for
Indian and African and Caribbean respondents. Of the 67 Indian participants who
drank alcohol 37 respondents (55%) said they had not consumed alcohol in the
same time period, with 51 interviewees (53%) of the 97 alcohol consuming
African and Caribbean participants saying that they had not had a drink
containing alcohol in the past week.
53

Figure 5.2. Self-reported abstinence from consuming alcohol by ethnicity and age.
20
30
40
50
60
70
80
90
100
16-24 25-34 35-44 45-54 55-64 65+
Age
% re
port
ing
neve
r drin
king
Pakistani (n=211)Indian (n=153)African & Caribbean (n=244)Entire Sample (n=606)
N.B. Numbers of African & Caribbean participants in the 65+ years age category are very small.
It is noteworthy that a survey of young people from Indian, Pakistani and Chinese
backgrounds aged 16 to 25 years conducted throughout Greater Glasgow in
2001 (Heim et al., 2004a) found higher alcohol consumption levels amongst
Indian and Pakistani young people than in this survey. In that survey
approximately 50% of Indian participants reported drinking alcohol and 30% of
Pakistani males and 12% of Pakistani females reported that they consumed
alcohol.
The number of units of alcohol that the small number of participants reported
drinking in the week preceding the interview was extremely low, and is therefore
not analysed in detail.
5.3 Diet
Participants were asked a number of questions gauging their eating behaviours.
5.3.1 Fruit and Vegetable Consumption
Results indicate that 19% of Pakistani, 33% of Indian and 47% of African and
Caribbean participants consume five or more portions (the recommended
54

minimum amount) of fruit and vegetables per day (Table 5.5). The comparable
figure for Greater Glasgow is 34%, and therefore, it would appear that only the
African and Caribbean participants exceed this amount. Pakistani participants
appear to report a considerably lower intake of fruit and vegetables than the
Greater Glasgow population.
Table 5.5. Self-reported consumption of fruit and vegetables portions per day by ethnicity.
Pakistani (n=210)
Indian (n=155)
African & Caribbean(n=242)
Entire Sample (n=607)
None 1% 2% 1% 1% 1-2 49% 43% 29% 39% 3-4 31% 23% 24% 26% 5 7% 6% 11% 8% 6-10 11% 25% 31% 23% 10+ 1% 2% 4% 3%
Across the sample females reported higher fruit and vegetable consumption than
males, and African and Caribbean participants reported consuming significantly
more portions of fruit and vegetables than both Pakistani and Indian participants.
This may be the result of African and Caribbean aged 30 years and above
reporting significantly higher consumption levels than their Indian and Pakistani
counterparts (see Figure 5.3). The mean consumption for the Greater Glasgow
population is 3.83.
Figure 5.3. Mean number of fruit and vegetable portions consumed per day by ethnicity and
gender.
2
2.5
3
3.5
4
4.5
5
5.5
Pakistani Indian African &Caribbean
EntireSample
Ethnicity
Mea
n nu
mbe
r of f
ruit
& v
eget
able
po
rtio
ns MalesFemalesBoth Genders
55

In the youngest age group (16-29 years) Pakistani participants report significantly
less fruit and vegetable consumption than their Indian counterparts. In the 30-49
years and 50+ years age groups African and Caribbean participants report
significantly higher mean fruit and vegetable consumption than both Indian and
Pakistani participants (see Figure 5.4).
Figure 5.4. Mean number of fruit and vegetable portions consumed per day by ethnicity and
age.
2
2.5
3
3.5
4
4.5
5
5.5
16-29 30-49 50+
Age
Mea
n nu
mbe
r of f
ruit
and
vege
tabl
es c
onsu
mer
per
day
Pakistani (n=210)Indian (n=155)African & Caribbean (n=242)Entire Sample (n=607)
5.3.2 Bread Consumption
The mean number of slices of bread consumed per day (see Table 5.6) did not
differ as a function of ethnicity with the mean number of slices of bread consumed
per day being 2.85 (SD=1.83) across the entire sample. This is almost identical
to the mean of 2.87 slices per day for the Greater Glasgow population at large.
Table 5.6. Slices of bread per day consumed by ethnicity. Pakistani
(n=211) Indian
(n=155)African & Caribbean
(n=244) Entire Sample
(n=610) None 1% 2% 9% 4% 1-2 51% 47% 46% 48% 3-4 40% 39% 34% 37% 5 2% 6% 4% 4% 6+ 5% 7% 8% 7%
56

However, across the sample there was a consistent difference in self-reported
mean consumption as a function of participant age and gender. Participants
aged 50+ years and above consumed significantly less slices of bread per day
than those aged 16-29 years. Furthermore, male respondents from all ethnic
backgrounds said that they consumed significantly more slices of bread per day
than female interviewees (Figure 5.5).
Figure 5.5. Mean self-reported number of bread slices consumed per day by age and
gender.
2
2.2
2.4
2.6
2.8
3
3.2
3.4
3.6
16-29 30-49 50+
Age
Mea
n sl
ices
of b
read
con
sum
ed p
er
day
Males (n=309)Females (n=301)Both Genders (n=610)
5.3.3 Cakes, Sweets and Pastries
The mean number of times per day that participants said they consumed cakes
and sweets was 0.91 (SD=1.14) across the sample (see Table 5.7 for a
breakdown by ethnicity) and did not differ to a significant degree as a function of
ethnicity and gender.
Table 5.7. Self reported consumption of sweets, cakes, chocolates etc. per day by ethnicity.
Pakistani (n=211)
Indian (n=155)
African & Caribbean(n=242)
Entire Sample (n=608)
None 37% 50% 46% 44% 1-2 56% 47% 44% 49% 3+ 7% 3% 10% 7%
Across the sample there was a significant difference in the mean portions of
sweets, etc. consumed as a function of participant age. Participants aged 16-29
57

years (mean=1.24, SD=1.15) reported a significantly higher mean consumption
than those aged 30-49 years (mean=0.87, SD=1.22) and 50+ years (mean=0.37,
SD=0.59).
5.3.4 Breakfast Cereal Consumption
The Scottish Diet Action Plan target for breakfast cereal consumption is five or
more times per week. In Greater Glasgow as a whole, 46% of respondents met
this target, compared to 20% of Pakistani, 39% of Indian and 28% of African and
Caribbean respondents (see Table 5.8).
Table 5.8. Self-reported consumption of breakfast cereal per week by ethnicity.
Pakistani (n=210)
Indian (n=155)
African & Caribbean(n=242)
Entire Sample (n=607)
Never 38% 27% 27% 31% 1-2 28% 24% 24% 25% 3-4 15% 10% 20% 16% 5 5% 12% 7% 8% 6+ 15 % 27% 22% 20%
Pakistani participants (overall mean=2.17, SD=2.45) report significantly lower
mean consumption of breakfast cereal compared to both African and Caribbean
(overall mean=2.91, SD=2.67) and Indian (overall mean=3.17, SD=2.77)
respondents (Figure 5.6). Across the sample, the difference in mean
consumption between participants aged 16-29 years (mean=3.16, SD=2.84) and
those aged 30-49 years (mean=2.43, SD=2.44) reaches statistical significance.
58

Figure 5.6. Mean number of times per week that breakfast cereal is consumed by ethnicity
and age.
1
1.5
2
2.5
3
3.5
4
4.5
16-29 30-49 50+
Age
Mea
n nu
mbe
r of d
ays
on w
hich
br
eakf
ast c
erea
l is
cons
umed
Pakistani (n=210)Indian (n=155)African & Caribbean (n=242)Entire Sample (n=607)
The mean number of days on which the Greater Glasgow population as a whole
reported eating breakfast cereal is 3.69 and somewhat higher than in this survey.
5.3.5 Oily Fish Consumption
The Scottish Diet Action Plan stipulates that people should eat at least 2 portions
of oily fish (e.g. mackerel, tuna, salmon, herring) per week. The Greater Glasgow
wide survey indicates that this target is met by 29% of people living in and around
Glasgow, whilst 41% of the general Greater Glasgow population report that they
do not eat any oily fish. With this in mind, participants were asked how many
times per week they consumed oily fish either as part of a meal, or taken in
sandwiches.
As Table 5.9 indicates, over one third of both Pakistani and African and
Caribbean participants reportedly consume the recommended amount of oily fish,
whilst Indian interviewees appeared considerably less likely to report eating oily
fish at least twice a week.
59

Table 5.9. Consumption of oily fish per week by ethnicity (number of participants in
brackets). Pakistani
(n=206) Indian
(n=149)African & Caribbean
(n=239) Entire Sample
(n=594) % (n) % (n) % (n) % (n) Never 22 (46) 56 (84) 27 (65) 33 (195) Once 40 (83) 28 (41) 30 (71) 33 (195) Two or more times 37 (77) 16 (24) 43 (103) 34 (204)
A more detailed account of the number of times oily fish is consumed per week
as a function of ethnicity is provided in Table 5.10.
Table 5.10. Self reported weekly consumption of oily fish by ethnicity.
Pakistani (n=206)
Indian (n=149)
African & Caribbean(n=239)
Entire Sample (n=594)
Never 22% 56% 27% 33% 1-2 60% 38% 46% 49% 3-4 15% 3% 20% 14% 5 1% 1% 3% 2% 6-10 2% 2% 3% 2%
Across the entire sample Indian (mean=0.76, SD=1.25) participants reported a
significantly lower consumption of oily fish than their Pakistani (mean=1.44,
SD=1.3) and African and Caribbean (mean=1.67, SD=1.64) counterparts. More
specifically, in the 16-29 years age group Indian participants reported a
significantly lower consumption of oily fish than both Pakistani and African and
Caribbean participants, in the 30-49 years age group the difference in
consumption is only significant between Indian and African and Caribbean
respondents, and in the 50+ years age group the mean consumption by African
and Caribbean participants was significantly higher both in comparison to Indian
and Pakistani respondents (see Figure 5.7).
60

Figure 5.7. Mean self-reported consumption of oily fish by ethnicity and age.
0
0.5
1
1.5
2
2.5
16-29 30-49 50+
Age
Mea
n nu
mbe
r of d
ays
on w
hich
oily
fis
h is
con
sum
ed
Pakistani (n=206)Indian (n=149)African & Caribbean (n=239)Entire Sample (n=594)
The general population of Greater Glasgow reportedly eat a mean of 1.08 oily fish
portions of per week.
5.4 Body Mass Index
Participants were asked whether they knew their height and weight. In total 531
(87%) of participants said that they knew their weight and 540 participants (89%)
said that they knew their height. Overall 488 respondents (80%) knew both their
height and weight, allowing their Body Mass Index (BMI) to be calculated. BMI is
classified into the following categories:
• Underweight: <18.49 • Normal: 18.5-24.99 • Overweight: 25-29.99 • Obese: 30-39.99 • Extremely Obese: >40
Figure 5.8 summarises the BMI classifications in this survey by ethnicity. There
were no significant differences as a function of ethnicity in terms of the
percentage of participants who were classified as overweight, and overall 46% of
participants had BMI score of 25 or over. This indicates that the percentage of
61

participants classified as overweight in this survey is slightly higher than that of
the Greater Glasgow population, where 43% of people were classified in this way.
Figure 5.8. BMI classification scores by ethnicity.
0 10 20 30 40 50 60
Pakistani (n=166)
Indian (n=135)
African & Caribbean (n=187)
Entire Sample (n=488)
% classified
Extremely ObeseObeseOverweightNormalUnderweight
5.4.1 BMI: Classified as Overweight
In the Greater Glasgow population survey men (46%) were found to be
significantly more likely than women (40%) to be classified as overweight
(BMI>25). In this survey, however, no significant difference between men (45%)
and women (47%) across the entire sample was found to this regard (Figure 5.9).
Further analysis indicated an exception to this in the 45-54 years age group
where female participants (86%) were significantly more likely than male
participants (61%) to be classified as overweight. This trend is the opposite of
that found in the Greater Glasgow population as a whole where analysis indicated
that in the 45-54 years age group men (65%) were significantly more likely than
women (48%) to be classified as overweight. Analogously to the findings
summarised here, the Greater Glasgow population survey did not find any other
significant gender differences in terms of being classified as overweight in any of
the other age groups either.
Across the entire sample, participants in the youngest and oldest age groups
were less likely to be classified as overweight than those in the middle age group
62

(16-29 years: 18%; 30-49 years: 52%; 50+ years: 30%). Figure 5.9 illustrates this
age trend, which broadly mirrors that found in the Greater Glasgow population
survey.
Figure 5.9. BMI scores classified as overweight (BMI>25) by age and gender.
0102030405060708090
16-24 25-34 35-44 45-54 55-64 65+
Age
% c
lass
ified
as
over
wei
ght
(BM
I>25
) Male (n=262)Female (n=226)Both Genders (n=488)
5.4.2 BMI: Classified as Obese / Extremely Obese
Further analysis indicated that Pakistani (13%) and African and Caribbean (12%)
respondents were significantly more likely than Indian (4%) interviewees to be
classified as either obese or extremely obese (see Figure 5.8). As is illustrated in
Figure 5.10, participants in the youngest age group of 16-29 years (3%) were
significantly less likely than those aged 30-49 years (12%) and 50+ years (16%)
to be classified as obese or extremely obese. Ten percent of the entire sample
was classified as being obese or extremely obese. Moreover, across the sample
men (7%) were significantly less likely than women (13%) to be classified as
obese or extremely obese. This finding is similar to that found for the Greater
Glasgow as a whole where 9% of men and 13% of women were classified as
obese / extremely obese. The trend illustrated in Figure 5.10 by which
classification as obese or extremely obese also appears to vary as a function of a
combination of gender and age, fails to reach statistical significance.
63

Figure 5.10. BMI scores classified as obese /extremely obese (BMI>30) by age and gender.
0
10
20
30
40
50
60
16-29 30-49 50+
Age
% c
lass
ified
as
obes
e / e
xtre
mel
y ob
ese
(BM
I>30
)
Male (n=19)Female (n=29)Both Genders (n=48)
5.4.3 BMI: Mean Scores
Analysis of BMI score as a continuous variable indicates that there were no
significant differences in mean BMI scores as a of function ethnicity (overall mean
across the sample=24.8, SD=4.14). Across the sample, male participants
(mean=24.71, SD=3.64) had a slightly (and significantly) lower BMI score than
female respondents (mean=24.9, SD=4.64). Moreover, as Figure 5.11 illustrates,
participants in the 16-29 years age group (mean=22.57, SD=3.72) appeared to
have significantly lower BMI scores than those aged 30-49 (mean=25.83,
SD=3.72) and 50+ (mean=26.57, SD=4.01) years. Figure 5.11 also illustrates
that this was likely to be due to female (mean=27.95, SD=3.87) participants
appearing to have significantly higher BMI scores than their male (mean=25.34,
SD=3.75) counterparts in the 50+ years age group. There were no significant
differences in mean BMI scores as a function of gender in either of the younger
age groups.
64

Figure 5.11. Mean BMI scores by age and gender.
20212223242526272829
16-29 30-49 50+
Age
mea
n BM
I sco
res
Male (n=262)Female (n=226)Both Genders (n=488)
The Greater Glasgow general population survey found a similar age trend
whereby respondents aged 16-29 years (mean BMI=23.03, SD=3.3) also had a
significantly lower mean BMI than those aged 30-49 years (mean BMI=25.71,
SD=4.63) and 50+ years (mean BMI=25.61, SD=4.2).
Further analysis indicated that high BMI scores were related to:
• Receiving treatment for medical conditions. • Comparatively lower positive perceptions of physical well-being. • Reports of stress. • Eating sweets, cakes, etc. and not eating breakfast cereal. • Not undertaking much moderate physical activity.
5.5 Physical Activity
The minimum recommended amount of physical activity is either i) five or more
days on which people undertake at least thirty minutes of moderate physical
activity such as taking a brisk walk, or ii) doing vigorous physical activity, defined
as twenty minutes of activity vigorous enough to make people sweaty and out of
breath, three or more times a week.
65

5.5.1 Moderate Physical Activity
As is illustrated in Table 5.11, 26% of Pakistani, 41% of Indian and 28% of
African and Caribbean participants meet the target of undertaking moderate
physical activity at least five times per week.
Table 5.11. Moderate physical activity per week by ethnicity. Pakistani
(n=211) Indian
(n=153)African & Caribbean
(n=243) Entire Sample
(n=607) 0 days 24% 18% 12% 18% 1 day 21% 25% 15% 20% 2 days 12% 8% 14% 12% 3 days 10% 3% 13% 9% 4 days 6% 5% 8% 7% 5 days 11% 12% 15% 13% 6 days 2% 2% 10% 5% 7 days 12% 28% 13% 17%
Pakistani participants (mean=2.58, SD=2.4) report significantly less days doing
moderate physical activities in comparison to both Indian (mean=3.33, SD=2.81)
and African and Caribbean (mean=3.38, SD=2.32) participants. Additionally, with
the exception of African and Caribbean interviewees, the mean number of days
participants report doing moderate physical activity appears to significantly
decrease with age with both Indian and Pakistani participants aged 30-49 years
reporting significantly less periods of moderate physical activity per week than
those aged 16-29 years, and participants from both the 16-29 years and 30-49
years age groups reporting significantly more moderate physical activity in
comparison to the 50+ years age group (see Figure 5.12).
66

Figure 5.12. Moderate physical activity per week by ethnicity and age.
1
1.5
2
2.5
3
3.5
4
4.5
16-29 30-49 50+
Age
Mea
n nu
mbe
r of d
ays
of m
oder
ate
phys
ical
act
ivity
Pakistani (n=211)Indian (n=153)African & Caribbean (n=243)Entire Sample (n=607)
5.5.2 Vigorous Physical Activity
Table 5.12 illustrates that 16% of Pakistani, 29% of Indian and 17% of African
and Caribbean participants reported meeting the target of twenty minutes of
vigorous activity three or more times a week.
Table 5.12. Responses to the question ‘in an average week, how often do you take 20
minutes vigorous exercise?’ by ethnicity. Pakistani
(n=210) Indian
(n=153)African & Caribbean
(n=243) Entire Sample
(n=606) 0 days 60% 48% 58% 56% 1 day 17% 15% 14% 16% 2 days 8% 9% 12% 9% 3 days 7% 7% 7% 7% 4 days 4% 3% 2% 3% 5 days 3% 8% 3% 4% 6 days 1% 1% 2% 1% 7 days 1% 9% 3% 4%
Pakistani participants (mean=0.93, SD=1.49) reported spending significantly less
time doing vigorous physical activities than both Indian (mean=1.75, SD=2.33)
and African and Caribbean (mean=1.10, SD=1.73) participants. Additional
analysis showed that Pakistani participants aged 16-29 years reported doing
significantly more vigorous physical activity than those aged 50+ years (see
Figure 5.13). There were no significant age differences in the other ethnic
groups.
67

Figure 5.13. Vigorous physical activity per week by ethnicity and age.
0
0.5
1
1.5
2
2.5
16-29 30-49 50+
Age
Mea
n nu
mbe
r of d
ays
of v
igor
ous
phys
ical
exc
erci
se
Pakistani (n=210)Indian (n=153)African & Caribbean (n=243)Entire Sample (n=606)
5.5.3 Physical Activities: Meeting the Target
As was outlined above, the recommended minimum amount of physical activity
per week is either five times doing moderate physical activity for at least thirty
minute, or doing three sessions of at least twenty minutes of vigorous physical
activity three times per week. The Greater Glasgow population survey indicated
that 58% of the general population met this target in 2002. The results of this
survey indicate that participants from the respective backgrounds are less likely
to meet the physical activity target. Thus only 32% of Pakistani respondents
reported undertaking the recommended amount of physical activity, compared to
50% of Indian and 45% of African and Caribbean informants.
5.6 Oral Health Behaviour
5.6.1 Frequency of Brushing Teeth
With none of the participants reported brushing their teeth less than ‘about once a
day’, Table 5.13 summarises how often participants reported brushing their teeth
per day. 67% of the Greater Glasgow population reportedly brush their teeth at
least twice a day.
68

Table 5.13. Responses to the question ‘how often do you brush your teeth?’ by ethnicity.
Pakistani(n=208)
Indian (n=154)
African & Caribbean(n=243)
Entire Sample (n=605)
Twice or more a day 56% 68% 83% 70% About once a day 44% 32% 17% 30%
There were no overall gender differences, although Indian females (58%) were
more likely than Indian males (42%) to say that they brushed their teeth twice or
more per day. Figure 5.14 illustrates that teeth brushing habits show some
variation as a function of ethnicity and age, and it is noteworthy that tooth
brushing two or more times daily appears to decrease among Pakistani and
Indian participants from the age of 16-29 years to 35-44 years, before slightly
increasing again in participants aged 45-54 years.
Figure 5.14. Percentage of participants brushing teeth two times or more times per day by
ethnicity and age.
0102030405060708090
100
16-24 25-34 35-44 45-54 55-64 65+
Age
% p
artic
ipan
ts b
rush
ing
teet
h 2+
tim
es d
aily Pakistani (n=208)
Indian (n=154)African & Caribbean (n=243)Entire Sample (n=605)
N.B. Numbers of African & Caribbean participants in the 65+ years age category are very small.
5.7 Health Information
Participants were asked if they needed more information on a range of 14 health
topics (see Table 5.14). Analysis of the overall number for which health
information was needed indicated that African and Caribbean participants (mean
number of health issues=2.93, SD=3.47) said that they needed information on
more issues than their Indian (mean=1.99, SD=3.35) and Pakistani (mean=1.87,
SD=3.12) counterparts. Since this was consistent across most of the categories
69

listed, further analysis examined the perceived necessity of further information as
a function of age and gender.
Table 5.14. Perceived necessity of further information on health issues by ethnicity
(number of participants in brackets). Pakistani Indian African & Caribbean Entire Sample % (n) % (n) % (n) % (n) Accident Prevention 9 (19) 12 (19) 20 (47) 14 (85) Addictions 3 (6) 5 (8) 10 (24) 6 (38) Cancer 12 (26) 12 (19) 19 (45) 15 (90) Child Health 19 (39) 18 (28) 28 (134) 22 (134) Dental Health 12 (26) 15 (23) 22 (54) 17 (103) Heart health 15 (32) 18 (27) 20 (47) 18 (106) Mental Health 14 (29) 11 (17) 12 (28) 12 (74) Men’s Health 18 (37) 17 (26) 24 (58) 20 (121) Nutrition 17 (36) 22 (33) 27 (65) 22 (134) Physical Activity 14 (29) 15 (23) 30 (73) 21 (125) Sexual Health 9 (18) 17 (11) 22 (52) 14 (87) Smoking 6 (13) 5 (7) 6 (15) 6 (35) Women’s Health 23 (48) 24 (37) 30 (73) 26 (158) Young People’s Health 16 (34) 13 (20) 25 (59) 19 (113) None of These 57 (120) 52 (79) 40 (96) 49 (295)
A number of differences emerged. Across the sample men were more likely than
women to say that they wanted information on accident prevention. Participants
aged 30-49 years were significantly more likely to want information on childcare
and dental health than those aged 50+ years. Men were more likely to want
information on men’s health and smoking, whilst the reverse was true for women,
who also wanted more information than male participants on nutrition. Male
participants aged 30-49 years were more likely than female participants to want
information on young people’s health.
The finding to emerge informally as part of the research process suggesting that
African and Caribbean respondent showed a tendency to say that they required
basic information on the National Health Service is also noteworthy.
70

5.7.1 Format of Information on Health Issues
The most frequently requested formats for the information were: videos (132
participants) booklets (128 participants) leaflets (106 participants), Internet (74
participants), talks/seminars (29 participants), posters (28 participants), and
audiotape (27 participants).
5.7.2 Distribution of Information
Participants were also asked to indicate where they would like to receive the
information and prompted with the examples of supermarket, surgery and
community centre. The prompting is reflected in the answers with these three
categories being named with relative frequency. The most commonly named
places where participants would like to receive information on the above health
issues are as follows: surgery (95 participants), by post (85 participants),
community centre (75 participants), supermarket (65 participants), place of
worship (7 participants), library (7 participants), workplace (3 participants).
Given the open-ended format of the question and that participants were not
prompted with this response, the relatively large number of participants saying
that they would like to receive information by post is noteworthy.
5.7.3 Language of Information
Participants were also asked in which language they would like to receive the
above information (multiple responses were possible).
Across the sample the vast majority (83%) of participants said that they wanted to
receive the information in English (89% of African and Caribbean; 77% of
Pakistani; 79% of Indian respondents). Thirty five percent of Pakistani and 3% of
Indian participants said that they wanted information in Urdu, whilst 8% of
Pakistani and 23% of Indian respondents said that they would like the information
in Punjabi. Furthermore, 11% of Indian participants said that they wanted to be
able to receive information in Hindi and 25% of African and Caribbean
71

interviewees said that they wanted to receive the information in French. A very
small number of participants (not analysed in detail) also said that they wanted
information in other languages.
72

6 Social Health and Capital
6.1 Social Connectedness
6.1.1 Number of Close Friends
Respondents were asked how many close friends they would say they had. The
mean number of close friends reported by participants across ethnic groups was
4.47 (SD=4.47) and did not differ as a function of age or ethnicity. Across the
entire sample, however, a significant difference between male (mean=5.03,
SD=5.69) and female (mean=3.90, SD=2.6) participants was found. This
indicates that regardless of their ethnic background, male participants
consistently reported having a greater number of friends.
6.1.2 Ethnic Background of Close Friends
Participants were also asked how many of their close friends were from the same
ethnic background as themselves. Pakistani participants reported that 76%
(SD=30) of their close friends were also from the same ethnic background, and
this was a marginally yet significantly higher percentage compared to 72%
(SD=29) Indian and to 70% (SD=31) of African and Caribbean participants.
There were no significant differences as a function of gender or age.
6.1.3 Isolation from Friends and Family
When asked whether they ever felt isolated from family and friends, 24% of
participants across all ethnic groups responded ‘yes’ and this did not vary as a
function of participant age and gender. However, African and Caribbean (30%)
participants were more likely than Pakistani (19%) and Indian (23%) to say that
they felt isolated from friends and family. It is interesting to note that participants
from all minority ethnic groups surveyed were more likely to say that they felt
isolated from family and friends than the Greater Glasgow population as a whole
(15%).
73

6.2 Perceptions of Local Area
Participants were asked to indicate their feeling towards the local area in which
they live. Participants were presented with four statements, and asked to rate the
extent they agreed with them on a five-point scale from 1 (Strongly disagree) to 5
(Strongly agree).
6.2.1 Feeling of Belonging to Local Area
African and Caribbean (mean=3.21, SD=1.08) participants said they felt that they
belong to their local area significantly less than the Pakistani (mean=4.04,
SD=1.08) and Indian (mean=4.11, SD=1.18) participants. The corresponding
mean for the Greater Glasgow population is 3.7 (SD=0.93), and, whilst this is
slightly lower than that of Indian and Pakistani respondents, it is higher than that
of the African and Caribbean participants. Further analysis showed that across
the sample the oldest age group of 50+ years (mean=4.12, SD=1.17) felt that
they belonged to their local area to a significantly greater degree than did
participants aged 16-29 (mean=3.66, SD=1.32) and 30-49 (mean=3.59, SD=1.3)
years (Figure 6.1).
Figure 6.1. Mean agreement with the statement ‘I feel I belong to my local area’ by ethnicity
and age.
2
2.5
3
3.5
4
4.5
5
16-29 30-49 50+
Age
'I fe
el I
belo
ng to
my
loca
l are
a':
mea
n ag
reem
ent
Pakistani (n=208)Indian (n=153)African & Caribbean (n=243)Entire Sample (n=604)
74

This age trend whereby individuals aged 50+ years were more likely to say that
they felt that they belonged to their local area was also evident in the Greater
Glasgow population at large. The population survey indicated that individuals
aged 50+ years (mean=4.17, SD=0.54) felt that they belonged to their local area
to a significantly greater degree than did participants aged 16-29 (mean=3.69,
SD=0.62) and 30-49 (mean=4.02, SD=0.56) years.
6.2.2 Significance of Friendships / Associations in Local Area
The above findings concerning the degree to which participants felt they
belonged to their local area was mirrored in the responses to the statement 'the
friendships/associations I have in my local area with other people mean a lot to
me’. Again African and Caribbean (mean=3.38, SD=1.25) participants agreed
comparatively less strongly, and those participants aged 50+ (overall mean=4.08,
SD=1.14) tended to agree more strongly than those age 16-29 (mean=3.69,
SD=1.18) and 30-49 (mean=3.61, SD=1.24) years. The corresponding mean for
the Greater Glasgow population is 3.8 (SD=0.82), and very similar to that of
Pakistani (mean=3.85, SD=1.08) respondents and slightly lower than that of
Indian (mean=4.11, SD=1.18) participants (Figure 6.2).
Figure 6.2. Mean agreement with the statement 'the friendships/associations I have in my
local area with other people mean a lot to me’ by ethnicity and age.
2
2.5
3
3.5
4
4.5
5
16-29 30-49 50+
Age
'The
frie
ndsh
ips/
asso
ciat
ions
I ha
ve in
my
loca
l are
a w
ith o
ther
pe
ople
mea
n a
lot t
o m
e': m
ean
agre
emen
t Pakistani (n=206)Indian (n=154)African & Caribbean (n=242)Entire Sample (n=602)
75

Further analysis of the Greater Glasgow population survey results suggested that
participants felt that the friendships / associations with other people in their local
area meant comparatively more to older participants than younger ones. Thus in
the 50+years age group (mean=4.12, SD=0.55), participants agreed more
strongly with the above statement than those aged 16-29 (mean=3.79, SD=0.6)
and 30-49 (mean=3.96, SD=0.59) years.
6.2.3 Trust in People of Local Area
Participants were also asked the extent to which they agreed with the statement ‘I
can trust people in my local area’ in the same format as above. As is illustrated in
Figure 6.3, the pattern of results mirrors the results obtained in the
aforementioned two statements. African and Caribbean (mean=2.93, SD=1.3)
reported feeling significantly less trust towards the people living in respondents’
local areas than did Pakistani (mean=3.65, SD=1.24) and Indian (mean=4.05,
SD=1.13) informants. The equivalent mean from the Greater Glasgow wide
survey is 3.8 (SD=0.2).
Figure 6.3. Mean agreement with the statement ‘I can trust people in my local area’ by
ethnicity and age.
2
2.5
3
3.5
4
4.5
5
16-29 30-49 50+
Age
'I ca
n tr
ust p
eopl
e in
my
loca
l are
a':
mea
n ag
reem
ent
Pakistani (n=206)Indian (n=153)African & Caribbean (n=243)Entire Sample (n=602)
Figure 6.3 also illustrates that respondents aged 50+ years (mean=4.07,
SD=1.10) were significantly more likely to say that they had trust in the people
76

from their local areas than those aged 16-29 (mean=3.31, SD=1.35) and 30-49
(mean=3.32, SD=1.31) years.
This age trend is also apparent in the Greater Glasgow wide survey in which
respondents aged 50+ years (mean=4.05, SD=0.52) were significantly more likely
to say that they had trust in the people from their local areas than those aged 16-
29 (mean=3.65, SD=0.59) and 30-49 (mean=3.90, SD=0.58) years.
6.2.4 Help with Problems
Once again, responses to the statement ‘if I have a problem, there is always
someone to help me’ followed the same pattern of responses (see Figure 6.4).
African and Caribbean respondents (mean=3.25, SD=1.36) agreed significantly
less strongly with the statement than did Pakistani (mean=3.94, SD=1.14) and
Indian (mean=4.21, SD=1.10) participants. For the Greater Glasgow population
the corresponding mean is 3.8 (SD=0.82).
Figure 6.4. Mean agreement with the statement ‘if I have a problem, there is always
someone to help me’ by ethnicity and age.
2
2.5
3
3.5
4
4.5
5
16-29 30-49 50+
Age
'If I
have
a p
robl
em, t
here
is a
lway
s so
meo
ne to
hel
p m
e': m
ean
agre
emen
t Pakistani (n=206)Indian (n=152)African & Caribbean (n=240)Entire Sample (n=598)
As can be seen in figure 6.4, respondents aged 50+ years (mean=4.15, SD=1.17)
were significantly more likely to say that they had someone to help with problems
than those aged 16-29 (mean=3.75, SD=1.26) and 30-49 (mean=3.53, SD=1.31)
years.
77

This pattern of results is very similar to that found the general population survey
in which respondents aged 50+ years (mean=4.12, SD=0.53) were significantly
more likely to say that they had someone to help with problems than those aged
16-29 (mean=3.74, SD=0.61) and 30-49 (mean=3.96, SD=0.58) years.
6.2.5 Perceptions of Personal Safety
Participants were also asked the extent to which they agreed with three
statements gauging perceptions about personal safety. As before, agreement
with the statements was measured on a five-point scale ranging from 1 (Strongly
disagree) to 5 (Strongly agree).
6.2.5.1 Using Public Transport
The first statement was ‘I feel safe using public transport in my local area’ and
analysis indicated no significant differences as a function of ethnicity and gender
(overall mean agreement=4.21, SD=1). The equivalent mean for Greater
Glasgow as a whole is 3.9 (SD=0.74) and somewhat lower, suggesting that
participants in this survey felt slightly safer using public transport. The broad
agreement with the statement in this survey suggests that respondents felt
relatively safe using public transport in their local area. There was, however, an
effect of age across the sample with participants aged 50+ years (mean=4.38,
SD=1) feeling significantly more secure than those aged 30-49 years
(mean=4.08, SD=1.06). Participants aged 16-29 years (mean=4.28, SD=0.9) lay
in-between in terms of their strength of agreement. The Greater Glasgow general
population survey, in contrast found no significant differences in response
patterns as a function of age.
6.2.5.2 Walking Alone
The second statement asked how safe participants felt walking around alone
even after dark. Pakistani (mean=3.65, SD=1.34) and Indian (mean=3.78,
SD=1.36) agreed with the statement to a significantly greater degree than did
their African and Caribbean (mean=3.05, SD=1.42) counterparts. Moreover,
78

across the sample male (mean=3.64, SD=1.33) participants agreed to a
significantly larger degree than did female (mean=3.23, SD=1.46) interviewees.
Additionally, participants aged 50+ years (mean=3.89, SD=1.32) agreed more
strongly than those aged 16-29 years (mean=3.48, SD=1.41) and 30-49 years
(mean=3.2, SD=1.41). These age and gender trends across the sample are
illustrated graphically in Figure 6.5 below. Comparison with the equivalent
findings from the Greater Glasgow population as a whole (mean=3.4, SD=1.07)
indicate that participants in this survey felt roughly as safe walking alone after
dark than did the Greater Glasgow population. In the general population survey
participants aged 30-49 years (mean=3.97, SD=0.54) said that they felt
significantly safer walking around their local area than those aged 16-29 years
(mean=3.85, SD=0.57). Then mean agreement for respondents to the general
population survey aged 50+ years was 3.91 (SD=0.60) and did not differ to a
significant degree from either of the other age groups.
Figure 6.5. Mean agreement with the statement ‘I feel safe walking alone around my local
area even after dark’ by gender and age.
2
2.5
3
3.5
4
4.5
16-29 30-49 50+
Age
Mea
n ag
reem
ent
Male (n=308)Female (n=297)Both Genders (n=605)
6.2.5.3 Feeling Safe in Own Home
The final statement asked participants the degree to which they felt safe in their
own home. Responses are illustrated in Figure 6.6 and the comparative mean for
Greater Glasgow, as a whole, was 4.3 (SD=0.65) and broadly comparable with
the results found in this survey. The pattern of responses in the general
population survey did not differ to a significant degree as a function of age.
79

Figure 6.6. Mean agreement with the statement ‘I feel safe in my own home’ by ethnicity
and age.
33.23.43.63.8
44.24.44.64.8
5
16-29 30-49 50+
Age
Mea
n ag
reem
ent
Pakistani (n=208)Indian (n=152)African & Caribbean (n=241)Entire Sample (n=601)
Across the sample African and Caribbean (mean=4.15, SD=1.05) participants felt
significantly less safe than Pakistani (mean=4.67, SD=0.77) and Indian
(mean=4.64, SD=0.77) participants. As Figure 6.6 illustrates, in the youngest age
group African and Caribbean respondents felt significantly less safe than
Pakistani participants; in the middle age group they felt significantly less safe than
both Pakistani and Indian participants; and there were no significant differences
between ethnic groups in the 50+ years age groups. Moreover, across the
sample participants aged 30-49 years (mean=4.31, SD=1.03) felt significantly
less safe in their own home than those aged 16-29 years (mean=4.57, SD=0.78)
and 50+ years (mean=4.46, SD=0.93).
6.3 Racism
Given that racism can take many forms, and that definitions of racism may differ
greatly, racism was measured by means of the schedules of ‘minor’ and ‘major’
racist events developed by Landrine and Klonoff (1996). The first of these
probed how often participants thought that nine racist incidents had occurred to
them using a seven-point scale (1=Almost never; 7=Very often). The schedule of
‘major’ racist events, on the other hand, asked whether participants had
experienced seven events (e.g. ‘have you ever been fired or denied promotion
80

because of your ethnic background’) and scored by adding the number of times
participants said ‘yes’, as opposed to ‘no’.
6.3.1.1 ‘Minor’ Racist Events
Figure 6.7 summarises graphically the responses to the schedule of racist events
by ethnicity and age. African and Caribbean (mean=29.21, SD=12.74)
participants reported more ‘minor’ experiences of racism than both Pakistani
(mean=21.32, SD=11.33) and Indian (mean=20.02, SD=10.64) interviewees.
Across the sample, participants aged 30-49 (mean=26.26, SD=13.07) years
reported significantly more experiences of racism than those aged 16-29
(mean=23.47, SD=12.42) and 50+ (mean=20.94, SD=10.22) years. There were
no significant differences as a function of gender.
Figure 6.7. Mean schedule of racist events (‘minor’) scores by ethnicity and age.
10
15
20
25
30
35
16-29 30-49 50+
Age
Sche
dule
of r
acis
t eve
nts
('min
or'):
m
ean
scor
es Pakistani (n=205)Indian (n=148)African & Caribbean (n=239)Entire Sample (n=592)
6.3.1.2 ‘Major’ Racist Events
A similar picture emerged when participants were asked about the number of
‘major’ racist events they had encountered. Again, African and Caribbean
(mean=1.14, SD=1.47) participants reported significantly more such events than
their Pakistani (mean=0.53, SD=1.01) and Indian (mean=0.46, SD=1.02)
counterparts.
81

Figure 6.8. Schedule of major racist events (‘major’) mean scores by ethnicity and age.
0
0.2
0.4
0.6
0.8
1
1.2
1.4
1.6
16-29 30-49 50+
Age
Sche
dule
of r
acis
t eve
nts
('maj
or'):
m
ean
scor
es Pakistani (n=204)Indian (n=150)African & Caribbean (n=243)Entire Sample (n=597)
Across the sample, participants aged 30-49 (mean=0.95, SD=1.42) years
reported significantly more ‘major’ experiences of racism than those aged and
50+ (mean=0.49, SD=1.05) years (see Figure 6.8). There were no significant
gender differences.
The findings regarding perceptions of racism and discrimination thus illustrate
that, whilst present in all minority ethnic groups sampled, it may be particularly
marked in the African and Caribbean communities of Greater Glasgow.
6.4 Social Capital
6.4.1 Community Group Membership
Community group membership and volunteering did not differ as a function of
gender. However, as is illustrated in Figures 6.9 and 6.10 below, African and
Caribbean participants were much more likely than their Indian and Pakistani
counterparts to report acting as a volunteer or being a member of a community
group.
82

Figure 6.9. Community group membership / acting as a volunteer by ethnicity.
05
10152025303540
Pakistani Indian African &Caribbean
EntireSample
Etnicity
% c
omm
unity
gro
up m
embe
r /
volu
ntee
ring Community group
membership Acting as volunteer
The finding that African and Caribbean respondents were more likely to report
being civically engaged than their Pakistani and Indian counterparts may point to
social and cultural and differences with regard to the perceived importance of
local and community involvement. Furthermore, the part played by religion in the
organisation of the respective communities may also have had a bearing on
these findings.
Figure 6.10. Community group membership by ethnicity and age.
0
5
10
15
2025
3035
40
45
16-29 30-49 50+
Age
% c
omm
unity
gro
up m
embe
rshi
p
Pakistani (n=211)Indian (n=154)African & Caribbean (n=244)Entire Sample (n=609)
Findings from the Greater Glasgow genera population survey indicate that 20% of
the general population belong to a social club.
83

6.4.2 Acting as a Volunteer
Figure 6.11 also illustrates the finding regarding a greater degree of voluntary
civic engagement in the African and Caribbean community. In particular, more
than a third of African and Caribbean participants aged 30-49 years appear to
display a relatively high degree of voluntary involvement.
Figure 6.11. Acting as a volunteer by ethnicity and age.
0
5
10
15
20
25
30
35
40
16-29 30-49 50+
Age
% a
ctin
g as
vol
unte
er
Pakistani (n=211)Indian (n=155)African & Caribbean (n=244)Entire Sample (n=610)
6.5 Individual Circumstances
6.5.1 Perceptions of Identity
Perceptions of (ethnic) identity are not only recognised to be an indicator of
individuals’ connectedness to the broader social and cultural environment in
which they live, they may also bear an influence on mental well-being by buffering
individuals’ from the effects of racism and perceived discrimination. According to
Branscombe et al. (1999) perceived discrimination may strengthen the extent to
which individuals identify with their minority group, which, in turn, influences
psychological well-being positively. At the same time recent research carried out
in Glasgow suggests that young people who attached importance to Scottish
84

identity were less likely to report feelings of depression than those young people
who did not (Heim et al., 2004).
With this in mind, participants were asked to rate both the extent to which they felt
Scottish/British, and also the degree to which participants identified with their
ethnic background. This methodology therefore did not juxtapose ethnic and
Scottish/British identity, and allowed participants to identify with their ethnic
background in addition to feeling Scottish/British.
6.5.1.1 Feeling Scottish/British
Participants were asked to rate on a ten-point scale from 1 (Not at all) to 10 (Very
much), how Scottish/British they felt. Results indicated that across the sample,
African and Caribbean participants (mean=5.11, SD=2.80) felt less
Scottish/British than their Pakistani (mean=6.57, SD=5.59) and Indian
(mean=6.24, SD=2.89) counterparts. Moreover, this finding appears to have
largely been the result of African and Caribbean participants aged between 16
and 49 years reporting that they felt significantly less Scottish/British than both
Pakistani and Indian interviewees. As Figure 6.12 illustrates, there were no
significant differences in how Scottish/British respondents felt in the 50+ years
age group between ethnic groups.
Figure 6.12. Feeling Scottish/British by ethnicity and age.
3
3.5
4
4.5
5
5.5
6
6.5
7
7.5
16-29 30-49 50+
Age
Mea
n sc
ores
: 'ho
w S
cotti
sh/B
ritis
h'
do y
ou fe
el?'
Pakistani (n=208)Indian (n=155)African & Caribbean (n=244)Entire Sample (n=607)
85

Further analysis across the sample suggested a significant impact of participants’
age and gender on how Scottish/British they felt. As Figure 6.13 illustrates, whilst
there were no significant differences between male and female interviewees in
the 16-29 years and 30-49 years age groups, male participants in the 50+ years
age group felt significantly more Scottish/British than female participants.
Figure 6.13. Feeling Scottish/British by ethnicity and gender.
3
3.5
4
4.5
5
5.5
6
6.5
7
7.5
16-29 30-49 50+
Age
Mea
n sc
ores
: 'ho
w S
cotti
sh/B
ritis
h do
you
feel
?'
Male (n=306)Female (n=301)Both Genders (n=607)
6.5.1.2 Feeling ‘Ethnic Background’
Utilising the same scale outlined above, participants were also asked the
question ‘on a scale from 1 (Not at all) to 10 (Very much) how (ethnic
background) do you feel?’ with interviewers tailoring the question to respondents’
respective ethnic backgrounds. Results indicated that across the sample African
and Caribbean participants (mean=8.56, SD=1.92) identified more strongly with
their ethnic background than both Pakistani (mean=7.42, SD=2.35) and Indian
(mean=7.68, SD=2.54) backgrounds. Furthermore, regardless of respondents’
ethnicity and gender, participants aged 50+ years (mean=7.30, SD=2.56)
identified significantly less strongly with their respective ethnic backgrounds than
participants in the 16-29 years (mean=8.15, SD=2.22) and 30-49 years
(mean=8.05, SD=2.19) age groups.
86

6.5.2 Nationality
Participants were asked in an open-ended format which nationality they were. As
is shown in Table 6.1, Indian and Pakistani participants were more likely than
their African and Caribbean counterparts to say that they were British. Pakistani
participants were also most likely to say that they had dual nationality (e.g.
Pakistani/British).
Table 6.1. Nationalities by ethnicity.
Pakistani(n=198)
Indian (n=149)
African & Caribbean (n=237)
Entire Sample(n=584)
British 38% 34% 4% 23% Dual (including British/Scottish) 26% 8% 10% 15% Pakistani 29% 0% 0% 10% Indian 4% 54% 0% 15% African Country 0% 0% 80% 32% Religious (i.e. Muslim) 1% 0% 0% <1% Other (including European or Caribbean countries)
1% 1% 6% 3%
Scottish 1% 2% 0% 1%
6.5.3 Place of Birth
Participants were asked whether they had been born in the United Kingdom and
analysis of results did not indicate any significant differences as a function of
gender. As Figure 6.14 illustrates, in the 16-29 years age group Indian (46%)
and Pakistani (65%) participants were significantly more likely to have been born
in the UK than their African and Caribbean (6%) counterparts. Furthermore,
Pakistani and Indian participants aged 16-29 years were also significantly more
likely than Pakistani and Indian participants in the two older age groups to have
been born in the UK. There were no significant differences in whether the African
and Caribbean participants had been born in the UK as a function of age.
87

Figure 6.14. Percentage of participants born in the UK by ethnicity and age.
0
10
20
30
40
50
60
70
Pakistani Indian African &Caribbean
EntireSample
Ethnicity
% b
orn
in U
K
16-29 years30-49 years50+ years
6.5.4 Length of Residency in Greater Glasgow
Participants were asked also for how long they had lived in the Greater Glasgow
area and, once again, findings point to marked differences between the Indian
and Pakistani participants on the one hand, and the African and Caribbean
respondents, on the other.
As Figure 6.15 illustrates, across the sample African and Caribbean participants
(mean number of years=6.16, SD=9.48) reported living in Greater Glasgow for
significantly less years than did Pakistani (mean=17.25, SD=11.13) and Indian
(mean=16.63, SD=13.77) interviewees. There were a number of differences both
as a function of age and ethnicity. In the youngest age group of 16-29 years
Pakistani (mean=13.71, SD=8.89) participants reported living in Greater Glasgow
for significantly longer than both African and Caribbean (mean=3.7, SD=4.6) and
Indian (mean=10.94, SD=10.23) participants. Indian participants aged 16-29
years, in turn, reported living in Greater Glasgow for significantly longer than
African and Caribbean participants. In the 30-49 years age group Indian
(mean=16.56, SD=13.64) and Pakistani (mean=17.11, SD=11.48) participants
both reported living in Greater Glasgow significantly longer than African and
Caribbean (mean=4.79, SD=7.13) respondents. Finally, in the 50+ years age
group only the Indian participants (mean=26.74, SD=13.88), and not the
88

Pakistani respondents (mean=23.07, SD=11.45), reported living in Greater
Glasgow significantly longer than their African and Caribbean (mean=17,
SD=6.19) counterparts.
Figure 6.15. Years lived in Greater Glasgow by ethnicity and age.
0
5
10
15
20
25
30
16-29 30-49 50+
Age
year
s liv
ed in
Gre
ater
Gla
sgow
Pakistani (n=209)Indian (n=154)African & Caribbean (n=242)Entire Sample (n=605)
6.5.5 Language Knowledge and Ability
6.5.5.1 Languages Spoken
The questionnaire probed specifically whether participants spoke English, Urdu,
Punjabi, Hindi, French, Swahili, and Yoruba. Table 6.2 summarises the
languages most commonly spoken by participants (multiple responses were
possible). Interviewees were also asked in an open-ended format to name any
other languages they spoke. 5% of Pakistani participants, 21% of Indian
participants, and 57% of African and Caribbean respondents said that they spoke
a further language to the ones surveyed. A number of participants (less than 5%
of the entire sample, and primarily from African and Caribbean backgrounds)
reported speaking two, or more, additional languages.
89

Table 6.2. Languages spoken by ethnicity (number of participants in brackets).
Pakistani Indian African & Caribbean Entire Sample % (n) % (n) % (n) % (n) English 90 (190) 94 (146) 92 (224) 92 (560) Urdu 81 (170) 14 (21) <1 (1) 32 (192) Punjabi 85 (180) 57 (88) 1 (3) 44 (271) Hindi 13 (27) 62 (96) 1 (3) 21 (126) French 7 (14) 6 (9) 25 (60) 14 (83) Swahili 3 (6) 1 (2) 29 (71) 13 (79) Yoruba 0 1 (2) 7 (16) 3 (18) Lingala 0 0 7 (16) 3 (16) Arabic <1 (1) 0 3 (6) 1 (7) Maratyi 0 6 (10) 0 2 (10) Shona 0 0 4 (9) 2 (9)
6.5.5.2 First Spoken Language
Interviewees’ first language spoken is summarised in Table 6.2. Approximately
1% of Pakistani, 4% of Indian and 11% of African and Caribbean participants
reported that their first spoken language was different from the ones listed.
However, the comparatively low response rate should be noted (106 missing
cases) since this may have impacted adversely on the accuracy of the figures
summarised in Table 6.3. Whilst most respondents spoke English, as already
noted, it tended to not be the first language spoke, especially among the
Pakistani and Indian respondents.
Table 6.3. First spoken language by ethnicity (number of participants in brackets).
Pakistani Indian African & Caribbean Entire Sample % (n) % (n) % (n) % (n) English 27 (53) 32 (43) 45 (60) 31 (156) Punjabi 52 (102) 44 (59) 3 (5) 33 (166) Urdu 31 (62) 2 (3) 0 13 (65) Hindi 2 (3) 20 (27) 0 6 (30 Yoruba 0 0 6 (11) 2 (11) Swahili 0 0 23 (39) 8 (39) French 1 (2) 0 24 (42) 9 (44)
There was also a clear trend whereby the likelihood of participants saying that
English was their first spoken language diminished with age. Thus, across the
sample, 44% of participants aged 16-29 years said that English was their first
spoken language, compared to 26% of 30-49 year olds and 16% of respondents
aged 50+ years. This trend was most marked in the Indian sample with 57% of
the 16-29 years age group saying that English was their first spoken language,
together with 46% of Pakistani and 32% of African and Caribbean participants in
90

the same age group. Indeed, in the African and Caribbean sample participants
aged 50+ years (48%) were more likely than the younger age groups to say that
English was their first spoken language.
6.5.5.3 Self-Rated English Language Ability
Participants were asked to rate how well they spoke, wrote and read English on a
ten-point scale ranging from 1 (Very poorly) to 10 (Very well).
6.5.5.3.1 Speaking English
African and Caribbean participants aged 50+ years (mean=8.00, SD=2.26) rated
their spoken English ability significantly higher than Pakistani (mean=5.11,
SD=2.45) and Indian (mean=5.81, SD=2.17) participants of the same age (see
Figure 6.16). There were no significant differences in the younger age groups as
a function of ethnicity.
Figure 6.16. Self-rated ability to speak English by ethnicity and age.
4
5
6
7
8
9
10
16-29 30-49 50+
Age
Spea
king
eng
lish:
mea
n sc
ores
Pakistani (n=210)Indian (n=154)African & Caribbean (n=244)Entire Sample (n=608)
Across the entire sample male participants (mean=7.85, SD=2.35) rated their
ability to speak English significantly higher than their female counterparts
(mean=7.56, SD=2.81). Furthermore, self-rated ability to speak English
decreased with age in all ethnic groups. Across the sample, participants in the
16-29 year age group (mean=8.59, SD=1.92) rated their ability as significantly
better than those aged 30-49 (mean=7.64, SD=2.52) years. Both the younger
91

age groups rated their ability to speak English as significantly higher than
participants in the 50+ years age group (mean=6.19, SD=2.6).
6.5.5.3.2 Writing English
An almost identical picture emerged when participants were asked to rate their
English writing ability on the ten-point scale. Across the sample, male
participants (mean=7.66, SD=2.49) rated their ability to write English significantly
more highly than female respondents (mean=7.35, SD=2.85).
Figure 6.17. Self-rated ability to write English by ethnicity and age.
3
4
5
6
7
8
9
10
16-29 30-49 50+
Age
Writ
ing
engl
ish:
mea
n sc
ores
Pakistani (n=209)Indian (n=154)African & Caribbean (n=244)Entire Sample (n=607)
As Figure 6.17 illustrates, African and Caribbean (mean=7.61, SD=2.61)
participants aged 50+ years rated their ability to write English significantly higher
than both Pakistani (mean=4.21, SD=2.33) and Indian (mean=5.32, SD=2.35)
participants.
6.5.5.3.3 Reading English
In contrast to writing and speaking English no significant gender differences
emerged for self-rated ability to read English. As with self-rated ability to write in
English, African and Caribbean (mean=8.31, SD=2.18) participants aged 50+
rated their ability to write English significantly higher than both Pakistani
92

(mean=7.09, SD=2.96) and Indian (mean=7.56, SD=2.7) participants (see Figure
6.18).
Figure 6.18. Self-rated ability to read English by ethnicity and age.
3
4
5
6
7
8
9
10
16-29 30-49 50+
Age
Rea
ding
Eng
lish:
mea
n sc
ores
Pakistani (n=209)Indian (n=154)African & Caribbean (n=243)Entire Sample (n=607)
6.5.6 Educational Attainment
The self-reported highest level of educational achievement is summarised in
Table 6.4. It indicates that the level of educational achievement is markedly
lower in the Pakistani sample, when compared to African and Caribbean and
Indian respondents.
Table 6.4. Highest level of self-reported highest educational achievement by ethnicity.
Pakistani(n=210)
Indian (n=154)
African & Caribbean(n=244)
Entire Sample (n=608)
Primary Education 14% 7% 3% 8% Secondary Education 31% 26% 14% 23% Further Education (e.g. college) 29% 23% 38% 31% Higher Education (university) 20% 40% 43% 34% No Formal Education 6% 4% 2% 4%
The number of participants with no formal education increases with age (from 0%
of those aged 16-24 years to 21% of those aged 65+ years). There are few
differences in educational attainment as a function of gender, although women
(6%) appear more likely than men (2%) to report that they do not have any formal
education.
93

6.6 Home and Environment
6.6.1 Household Size
It is important to note that the following figures regarding household size are more
than likely to underestimate the total number of people living in the same
households as the respondents who took part in this survey. This was due to the
fact that at the beginning of data collection some fieldworkers did not complete
the relevant section in the questionnaire accurately. Attempts were made to
obtain missing data via the telephone (where participants had provided contact
details). The following data were obtained.
Figure 6.19 illustrates graphically the household composition of the Pakistani
sample. Compared to the Greater Glasgow population (household sizes: 20%
one person; 31% two people; 23% three people; 26% more than three people) it
becomes apparent that Pakistani people living in Greater Glasgow tend to live in
larger households of more than three people than do the population at large.
Figure 6.19. Household size (Pakistani sample).
One person (15%)Two people (14%)Three people (12%)More than three people (60%)
The size of Pakistani participants’ households was also found to be significantly
larger than those of Indian (Figure 6.20) and African and Caribbean (Figure 6.21)
respondents. The mean number of household members in the Pakistani sample
was 3.89 (SD=1.94). This was significantly higher than the household size of
94

Indian (mean=3.06, SD=1.56) and African and Caribbean (mean=2.25, SD=1.63)
respondents. More specifically, African and Caribbean participants reported
living in significantly smaller households than both Pakistani and Indian
respondents.
Figure 6.20. Household size (Indian sample).
One person (19%)Two people (20%)Three people (21%)More than three people (39%)
As Figure 6.20 illustrates, the Indian samples’ household makeup showed a less
marked but nevertheless noteworthy tendency to be larger than that of the
Greater Glasgow population. Indeed, Indian participants were almost twice as
likely as the general population to say that they lived in households with more
than three members.
The household make-up reported by African and Caribbean participants was
remarkably different from both that reported by the Indian and Pakistani
participants on the one hand, and that reported previously by the General
population of Greater Glasgow, on the other. The majority of African and
Caribbean participants thus appeared to say that they lived on their own (see
Figure 6.21). This finding is important since lone person households may be
more prone to social isolation, which may be associated with diminished mental
and emotional well-being.
95

Figure 6.21. Household size (African and Caribbean sample).
One person (52%)Two people (14%)Three people (11%)More than three people (23%)
Across the sample, there was also a significant tendency for participants aged
16-29 years (mean=2.77, SD=1.85) to live with less people than those
interviewees aged 30-49 years (mean=3.18, SD=1.85). The mean number of
household members in the 50+ years age group was 3.08 (SD=1.86) and not
significantly different from either of the other two age groups.
Moreover, a significant interaction between participant gender and age group
suggested that male participants aged 16-29 years (mean=2.53, SD=1.95) lived
in significantly smaller households than male participants aged 30-49 years
(mean=3.16, SD=1.95) and 50+ years (mean=3.34, SD=2.09). Female
participants, in contrast did not differ significantly in terms of household size as a
function of age, and the mean household size of female interviewees across all
age groups was 3.05 (SD=1.70). This finding is illustrated graphically in Figure
6.22.
96

Figure 6.22. Mean household size by gender and age.
2
2.2
2.4
2.6
2.8
3
3.2
3.4
3.6
16-29 30-49 50+
Age
Mea
n ho
useh
old
size
Male (n=309)Female (n=301)Both Genders (n=610)
6.6.2 Marital Status
As is illustrated in Table 6.5 Pakistani and Indian participants were more likely
than their African and Caribbean counterparts to be married. African and
Caribbean participants, in turn, were more likely to say that they were single /
never married. Pakistani and Indian participants were more likely than the
Greater Glasgow population (47%), as a whole, to be married. African and
Caribbean respondents were slightly less likely to say that they were married.
The incidence of divorce and separation across Greater Glasgow is 9% and
higher than in the Indian (2%) and Pakistani (7%) communities. Furthermore, in
contrast to Greater Glasgow figures (7% of population); participants from all
ethnic groups were less likely to report that they were cohabiting with their
partner. These trends are likely to reflect broad cultural differences between the
majority and minority cultures with regards to interpersonal relationships, and it is
important to remember that they may not necessarily be a reflection of
qualitatively ‘better’ marriages. Moreover, bearing in mind that, particularly in old
age, having a partner is an important determinant of (mental) health and well-
being and may impact on the upbringing of children, the findings are of
significance.
97

Table 6.5. Marital status by ethnicity.
Pakistani (n=210)
Indian (n=155)
African & Caribbean (n=243)
Entire Sample (n=608)
Married 60% 65% 41% 53% Cohabiting / living with partner 1% 4% 3% 2% Single / never married 29% 25% 41% 33% Widowed 4% 4% 5% 4% Divorced 2% 1% 5% 3% Separated 5% 1% 6% 4%
When considering the Pakistani sample in more detail a number of trends
become apparent (see Table 6.6). Participants in the youngest age group were
less likely than respondents in the two older age groups to be married and the
incidence of divorce and separation rose with age, as did the incidences of
widowhood. Male participants in the 50+ years age group were more likely to say
that they were married than women, who, in turn were more likely to report that
they were widowed.
Table 6.6. Marital status by age and gender of the Pakistani sample (number of participants
in brackets). Male Female Both Genders % (n) % (n) % (n)
Married 23 (9) 23 (8) 23 (17) Cohabiting / living with partner 0 3 (1) 1 (1) Single / never married 77 (30) 69 (24) 73(54) Widowed 0 0 0 Divorced 0 3 (1) 1 (1)
16-29 (n=74)
Separated 0 3 (1) 1(1) Married 87 (40) 84 (36) 85 (76) Cohabiting / living with partner 2 (1) 0 1 (1) Single/never married 9 (4) 2 (1) 6 (5) Widowed 0 5 (2) 2 (2) Divorced 0 2 (1) 1 (1)
30-49 (n=89)
Separated 2 (1) 7 (3) 5 (4) Married 88 (21) 48 (11) 68 (32) Cohabiting / living with partner 0 0 0 Single / never married 0 4 (1) 2 (1) Widowed 4 (1) 26 (6) 15 (7) Divorced 0 9 (2) 4 (2)
50+ (n=47)
Separated 8 (2) 13 (3) 11 (5)
With regards to the Indian sample (see Table 6.7), a trend is apparent by which
individuals from an Indian background (and females in particular) get married at a
younger age than their Pakistani and African and Caribbean counterparts (see
Tables 6.6 and 6.8). A similar finding to that of Pakistani participants, albeit less
marked, emerged with regards to male participants in the oldest age group being
more likely than females to say that they were married (and less likely to say that
they were widowed).
98

Table 6.7. Marital status by age and gender of the Indian sample (number of participants in
brackets). Male Female Both Genders % (n) % (n) % (n)
Married 28 (8) 46 (17) 38 (25) Cohabiting / living with partner 0 3 (1) 2 (1) Single / never married 69 (20) 46 (17) 56 (37) Widowed 3 (1) 3 (1) 3 (2) Divorced 0 0 0
16-29 (n=66)
Separated 0 3 (1) 2 (1) Married 77 (20) 85 (22) 81 (42) Cohabiting / living with partner 8 (2) 12 (3) 10 (5) Single / never married 8 (2) 0 4 (2) Widowed 0 0 0 Divorced 4 (1) 4 (1) 4 (2)
30-49 (n=52)
Separated 4 (1) 0 2 (1) Married 100 (19) 78 (14) 89 (33) Cohabiting / living with partner 0 0 0 Single / never married 0 0 0 Widowed 0 22 (4) 11 (4) Divorced 0 0 0
50+ (n=37)
Separated 0 0 0
When considering the marital status of the African and Caribbean sample (Table
6.8), it becomes apparent that females appear to get married at a younger age
than males. In contrast to both the Pakistani and Indian samples, however, the
incidence of divorce and separation appears to increase dramatically with age
from 0% in the youngest age group to 12% in the 30-49 years age group and
34% in the 50+ years age group. It is also interesting to note that this age trend
was more marked amongst female participants.
Table 6.8. Marital status by age and gender in the African and Caribbean sample (number
of participants in brackets). Male Female Both Genders
% (n) % (n) % (n) Married 12 (5) 20 (9) 16 (14) Cohabiting / living with partner 2 (1) 7 (3) 5 (4) Single/never married 85 (35) 72 (33) 78 (68) Widowed 0 2 (1) 1 (1) Divorced 0 0 0
16-29 (n=87)
Separated 0 0 0 Married 74 (49) 39 (21) 58 (70) Cohabiting / living with partner 2 (1) 0 1 (1) Single / never married 21 (14) 30 (16) 25 (30) Widowed 0 9 (5) 4 (5) Divorced 2 (1) 7 (4) 4 (5)
30-49 (n=120)
Separated 2 (1) 15 (8) 8 (9) Married 50 (9) 33 (6) 42 (15) Cohabiting / living with partner 0 6 (1) 3 (1) Single / never married 6 (1) 6 (1) 6 (2) Widowed 6 (1) 22 (4) 14 (5) Divorced 22 (4) 22 (4) 22 (8)
50+ (n=36)
Separated 17 (3) 11 (2) 14 (5)
99

When the gender trends in marital status from all three samples are seen in
conjunction, relatively consistent differences between the genders emerge: Men
tend to be less likely than women to say that they are widowed, divorced or
separated. Considering that the figures for the Greater Glasgow population at
large do not indicate this trend, two possible reasons for this gender difference
can be identified. First, it is possible that there was a sampling bias by which the
male participants sampled happened to be more likely to be in a relationship.
Second, these trends may be connected to broader social and cultural practices
whereby, regardless of the ultimate ‘truth’ of the statements, men may be less
likely than women to admit to an interviewer that a serious personal relationship
has been unsuccessful.
6.6.3 Households with Children Under 14 Years and Use of Childcare
Participants were asked whether any children under the age of 14 years lived in
their households. Responses for each community are summarised as a function
of age and gender in Tables 6.9, 6.10, and 6.11. Regardless of ethnic
background a trend whereby female participants have their children at a
comparatively younger age than men is apparent.
Table 6.9. Children under the age of 14 years in household (Pakistani sample) by gender
and age (number of participants in brackets). 16-29 30-49 50+ All Ages % (n) % (n) % (n) % (n)
Yes, mine 10 (4) 56 (26) 29 (7) 34 (37) Yes, others 30 (12) 2 (1) 8 (2) 14 (15)
Male (n=110)
No 60 (24) 41 (19) 63 (15) 53 (58) Yes, mine 29 (10) 63 (27) 0 37 (37) Yes, others 23 (8) 7 (3) 13 (3) 14 (14)
Female (n=101)
No 49 (17) 30 (13) 87 (20) 50 (50)
It appears that, whilst the findings outlined above concerning marital status
indicate that Pakistani (male) participants get married at a comparatively older
age than their Indian counterparts, Pakistani men in the youngest age group
appear more likely than in other communities to have children at an earlier age.
100

Table 6.10. Children under the age of 14 years in household (Indian sample) by gender and
age (number of participants in brackets). 16-29 30-49 50+ All Ages % (n) % (n) % (n) % (n)
Yes, mine 3 (1) 65 (17) 0 24 (18) Yes, others 14 (4) 0 0 5 (4)
Male (n=74)
No 83 (24) 35 (9) 100 (19) 70 (52) Yes, mine 25 (9) 46 (12) 11 (2) 29 (23) Yes, others 11 (4) 4 (1) 17 (3) 10 (8)
Female (n=80)
No 64 (23) 50 (13) 72 (13) 61 (49)
When the African and Caribbean figures are considered a discrepancy between
male and female respondent becomes apparent by which female participants are
more likely to say that the children in their households are their own. This finding
suggests that African and Caribbean women may play a more active role in
childrearing. This interpretation may also be applicable to the response patterns
summarised in the following paragraph below.
Table 6.11. Children under the age of 14 years in household (African and Caribbean
sample) by gender and age (number of participants in brackets). 16-29 30-49 50+ All Ages % (n) % (n) % (n) % (n)
Yes, mine 10 (4) 57 (37) 17 (3) 36 (44) Yes, others 20 (8) 14 (9) 11 (2) 15 (19)
Male (n=124)
No 71 (29) 29 (19) 72 (13) 49 (61) Yes, mine 39 (18) 61 (33) 22 (4) 47 (55) Yes, others 20 (9) 6 (3) 17 (3) 13 (15)
Female (n=118)
No 41 (19) 33 (18) 61 (11) 41 (48)
6.6.3.1 Responsibility for Children Under 14 Years
Participants who said that there were children under the age of 14 years living in
their household were asked whether they were responsible for these. Responses
showed little variation by gender in the Pakistani (52%=n/a, 32%=’yes’, 16%=’no’)
and Indian (59%=n/a, 6%=’yes’, 25%=’no’) samples. In the African and
Caribbean sample female (50%) participants were more likely than male (40%)
participants to say that they were responsible for children less than 14 years in
the household (overall figures: 48%=n/a, 45%=’yes’, 7%=’no’).
6.6.3.2 Use of Childcare
Participants were asked whether they used any form of paid or unpaid childcare.
Overall female participants were more likely than males to say that they used
101

childcare. Across the sample 12% of females said that they used childcare
compared to only 6% of male participants. Pakistani participants (4%) and Indian
(3%) participants were much less likely than African and Caribbean participants
to say that they used childcare (17%). Moreover, across the entire sample
participants aged 30-49 years (14%) were more likely to say that they used
childcare than those aged 16-29 years (8%) and 50+ years (3%).
When only the 204 participants who said that they were responsible for children
under 14 years living in their household are considered, 13% (9 participants) of
Pakistani and 14% (5 participants) of Indian said that they made use of childcare.
This is significantly lower than the 38% (38 participants) of African and Caribbean
respondents who said they used a form of childcare.
6.6.4 Caring Responsibility
In addition to asking about childcare uptake, the interview schedule asked
respondents whether they were responsible for caring for someone (e.g. a
disabled child or an elderly person) on a day-to-day basis. ‘Ordinary’ childcare
was not included in responses. 11% of Pakistani, 7% of Indian and 3% of African
and Caribbean participants said that they cared for someone on a day-to-day
basis. There was no difference as a function of gender in response patterns,
however the likelihood of caring for someone increased with age from 5% in the
16-29 years age group to 8% in the 30-49 years age group to 10% in the 50+
years age group.
On average participants who said that they cared for someone said that they
spent 5 hours (SD=3.4) per day caring for the person.
6.6.5 Internet Access
62% of Pakistani, 71% of Indian, and 79% of African and Caribbean participants
reported having access to the Internet. There were no significant gender
differences in terms of Internet access, indicating that for all ethnic groups male
and female participants were equally likely to have access to the Internet.
102

As Figure 6.23 indicates, there was, however, a significant tendency for the
oldest participants being the least likely to report having Internet access.
Figure 6.23. Internet access by ethnicity and age.
30
40
50
60
70
80
90
100
16-29 30-49 50+
Age
% w
ith in
tern
et a
cces
s
Pakistani (n=210)Indian (n=154)African & Caribbean (n=244)Entire Sample (n=608)
Figure 6.24 indicates that whilst African and Caribbean participants were the
most likely to report having Internet access, they were the least likely to report
having Internet access in their home.
Figure 6.24. Places of Internet access (home, elsewhere, or both) by ethnicity.
0
10
20
30
40
50
60
70
80
Pakistani Indian African &Caribbean
EntireSample
Ethnicity
% w
ith in
tern
et a
cces
s
HomeElsewhereBoth Home & Elsewhere
103

6.6.6 Perceived Difficulty Paying Unexpected Bill
Participants were asked how much of a problem it would be if they had to pay an
unexpected bill (for example for a household repair) since this would give an
indication of financial well-being. They were asked to consider having to meet
the cost of three bills (£20, £100, £1000), and to rate how much of a problem it
would be to pay the bill on a four point scale from 1 (Impossible to find) to 4 (No
problem).
6.6.7 £20 Bill Whilst there was a tendency for all participants to say that it would not be much of
a problem to meet the unexpected cost of a £20 bill, African and Caribbean
participants (mean=3.62, SD=0.53) perceived this to be a significantly greater
problem than Pakistani (mean=3.87, SD=0.41) and Indian (mean=3.9, SD=0.32)
respondents.
6.6.8 £100 Bill
When asked how much of a problem it would be to pay an unexpected bill of
£100, again, African and Caribbean participants (mean=2.70, SD=0.83)
perceived this to be a significantly greater problem than Pakistani (mean=3.18,
SD=0.79) and Indian (mean=3.2, SD=0.7) respondents.
6.6.9 £1000 Bill
When asked how much of a problem it would be to pay an unexpected bill of
£1000, a similar picture emerged (Figure 6.25). Again, African and Caribbean
participants said that this would be a comparatively larger problem for themselves
than Indian and Pakistani participants. There was a slight variation in this pattern
as a function of participant age. African and Caribbean (mean=1.75, SD=0.73)
participants aged 50+ years found it significantly harder to pay the imaginary
£1000 bill than their Indian (mean=2.16, SD=0.67) counterparts. In the 30-49
years age group African and Caribbean (mean=1.47, SD=0.76) participants found
104

paying the imaginary £1000 bill harder than both their Indian (mean=2.49,
SD=0.93) and Pakistani participants (mean=2.18, SD=0.83).
Figure 6.25. Perceived problem of paying unexpected bill of £1000 by ethnicity and age.
1
1.2
1.4
1.6
1.8
2
2.2
2.4
2.6
16-29 30-49 50+
Age
Mea
n sc
ores
: eas
e of
pay
ing
unex
pect
ed b
ill o
f £10
00
Pakistani (n=205)Indian (n=150)African & Caribbean (n=244)Entire Sample (n=599)
6.6.10 Proportion of Household Income from State Benefits
Responses to the question gauging participants’ perceptions regarding the
proportion of their household income thought to be derived from state benefits are
summarised in separate tables for Pakistani (Table 6.12), Indian (Table 6.13) and
African and Caribbean (Table 6.14) participants.
Table 6.12. Proportion of household income from state benefits by age and gender
(Pakistani sample). 16-29 30-49 50+ All Ages
% (n) % (n) % (n) % (n) None 78 (31) 62 (28) 60 (12) 68 (71) Very little 10 (4) 22 (10) 30 (6) 19 (20) About a quarter 3 (1) 4 (2) 10 (2) 5 (5) About a half 0 2 (1) 0 1 (1) All 0 4 (2) 0 2 (2)
Male (n=105)
Don’t know 10 (4) 4 (2) 0 6 (6) None 73 (24) 52 (22) 45 (9) 58 (55) Very little 12 (4) 38 (16) 30 (6) 27 (26) About a quarter 3 (1) 2 (1) 0 2 (2) About a half 0 2 (1) 15 (3) 4 (4) All 6 (2) 5 (2) 10 (2) 6 (6)
Female (n=95)
Don’t know 6 (2) 0 0 2 (2)
The Greater Glasgow population survey indicates that approximately 43% of the
general population reported that they were not in receipt of any state benefits,
105

whilst 28% reportedly received all of their income from state sources. As is
illustrated in Tables 6.12 and 6.13, both Pakistani and Indian participants were
considerably less likely than the general population to state that they were in
receipt of state benefits. There was also a trend in the Pakistani sample
indicating that male participants were less likely than their female counterparts to
say that a proportion of their household income was derived from state benefits.
In contrast, there was little variation as a function of gender in the Indian sample
regarding the proportion of household income that was said to be derived from
state sources (Table 6.13).
Table 6.13. Proportion of household income from state benefits by age and gender (Indian
sample). 16-29 30-49 50+ All Ages % (n) % (n) % (n) % (n)
None 83 (24) 81 (21) 81 (13) 82 (58) Very little 3 (1) 12 (3) 13 (2) 9 (6) About a quarter 0 4 (1) 0 1 (1) About three quarters 3 (1) 0 0 1 (1) All 0 4 (1) 6 (1) 3 (2)
Male (n=71)
Don’t know 10 (3) 0 0 4 (3) None 77 (26) 92 (23) 59 (10) 78 (59) Very little 9 (3) 8 (2) 29 (5) 13 (10) About a quarter 6 (2) 0 0 3 (2) About three quarters 0 0 0 0 All 0 0 12 (2) 3 (2)
Female (n=76)
Don’t know 9 (3) 0 0 4 (3)
Responses obtained from African and Caribbean respondents follow a somewhat
different pattern. As Table 6.14 highlights, African and Caribbean respondents
overall were generally more likely than the general public to say that none of their
household income was derived from state benefits. However, this was
particularly true for male interviewees. Female African and Caribbean
participants, 26% of whom said that all of their household income was derived
from state sources, were less likely than their male counterparts to say that none
of their income was derived from these sources. This may be an indication that
female African and Caribbean participants living in Greater Glasgow, in particular,
may be relatively dependent on benefits. Indeed, as the findings outlined above
concerning the perceived difficulty to pay an unexpected bill suggest, African and
Caribbean participants appeared to be comparable worse off financially than both
Indian and Pakistani interviewees.
106

Table 6.14. Proportion of household income from state benefits by age and gender (African
and Caribbean sample). 16-29 30-49 50+ All Ages
% (n) % (n) % (n) % (n) None 68 (28) 71 (47) 56 (10) 68 (85) Very little 2 (1) 5 (3) 22 (4) 6 (8) About a quarter 0 5 (3) 11 (2) 4 (5) About three quarters 0 0 0 0 About a half 2 (1) 3 (2) 6 (1) 3 (4) All 15 (6) 15 (10) 6 (1) 14 (17)
Male (n=125)
Don’t know 12 (5) 2 (1) 0 5 (6) None 48 (21) 48 (26) 59 (10) 50 (57) Very little 9 (4) 13 (7) 24 (4) 13 (15) About a quarter 2 (1) 6 (3) 6 (1) 4 (5) About a half 2 (1) 0 0 1 (1) About three quarters 5 (2) 0 0 2 (2) All 27 (12) 30 (16) 12 (2) 26 (30)
Female (n=115)
Don’t know 7 (3) 4 (2) 0 4 (5)
Further analysis suggested that being in receipt of benefits was associated with a
comparatively shorter length of residency in Greater Glasgow over and above the
ethnic background of participants. In other words, regardless of their ethnic
background, participants were more likely to be in receipt of state benefits if they
had lived in the Greater Glasgow area for comparatively less time.
6.6.11 Types of Benefits
Compared to the general population, 29% of which reported being in receipt of
income support, participants from Pakistani and African and Caribbean
backgrounds were more likely to say that they received this type of benefit (see
Table 6.15). The general population (25%), in contrast, appear much more likely
than respondents in this survey to be in receipt of disability-related benefits.
Given that participants in this survey were only marginally less likely than the
general population to say that they were suffering from a debilitating condition
(see Chapter 1), this finding is not necessarily the result of demographic
differences between our sample and the wider population. It may, however, be
the result of comparatively lower levels of awareness in the populations sampled
that incapacity-related benefits are available.
107

Table 6.15. Types of benefits by ethnicity (and Greater Glasgow comparison).
In receipt of Pakistani Indian African & Caribbean Entire Sample GG Comparison
% (n) % (n) % (n) % (n) % Job Seekers Allowance (JSA) 8 (7) 3 (1) 16 (17) 11 (25) 5 Income Support 35 (85) 24 (8) 52 (105) 42 (93) 29 Disability-Related Benefits 11 (9) 3 (1) 6 (6) 7 (16) 25 Housing Benefits 19 (16) 6 (2) 10 (10) 13 (28) 25 Child Tax Credit 31 (26) 30 (10) 14 (15) 23 (51) 5 (family tax
credit) Working Tax Credit 7 (6) 15 (5) 11 (11) 10 (22) Disabled Person's Tax Credit 0 0 1 (1) <1 (1) 1 Retirement Pension 9 (8) 24 (8) 4 (4) 9 (20) 38 Attendance Allowance 2 (2) 6 (2) 3 (3) 3 (7) 5 Other Pension 2 (2) 3 (1) 2 (2) 2 (5) 14 Other 12 (10) 18 (6) 11 (12) 13 (28)
Indian as well as African and Caribbean participants in this survey were also
markedly less likely than the population at large (25%) to say that they were
receiving housing benefits (see Table 6.15), ‘other pensions’ (Greater Glasgow
figure: 14%).
‘Other’ responses were not analysed by ethnicity owing to their infrequency and
missing data. These were as follows:
• ‘child benefit’ (2%, 9 participants) • ‘scholarship’ (1%, 5 participants) • ‘widow allowance’ (1%, 4 participants) • student bursary (1%, 3 participants) • ‘social work department payments’ (<1%, 2 participants) • ‘incapacity benefit’ (<1%, 1 participant) • ‘sickness benefit’ (<1%, 1 participant) • ‘NASS support’ (<1%, 1 participant)
108

7 General Conclusions
This report summarised the research findings from a health and well-being survey
of people from African, Caribbean, Indian and Pakistani backgrounds living in
Greater Glasgow. The research was commissioned because the most recent
general population health and well-being survey (RBA, 2002) was not designed to
yield sufficient information on the health and well-being of minority ethnic
communities in Greater Glasgow. A similar survey of Greater Glasgow Chinese
community was also conducted on behalf of the Chinese Healthy Living Centre
(FMR Research, 2004). A culturally sensitive methodology, utilising a purposive
sample stratified for age, gender and geographic location, was employed to
obtain information on a number of indicators of health / mental health and well-
being, as well as broader issues relating to service delivery, community
involvement, home and environment, personal details, and experiences of
racism. Minority ethnic fieldworkers, drawn from the respective minority ethnic
populations, collected data with respondents’ informed consent, and informants
were reimbursed for participating in the research. Fieldworkers were trained to
help ensure standardised data collection.
Key research findings are discussed below in relation to the study aims.
7.1 Health
The report began by outlining respondents’ perceptions of their own health, which
tended to be positive and comparable to those reported by inhabitants of Greater
Glasgow in the general population health and well-being survey of 2002. At first
sight this absence of differences between minority ethnic individuals and the
general population may seem remarkable given that minority ethnic communities
in the UK are disadvantaged in terms of health (Nazroo, 1997). However, since
positive perceptions of health decreased with age, these results may be due to
the younger age profile of the population sampled in this survey.
The younger age profile of the sample may explain why informants in this survey
were less likely than the general population to say that they suffered from a
debilitating condition and were consistently more positive than the general
109

population about their perceived quality of life, physical, mental and emotional
well-being.
The response patterns concerning perceptions of health and well-being of African
and Caribbean respondents tended to be more positive than those of Indian
participants, the Greater Glasgow population at large, and Pakistani respondents
in particular. Pakistani respondents, in contrast, tended to have a more negative
perception of their health and were more likely to report that they were receiving
treatment for conditions and illnesses, and to say that they suffered from a
debilitating illness or condition that interfered with their lives. Respondents from
Pakistani backgrounds also reported receiving treatment for a significantly greater
number of conditions and illnesses than their Indian and African and Caribbean
counterparts. In line with these findings, Pakistani respondents also tended to be
most likely to report contact with health service providers in the twelve months
preceding the interview.
7.2 Mental Well-Being
In terms of mental well-being, Pakistani respondents reported comparatively
elevated levels of perceived stress and were also likely to score higher on the
general health questionnaire (GHQ-12). The GHQ-12 is a measure of
psychological distress that can be scored in both a continuous and a categorical
(bimodal) manner - in the aforementioned finding the continuous scoring method
was used. In comparison to Indian respondents, who consistently reported the
least psychological distress across a range of measures, African and Caribbean
respondents also showed a significant tendency to give responses that may be
indicative of diminished mental well-being (although perceived stress scores,
which were the lowest for African and Caribbean respondents, were an exception
to this trend). In this way, for example, African and Caribbean respondents were
the most likely to state that they did not feel in control about decisions affecting
their lives. Moreover, when using the bimodal scoring method, 20% of African
and Caribbean respondents had a GHQ score that may be indicative of
psychological distress. This compared to 16% of Pakistani and 12% of Indian
respondents.
110

The finding that self-reported experiences of racism were linked to elevated GHQ
scores is also of interest. It serves as a reminder of the negative consequences
discrimination can have on individuals’ lives, and points to the need to combat
racism so that minority ethnic individuals and communities, who may already be
disadvantaged socio-economically (Modood et al., 1999), can also achieve
equality in terms of psychological well-being.
7.3 Satisfaction with Service Provision
Regarding satisfaction with health services, participants aged 50+ years from all
minority ethnic groups were more satisfied with service provision than younger
respondents. Older participants said that they felt more adequately informed
about conditions and treatments, that they were encouraged to participate in
decisions affecting treatment, and that they felt satisfied with their ‘say’ in the
delivery of services. Pakistani and Indian respondents aged between 16 and 29
years were found to be unhappier than their older peers with both the adequacy
of information about conditions / treatments and the extent to which they felt
encouraged to participate in decisions affecting their health and treatment.
Whilst the aforementioned finding may suggest that health care professionals
should be encouraged to show particular sensitivity in consultations with
individuals aged between 16 and 49 years from minority ethnic communities,
other findings point to significant language barriers to the consultation process,
especially among older respondents. Thus, whilst participants aged 50+ years
reported the greatest satisfaction with service delivery, including the perceived
ease of getting appointments with health care service providers, they also
reported the most difficulties in understanding the advice given and
communicating their views. This may suggest that the findings regarding age
differences in reporting satisfaction levels with service providers signify broader
differences in social and cultural norms and expectations regarding health care
service provision, as much as differences in actual experiences. For example,
comparatively lower expectations regarding desired quality of service provision
amongst those aged 50+ years across the population as a whole may help
explain these findings.
111

7.4 Oral Health
Survey findings relating to oral health suggest that African and Caribbean
respondents were more likely than their Indian and Pakistani counterparts to say
that all of their teeth were their own. Respondents from African and Caribbean
backgrounds were least likely to say that they had visited a dentist within the six
months preceding the interview, whilst Pakistani respondents were the most likely
to say that they had done so. Given that across the entire sample almost forty
percent of respondents said that they had not visited a dentist in the fifteen
months preceding the interview (compared to about thirty percent of the general
population), it is apparent that greater effort is required to encourage minority
ethnic individuals living in Greater Glasgow to visit (and/or register with) a dentist.
In this context it is also important to note that Pakistani respondents, who were
more likely than Indian and African and Caribbean respondents to say that they
consumed sweet foods (e.g. sweets and chocolates), were also the least likely to
say that they brushed their teeth twice daily. These findings may explain why
Pakistani respondents were more likely to have visited a dentist in the months
preceding the interview. They also suggest that the distribution of information
regarding oral health amongst the Pakistani community in Greater Glasgow
should be a priority.
7.5 Alcohol Consumption and Smoking
When considering survey findings summarised in the section, cultural sensitivities
with regards to these behaviours, as well as the possibility that participants may
have felt particularly uncomfortable disclosing information of this nature to
fieldworkers drawn exclusively from respondents’ respective ethnic backgrounds
should be borne in mind since these may have affected the ‘truthfulness’ of
responses. In particular, this may be reflected in the low levels of self-reported
alcohol consumption. In this way, 91% (85% of males and 97% females) of 57%
Pakistani (34% of males and 79% of females) and 60% of African and Caribbean
(56% of Males and 64% of females) participants said they never consumed
alcoholic drinks. Furthermore, the number of participants who said that they had
consumed an alcoholic drink in the month preceding the interview was only 7% of
the entire sample, and these participants reported very low levels of alcohol
112

consumptions that were not sufficiently large to be analysed meaningfully in
terms of units of alcohol consumed.
Findings regarding smoking indicate smoking is relatively more prevalent in the
Greater Glasgow Pakistani community (23% smokers) compared with the Indian
(10% smokers) and African and Caribbean (11% smokers) communities. Overall
however, all communities were less likely to report that they smoked cigarettes
than the general population of Greater Glasgow (33%). The tendency for
smokers aged 50+ years to report being the heaviest smokers suggests
generational differences in smoking behaviour. In terms of exposure to passive
smoking, no clear differences emerged between the general population and
respondents in this survey concerning their likelihood of reporting exposure to
cigarette smoke some or most of the time. Moreover, exposure to smoking was
the most frequently given response to the open ended question of whether
respondents felt that there was something about their home that affected their
health.
7.6 Diet
In terms of diet, the results suggest that self-reported intake of fruit and
vegetables showed much variation as a function of ethnic background, and was
particularly low amongst Pakistani respondents. Thus only 19% Pakistani
reported consuming the recommended amount of five, or more, portions of fruit
and vegetables per day. This compares to 34% of the general population, 33% of
Indian and 47% of African and Caribbean participants. The comparatively low
fruit and vegetable consumption reported by the Pakistani community may also
reflect distinct styles of food preparation which may obscure the total amount of
fruit and vegetables consumed. From this perspective, cooking practices may
render it difficult to measure fruit and vegetable consumption in terms of
‘portions’, especially vegetables, since these may traditionally be associated with
western styles of food preparation.
Breakfast cereal consumption was lower than in the general population, with
Indian respondents reporting the highest consumption levels followed by African
and Caribbean and Pakistani respondents. With regards to oily fish consumption,
113

Indian participants, in particular, were the least likely to meet the target set by the
Scottish Diet Action Plan of eating oily fish at least two times per week.
However, promotion of the aforementioned diet action plan, which also stipulates
how much bread and breakfast cereal people should eat, may be a problematic
strategy to adopt when aiming to help minority ethnic individuals to improve their
diets since, by being based on the general eating habits of the white population, it
may be culturally insensitive and inappropriate.
7.7 Physical Activity
Pakistani (32%) respondents were less likely than Indian (50%) and African and
Caribbean (45%) respondents to undertake the recommended amount of physical
activity, defined as either moderate activity at last five times per week or twenty
minutes of vigorous physical activity three or more times per week. These
findings indicate that the general population (58% of which met this target in
2002) appear to be more physically active than the minority ethnic groups
participating in this survey.
7.8 Body Mass Index
Results relating to the Body Mass Index (BMI) suggest that the likelihood of
respondents in this survey being classified as overweight was similar to that of
the general population, and Pakistani and African and Caribbean respondents
were significantly more likely than their Indian counterparts to be classified in this
way. Further analysis indicated that across the entire sample participants
between 30-49 years were more likely to be classified as overweight than those
aged between 16-29 years and over 50 years.
Comparatively high BMI scores were linked to receiving treatment for medical
conditions, reports of stress, taking comparatively low amounts of moderate
physical exercise and eating comparatively larger amounts of sugary foods
amongst other factors. The increased likelihood of Pakistani respondents to be
classified as overweight may therefore be linked to health behaviours since
Pakistani informants reported the highest intake of sweet foods and lowest levels
114

of both moderate and vigorous exercise, as well as the highest stress levels.
This suggests that it may be particularly worthwhile to target healthy lifestyle
campaigns at the Pakistani community in Greater Glasgow.
7.9 Distribution of Information Relating to Health
Pakistani and Indian participants were significantly less likely than African and
Caribbean respondents to say that they wanted further information on a number
of health issues, in spite of the lower uptake of recommended health behaviours
reported above. Whilst this may reflect lower levels of concern or awareness
regarding issues relating to health in the Pakistani and Indian communities, it also
suggests that African and Caribbean participants feel a particular need for
additional health related information. This finding also emerged in other parts of
the research with a number African and Caribbean respondents, who tended to
have lived in the Greater Glasgow area for the least amount of time and were
most likely to have been born outside the UK, saying that they required general
information on the National Health Service.
Other survey findings suggest that the perceived need for further health related
information was perceived as being best met by distributing videos, booklets and
leaflets, and making information available on the Internet. However, participants
aged 50+ years were the least likely to have access to the Internet and also
reported the most difficulties with reading and writing English. This suggests that
information targeted at this age group should be distributed in appropriate
(language) formats.
The vast majority of respondents said that they wanted information in English with
Urdu and Punjabi also being mentioned by a sizable proportion of respondents.
A relatively large number of participants said that they would like to receive
information relating to health issues via the post, suggesting that this might be an
effective strategy for distributing health-related information. Interestingly, as
noted below (2.11) African and Caribbean respondents were the most likely to
report having access to the internet.
115

7.10 Perceptions of Local Area and Identity
Perceptions relating to the local area in which participants lived and personal
safety suggested that African and Caribbean individuals living in Greater Glasgow
feel a comparatively lesser sense of belonging to their local area, as well as
feeling less secure and safe than their Pakistani and Indian counterparts. In this
context it is also significant that African and Caribbean respondents reported
being subjected to racism more frequently than both Indian and Pakistani
participants, and that respondents from African and Caribbean backgrounds were
the least likely to say that they felt Scottish / British and identified most strongly
with their ethnic background. This may also reflect the comparatively shorter
average length of residency in Greater Glasgow of African and Caribbean
participants (6 years compared to 17 years for Pakistani and Indian respondents)
which may have had a bearing on the extent to which these respondents had
established roots. Across all ethnic groups, older participants showed a greater
tendency than younger informants to say that they felt connected to the area in
which they lived. Moreover, across all ethnic groups participants in the oldest
age groups (50+ years) identified less strongly with their ethnic background than
those aged between 16 and 49 years.
The findings that African and Caribbean respondents were the most likely to
report experiences of racism and feelings of isolation, and the least likely to feel
connected to the area in which they lived may, in part, explain why community
group membership and volunteering were more common in the African and
Caribbean communities than in the other two. From this perspective, elevated
community group membership may be a means of providing and attaining social
support, in addition to being influenced by religious and socio-cultural practices of
the three communities sampled. Moreover, retaining (and/or building) strong
minority ethnic community links may help buffer adverse effects of racism and
discrimination, and therefore be an advantageous strategy to adopt (Heim et al.,
2004). This notion may also help explain the tendency for younger participants to
identify more strongly than their older peers with their ethnic background.
7.11 Individual Circumstances and Financial Well-Being
116

The finding, hinted at above, that African and Caribbean respondents were the
most likely to say that they sometimes felt isolated from friends and family may
also be related to the demographic characteristics of the sample. Thus Indian
and Pakistani respondents were more likely than their African and Caribbean
counterparts to live in larger households, with more than half of African and
Caribbean respondents saying that they lived alone. As mentioned above they
were also likely to report much shorter periods of residence in Glasgow.
Participants from African and Caribbean backgrounds were also the least likely to
be married, and female African and Caribbean respondents were more likely than
their male counterparts to say that they were responsible for children under the
age of fourteen years in their household.
Finally, research findings relating to a range of indicators of financial well-being
indicate that African and Caribbean respondents considered themselves to be
worse off than both their Indian and Pakistani counterparts. African and
Caribbean participants reported the most perceived difficulty of meeting the cost
of an unexpected bill, and were also comparatively more likely to state that a
proportion of their household income was derived from state benefits. African
and Caribbean respondents were more likely than their Indian and Pakistani
equals to have access to the internet, although they were least likely to say that
they had access to the internet in their own home. This may also be an indication
of comparatively lower levels of affluence in the African and Caribbean
community in Greater Glasgow. The survey also found that, regardless of their
ethnic background, participants who had lived in Greater Glasgow for a
comparatively longer length of time were less likely to be in receipt of state
benefits.
7.12 Research Limitations
A few general points regarding the limitations of the research are appropriate.
Whilst care was taken to stratify the sample with the aim of making it as
representative of the minority ethnic populations as possible, the extent to which
it is representative remains difficult to determine owing to a lack of appropriate
sampling frames as well as the purposive nature of the sampling methodology.
117

Moreover, since participation was voluntary and the recruitment of respondents
was opportunistic there is the possibility of sampling biases.
Some caution also needs to be brought to bear on comparisons drawn across the
minority ethnic communities surveyed in this research since significant
differences as a function of ethnic background may also have reflected
differences in sample characteristics (e.g. in terms of age), although the analysis
by age and gender may have controlled for this to an extent. For example, since
the age profile of the minority ethnic populations surveyed is somewhat younger
than that of the Glasgow general population not all of the findings from the current
survey and that of the general population are readily comparable. Moreover, the
research instruments utilised in the current survey differed to some extent from
those used in the general population survey.
Whilst the methodology of exclusively employing fieldworkers from minority ethnic
backgrounds may have impacted adversely on the ‘truthfulness’ of responses
(see 5.1.2), this practice may also have enriched the data to a degree. By
interviewing respondents in their preferred language, as well as using - and
building upon - existing links with minority ethnic community groups and
individuals the research team was able to involve individuals in the survey who
may otherwise have been excluded from taking part.
In addition, the flexible nature of the data collection process and the inclusive
fieldworker recruitment process enabled a number of fieldworkers to gain
employment in the UK and / or research experience for the first time. This
opportunity, as did the perceived importance of the research, helped ensure that
fieldworkers were highly motivated and is likely to also have combated the
problem of fieldworker fatigue to some degree.
7.13 Further Areas for Research In conclusion, this study provided an overview of health and well-being issues
affecting the Pakistani, Indian, and African and Caribbean communities in Greater
Glasgow, encompassing the highest numbers of people from minority ethnic
backgrounds living in Scotland. Bearing in mind health inequalities affecting
minority ethnic communities, and explicit linkages between health and social
118

inclusion agendas this research identified areas of concern as well as positive
factors, which will inform planning as well as suggest areas for future research. It
also provided a baseline against which to measure the impact of initiatives aimed
at improving the health and well-being of minority ethnic communities in Greater
Glasgow.
Given the relatively broad aims of this research, covering amongst other issues
indicators of health and well-being, satisfaction with services, and perceptions
relating to identity and local areas, future research should explore some of the
key findings in more depth. For example, whilst this research identified a
relationship between experiences of racism and diminished psychological well-
being, future research could aim to identify factors that may mediate this link.
Given that this research identified differences between minority ethnic groups
with regards to specific health behaviours (e.g. diet and physical activity); future
research should endeavour to identify possible underlying reasons for such
discrepancies. In particular, findings in this study point to a need for developing
culturally sensitive measures of dietary behaviours that may inform local and
national dietary guidelines for minority ethnic groups. Information needs of
minority ethnic communities and possible communication approaches and routes
could also be explored further, as well as identifying barriers in terms of access to
services encountered by minority ethnic communities.
119

8 References
Arber S (1993). Designing samples. In N Gilbert (ed), Researching Social Life.
London: Sage.
Atkinson DR (1993). Who speaks for cross-cultural counselling research? The
Counseling Psychologist, 21, 218-224.
Babbie E (1992). Survey Research Methods (2nd Ed.). London: Sage.
Bhopal R, Vettini A, Hunt S, Wiebe S, Hanna L, & Amos A (2004). Review of
Prevalence Data in, and Evaluation of Methods for Cross Cultural Adaptation of,
UK Surveys on Tobacco and Alcohol in Ethnic Minority Groups. British Medical
Journal, 328, 76-80A.
Branscombe, NR, Schmitt, MT, & Harvey, RD (1999). Perceiving pervasive
discrimination among African Americans: Implications for group identification and
well-being. Journal of Personality and Social Psychology, 77, 135-149.
Brislin R (1993). Understanding culture's influence on behavior. New York:
Harcourt Brace Javonovich.
Calderwood, L and Park, A (2000). General health. In A Shaw, A McMunn and J
Field (eds) Scottish Health Survey 1998, Edinburgh: HMSO.
Casas JM and Thompson CE (1991). Ethical principles and standards: a racial-
ethnic minority research perspective. Counseling and Values, 35, 186-195.
Creswell JW (1994). Research design: qualitative and quantitative approaches.
Sage: London.
FMR Research Ltd (2004). Chinese Health and Well-Being Study.
Commissioned for the Chinese Health Living Centre, Glasgow.
General Register Office for Scotland (2003). 2001 census ethnic group data
analysis. General Register Office for Scotland (Crown Copyright).
GGNHSB (Greater Glasgow NHS Board) (2002). Race Equality Scheme 2002-
2005. Glasgow, GGNHSB.
Gil EF and Bob S (1999). Culturally competent research: an ethical perspective.
Clinical Psychology Review, 19, 45-55.
Gilbert N (ed.) (1993). Researching social life. Sage: London.
Haslam SA and McGarthy C (2003). Research Methods and Statistics in
Psychology. London: Sage.
Heim, D, Hunter, SC, Ross, AJ, Bakshi, N, Davies, JB, Flately, KJ, & Meer, N
(2004a). Alcohol consumption, perceptions of community responses, and
120

attitudes to service provision: Results from a survey of Indian, Chinese and
Pakistani young people in Greater Glasgow, Scotland, UK. Alcohol and
Alcoholism, 39, 220-226.
Heim, D, Howe, C, Cassidy, C, O’Connor, R, Warden, D., & Cunningham, L
(2004). A longitudinal investigation of the experiences of racism and
discrimination in young people in Glasgow. Prepared for Glasgow Anti Racist
Alliance / Scottish Executive.
Hughes AO, Fenton S, & Hine CE (1995). Strategies for sampling black and
ethnic minority populations. Journal of Public Health Medicine, 17, 187-192.
Karlsen S and Nazroo JY (2002). Relation between racial discrimination, social
class and health among ethnic minority groups. American Journal of Public
Health, 92, 624-631.
Landrine, H and Klonoff, EA (1996). The schedule of racist events: A measure of
racial discrimination and a study of its negative physical and mental health
consequences. Journal of Black Psychology, 22, 144-168.
Modood T, Berthoud R, Lakey J, Nazroo J, Smith P, Virdee S, & Beishon S
(1997). Ethnic Minorities in Britain: Diversity and Disadvantage. The Fourth
National Survey of Ethnic Minorities. London: Policy Studies Institute.
Malseed J (1990). Alcohol in Asian and Afro-Caribbean Communities. School of
Independent Studies, Lancaster University.
McGraw SA, McKinlay JB, Crawford SA, Costa LA, & Cohen DL (1992). Health
survey methods with minority populations: some lessons from recent experience.
Ethnicity and Disease, 2, 273–287.
Nazroo, JY (1997). The health of Britains ethnic minorities. London: Policy
Institute.
RBA (2002). Health and well-being survey 2002. Prepared for Greater Glasgow
NHS Board.
Roshan, N (2002). Health Needs of Black and Minority Ethnic Young People in
Greater Glasgow. Glasgow: GGNHSB, Health Promotion Department.
Scottish Executive (2004). Analysis of Ethnicity in the 2001 Census – Summary
Report. Edinburgh: Office of the Chief Statistician.
121

9 Appendix
Health and Well-Being Study Questionnaire INTERVIEWER: Ensure that participant has read the information sheet, has had the opportunity to ask questions about the study and signed the consent form. Screening Questions
1. As outlined in the information sheet, this survey is interested in the views of people from Pakistani, Indian, African or Caribbean backgrounds. Can I confirm that you are from one of these backgrounds?
Yes / No If no, thank and close If yes, continue with survey
2. Are you aged 16 or over? Yes / No
If no, thank and close If yes, continue with survey
3. Can I please check whether you have already been interviewed for the Health and Well-being Survey? (EXPLAIN IF NECESSARY) Yes / No
If yes, thank and close If no, continue with survey
Full Post Code
Participant ID (Interviewer Initials and Number of Interview): ___________ INTERVIEWER DECLARATION: I declare that this interview was carried out according to instructions. Interviewer Name Signature Date Interviewee Ethnicity
Gender and Age M F (circle) Age: Interview duration Area Recruitment Details
Back-checked by Date
122

SECTION 1 – YOUR HEALTH Q1 I’d like to start by asking you some questions about your health. How
would you describe your health over the past year? (READ OUT AND CODE ONE ONLY)
Would you say it was… Excellent .......................................................................................................1 Good .............................................................................................................2 Fair................................................................................................................3 Poor ..............................................................................................................4
SHOWCARD A Q2 Are you currently being treated for any of the following conditions?
(CODE ALL THAT APPLY, CHECK THAT PARTICIPANT IS CURRENTLY BEING TREATED) Coronary heart disease ................................................................................1 Stroke ...........................................................................................................2 Arthritis or rheumatism or painful joints.........................................................3 Clinical depression........................................................................................4 Diabetes........................................................................................................5 Cancer ..........................................................................................................6 Asthma, bronchitis, or persistent cough........................................................7 Epilepsy ........................................................................................................8 Stress related conditions, e.g. difficulty sleeping or concentrating ...............9 Hearing problems .......................................................................................10 Eyesight problems ......................................................................................11 Accident / injury ..........................................................................................12 Gastro-intestinal problems, e.g. peptic ulcer disease,
irritable bowel syndrome....................................................................13 High blood pressure....................................................................................14 Drug or alcohol related conditions ..............................................................15 Other/s (PLEASE SPECIFY) ......................................................................16 _______________________________________________________________ None ...........................................................................................................17
Q3 Do you have any long-term condition or illness that substantially interferes with your day to day activities? Yes .............................................................................................................1
............................................................................................. GO TO Q4 No .............................................................................................................2
............................................................................................. GO TO Q5
123

Q4 Thinking of these conditions and/or illnesses, would you describe yourself as
having…?
(READ OUT AND CODE ALL THAT APPLY) A physical disability.......................................................................................1 A mental or emotional health problem ..........................................................2 A long-term illness ........................................................................................3 Other/s (PLEASE SPECIFY) ........................................................................4 None of these ...............................................................................................5
And now, thinking about your experiences of health services.
Q5 Thinking about the past 12 months and your own health: (PUT A NUMBER IN EACH BOX. IF ‘NEVER’, WRITE IN ‘0’. IF DON’T KNOW, PROBE FOR ESTIMATE. IF CAN’T GIVE ESTIMATE, WRITE IN ‘DK’ REPEAT ‘PAST 12 MONTHS’ AND ‘YOUR OWN HEALTH’)
a) How many times have you seen a GP? ................................................................. b) How many times have you been to an accident and emergency department? ........................................................................................................... c) How many times have you visited a hospital out-patient department.....................
to see a doctor? (Do not include visits for an X-ray or other tests) d) How many times have you been admitted to hospital for either ............................
day surgery or an overnight stay? e) How many times have you been admitted to hospital for a stay of .......................
two nights or more?
f) How many times have you seen a dentist .....................................................
SHOWCARD B Q6 Thinking about your recent use and experience of the Health Services such as GP, dentist, or hospital, please rank the following statements on a scale from 1 (not at all) to 5 (definitely). (READ OUT AND CODE ONE FOR EACH) In general…
Not at all Definitely Don’t Know N/A
a) Were you given adequate information about your condition or treatment? .............................................. 1.......2 .....3 ..... 4 ..... 5 7 8
124

b) Were you encouraged
to participate in decisions affecting your health or treatment? ............................... 1 ......2 .....3 ..... 4 ..... 5 7 8
c) Did you feel that you
had a say in how these services were delivered? ............................................... 1 ......2 .....3 ..... 4 ..... 5 7 8
d) Did you feel that your
views and circumstances were understood and valued? ................................................... 1 ......2 .....3 ..... 4 ..... 5 7 8
e) Did you have any
problems understanding the advice given because of language difficulties? .......................... 1 ......2 .....3 ..... 4 ..... 5 7 8
f) Did you have any
problems getting your views across because of language difficulties? .......................... 1 ......2 .....3 ..... 4 ..... 5 7 8
SHOWCARD C Q7 Please rank the following statements on a scale from 1 (Great difficulty)
to 5 (No difficulty). (READ OUT AND CODE ONE FOR EACH)
Great No Don’t Not How much difficulty do you have… difficulty difficulty know applicable a) Arranging for a home
visit from your GP for yourself ................................................... 1.......2 .....3 ..... 4 ..... 5 7 8
b) Getting an appointment
to see your GP for yourself ................................................... 1.......2 .....3 ..... 4 ..... 5 7 8
c) Getting to the GP’s
surgery/Health Centre for yourself .................................. 1.......2 .....3 ..... 4 ..... 5 7 8 d) Accessing health
services in an emergency for yourself ........................... 1.......2 .....3 ..... 4 ..... 5 7 8
125

e) Obtaining an appointment at the hospital for yourself ................................ 1.......2 .....3 ..... 4 ..... 5 7 8
f) Getting appointments
with health professionals for family members? .............................................. 1.......2 .....3 ..... 4 ..... 5 7 8
f1) If experiencing difficulty,
please specify: family member(s) & health professional(s)................................................... ............. ............. ............................
Q8 What proportion of your teeth are your own?
(CROWNS ARE REGARDED AS ‘OWN TEETH’.) (READ OUT. CODE ONE ONLY) All of them...................................................................................................1 Some of them .............................................................................................2 None of them..............................................................................................3
Q9 When was the last time you went to the dentist?
(READ OUT. CODE ONE ONLY) Within the last 6 months .............................................................................1 Within 6 months to 15 months ....................................................................2 Over 15 months ..........................................................................................3
Q10 How often do you brush your teeth?
(CODE ONE ONLY)
Twice or more a day ...................................................................................1...................................................................................................................... About once a day........................................................................................2...................................................................................................................... Less than once a day .................................................................................3...................................................................................................................... Seldom or never .........................................................................................4......................................................................................................................
I would now like to ask you few questions concerned with tobacco and alcohol consumption.
Q11 How often are you usually in places where there is smoke from other
people smoking tobacco? Would you say most of the time, some of the time, seldom or never? (CODE ONE ONLY)
Most of the time ..........................................................................................1 Some of the time ........................................................................................2 Seldom .......................................................................................................3 Never ..........................................................................................................4
126

SHOWCARD D Q12 Which of the following statements best describes you at present?
(CODE ONE ONLY) I have never smoked tobacco.....................................................................1
.............................................................................................GO to Q13 I have only tried smoking once or twice......................................................2
.............................................................................................GO to Q13 I have given up smoking.............................................................................3
...........................................................................................GO to Q12a I smoke some days.....................................................................................4
...........................................................................................GO to Q12b I smoke every day ......................................................................................5
...........................................................................................GO to Q12c Q12a On average, how many cigarettes a day did you smoke?
(WRITE NUMBER OF CIGARETTES IN THE BOX) GO to Q13 (INCLUDE ROLL YOUR OWN; CODE AS ‘995’ IF THE PERSON ONLY SMOKES CIGARS / PIPE)
Q12b On average, how many cigarettes a week do you smoke? (WRITE NUMBER OF CIGARETTES IN THE BOX) GO to Q13 (INCLUDE ROLL YOUR OWN; CODE AS ‘995’ IF THE PERSON ONLY SMOKES CIGARS / PIPE)
Q12c On average, how many cigarettes a day do you smoke?
GO to Q13 (WRITE NUMBER OF CIGARETTES IN THE BOX) (INCLUDE ROLL YOUR OWN; CODE AS ‘995’ IF THE PERSON ONLY SMOKES CIGARS / PIPE)
Q13 Do you take tobacco in any other way apart from cigarettes or cigars?
Yes .............................................................................................................1......................................................................................... GO TO Q13a
No .............................................................................................................2........................................................................................... GO TO Q14
Q13a If YES, what ways do you take tobacco? ____________________________________
127

Q14 How often do you drink alcohol?
(READ OUT. CODE ONE ONLY)
Never........................................................................................................1........................................................................................GO to Q16
Less than once a month...........................................................................2........................................................................................GO to Q15
More than once a month but not weekly ..................................................3........................................................................................GO to Q15
1-2 days per week....................................................................................4........................................................................................GO to Q15
3-5 days per week....................................................................................5........................................................................................GO to Q15
6-7 days per week....................................................................................6........................................................................................GO to Q15
Q15 Have you had a drink containing alcohol in the past 7 days?
(CODE ONE ONLY)
Yes ........................................................................................................1......................................................................................GO to Q15a
No ........................................................................................................2........................................................................................GO to Q16
128

SHOWCARD E Q15a Using the card, please tell me how much alcohol you drank on each day
in the past week. (START WITH THE PREVIOUS DAY AND WORK BACK THROUGH THE WEEK, RECORD HALF PINTS AS WELL AS PINTS)
Mon Tue Wed Thurs Fri Sat Sun
Normal strength beer/lager/stout/cider (eg McEwan’s lager, heavy) Pints Cans Bottles
Strong beer/lager/cider (eg Guinness, Murphy’s, Budweiser) Pints Cans Bottles
Extra strong beer/lager/ cider (eg Tennant’s super lager) Pints Cans Bottles Single measures of spirits (eg whisky, gin, vodka) (a bottle contains 28 measures)
Single measures of Martini/sherry/buckfast/Mad Dog 20/20 (a bottle contains 14 measures)
Glasses of wine at pub or restaurant Small glass Large glass
Bottles of wine at home ¼ bottle ½ bottle Full bottle Bottles of alcoholic carbonate (alcopops, such as Smirnoff Ice and Bacardi Breezer)
Other (please describe)
None on that day Q 16 Now I’d like to ask you some questions about the food you eat. Q16 On average, how many portions of fruit do you eat EACH DAY?
Examples of a portion are one apple, one tomato, 2 tablespoons canned fruit, one small glass fruit juice. (WRITE NUMBER IN BOX. IF LESS THAN ONE, WRITE ‘0’)
Q17 On average, how many portions of vegetables or salad (not counting
potatoes) do you eat EACH DAY? A portion of vegetables is 2 tablespoons.
(WRITE NUMBER IN BOX. IF LESS THAN ONE, WRITE ‘0’)
129

Q18 How many slices of bread or rolls do you usually eat PER DAY? (Please
include the bread taken in sandwiches, and other breads such as chapattis & naan).)
(WRITE NUMBER IN BOX) Q19 How often PER DAY do you usually eat items such as cakes, pastries,
chocolate, biscuits and crisps? (WRITE NUMBER IN BOX. IF LESS THAN ONE, WRITE ‘0’)
Q20 What types of sweets and snacks do you usually eat?
……………………………………………………………………………………………………………………..
…………………………………………………………………………………………………………………….. (NOTE Q21-Q23 refer to the amount per week) Q21 How many times PER WEEK do you usually eat breakfast cereal?
(WRITE NUMBER IN BOX) Q22 How often PER WEEK do you usually eat oily fish, taken in sandwiches
or as part of a meal? (e.g. kipper, herring, salmon, trout, mackerel, tuna, sardines or pilchards.) (WRITE NUMBER IN BOX)
Q23 Do you know your approximate weight?
Yes .............................................................................................................1................................................................................................ GO TO Q23a No...............................................................................................................2.................................................................................................. GO TO Q24
Q23a What is your weight? (WRITE IN WEIGHT IN STONES/POUNDS OR KILOGRAMS) Stones Pounds Or
Kilograms Q24 Do you know your height?
Yes .............................................................................................................1................................................................................................ GO TO Q24a No...............................................................................................................2.................................................................................................. GO TO Q25
130

Q24a What is your height?
(WRITE IN HEIGHT IN FEET/INCHES OR CENTIMETRES) Feet Inches Or
Centimetres Q25 Thinking now of the exercise you take. In an average week, on how
many days do you take at least 30 minutes of moderate physical exercise such as brisk walking? It doesn’t have to be 30 minutes all at once. (WRITE NUMBER OF DAYS IN BOX)
Q26 In an average week, on how many days do you spend at least 20
continuous minutes doing vigorous exercise (enough to make you sweaty and out of breath)?
(WRITE NUMBER OF DAYS IN BOX) SHOWCARD F Q27 Looking at the faces on the card: a. Which face best rates your overall quality of life?................................ (WRITE LETTER IN BOX) b. Which face best rates your general physical well being?.................... (WRITE LETTER IN BOX) c. Which face best rates your general mental or emotional well being? (WRITE LETTER IN BOX) SHOWCARD H Q28 Using the statements on this card, please indicate how often you have
felt or thought a certain way during the last four weeks.
0 1 2 3 4 never almost sometimes fairly very never often often In the last four weeks, how often have you…
Statement Rating (1) felt that you were unable to control the important things in your life?
(2) felt confident about your ability to handle your personal problems?
(3) felt that things were going your way?
(4) felt difficulties were piling up so high that you could not overcome them
131

SECTION 2 – COMMUNITY INVOLVEMENT Now I’d like to ask about your general activities. Q29 What do you usually do in your spare time? …………………………………………………………………………………………………………………….. ……………………………………………………………………………………………… Q30 Are you a member of any community groups?
Yes .............................................................................................................1.................................................................................................. GO TO Q31 No...............................................................................................................2.................................................................................................. GO TO Q32
Q31 What community groups are you a member of?
……………………………………………………………………………………………………………………..
…………………………………………………………………………………………………………………….. Q32 Do you act as a volunteer? (CODE ONE ONLY) Yes ............................................................................................................ 1
................................................................................................ GO TO Q32a No ...............................................................................................................2
.................................................................................................. GO TO Q33 Q32a If Yes, give details
……………………………………………………………………… SECTION 3 – HOME AND ENVIRONMENT Q33 Do you have access to the Internet? (CODE ONE ONLY) Yes ............................................................................................................ 1
................................................................................................ GO TO Q33a No .............................................................................................................. 2
.................................................................................................. GO TO Q34
132

Q33a Where do you have access to the internet? (CODE ONE ONLY) Home......................................................................................................... 1 Other...........................................................................................................2 Both ........................................................................................................... 3 If other, please specify: ________________________________________________ Q34 In your opinion, is there anything about your home that affects your
health?
Yes ............................................................................................................ 1
................................................................................................ GO TO Q34a No ...............................................................................................................2
.................................................................................................. GO TO Q35 Q34a Please give details of what about your home affects your health?
…………………………………………………………………………………………………………………….. SHOWCARD I Q35 On a scale from 1 (Strongly disagree) to 5 (Strongly agree), how much
do you agree or disagree with the following statements about living in this local area? (READ OUT AND CODE ONE FOR EACH)
Strongly Strongly Disagree Agree
a. I feel I belong to my local
area. ....................................................... 1.......2 .....3 ..... 4 ..... 5
b. The friendships and associations I have in my local area with other people mean a lot to me........................................................... 1.......2 .....3 ..... 4 ..... 5
c. I can trust people in my
local area ............................................... 1.......2 .....3 ..... 4 ..... 5
d. If I have a problem, there is always someone to help me................................................... 1.......2 .....3 ..... 4 ..... 5
Q36 How many close friends would you say you have?
133

Q37 On a scale from 1 (none of them) to 10 (all of them), how many of your
close friends are from the same ethnic background as yourself? (CIRCLE NUMBER)
None of them All of them
1 2 3 4 5 6 7 8 9 10 Q38 Do you ever feel isolated from family and friends?
(CODE ONE ONLY) Yes ........................................................................................................1 No ........................................................................................................2
Q38a Do you feel in control of decisions that affect your life, such as
planning your budget, moving house or changing job? (CODE ONE ONLY)
Definitely ....................................................................................... 1 To some extent ............................................................................. 2 No .............................................................................................. 3
SHOWCARD J Q39 Please look at Showcard J and let me know the number that
corresponds to your answer to the following statements. 1 2 3 4 5 6 7
Almost never Sometimes Very often
Statement Rating
1. How often are you treated with less courtesy because of your ethnic background?
2. How often are you treated with less respect because of your ethnic background?
3. How often do you receive worse service because of your ethnic background?
4. How often do people act as if they think you are not clever because of your ethnic background?
5. How often do people act as if they are afraid of you because of your ethnic background?
6. How often do people act as if you are dishonest because of your ethnic background?
7. How often do people act as if they are better than you because of your ethnic background?
8. How often are you called names or insulted because of your ethnic background?
9. How often are you threatened or harassed because of your ethnic background?
134

Q39a Please indicate if any of the following events below have occurred to you. (TICK THE CORRECT RESPONSE)
Statement YES NO
1. Have you ever been fired or denied a promotion because of your ethnic background?
2. Have you ever not been hired because of your ethnic background?
3. Have you ever been treated unfairly by police because of your ethnic background?
4. Have you ever been discouraged from seeking further education because of your ethnic background?
5. Have you ever been discouraged from seeking a job because of your ethnic background?
6. Has a landlord or estate agent ever refused to sell or rent to you because of your ethnic background?
7. Have neighbours ever made life difficult because of your ethnic background?
SHOWCARD K Q40 Thinking about safety in your local area, on a scale from 1 (Strongly
disagree) to 5 (Strongly agree), please rank how much you disagree or agree with the following statements? (READ OUT AND CODE ONE FOR EACH)
Strongly Strongly Disagree Agree
a. I feel safe using public transport in my local area................................................................ 1 ............ 2 .............3 ............4 ............ 5
b. I feel safe walking alone around my local area even after dark....................................... 1 ............ 2 .............3 ............4 ............ 5
c. I feel safe in my own home.............................................................. 1 ............ 2 .............3 ............4 ............ 5
SECTION 4 – ABOUT YOU SHOWCARD L
Q41 What level of education have you achieved? (ASK FOR AND CODE HIGHEST) Primary education................................................................................................1 Secondary education...........................................................................................2 Further education (e.g. college)...........................................................................3 Higher education (university)...............................................................................4 No formal education ...........................................................................................5
Do you have any trade-related apprenticeships,
professional qualifications, etc? (If so, specify) 6
135

Q42 Greater Glasgow NHS Board is reviewing the information it provides on
health issues. Do you need any information on the following? (READ OUT & CODE ALL THAT APPLY) Accident prevention ...........................1 Addictions ..........................................2 Cancer ...............................................3 Child health........................................4 Dental health .....................................5 Heart health .......................................6 Mental health .....................................7 Men’s health ......................................8 Nutrition .............................................9 Physical activity ................................10 Sexual health....................................11 Smoking............................................12 Women’s health................................13 Young people’s health ......................14 None of these ................................... 15 GO TO Q43 if none Do you need information about anything not mentioned here? If so, please specify: _____________________________________________________________
Q42a In which language would you like the information?
…………………………………………………………………………………………………………………….. Q42b In what format would you prefer the information?
(READ OUT & CODE ALL THAT APPLY)
Leaflet................................................1 Poster ................................................2 Booklet...............................................3 Video .................................................4 Audiotape ..........................................5 Talks/seminars ..................................6 Website/internet.................................7 Other..................................................8
Q42c Where or how would you like to receive this information (for example,
supermarket, surgery, community centre, etc)? ………………………………………………………………………………… ………………………………………………………………………………….
136

Q43 Which of the following languages do you a) speak b) class as your first
spoken language? a) languages spoken b) first spoken
language Urdu.............................................................. 1 .......................................... 1 Punjabi.......................................................... 2 .......................................... 2 Hindi ............................................................. 3 .......................................... 3 Yoruba .......................................................... 4............................................4 Swahili .......................................................... 5 .......................................... 5 French .......................................................... 6 .......................................... 6 English.......................................................... 7............................................7 Other(s) (please specify below) [INDICATE IF (a) or (b)] (a)___________________________________________________________ (b)___________________________________________________________
Q44 On a scale of 1 to 10 with 1 being very poor and 10 being very well, how well would you say you a) speak English, b) write English and c) read English?
very poor very well
a) speak English 1 2 3 4 5 6 7 8 9 10 b) write English 1 2 3 4 5 6 7 8 9 10 c) read English 1 2 3 4 5 6 7 8 9 10
SHOWCARD M Q45 Using this card, please tell me how much of a problem would it be if you
had to pay an unexpected bill (for example, for a household repair) of £20? or £100? or £1000? (READ OUT AND CODE ONE FOR EACH)
Impossible A big A bit of a No to find problem problem problem
D/K a. £20......................................................... 1 ............ 2 .............3 ............4 ............ 5 b. £100....................................................... 1 ............ 2 .............3 ............4 ............ 5 c. £1,000.................................................... 1 ............ 2 .............3 ............4 ............ 5
137

Q46 What proportion of your household income comes from state benefits? (READ OUT & CODE ONE ONLY)
None ........................................................................................................1
........................................................................................GO to Q48 Very little.....................................................................................................2
........................................................................................GO to Q47 About a quarter...........................................................................................3
........................................................................................GO to Q47 About a half ................................................................................................4
........................................................................................GO to Q47 About three quarters...................................................................................5
........................................................................................GO to Q47 All ........................................................................................................6
........................................................................................GO to Q47 Don’t know..................................................................................................7
........................................................................................GO to Q47
Q47 Are you or any member of your household in receipt of each of the following?
(READ OUT & CODE ALL THAT APPLY) Job seekers allowance (JSA) .....................................................................1 Income support...........................................................................................2 Disability-related benefits ...........................................................................3 Housing benefits.........................................................................................4 Child tax credit............................................................................................5 Working tax credit.......................................................................................6 Disabled person’s tax credit .......................................................................7 Retirement pension ....................................................................................8 Attendance allowance ................................................................................9 Other pension ...........................................................................................10 Other (PLEASE WRITE IN) ......................................................................11 __________________________________________________________
Q48 Are there any children under 14 in your household?
Yes, mine................................................................................................... 1
...................................................................................... GO TO Q49 Yes, others ................................................................................................ 1
...................................................................................... GO TO Q49 No ....................................................................................................... 2
...................................................................................... GO TO Q51 Q49 Are you responsible for the children under 14 in your household?
(CODE ONE ONLY) Yes ....................................................................................................... 1
...................................................................................... GO TO Q50 No ....................................................................................................... 2
...................................................................................... GO TO Q51
138

Q50 Do you use any form of childcare (paid or unpaid)? (CODE ONE ONLY)
Yes ....................................................................................................... 1 No ....................................................................................................... 2
Q51 Apart from work, are you responsible for caring for someone on a day to
day basis? e.g. a disabled child, elderly person, etc. (Do not include ‘ordinary’
childcare). Yes ........................................................................................................1
...................................................................................... GO TO Q52 No ........................................................................................................2
...................................................................................... GO TO Q53 Q52 On average, how many hours per day do you spend looking after this
person(s)? (WRITE NUMBER OF HOURS IN BOX)
Q53 Can you tell me which of these descriptions applies to you?
CODE ONE ONLY
Married .......................................................................................................1 Cohabiting/living with partner .....................................................................2 Single/never married ..................................................................................3 Widowed.....................................................................................................4 Divorced .....................................................................................................5 Separated ...................................................................................................6
Q54 Were you born in the UK?
Yes ............................................................................................................ 1 No .............................................................................................................. 2 Q55 How long have you lived in the Greater Glasgow area?
(WRITE IN YEARS AND/OR MONTHS) Years Months Q56 Are you seeking asylum? Yes ............................................................................................................ 1 No .............................................................................................................. 2 Q57 On a scale from 1 (Not at all) to 10 (Very much), how Scottish / British do you feel?
Not at all Very much
1 2 3 4 5 6 7 8 9 10
139

Q58 On a scale from 1 (Not at all) to 10 (Very much), how (ETHNIC
BACKGROUND) do you feel?
Not at all Very much
1 2 3 4 5 6 7 8 9 10
Q59 What nationality (or nationalities) are you?
…………………………………………………………………………………………………………………….. Q60 INTERVIEWER: Please record the appropriate details in the first row to
tell us about the respondent. Then record details for each other member in the household (including children). Record the gender, age and working status for each. (Please provide details of ALL members of the household in the grid below. Remember to give respondent's details first.) [TICK MAIN WAGE EARNER]
A B C D E F
Gender Household members
M F
Write in actual
age
Working status
See codes D below
Industry sector See codes E below
Main Wage Earner (TICK)
Respondent 1 2 1 1 2 2 1 2 3 1 2 4 1 2 5 1 2 6 1 2 7 1 2 8 1 2 9 1 2
10 1 2 11 1 2
140

D Which of these apply to you and the main wage earner? Enter code under Column D – WORKING STATUS
[IF CURRENTLY OFF WORK OR ON MATERNITY LEAVE, CODE AS EMPLOYED FULL- OR PART-TIME. WRITE ‘MWE’ BEHIND DETAILS OF MAIN WAGE EARNER.]
Employed full-time ........................................................... ......................................1 Employed part-time.......................................................... ......................................2 Unemployed for less than
six months ............................................................. ......................................3 Unemployed for more than
six months ............................................................. ......................................4 Unable to work due to illness or disability ............................................................ ......................................5 Retired ............................................................................. ......................................6 Looking after home/family................................................ ......................................7 In full-time
education/training .................................................. ......................................8 In part-time
education/training .................................................. ......................................9
141

E What industries do the respondent and major wage earner work for? (WRITE ‘MWE’ BEHIND DETAILS OF MAIN WAGE EARNER)
Manufacturing and mining ..........................................................................1 Construction............................................................................................................2 Transport.................................................................................................................3 Health service .........................................................................................................4 Local or national government ................................................................................5 Service industries (e.g. banking, insurance, travel,
entertainment) ..............................................................................................6 Retail services.........................................................................................................7 Catering/food preparation .......................................................................................8 Professional services (e.g. teaching, legal, surveying
services) .......................................................................................................9 Voluntary or community sector .............................................................................10
Not applicable ......................................................................................................11 Other (PLEASE WRITE IN) ........................................................... 12
_____________________________________________________
CLOSE INTERVIEW BY READING OUT STATEMENT:
"Thank you very much for your help. Can I assure you once again that the information you have given will be treated as absolutely confidential as stated
on the information sheet"
142