the hartford’s second quarter financial results
TRANSCRIPT

1Copyright © 2021 by The Hartford. All rights reserved. No part of this document may be reproduced, published or posted without the permission of The Hartford
THE HARTFORD’S SECOND QUARTER FINANCIAL RESULTS
The Hartford Financial Services Group, Inc.
July 28, 2021

Copyright © 2021 by The Hartford. All rights reserved. No part of this document may be reproduced, published or posted without the permission of The Hartford 2
Safe harbor statement
Certain statements made in this presentation should be considered forward-looking statements as defined in the
Private Securities Litigation Reform Act of 1995. These include statements about The Hartford’s future results of
operations. We caution investors that these forward-looking statements are not guarantees of future performance,
and actual results may differ materially. Investors should consider the important risks and uncertainties that may
cause actual results to differ, including those discussed in The Hartford’s news release issued on July 28, 2021,
The Hartford's Quarterly Reports on Form 10-Q, The Hartford’s 2020 Annual Report on Form 10-K, and other filings
we make with the U.S. Securities and Exchange Commission. We assume no obligation to update this
presentation, which speaks as of today’s date.
The discussion in this presentation of The Hartford’s financial performance includes financial measures that are not
derived from generally accepted accounting principles (GAAP). Information regarding these non-GAAP financial
measures, including reconciliations to the most directly comparable GAAP financial measures, is provided in the
news release issued on July 28, 2021 and The Hartford’s Investor Financial Supplement for second quarter 2021
which is available at the Investor Relations section of The Hartford’s website at https://ir.thehartford.com.
From time to time, The Hartford may use its website and/or social media outlets, such as Twitter and Facebook, to
disseminate material company information. Financial and other important information regarding The Hartford is
routinely accessible through and posted on our website at https://ir.thehartford.com, Twitter account at
www.twitter.com/thehartford_pr and Facebook at https://facebook.com/thehartford. In addition, you may
automatically receive email alerts and other information about The Hartford when you enroll your email address by
visiting the “Email Alerts” section at https://ir.thehartford.com.

Copyright © 2021 by The Hartford. All rights reserved. No part of this document may be reproduced, published or posted without the permission of The HartfordCopyright © 2021 by The Hartford. All rights reserved. No part of this document may be reproduced, published or posted without the permission of The Hartford 3
Growth: ▪ P&C top line net written premium growth of 12% including 15% in
Commercial Lines
Margin expansion: ▪ P&C underlying margin expansion was driven by 3.7 point
improvement in Commercial Lines ex COVID-19
▪ Group Benefits core earnings margin was 9.5%, with 1.0 point of
COVID-19 related impacts, including 1.3 points of excess
mortality
Capital management: ▪ Proactive capital management – repurchased $568 million of
shares in 2Q21 and $691 million year-to-date
Industry leading returns: ▪ 13.1% core earnings return on equity (ROE)1,3
6.7%
11.6%
13.6%12.7% 13.1%
2017 2018 2019 2020 2Q 21
Core ROE
1. Denotes financial measure not calculated based on GAAP
2. Accumulated other comprehensive income
3. ROE based on trailing 12-month average equity, ex. AOCI and trailing 12-month core operating earnings
Second Quarter 2021 – Strong Execution
The Hartford Delivered. . .
$35.29$39.40
$43.71$47.16 $49.01
2017 2018 2019 2020 2Q 21
Book Value Per Diluted Share(ex AOCI)1
Delivering enhanced value for stakeholders

Copyright © 2021 by The Hartford. All rights reserved. No part of this document may be reproduced, published or posted without the permission of The Hartford 4Copyright © 2021 by The Hartford. All rights reserved. No part of this document may be reproduced, published or posted without the permission of The Hartford
2Q21 Core earnings1 of $836 million, EPS1,2 of $2.33, ROE1,3 of 13.1%
Core Earnings By Segment($ in millions, except per share amounts)
2Q20 2Q21 Change
Commercial Lines $(57) $560 NM
Personal Lines 364 113 (69)%
P&C Other Operations 2 15 NM
Property & Casualty Total 309 688 123%
Group Benefits 102 149 46%
Hartford Funds 33 51 55%
Sub-total 444 888 100%
Corporate (6) (52) NM
Core earnings 438 836 91%
Net realized capital gains (losses), before tax 107 148 38%
Integration and other non-recurring M&A costs, before tax (13) (36) (177)%
Change in deferred gain on retroactive reinsurance, before tax (54) (39) 28%
Income tax benefit (expense) (15) (9) 40%
Net income available to common stockholders 463 900 94%
Preferred stock dividends 5 5 —%
Net Income 468 905 93%
Core earnings per diluted share $1.22 $2.33 91%
Net income available to common stockholders per diluted share $1.29 $2.51 95%
Wtd. avg. diluted shares outstanding 359.3 358.5 —%
Wtd. avg. common shares outstanding 358.1 353.7 (1)%
Book value per diluted share $46.59 $50.62 9%
Book value per diluted share (excluding AOCI)1 $45.25 $49.01 8%
1. Denotes financial measure not calculated based on GAAP, 2. Earnings per diluted share (EPS), 3. Return on Equity (ROE) based on 12 month Average Equity and Core Earnings

Copyright © 2021 by The Hartford. All rights reserved. No part of this document may be reproduced, published or posted without the permission of The Hartford 5Copyright © 2021 by The Hartford. All rights reserved. No part of this document may be reproduced, published or posted without the permission of The Hartford
2Q21 Core earnings1 of $836 million, EPS1,2 of $2.33, ROE1,3 of 13.1%
1. Denotes financial measure not calculated based on GAAP, 2. Earnings per diluted share (EPS), 3. Return on Equity (ROE) based on 12 month Average Equity and Core Earnings
Commercial Lines core earnings of $560 million were up $617 million compared to a core loss of $57 million in 2Q20
◦ $210 million, before tax, decrease in COVID-19 incurred losses with $3 million, before tax, of COVID-19 losses in 2Q21 compared to $213 million in
2Q20
◦ Favorable prior accident year development (PYD) within core earnings of $144 million, before tax, in 2Q21 compared to $23 million of unfavorable
PYD in 2Q20
◦ Current accident year (CAY) catastrophe (CAT) losses of $93 million, before tax, were $100 million lower than 2Q20, which included $110 million
from civil unrest losses
◦ Net investment income of $382 million, before tax, compared with $204 million in 2Q20, including higher returns on limited partnership and
alternative investments (LPs)
◦ Underlying combined ratio1 of 89.4 improved 13.5 points from 102.9 in 2Q20 primarily due to:
(+) Lower incurred COVID-19 losses of $3 million, before tax, or 0.1 points, compared with $213 million, or 9.9 points in 2Q20
(+) Expense ratio reduction of 2.3 points to 32.0 primarily related to earned premium growth, lower provision for doubtful accounts and Hartford
Next reduction initiatives
Personal Lines core earnings of $113 million decreased $251 million from $364 million in 2Q20
◦ Favorable PYD of $44 million, before tax, compared with $349 million favorable PYD in 2Q20
◦ Underlying underwriting gain1 of $87 million compared with $134 million in 2Q20, largely due to increasing auto claim frequency
◦ Underlying combined ratio of 88.2 was 7.5 points higher than 80.7 in 2Q20 primarily due to:
(-) Higher auto frequency as miles driven have increased
(-) Higher non-CAT property losses that were driven by higher severity from a greater number of large losses and higher building costs, partially
offset by lower claim frequency
(+) Expense ratio of 27.6 improved 1.8 points compared with 29.4 in 2Q20
◦ CAY CATs of $35 million, before tax, decreased $20 million from $55 million in 2Q20
◦ Net investment income of $40 million, before tax, in 2Q21 compared with $28 million in 2Q20 and included higher returns on LPs
Group Benefits core earnings of $149 million increased from $102 million in 2Q20 resulting from:
(+) Net investment income of $136 million, before tax, that increased from $92 million in 2Q20
(+) Lower excess mortality of $25 million, before tax, compared with $45 million, before tax, in 2Q20
Net investment income of $581 million, before tax, compared to $339 million, before tax, in 2Q20, driven primarily by higher returns on LPs
Corporate core loss of $52 million compared to a loss of $6 million in 2Q20 primarily due to:
(-) $68 million, before tax, income in 2Q20 on the company's 9.7% retained interest in Talcott Resolution
(+) Lower operating costs and other expenses
Core earnings of $836 million, or $2.33 per diluted share, compared to $438 million in 2Q20
Core earnings ROE was 13.1% in 2Q21 compared with 12.7% in 2Q20

Copyright © 2021 by The Hartford. All rights reserved. No part of this document may be reproduced, published or posted without the permission of The Hartford 6
• Core earnings of $149 million increased 46% from $102 million in 2Q20 reflecting an increase in net investment income and lower excess mortality
• Total loss ratio of 71.4% compared with 72.0% in 2Q20 driven by a 1.5 point decrease in excess mortality partially offset by less favorable short-term disability incidence
• Core earnings margin1 of 9.5% increased 2.6 points from 6.9% in 2Q20
• Written premiums of $2.5 billion increased 15% compared with 2Q20 reflecting an increase in new business across each line and
continued strong renewal written pricing increases in Middle Market and Global Specialty as well as higher audit and
endorsement premiums
• Small Commercial underlying combined ratio of 87.0 improved 5.9 points from 2Q20 driven primarily by COVID-19 incurred
losses in 2Q20 of 4.1 points and a lower expense ratio in 2Q21, partially offset by higher non-CAT property losses before
COVID-19
• Middle & Large Commercial underlying combined ratio of 91.5 improved 21.4 points from 2Q20 primarily due to COVID-19
incurred losses in 2Q20 of 14.6 points, a lower expense ratio, and lower ex-COVID-19 CAY loss ratios before CATs in general
liability and workers' comp, partially offset by higher non-CAT property losses driven, in part, by higher building costs
• Global Specialty underlying combined ratio of 90.3 improved by 15.2 points compared with 105.5 in 2Q20 due to COVID-19
incurred losses of 13.0 points in 2Q20 compared with 0.4 points in 2Q21, a lower expense ratio and lower ex-COVID-19 CAY
loss ratios before CATs in wholesale, US financial lines and Global Re
• Written premiums of $760 million increased from $738 million in 2Q20 primarily due to the effect of $81 million, before tax, in
premium refunds issued in 2Q20 and renewal written price increases of 8.6% in homeowners in 2Q21, partially offset by the
effect of non-renewed premium exceeding new business
• The auto underlying combined ratio of 92.1 increased 5.8 points over 2Q20 primarily due to increasing auto frequency resulting
from an increase in miles driven
• The homeowners underlying combined ratio of 79.2 increased 9.1 points from 2Q20 primarily due to higher non-CAT property
losses that were driven by higher severity from a greater number of large losses and higher building costs, partially offset by
lower claim frequency
• Written premiums of $3.3 billion increased 12% compared with 2Q20
• Combined ratio of 88.5 in 2Q21, improved 8.4 points from 96.9 in 2Q20 mostly due to lower COVID-19 incurred losses, higher
earned premiums and lower CAY CATs, partially offset by less favorable PYD
• Underlying combined ratio of 89.2 improved 8.4 points compared with 97.6 in 2Q20 due to a significantly lower impact from
COVID-19 losses in Commercial Lines and a 2.2 point decrease in the P&C expense ratio to 31.0, partially offset by higher
personal auto claim frequency
2Q21 Key Business Highlights and Drivers
Personal Lines
Property & Casualty
Commercial Lines
Small Commercial
Middle & Large Commercial
Global Specialty
Group Benefits
1. Denotes financial measure not calculated based on GAAP
Copyright © 2021 by The Hartford. All rights reserved. No part of this document may be reproduced, published or posted without the permission of The Hartford 7
Small Commercial Middle & Large Commercial Global Specialty
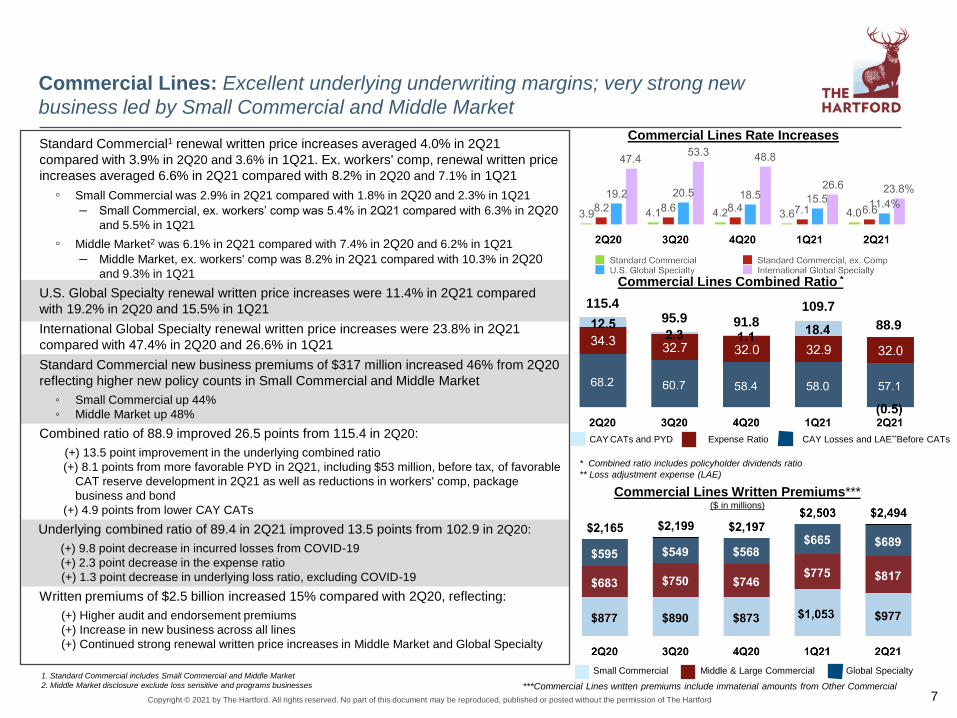
Commercial Lines: Excellent underlying underwriting margins; very strong new
business led by Small Commercial and Middle Market
* Combined ratio includes policyholder dividends ratio
** Loss adjustment expense (LAE)
CAY CATs and PYD Expense Ratio CAY Losses and LAE**Before CATs
Commercial Lines Combined Ratio *
1. Standard Commercial includes Small Commercial and Middle Market
2. Middle Market disclosure exclude loss sensitive and programs businesses
Commercial Lines Written Premiums***($ in millions)
***Commercial Lines written premiums include immaterial amounts from Other Commercial
Commercial Lines Rate Increases
115.495.9 91.8
109.7
88.9
Standard Commercial1 renewal written price increases averaged 4.0% in 2Q21
compared with 3.9% in 2Q20 and 3.6% in 1Q21. Ex. workers' comp, renewal written price
increases averaged 6.6% in 2Q21 compared with 8.2% in 2Q20 and 7.1% in 1Q21
◦ Small Commercial was 2.9% in 2Q21 compared with 1.8% in 2Q20 and 2.3% in 1Q21
– Small Commercial, ex. workers’ comp was 5.4% in 2Q21 compared with 6.3% in 2Q20and 5.5% in 1Q21
◦ Middle Market2 was 6.1% in 2Q21 compared with 7.4% in 2Q20 and 6.2% in 1Q21
– Middle Market, ex. workers' comp was 8.2% in 2Q21 compared with 10.3% in 2Q20and 9.3% in 1Q21
U.S. Global Specialty renewal written price increases were 11.4% in 2Q21 compared
with 19.2% in 2Q20 and 15.5% in 1Q21
International Global Specialty renewal written price increases were 23.8% in 2Q21
compared with 47.4% in 2Q20 and 26.6% in 1Q21
Standard Commercial new business premiums of $317 million increased 46% from 2Q20
reflecting higher new policy counts in Small Commercial and Middle Market
◦ Small Commercial up 44%
◦ Middle Market up 48%
Combined ratio of 88.9 improved 26.5 points from 115.4 in 2Q20:
(+) 13.5 point improvement in the underlying combined ratio
(+) 8.1 points from more favorable PYD in 2Q21, including $53 million, before tax, of favorable
CAT reserve development in 2Q21 as well as reductions in workers' comp, package
business and bond
(+) 4.9 points from lower CAY CATs
Underlying combined ratio of 89.4 in 2Q21 improved 13.5 points from 102.9 in 2Q20:
(+) 9.8 point decrease in incurred losses from COVID-19
(+) 2.3 point decrease in the expense ratio
(+) 1.3 point decrease in underlying loss ratio, excluding COVID-19
Written premiums of $2.5 billion increased 15% compared with 2Q20, reflecting:
(+) Higher audit and endorsement premiums
(+) Increase in new business across all lines
(+) Continued strong renewal written price increases in Middle Market and Global Specialty

Copyright © 2021 by The Hartford. All rights reserved. No part of this document may be reproduced, published or posted without the permission of The Hartford 8
Renewal written price increases of:
• 2.3% in auto versus 2.5% in 2Q20 and 1.8% in 1Q21
• 8.6% in homeowners versus 5.1% in 2Q20 and 9.4% in 1Q21
Combined ratio of 87.0 in 2Q21, increased 48.7 points from 38.3 in 2Q20, driven
by:
(-) 44.3 point impact from lower net favorable PYD as 2Q20 benefited from a
48.0 point reduction in prior year CAT reserves, including a $260 million,
before tax, subrogation benefit from PG&E for 2017 and 2018 wildfires
(-) 7.5 point impact from a higher underlying combined ratio
(+) 3.2 point favorable impact from lower CAY CATs
Underlying combined ratio of 88.2 increased 7.5 points compared to 80.7 in 2Q20
due to:
• (-) 6.2 point impact from increase in auto driven by higher claims frequency
from increased miles driven
(-) 2.7 point impact from an increase in non-CAT property losses in
homeowners driven by higher severity from a greater number of large losses
and higher building costs, partially offset by lower claim frequency
• (+) Expense ratio of 27.6% in 2Q21 compared to 29.4% in 1Q20
Written premiums of $760 million increased from $738 million in 2Q20 primarily
due to the effect of $81 million, before tax, in premium refunds in 2Q20, partially
offset by non-renewed premium exceeding new business in auto and homeowners
• New business premiums of $72 million in 2Q21 compared to $83 million in
2Q20, with reductions in both auto and homeowners
• Policy count retention was 85% in both auto and homeowners, up from 84%
in 2Q20
Core earnings of $113 million compared to $364 million in 2Q20, driven by:
• (-) Less favorable PYD
• (-) Lower underlying underwriting gain of $87 million compared to $134
million in 2Q20 primarily as a result of increasing auto claim frequency
(+) Lower CAY CATs in both auto and homeowners
(+) Higher net investment income, increasing to $40 million, before tax
Personal Lines: Underlying results remain strong; auto claim frequency increased
with miles driven
Written Premiums($ in millions)
Personal Lines Combined Ratio
CAY CATs and PYD Expense Ratio CAY Losses and LAE Before CATs
Personal Lines Written Price Increases
Homeowners Auto
38.3
93.3
79.887.0
83.1

Copyright © 2021 by The Hartford. All rights reserved. No part of this document may be reproduced, published or posted without the permission of The Hartford 9
Core earnings of $149 million compared to core earnings of $102 million in
2Q20 due to:
• (+) Increase in net investment income
(+) Lower excess mortality related to COVID-19
(+) Lower expense ratio
(-) Higher disability loss ratio of 64.2%
Core earnings margin was 9.5%, compared to 6.9% in 2Q20 and (0.2)% in
1Q21
• Excluding incurred loss from excess mortality related to COVID-19,
core earnings margin was 10.8%
Loss ratio of 71.4% compared to 72.0% in 2Q20:
• Group life loss ratio decreased 2.3 points to 83.6% in 2Q21 due to a
3.3 point decrease in excess mortality losses
• Group disability loss ratio of 64.2% increased 1.6 points from 62.6% in
2Q20 due to less favorable short-term disability claim incidence as the
prior year was favorably impacted by fewer elective procedures during
the onset of the pandemic
2Q21 expense ratio of 25.1% improved 0.5 points from 25.6% in 2Q20 due
to an increase in the allowance for uncollectible premium in the prior year
period, the effects of an increase in fully insured ongoing premiums and
expense savings from Hartford Next, partially offset by higher incentive
compensation and increased claims costs to handle the volume of excess
mortality claims
Fully insured ongoing premiums were up 2% compared to 2Q20, due to an
increase in exposure on existing accounts as customers emerge from the
pandemic as well as strong persistency and sales
Fully insured ongoing sales of $99 million in 2Q21 were down 34% from
$149 million in 2Q20 as prior year sales had 2 large customer sales
Core Earnings and Core Earnings Margin*($ in millions)
Group Benefits: Strong core margin of 9.5% in 2Q21
* Includes amortization of intangibles, after tax, of $7 million, $8 million, $8 million, $8
million, and $8 million in 2Q20, 3Q20, 4Q20, 1Q21 and 2Q21 respectively
Fully Insured Ongoing Premiums1 & Loss Ratio($ in millions)
1. Excludes buyout premiums
Core Earnings Core Earnings Margin
$(3)
(0.2)%
Copyright © 2021 by The Hartford. All rights reserved. No part of this document may be reproduced, published or posted without the permission of The Hartford 10
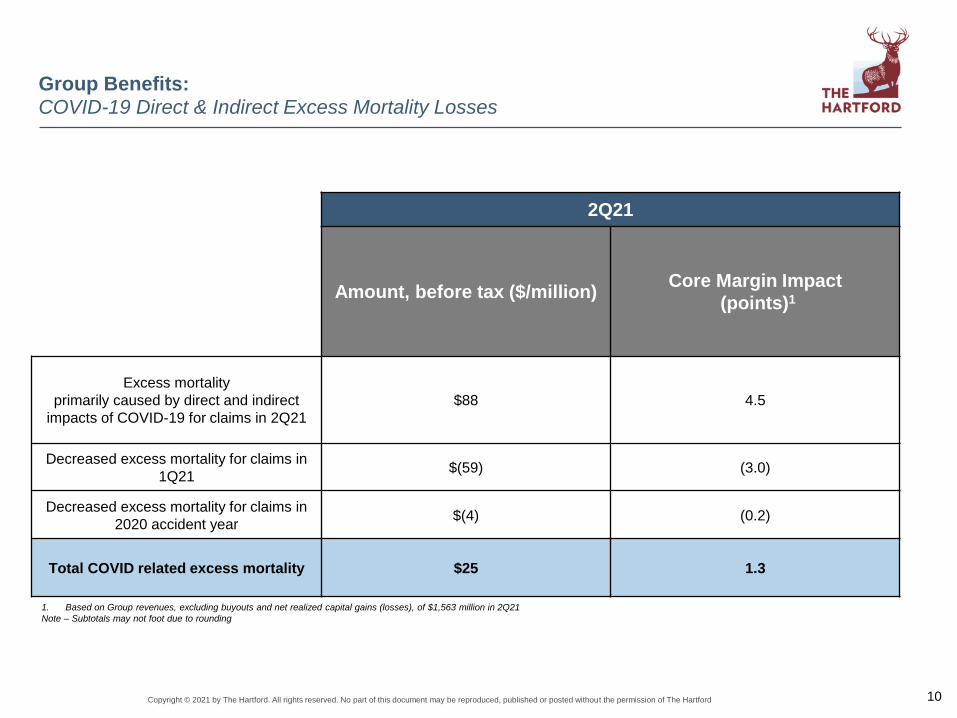
Group Benefits:COVID-19 Direct & Indirect Excess Mortality Losses
2Q21
Amount, before tax ($/million)Core Margin Impact
(points)1
Excess mortality
primarily caused by direct and indirect
impacts of COVID-19 for claims in 2Q21
$88 4.5
Decreased excess mortality for claims in
1Q21$(59) (3.0)
Decreased excess mortality for claims in
2020 accident year$(4) (0.2)
Total COVID related excess mortality $25 1.3
1. Based on Group revenues, excluding buyouts and net realized capital gains (losses), of $1,563 million in 2Q21
Note – Subtotals may not foot due to rounding

Copyright © 2021 by The Hartford. All rights reserved. No part of this document may be reproduced, published or posted without the permission of The Hartford 11
Hartford Funds: Strong core earnings growth driven by higher daily average AUM
Total AUM3
($ in billions)
Mutual Fund and ETP Net Flows1
($ in millions)
1. Includes Mutual fund AUM (mutual funds sold through retail, bank trust, registered investment
advisor and 529 plan channels) and ETPs
2.Hartford Funds and ETPs on Morningstar net of fees basis at June 31, 2021
3. Includes Mutual Fund, ETP and Talcott Resolution life and annuity separate account AUM as of
end of period
4.Represents AUM of the life and annuity business sold in May 2018 that are still managed by
Hartford Funds
Mutual Fund and ETP AUM Talcott Resolution Life and Annuity Separate Account AUM 4
$117.8$123.7
$139.4$145.2
$153.8
Core earnings of $51 million in 2Q21 compared to $33 million in
2Q20 due to:
(+) An increase in fee income resulting from a 36% increase
in daily average AUM
(-) Higher variable costs resulting from the increase in
average daily AUM
Mutual fund and Exchange-traded Products (ETP) net inflows of
$2.4 billion in 2Q21, compared with net outflows of $675 million
in 2Q20
Long term performance of funds:
• 60% of overall funds outperformed peers on 3-year basis2
• 67% of overall funds outperformed peers on a 5-year basis2
• 67% of funds rated 4 or 5 stars by Morningstar as of June 30, 2021

Copyright © 2021 by The Hartford. All rights reserved. No part of this document may be reproduced, published or posted without the permission of The Hartford 12
Corporate Core Losses($ in millions)
Corporate: Core loss of $52 million compared to a core loss of $6 million in 2Q20
2Q21 Corporate core losses of $52 million
compared to core losses of $6 million in
2Q20 reflecting:
• (-) $68 million, before tax, income in 2Q20 from the
company's 9.7% retained interest in Talcott
Resolution, which was sold on June 30, 2021
• (+) Decrease in consulting expenses
Corporate holding company resources were
approximately $1.7 billion at June 30, 2021,
down from $1.9 billion at March 31, 2021
driven primarily by share repurchase activity
during the quarter
($ in millions) 2Q20 3Q20 4Q20 1Q21 2Q21
Income (loss) from retained equity interest in Hopmeadow Holdings, after tax
$54 $(17) $(1) $(6) $(2)
Net investment income, after tax 4 2 6 2 3
Interest expense, after tax (45) (46) (45) (45) (45)
Preferred dividends (5) (6) (5) (5) (5)
All others1, after tax (14) 10 (6) (6) (3)
Corporate core losses $(6) $(57) $(51) $(60) $(52)
Components of Corporate Core Losses
1. Includes fee income and expenses from managing invested assets of Hopmeadow Holdings and performing transition
services, incurred losses related to run-off structured settlement and terminal funding agreement liabilities, stranded
costs and other corporate expenses
2Q20 3Q20 4Q20 1Q21 2Q21

Copyright © 2021 by The Hartford. All rights reserved. No part of this document may be reproduced, published or posted without the permission of The Hartford 13
Total net investment income: Partnership returns of 33% drove strong results
* Total includes investment expenses of $16 million, $17 million, $20 million, $19
million and $21 million in 2Q20, 3Q20, 4Q20, 1Q21 and 2Q21 respectively
Annualized Investment Yield, Before Tax
Total Net Investment Income($ in millions)
Fixed Maturities and Other LP
1. Denotes financial measure not calculated based on GAAP
$509*$339*
$492*$556* $581*
Total net investment income rose $242 million, before tax, to
$581 million due to higher returns on limited partnerships
and alternative investments (LP's)
Net investment income, excluding LPs1 and expenses, of
$411 million, before tax, was down 4% from 2Q20 due to:
(-) Lower reinvestment rates on the fixed income portfolio
(-) Lower yield on floating rate investments
(+) Higher level of invested assets
LP income rose $262 million to $191 million, before tax,
from a loss of $71 million, before tax, in 2Q20 reflecting
higher valuations and sales of underlying investments within
private equity funds. Note: LPs are reported on a quarter lag
Annualized investment yield, before tax:
• 4.4% compared to 2.7% in 2Q20
• LPs, 32.5% in 2Q21 compared to (15.3%) in 2Q20
• Excluding LPs1, 3.1% compared to 3.4% in 2Q20
• P&C excluding LPs1, 3.1% compared to 3.5% in 2Q20
• Group Benefits excluding LPs1 of 3.5% compared to 3.6% in 2Q20
Annualized investment yield, after tax:
• 3.6% in 2Q21 compared to 2.2% in 2Q20
• Excluding LPs, 2.5%, compared to 2.8% in 2Q20

Copyright © 2021 by The Hartford. All rights reserved. No part of this document may be reproduced, published or posted without the permission of The Hartford 14
Core earnings ROE was 13.1% in 2Q21 compared with 12.7% in prior
year
Consolidated Core Earnings ROE
Net income ROE of 12.3% versus 11.3% in 2Q20
Core earnings ROE of 13.1% was up 0.4 points
from 2Q20
• 2Q21 trailing 12-month core earnings
increased 10% to $2.2 billion from $2.0 billion
in 2Q20
• Increase in 12-month core earnings was
partially offset by higher average stockholder
equity
Core earnings ROE remained strong in P&C
and increased in Hartford Funds
• P&C: 16.5% in 2Q21 versus 13.3% in 2Q20
• Group Benefits: 7.5% in 2Q21 versus 13.7% in
2Q20
• Hartford Funds: 51.2% in 2Q21 versus 48.3%
in 2Q20
P&C Core Earnings ROE

Copyright © 2021 by The Hartford. All rights reserved. No part of this document may be reproduced, published or posted without the permission of The Hartford 15
BVPS (ex. AOCI)1 was $49.01 at June 30, 2021;
shareholder value creation (SVC)2 was 11% over last 12 months
Book Value Per Diluted Share (ex. AOCI)
Book Value Per Diluted Share (BVPS) $50.62 book value per diluted share at June 30, 2021
• Relatively flat from December 31, 2020 as net income for the six month
period was offset by share repurchases and stockholder dividends as well
as the effect of a decrease in net unrealized gains on investments within
AOCI
$49.01 book value per diluted share (ex. AOCI) at June 30, 2021
• Increased 4% from December 31, 2020 as net income was partially offset
by share repurchases and stockholder dividends during the first six months
of 2021
In 2Q21, the company returned $694 million to shareholders
including $568 million in share repurchases and $126 million in
common stockholder dividends paid
Year to date, the company has returned $933 million to
shareholders including $691 million in share repurchases and
$242 million in common stockholder dividends paid
Including common stockholder dividends paid, SVC was 11%
over last 12 months
1. Denotes financial measure not calculated in GAAP
2. Shareholder value creation (SVC) in a period is defined as the change in BVPS (ex. AOCI) plus common stockholder
dividends paid during the period, divided by BVPS (ex. AOCI) at beginning of period

16Copyright © 2021 by The Hartford. All rights reserved. No part of this document may be reproduced, published or posted without the permission of The Hartford
APPENDIX

Copyright © 2021 by The Hartford. All rights reserved. No part of this document may be reproduced, published or posted without the permission of The Hartford 17Copyright © 2021 by The Hartford. All rights reserved. No part of this document may be reproduced, published or posted without the permission of The Hartford 17
Hartford Next:
Initiative is on track, with savings of $540M in 2022
$, millions
1. After tax impact, assuming corporate tax rate of 21%.
$, millions
Updated Hartford Next Assumptions
• Hartford Next run-rate savings ahead of previous estimate with
expected savings in 2021 increasing from $370M to $390M
• Current estimated expenses for the program are $391M, with
impacts to core and non-core expenses, including ~$75M of
amortization and other costs to be incurred after 2022
YTD June 21
FY 2021 FY 2022E FY 2023E
Savings $195 $390 $540 $625
Core expenses $(32) $(63) $(52) $(18)
Core Earnings
Improvement (p/t)$163 $327 $488 $607
Core Earnings
Improvement (a/t)1$129 $258 $386 $480
Updated Estimated Core Earnings Impact
$370$390
$540
$625
Prior Outlook Current Outlook
2021 E 2022 E 2023 E