the halo effect in multicomponent ratings and its ...callan/papers/isr12-nsahoo.pdfthe halo effect...
TRANSCRIPT

Information Systems ResearchVol. 23, No. 1, March 2012, pp. 231–246ISSN 1047-7047 (print) � ISSN 1526-5536 (online) http://dx.doi.org/10.1287/isre.1100.0336
© 2012 INFORMS
Research Note
The Halo Effect in Multicomponent Ratings andIts Implications for Recommender Systems:
The Case of Yahoo! MoviesNachiketa Sahoo
Tepper School of Business, Carnegie Mellon University, Pittsburgh, Pennsylvania 15213, [email protected]
Ramayya Krishnan, George DuncanHeinz College, Carnegie Mellon University, Pittsburgh, Pennsylvania 15213 {[email protected], [email protected]}
Jamie CallanCarnegie Mellon University, Pittsburgh, Pennsylvania 15213, [email protected]
Collaborative filtering algorithms learn from the ratings of a group of users on a set of items to find personal-ized recommendations for each user. Traditionally they have been designed to work with one-dimensional
ratings. With interest growing in recommendations based on multiple aspects of items, we present an algo-rithm for using multicomponent rating data. The presented mixture model-based algorithm uses the componentrating dependency structure discovered by a structure learning algorithm. The structure is supported by thepsychometric literature on the halo effect. This algorithm is compared with a set of model-based and instance-based algorithms for single-component ratings and their variations for multicomponent ratings. We evaluatethe algorithms using data from Yahoo! Movies. Use of multiple components leads to significant improvementsin recommendations. However, we find that the choice of algorithm depends on the sparsity of the trainingdata. It also depends on whether the task of the algorithm is to accurately predict ratings or to retrieve relevantitems. In our experiments a model-based multicomponent rating algorithm is able to better retrieve items whentraining data are sparse. However, if the training data are not sparse, or if we are trying to predict the rating val-ues accurately, then the instance-based multicomponent rating collaborative filtering algorithms perform better.Beyond generating recommendations we show that the proposed model can fill in missing rating components.Theories in psychometric literature and the empirical evidence suggest that rating specific aspects of a subjectis difficult. Hence, filling in the missing component values leads to the possibility of a rater support system tofacilitate gathering of multicomponent ratings.
Key words : collaborative filtering; multicomponent rating; halo effect; Bayesian network; mixture model;expectation maximization; recommender system
History : Paul Goes, Senior Editor; Balaji Padmanabhan, Associate Editor. This paper was received on July 16,2008, and was with the authors 10.75 months for 2 revisions. Published online in Articles in AdvanceApril 8, 2011.
1. IntroductionRecommender systems are increasingly used in onlinecommunities, e.g., shopping sites, subscription ser-vice sites, and online meeting places (see Table 1).The recommendations are generated from the collec-tion of user preferences, yet they are personalized toeach user. Recommender systems are especially usefulwhen the user has too many choices to explore—theyassist the users in discovering items that will appealto them.
From the retailer’s perspective, recommender sys-tems may be used to target advertise items to itscustomers. A merchant at an online marketplace canuse a recommender system to induce demand for
less-known items in the system. By using its pro-prietary recommender system, Netflix is able toeffectively merchandise its collection of more than100,000 movies. It is able to create demand for older,and often less-known, movies by advertising them tousers who might like those movies. Given the con-straint on the number of movies a subscriber canrent at a time, increase in demand for older moviesreduces the demand for the newer releases, which aremore expensive to stock. As reported in the annualSecurities and Exchange Commission filing of thecompany in 2006, the success of the Netflix businessmodel depends, to a certain extent, on effective use of
231
INFORMS
holds
copyrightto
this
article
and
distrib
uted
this
copy
asa
courtesy
tothe
author(s).
Add
ition
alinform
ation,
includ
ingrig
htsan
dpe
rmission
policies,
isav
ailableat
http://journa
ls.in
form
s.org/.

Sahoo et al.: The Halo Effect in Multicomponent Ratings and Its Implications for Recommender Systems232 Information Systems Research 23(1), pp. 231–246, © 2012 INFORMS
Table 1 Examples of Collaborative Filtering-Based RecommenderSystems
Item type recommended Commercial Noncommercial
Music iTunes, Last.fm, iRATEradio.com,Yahoo! Music mystrands.com
Movies Netflix.com, movielens.umn.edu,blockbuster.com filmaffinity.com
Websites StumbleUpon.comAggregated Amazon.com,
half.ebay.com
and user satisfaction in relation to their recommendersystem (Netflix 2006).
Online storefronts are not the only places whererecommender systems can be used. There are com-munities of users with common interests who userecommender systems to find new items that theymight enjoy. Some examples of such communitiesare Last.fm and Pandora.com (Internet radio sta-tions with music recommender systems) and Stum-bleUpon.com (a Web page recommender system). Thedevelopment of such services suggests that recom-mender systems are important tools for mining col-lective user preferences to help users better navigatelarge choice spaces.
A key input to recommender systems is the ratingsthat users give to the items in the system. The ratingsprovide information about the quality of the item aswell as about the taste of the user who gave the rat-ing. Most recommender systems have been designedfor single-valued ratings, i.e., for each pair (user, item)we have one rating indicating how much the userliked the item. However, sometimes there are multi-ple components to a rating. For instance, the popularZagat survey (Zagat.com) rates restaurants on fourcriteria: food, decor, services, and cost. Similarly, amovie could be rated for its plot, acting, visual effects,and direction. When such ratings are available fromusers, it is plausible that a recommender system couldbe designed that makes use of these component rat-ings and produces better recommendations for theusers.
1.1. Contributions of This PaperIn this paper we build on a successful collaborativefiltering algorithm for single component ratings todesign an algorithm that makes use of multicompo-nent ratings. We do this by discovering a dependencystructure among multicomponent rating data usingthe Chow-Liu structure discovery algorithm. The dis-covered structure is validated by the literature on thehalo effect. We embed this dependency structure ina flexible mixture model (FMM) (Si and Jin 2003).FMM has been shown to work better than the tradi-tional mixture models for collaborative filtering. We
evaluate a set of model-based and instance-based one-component rating collaborative filtering algorithmsand their extensions for the multicomponent ratingdata set. The algorithms were tested using multicom-ponent rating data collected from Yahoo! Movies. Thetest results show a significant improvement from theuse of multiple component ratings. We identify whichmulticomponent rating algorithm performs better inwhich scenario and provide some insight into thebehaviors of model-based and instance-based algo-rithms for collaborative filtering. We also show thatthe proposed model can be used to fill in the miss-ing rating components for incomplete records. Thisallows us to generate better recommendations formore users when there are incomplete ratings in thedata. This also raises the possibility of a rater sup-port system for helping users rate specific aspects ofan item.
It is important to distinguish the current workfrom collaborative filtering in the presence of multi-dimensional context information, such as finding a rec-ommendation for a movie to watch on a Sunday inthe evening with children. Studies exist in the liter-ature to incorporate multidimensional context infor-mation into the recommendation generation process.Adomavicius et al. (2005) suggest a reduction-basedapproach where a context-specific recommendation isgenerated by using only the ratings collected in thecontext of interest. In the current work we address adifferent research question: How can we use the infor-mation in various components of a rating to make betterrecommendations for the users?
1.2. BackgroundGiven a user’s ratings on a subset of items and hispeers’ ratings on possibly different subsets of items,collaborative filtering algorithms predict which of theitems the user would like among the items that heor she has not yet rated. Collaborative filtering algo-rithms recommend to each user items that are popu-lar among the group of users who are similar to him.This can be thought of as automating the spread ofinformation through word of mouth (Shardanand andMaes 1995). Because collaborative filtering algorithmsdo not use the content information of the items, theyare not limited to recommending only the items withcontent that the user has rated before (see Adomavi-cius and Tuzhilin 2005 for a review of the literaturein collaborative filtering).
The first group of collaborative filtering algorithmswere primarily instance-based on the work of Resnicket al. (1994). In the training step of the algorithma database of user ratings is built and is used tofind similar users and/or items for generating rec-ommendations. These algorithms became popularbecause they are simple, intuitive, and are sufficient
INFORMS
holds
copyrightto
this
article
and
distrib
uted
this
copy
asa
courtesy
tothe
author(s).
Add
ition
alinform
ation,
includ
ingrig
htsan
dpe
rmission
policies,
isav
ailableat
http://journa
ls.in
form
s.org/.

Sahoo et al.: The Halo Effect in Multicomponent Ratings and Its Implications for Recommender SystemsInformation Systems Research 23(1), pp. 231–246, © 2012 INFORMS 233
for many small data sets. However, they do not scaleto large data sets without further approximations.Also, because they do not learn any user model fromthe available preferences, they are of limited use asdata mining tools (Hofmann 2004).
A second group of collaborative filtering algo-rithms, known as model-based algorithms, sur-faced later (Breese et al. 1998, Chien and George1999, Getoor and Sahami 1999). They compile theavailable user preferences into compact statisticalmodels from which the recommendations are gen-erated. Notable model-based collaborative filteringapproaches include singular value decompositionto identify latent structure in ratings (Billsus andPazzani 1998); probabilistic clustering and Bayesiannetworks (Breese et al. 1998, Chien and George1999); repeated clustering (Ungar and Foster 1998);dependency networks (Heckerman et al. 2001); latentclass models (Hofmann and Puzicha 1999) and latentsemantic models (Hofmann 2004) to cluster the rat-ings; and flexible mixture models to separately clusterusers and items (Si and Jin 2003). Unlike the instance-based approach, the model-based algorithms are slowto train; once trained, however, they can generate rec-ommendations quickly.
The model-based algorithms are often describedwith the help of probabilistic graphical models. Proba-bilistic graphic models provide a framework based onprobability theory and graph theory to approximatecomplex distributions (Pearl 2000). They graphicallyexpress conditional independencies among variables.The variables are represented as nodes, and depen-dence among them is expressed as edges in a graph.The assumption they encode about the distribution isthat each node is independent of the nondescendentnodes conditional on its parent nodes. This allows oneto use the chain rule of probability to factor the jointdistribution over all the variables into the product ofsmall conditional distributions. These smaller distri-butions can be individually estimated. This simplifiesthe operation on the joint distribution during trainingand inference (Koller and Friedman 2009).
Product recommendation systems have beenexplored in marketing science as well. Often the goalis to predict the purchase outcome when a customeris targeted. Recently Moon and Russell developedan autologistic recommendation model-based on toolsfrom the spatial statistics literature (Moon and Russell2008). This model uses the consumers’ purchase his-tory to estimate the probability of a future purchase.
Most of the algorithms in the literature are designedto use unidimensional ratings. In a recent work,Adomavicius and Kwon present approaches for multi-criteria rating collaborative filtering (Adomaviciusand Kwon 2007). Their work is instance-based in iden-tifying similar users but model-based in aggregating
component ratings into one overall rating. Lee andTeng use skyline queries to generate multicriteria-based recommendations from individual componentrating predictions, where each component rating ispredicted using traditional collaborative filtering algo-rithms (Lee and Teng 2007).
The multicomponent rating collaborative filteringhas some apparent similarity with the conjoint analy-sis in marketing science (Green and Srinivasan 1978).In conjoint analysis the objective is to estimate aconsumer’s preference function in terms of the weightthe consumer assigns to the attributes of a product.However, collaborative filtering is effective for goodsfor which attributes can not be readily determined. Forinstance, directorial style of a movie is hard to expressusing an attribute-value system. It is worth noting thata high rating for directorial style of a particular moviedoes not mean the user puts more weight on the direc-torial quality. Rather, it means that the user perceivesa better match of the directorial style, which is notpart of the data, with her preference. In this regard,content-based filtering strategies have more similaritywith the conjoint analysis than do the collaborative fil-tering strategies.
The current work is built on the FMM for collabora-tive filtering (Si and Jin 2003). FMM models the userand item distribution separately by using two latentvariables (Figure 1). It has been shown to work betterthan other latent class models for collaborative filter-ing. We extend it for multicomponent ratings, takinginto account specific properties of these types of data.
Multicomponent rating data exhibit high correla-tion among the rating components. This is known asthe halo effect (Thorndike 1920, Wells 1907). The halooccurs in part because of the failure of the raters toevaluate each component independent of the others(Cooper 1981, Shweder 1975). In some cases this couldbe a result of the design of the questionnaire that col-lects multicomponent ratings. If the definitions of thecomponents are ambiguous or not sufficiently differ-ent from each other, the collected ratings are likely tobe correlated (Kevin and Reynolds 1988). Although
Figure 1 Flexible Mixture Model of Si and Jin (2003)
Zu Zi
U IR
Note. Latent variable nodes are shaded; observed variable nodes are notshaded. Source: Si and Jin (2003).
INFORMS
holds
copyrightto
this
article
and
distrib
uted
this
copy
asa
courtesy
tothe
author(s).
Add
ition
alinform
ation,
includ
ingrig
htsan
dpe
rmission
policies,
isav
ailableat
http://journa
ls.in
form
s.org/.
Sahoo et al.: The Halo Effect in Multicomponent Ratings and Its Implications for Recommender Systems234 Information Systems Research 23(1), pp. 231–246, © 2012 INFORMS
there is some debate about whether halo is entirelybad (Cooper 1981, Fisicaro 1988), it is generally con-sidered undesirable because correlated componentsprovide less information than independent ones. Atthe rating time the halo can be reduced by increas-ing the familiarity between the rater and the subject(Heneman 1974, Koltuv 1962, Landy and Farr 1980),reducing the time between the observation and therating (Borgatta et al. 1958, Shweder and D’Andrade1980), clever questionnaire designs that make therater aware of the differences among the components(Rizzo and Frank 1977), and sensitizing the raters bytraining them to observe and avoid the halo effect(Borman 1979, Latham et al. 1980, Ivancevich 1979).
Some halo effect is almost always present despiteprecautions. Holzbach suggests using a global compo-nent in the rating to collect each rater’s overall impres-sion of the subject and statistically remove its effectfrom each component rating (Holzbach 1978). Simi-lar approaches are taken by Landy et al. (Landy et al.1980) and by Myers (1965) to arrive at more accuratecomponent ratings. Some elements of our approachdescribed in §2.4 are similar to the approach proposedby Holzbach. To the best of our knowledge, the haloeffect has not been studied in the context of recom-mender systems despite recent advances in multicom-ponent rating collaborative filtering algorithms.
2. Multicomponent RatingRecommender System
By rating multiple aspects of an item, users providemore information about their preferences. The varia-tion in different users’ component ratings while theyseemingly agree on their overall impression of theitem can be informative. For instance, consider twousers u1 and u2 who have given the same overall rat-ings to the movie m1 (Table 2). But, they differ in howthey rate the components of the movie. User u1 likesthe plot of the movie, whereas user u2 likes the direc-tion of the movie. Without the component ratings wewould have concluded that users would not particu-larly like any movie similar to m1. But the componentratings tell us more. They suggest that user u1 mightlike other movies that have a story similar to m1, anduser u2 might like a movie that has been directed bythe same director or a director with a similar style.Therefore, if we can effectively use the information
Table 2 An Example of Multicomponent Rating
User Movie Story Acting Visuals Direction Overall
u1 m1 4 1 2 1 2u2 m1 2 1 1 4 2
Note. Ratings are on a scale of 0–4.
in the component ratings, we should be able to findmore relevant items for the users.
Our empirical work has been motivated by theavailability of extensive multicomponent rating datafrom the Yahoo! Movies website. Although the gen-eral approach taken in this work is applicable forany data with component ratings, for clarity we shalldescribe the methods of this work with the help ofthe Yahoo! data set.
2.1. Data Description and Preliminary AnalysisThe rating data were collected from the Yahoo!Movies website using a custom program writtenin Java programming language. Each record ofthe rating data has seven variables: item or movieID 4I5, user ID 4U5, ratings on story 4S5, acting 4A5,visuals 4V 5, direction 4D5, and overall 4O5 qualityof the movie. The ratings are on a 13-point scale4A+1A1A−1B+1B1B−1C+1C1C−1D+1D1D−1 F 5. Werecoded them to a scale of 0–4:
48A+1A1A−9−→ 41 8B+1B1B−9−→ 31
8C+1C1C−9−→ 21 8D+1D1D−9−→ 11 8F 9−→ 051
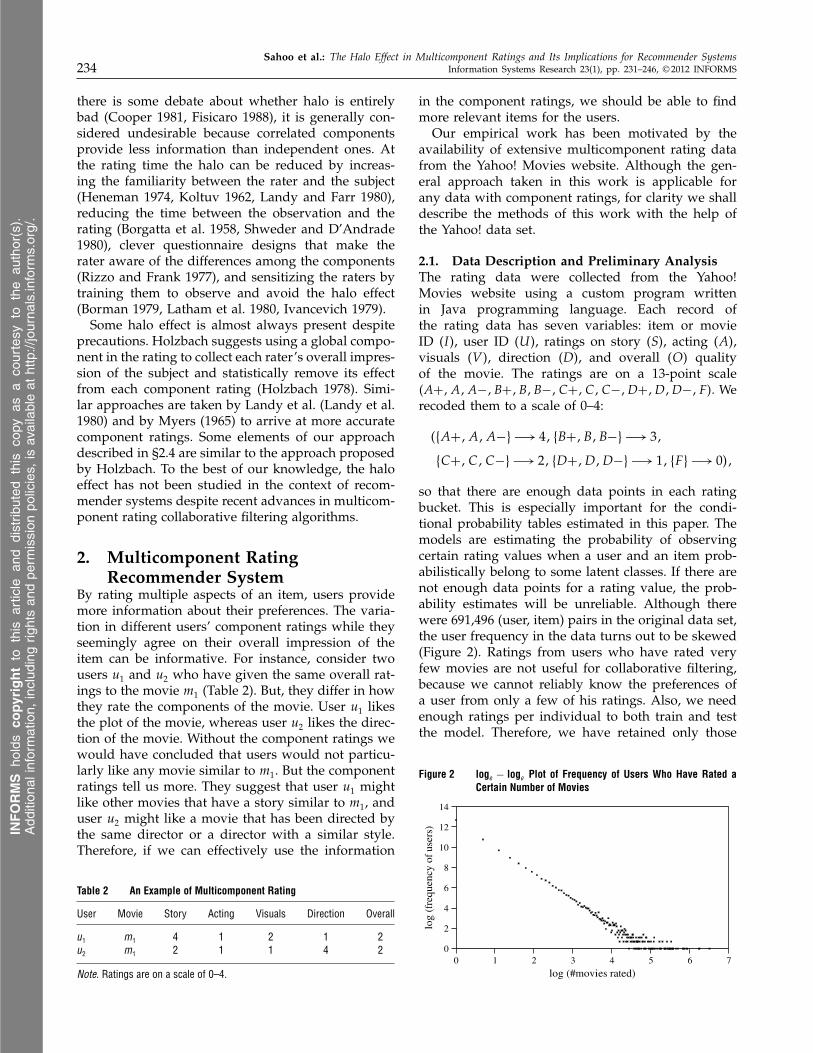
so that there are enough data points in each ratingbucket. This is especially important for the condi-tional probability tables estimated in this paper. Themodels are estimating the probability of observingcertain rating values when a user and an item prob-abilistically belong to some latent classes. If there arenot enough data points for a rating value, the prob-ability estimates will be unreliable. Although therewere 691,496 (user, item) pairs in the original data set,the user frequency in the data turns out to be skewed(Figure 2). Ratings from users who have rated veryfew movies are not useful for collaborative filtering,because we cannot reliably know the preferences ofa user from only a few of his ratings. Also, we needenough ratings per individual to both train and testthe model. Therefore, we have retained only those
Figure 2 loge − loge Plot of Frequency of Users Who Have Rated aCertain Number of Movies
0 1 2 3 4 5 6 70
2
4
6
8
10
12
14
log (#movies rated)
log
(fre
quen
cyof
user
s)INFORMS
holds
copyrightto
this
article
and
distrib
uted
this
copy
asa
courtesy
tothe
author(s).
Add
ition
alinform
ation,
includ
ingrig
htsan
dpe
rmission
policies,
isav
ailableat
http://journa
ls.in
form
s.org/.
Sahoo et al.: The Halo Effect in Multicomponent Ratings and Its Implications for Recommender SystemsInformation Systems Research 23(1), pp. 231–246, © 2012 INFORMS 235
Table 3 Correlation Among Components of Rating
S A D V O
S 1.00 0.79 0.82 0.74 0.87A 0.79 1.00 0.81 0.73 0.83D 0.82 0.81 1.00 0.79 0.88V 0.74 0.73 0.79 1.00 0.80O 0.87 0.83 0.88 0.80 1.00
Table 4 Principal Components
Component One Two Three Four Five
% variance explained 84.5 5.7 4.4 3.2 2.2
Table 5 Factor Loadings After Quartimax Rotation
Factor 1 Factor 2 Uniquenesses
S 0091 0023 0011A 0087 −0002 0021V 0093 −0008 0010D 0084 −0012 0025O 0095 0003 0007
records that contain users who have at least 20 rat-ings. After this filtering there were 45,892 records,1,058 unique users, and 3,430 unique movies.
Examining the data set for the halo effect, we findthat the components are highly correlated (Table 3).One way to detect halo effect is by principal com-ponent analysis (PCA) and factor analysis (Morrison1967). If most of the variance in the components canbe explained by one principal component or one fac-tor, then it suggests the presence of the halo effect(Kafry et al. 1979). PCA of the ratings shows thatthere is one component that explains 84.5% variance(Table 4). Factor analysis of the components produceda factor structure dominated by one factor (Table 5).These indicate that there is halo error in the collectedratings.
2.2. Modeling Component Ratings forCollaborative Filtering
The information contained in the multicomponent rat-ing has two parts: the overall component captures theuser’s overall impression about the item and the vari-ation among the components after partialling out theeffect of the overall component tells us how the userevaluates aspects of the item. Traditionally, only theoverall component has been used to carry out collabo-rative filtering (e.g., in Si and Jin 2003). In this sectionwe show how to use the additional information incomponents along with the overall component.
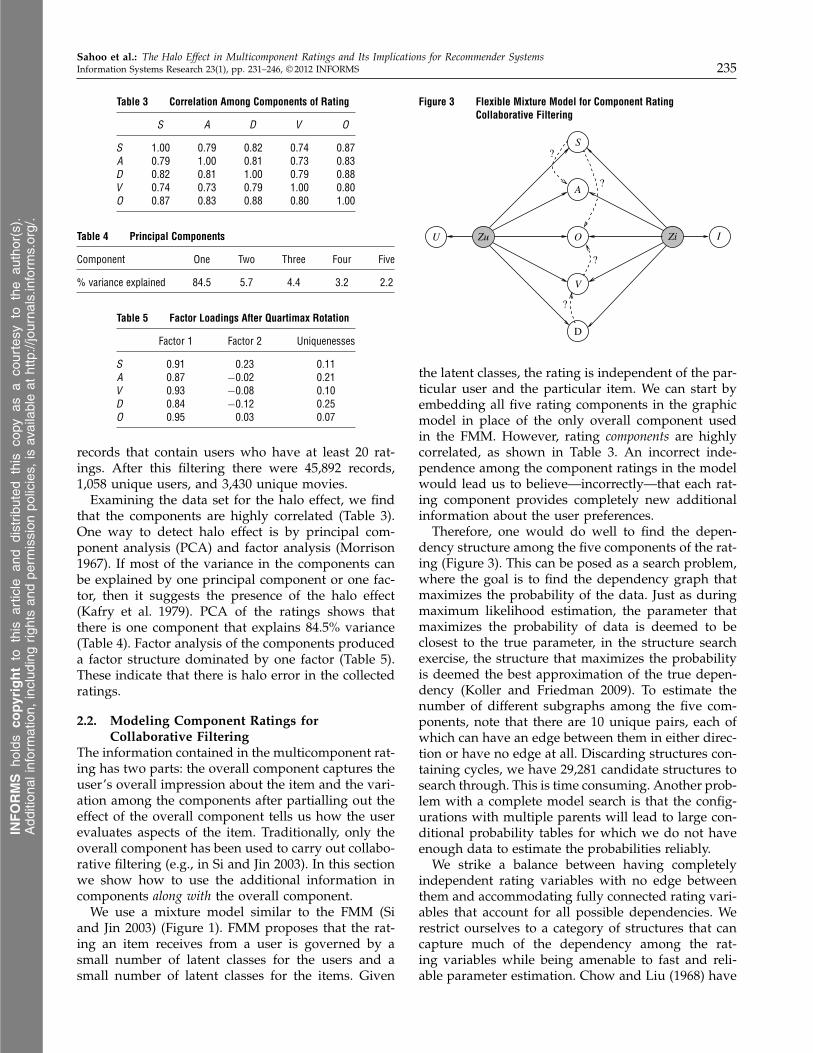
We use a mixture model similar to the FMM (Siand Jin 2003) (Figure 1). FMM proposes that the rat-ing an item receives from a user is governed by asmall number of latent classes for the users and asmall number of latent classes for the items. Given
Figure 3 Flexible Mixture Model for Component RatingCollaborative Filtering
U
S
A
V
D
O IZu Zi
?
?
?
?
the latent classes, the rating is independent of the par-ticular user and the particular item. We can start byembedding all five rating components in the graphicmodel in place of the only overall component usedin the FMM. However, rating components are highlycorrelated, as shown in Table 3. An incorrect inde-pendence among the component ratings in the modelwould lead us to believe—incorrectly—that each rat-ing component provides completely new additionalinformation about the user preferences.
Therefore, one would do well to find the depen-dency structure among the five components of the rat-ing (Figure 3). This can be posed as a search problem,where the goal is to find the dependency graph thatmaximizes the probability of the data. Just as duringmaximum likelihood estimation, the parameter thatmaximizes the probability of data is deemed to beclosest to the true parameter, in the structure searchexercise, the structure that maximizes the probabilityis deemed the best approximation of the true depen-dency (Koller and Friedman 2009). To estimate thenumber of different subgraphs among the five com-ponents, note that there are 10 unique pairs, each ofwhich can have an edge between them in either direc-tion or have no edge at all. Discarding structures con-taining cycles, we have 29,281 candidate structures tosearch through. This is time consuming. Another prob-lem with a complete model search is that the config-urations with multiple parents will lead to large con-ditional probability tables for which we do not haveenough data to estimate the probabilities reliably.
We strike a balance between having completelyindependent rating variables with no edge betweenthem and accommodating fully connected rating vari-ables that account for all possible dependencies. Werestrict ourselves to a category of structures that cancapture much of the dependency among the rat-ing variables while being amenable to fast and reli-able parameter estimation. Chow and Liu (1968) have
INFORMS
holds
copyrightto
this
article
and
distrib
uted
this
copy
asa
courtesy
tothe
author(s).
Add
ition
alinform
ation,
includ
ingrig
htsan
dpe
rmission
policies,
isav
ailableat
http://journa
ls.in
form
s.org/.
Sahoo et al.: The Halo Effect in Multicomponent Ratings and Its Implications for Recommender Systems236 Information Systems Research 23(1), pp. 231–246, © 2012 INFORMS
Figure 4 Discovered Structure in the Subratings
Chow-Liu tree
O
A V DS
Mutual information
S A V D O
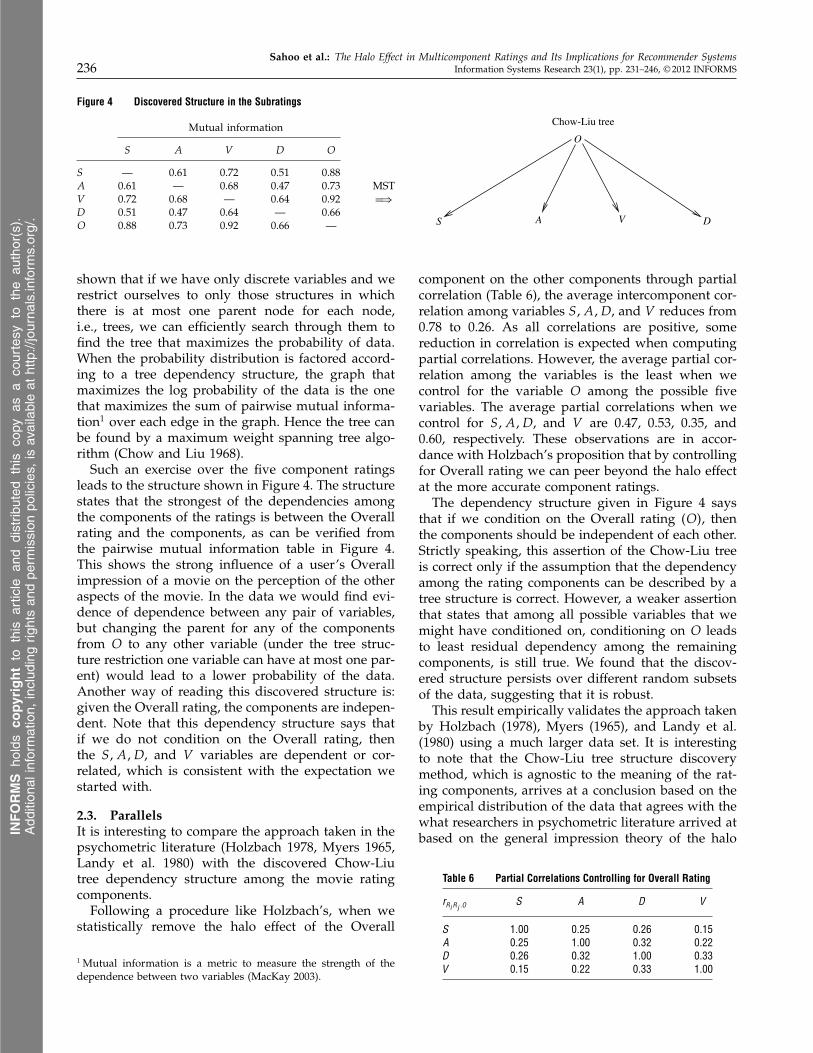
S — 0.61 0.72 0.51 0.88A 0.61 — 0.68 0.47 0.73 MSTV 0.72 0.68 — 0.64 0.92 =⇒
D 0.51 0.47 0.64 — 0.66O 0.88 0.73 0.92 0.66 —
shown that if we have only discrete variables and werestrict ourselves to only those structures in whichthere is at most one parent node for each node,i.e., trees, we can efficiently search through them tofind the tree that maximizes the probability of data.When the probability distribution is factored accord-ing to a tree dependency structure, the graph thatmaximizes the log probability of the data is the onethat maximizes the sum of pairwise mutual informa-tion1 over each edge in the graph. Hence the tree canbe found by a maximum weight spanning tree algo-rithm (Chow and Liu 1968).
Such an exercise over the five component ratingsleads to the structure shown in Figure 4. The structurestates that the strongest of the dependencies amongthe components of the ratings is between the Overallrating and the components, as can be verified fromthe pairwise mutual information table in Figure 4.This shows the strong influence of a user’s Overallimpression of a movie on the perception of the otheraspects of the movie. In the data we would find evi-dence of dependence between any pair of variables,but changing the parent for any of the componentsfrom O to any other variable (under the tree struc-ture restriction one variable can have at most one par-ent) would lead to a lower probability of the data.Another way of reading this discovered structure is:given the Overall rating, the components are indepen-dent. Note that this dependency structure says thatif we do not condition on the Overall rating, thenthe S1A1D, and V variables are dependent or cor-related, which is consistent with the expectation westarted with.
2.3. ParallelsIt is interesting to compare the approach taken in thepsychometric literature (Holzbach 1978, Myers 1965,Landy et al. 1980) with the discovered Chow-Liutree dependency structure among the movie ratingcomponents.
Following a procedure like Holzbach’s, when westatistically remove the halo effect of the Overall
1 Mutual information is a metric to measure the strength of thedependence between two variables (MacKay 2003).
component on the other components through partialcorrelation (Table 6), the average intercomponent cor-relation among variables S1A1D, and V reduces from0.78 to 0.26. As all correlations are positive, somereduction in correlation is expected when computingpartial correlations. However, the average partial cor-relation among the variables is the least when wecontrol for the variable O among the possible fivevariables. The average partial correlations when wecontrol for S1A1D, and V are 0.47, 0.53, 0.35, and0.60, respectively. These observations are in accor-dance with Holzbach’s proposition that by controllingfor Overall rating we can peer beyond the halo effectat the more accurate component ratings.
The dependency structure given in Figure 4 saysthat if we condition on the Overall rating 4O5, thenthe components should be independent of each other.Strictly speaking, this assertion of the Chow-Liu treeis correct only if the assumption that the dependencyamong the rating components can be described by atree structure is correct. However, a weaker assertionthat states that among all possible variables that wemight have conditioned on, conditioning on O leadsto least residual dependency among the remainingcomponents, is still true. We found that the discov-ered structure persists over different random subsetsof the data, suggesting that it is robust.
This result empirically validates the approach takenby Holzbach (1978), Myers (1965), and Landy et al.(1980) using a much larger data set. It is interestingto note that the Chow-Liu tree structure discoverymethod, which is agnostic to the meaning of the rat-ing components, arrives at a conclusion based on theempirical distribution of the data that agrees with thewhat researchers in psychometric literature arrived atbased on the general impression theory of the halo
Table 6 Partial Correlations Controlling for Overall Rating
rRi Rj 0O S A D V
S 1000 0025 0026 0015A 0025 1000 0032 0022D 0026 0032 1000 0033V 0015 0022 0033 1000
INFORMS
holds
copyrightto
this
article
and
distrib
uted
this
copy
asa
courtesy
tothe
author(s).
Add
ition
alinform
ation,
includ
ingrig
htsan
dpe
rmission
policies,
isav
ailableat
http://journa
ls.in
form
s.org/.

Sahoo et al.: The Halo Effect in Multicomponent Ratings and Its Implications for Recommender SystemsInformation Systems Research 23(1), pp. 231–246, © 2012 INFORMS 237
Figure 5 Flexible Mixture Model with Component RatingDependency Structure
S
V
D
U IZu ZiO
A
effect. We believe this agreement adds to the validityof both approaches.
2.4. Model Estimation Using theExpectation-Maximization (EM) Algorithm
Using the discovered structure between the compo-nents of the ratings, we construct the model shown inFigure 5 for collaborative filtering. As we have hid-den variables, the parameters need to be estimatedusing an indirect method. We propose an algorithmbased on the EM framework (Dempster et al. 1977).The algorithms based on the EM framework have twoalternating steps that monotonically increase proba-bility of the data or the likelihood of the parameters.First is the E (expectation) step, where one computesthe distribution of the unobserved variable given allthe observed variables. This is the same as doing aninference on the graphical model for the hidden vari-ables. It can be shown that among all distributionsover the hidden variables, the posterior distributiongiven the observed data maximizes the expected logprobability. Intuitively, the posterior distribution overthe hidden variables given the observation is our bestguess about the values of the hidden variables.
Second is the M (maximization) step, where oneestimates the parameters of the complete distribu-tion (consists of observed and unobserved variables)using the standard maximum likelihood estimation.This operation maximizes the expected log probabil-ity given the posterior distribution of the unobservedvariables.
The E and the M steps in our case are:E step
P4Zu1Zi �EX51
=
P4Zu5P4Zi5P4I �Zi5P4U �Zu5∏5
j=1P4Rj �Zu1Zi1PaRj5
∑
Zu
∑
ZiP4Zu5P4Zi5P4I �Zi5P4U �Zu5
∏5j=1P4Rj �Zu1Zi1PaRj
51 (1)
M step
P4Zu5=1L
∑
l
∑
Zi
P4Zu1Zi �EX4l551 (2)
P4Zi5=1L
∑
l
∑
Zu
P4Zu1Zi �EX4l551 (3)
P4U �Zu5=
∑
l2U4l5=U
∑
ZiP4Zu1Zi �
EX4l55∑
l
∑
ZiP4Zu1Zi �Xl5
1 (4)
P4I �Zi5=
∑
l2 I4l5=I
∑
ZuP4Zu1Zi �
EX4l55∑
l
∑
ZuP4Zu1Zi �
EX4l551 (5)
P4Rj �Zu1Zi1PaRj5
=
∑
l2Rj4l5=Rj& PaRj4l5=PaRj P4Zu1Zi �EX4l55
∑
l2PaRj4l5=PaRj P4Zu1Zi �EX4l55
1 (6)
where
Zu = Latent class variable to cluster the users,Zi = Latent class variable to cluster the items,Rj = jth rating node; Rj ∈ 8S1A1V 1D1O9,
PaRj= parent rating node of Rj ,
L= number of records in the data set,l = record index,
EX4l5 = record numbered l; it consists of observationsfor U1 I1S1A1V 1D, and O,
U4l5 = variable U in the record numbered l,I4l5 = variable I in the record numbered l,
Rj4l5 = rating variable Rj in the record numbered l,PaRj 4l5
= rating variable PaRjin the record numbered l.
The E step shown above is the conditional distri-bution computed by dividing joint distribution of allvariables, factored using the conditional independen-cies, by the joint distribution of only the observedvariables, obtained by marginalizing out the hiddenvariables. The M step in the EM algorithm estimatesthe maximum likelihood estimate of the parametersusing both the observed and the unobserved vari-ables. If we could observe all variables, we couldfind the maximum likelihood estimate of parame-ters of each conditional probability table by divid-ing the number of records with matching values forall the variables in the conditional probability tableby the total number of records with matching val-ues of the conditioning variables. However, we do notobserve the hidden variables. Therefore, we have touse our best guess about their number of occurrencesor their expected occurrence counts at a record giventhe observations of other variables in the same record.This is obtained from the posterior distribution of thehidden variable. Because this conditional distributionis multinomial, the expected number of times a hid-den variable takes a certain value in one record is
INFORMS
holds
copyrightto
this
article
and
distrib
uted
this
copy
asa
courtesy
tothe
author(s).
Add
ition
alinform
ation,
includ
ingrig
htsan
dpe
rmission
policies,
isav
ailableat
http://journa
ls.in
form
s.org/.

Sahoo et al.: The Halo Effect in Multicomponent Ratings and Its Implications for Recommender Systems238 Information Systems Research 23(1), pp. 231–246, © 2012 INFORMS
Figure 6 Flexible Mixture Model with Independent Component Ratings
U
S
A
V
D
O IZu Zi
same as the probability of the hidden variable takingthat value given the value of the observed variables.All equations of the M step can be obtained by tab-ulating the values of the observed variables and, forthe hidden variables, using the expected number oftimes the hidden variables take a certain value.
We compare this model with discovered depen-dency structure with the model that assumes inde-pendence among the component ratings conditionalon the latent classes (Figure 6). The E and the M stepsfor the case when all components are assumed inde-pendent are derived in a similar manner.E step
P4Zu1Zi �EX51
=P4Zu5P4Zi5P4I �Zi5P4U �Zu5
∏5j=1P4Rj �Zu1Zi5
∑
Zu
∑
ZiP4Zu5P4Zi5P4I �Zi5P4U �Zu5
∏5j=1P4Rj �Zu1Zi5
(7)
M step
P4Zu5=1L
∑
l
∑
Zi
P4Zu1Zi �EX4l551 (8)
P4Zi5=1L
∑
l
∑
Zu
P4Zu1Zi �EX4l551 (9)
P4U �Zu5=
∑
l2U4l5=U
∑
ZiP4Zu1Zi �
EX4l55∑
l
∑
ZiP4Zu1Zi �Xl5
1 (10)
P4I �Zi5=
∑
l2 I4l5=I
∑
ZuP4Zu1Zi �
EX4l55∑
l
∑
ZuP4Zu1Zi �
EX4l551 (11)
P4Rj �Zu1Zi5=
∑
l2Rj4l5=RjP4Zu1Zi �
EX4l55∑
l P4Zu1Zi �EX4l55
0 (12)
Note that the key difference between these two setsof expressions is the absence of any parent node inthe conditioning part of the conditional probability ofthe component ratings (Expressions (6) and (12)). The
intuitions behind these equation are similar to thosedescribed for the previous set.
We also compare these approaches with the base-line case where there is only one rating: the Overallrating on the movie. The E and the M steps can beborrowed from Si and Jin (2003) or derived followingthe approach used to arrive at Equations (1)–(12).E step
P4Zu1Zi �U1 I1O5
=P4Zu5P4Zi5P4I �Zi5P4U �Zu5P4O �Zu1Zi5
∑
Zu
∑
ZiP4Zu5P4Zi5P4I �Zi5P4U �Zu5P4O �Zu1Zi5
(13)
M step
P4Zu5=1L
∑
l
∑
Zi
P4Zu1Zi �U4l51 I4l51O4l551 (14)
P4Zi5=1L
∑
l
∑
Zu
P4Zu1Zi �U4l51 I4l51O4l551 (15)
P4U �Zu5=
∑
l2U4l5=U
∑
ZiP4Zu1Zi �U4l51 I4l51O4l55
L× P4Zu51 (16)
P4I �Zi5=
∑
l2 I4l5=I
∑
ZuP4Zu1Zi �U4l51 I4l51O4l55
L× P4Zi51 (17)
P4O �Zu1Zi5=
∑
l2O4l5=O
∑
ZuP4Zu1Zi �U4l51I4l51O4l55
∑
lP4Zu1Zi �U4l51I4l51O4l550 (18)
In each of these approaches the number of theclasses (levels of Zu and Zi) is a user-specified parame-ter. The greater the number of classes, the better the fitof the model will be with to the training data, result-ing in larger probability of data, but that will increasethe risk of overfitting the model to the training data.Another factor to keep in mind is that increasingthe number of classes by n times leads to n2 timesmore multiplications in the E step and n times moreadditions in the M step. In our experiments the timetaken to complete with higher levels of classes hasbeen the bottleneck. We have experimented with 4, 8,16, and 32 classes. The times taken to complete theexperiments were approximately 2.5 hours, 17 hours,92 hours, and 670 hours, respectively, on a 3.0-GHzpentium processor computer. This leads to some inter-esting findings. The model with only an Overall ratingperforms best, with 4 hidden classes. The more com-plex model with 5 independent components performsbest at 8 hidden classes and almost as well with 16. Themodel with 5 dependent components performs bestwith 16 hidden classes. The reported results containthe best results for each model.
All models performed poorly when we used32 classes because of too many parameters to esti-mate. It causes at least two problems:
1. Small number of data points for each parameterleads to unreliable estimations;
INFORMS
holds
copyrightto
this
article
and
distrib
uted
this
copy
asa
courtesy
tothe
author(s).
Add
ition
alinform
ation,
includ
ingrig
htsan
dpe
rmission
policies,
isav
ailableat
http://journa
ls.in
form
s.org/.

Sahoo et al.: The Halo Effect in Multicomponent Ratings and Its Implications for Recommender SystemsInformation Systems Research 23(1), pp. 231–246, © 2012 INFORMS 239
2. Overfitting of the model to the training data.A method that adaptively determines the number
of classes given the size of the data set at hand wouldbe most appropriate in a real-life setting. However,we leave that for a future study.
2.4.1. Smoothing of Parameter Estimates UsingBDe Prior (Koller and Friedman 2009). To guardagainst over-fitting to the training data we smooth theparameter estimates in the M step using a Dirichletprior, which is the multivariate generalization of thebeta distribution and conjugate prior for the multi-nomial distribution. A parameter 4�11 0 0 0 1 �K5 follow-ing Dirichlet distribution with the hyperparameters4�11 0 0 0 1�K5 has the probability distribution
P4�11 0 0 0 1 �K5∼∏
k
��k−1k 0
The expected value of �k = �k/4∑k=K
k=1 �k5. If weupdate this prior using multinomial data with countsM11 0 0 0 1MK , then we obtain the posterior that isanother Dirichlet distribution with hyper parameters4�1 + M11 0 0 0 1�K + MK5. Thus the expected values ofthe components can be obtained by adding the countsto the numerator and denominator of the originalformula:
E4�k5=Mk +�k
4∑
kMk5+ 4∑
k �k50 (19)
Therefore, the �s can be thought of as pseudocountsand the sum of �’s is a measure of the weight of theprior. Note that for each combination of values of theparent nodes there is a different set of parameters andpriors. If the same Dirichlet prior were used for eachconditional distribution, the nodes with more parentconfigurations would have larger weights of the pri-ors. BDe prior is a Dirichlet prior constructed so thatthe weight of the prior would be the same for eachnode, irrespective of how many parent configurations,and thus conditional probability tables, there are foreach of them (Nir Friedman 1998). We use a BDe priorto smooth the parameter estimates during the modeltraining phase.
2.5. Predicting the Overall RatingThe goal is to predict the rating a user would give toan item he has not yet rated. Hence, the partial obser-vation consists of the user and the item from whichwe are trying to predict the Overall rating.
The joint distribution over all variables (observedand latent) is the product of the conditional proba-bility table estimated in §2.4, from which we needto marginalize away those variables that we are notinterested in. In this section we focus on our abilityto predict the overall rating. Therefore, we need tomarginalize all variables except U1 I1 and O. For the
three models discussed in the previous section, thedistribution over the variables U1 I , and O is
P4U1 I1O5 =∑
Zu
P4Zu5P4U �Zu5
·∑
Zi
P4O �Zu1Zi5P4Zi5P4I �Zi50 (20)
Although the expression for all three models is thesame, the parameters estimated are different becauseof different conditional independence assumptions.
For user ua and item i we are interested in the con-ditional distribution of the overall rating, namely,
P4O � ua1 i5=P4ua1 i1O5
∑
O P4ua1 i1O50 (21)
The mode of this distribution of O is predicted as theoutput.2
2.6. Instance-Based ApproachesWe compare the performance of these proposed algo-rithms with several of the existing one-componentand multicomponent instance-based methods. As abaseline we use the framework proposed by Breeseet al. (1998):
¹Rtj =°Rt+
1∑Nu
i abs4sim4t1i55
Nu∑
i
sim4t1i54Rij −°Ri51 (22)
where the expected rating a user t would give toitem j is computed by ratings of other users weightedby similarity of those users to the target user t. One ofseveral metrics can be used to compute the similaritybetween two users who are represented by the vectorsof ratings they have given. Some choices are cosine,correlation, inverse Eucledian distance, etc. We usethe correlation coefficient to obtain baseline results,because it has often been used in the literature.
Adomavicius and Kwon (2007) have generalizedthe similarity measure in Equation (22) to the caseof ratings with multiple components. Their predictedrating can be summarized as
sim4t1 i5=1
1 + distu4t1 i51 (23)
distu4t1 i5=1
�Ut ∩Ui�
∑
l∈Ut∩Ui
distr 4Rtl1Ril51 (24)
where Ui is the set of ratings given by the user i.Several distance metrics are explored for distr
between two multicomponent ratings, such as1. Manhattan distance
∑
k
�Ri4k5−Rj4k5�3
2 Use of expectation of O to predict did not change the conclusionsof the experiments.
INFORMS
holds
copyrightto
this
article
and
distrib
uted
this
copy
asa
courtesy
tothe
author(s).
Add
ition
alinform
ation,
includ
ingrig
htsan
dpe
rmission
policies,
isav
ailableat
http://journa
ls.in
form
s.org/.

Sahoo et al.: The Halo Effect in Multicomponent Ratings and Its Implications for Recommender Systems240 Information Systems Research 23(1), pp. 231–246, © 2012 INFORMS
2. Euclidean distance√
∑
k
4Ri4k5−Rj4k5523
3. Chebyshev distance
maxk
�Ri4k5−Rj4k5�0
They found that the Chebyshev distance–basedapproach performs best among the distance-basedapproaches considered. The distance metrics proposedin Adomavicius and Kwon (2007) for multicom-ponent rating collaborative filtering do not takeinto account the correlation between rating compo-nents. One multidimensional distance measure thattakes into account correlation between dimensionsis Mahalanobis distance (Mahalanobis 1936). Maha-lanobis distance between two random vectors Ex andEy that are assumed to be drawn from one commondistribution is
distmaha4Ex1 Ey5=
√
4Ex− Ey5T S−14Ex− Ey51 (25)
where S is the covariance of the distribution. In oneset of experiments we use Mahalanobis distance. Thisis done using Equation (25) in Equations (23) and (24).We compute the covariance matrix from the ratingsused in the training data.
Because of the correlation among the componentratings, it is worth considering whether it would suf-fice to isolate the principal rating component througha principal component analysis and use that in a singlecomponent rating collaborative filtering algorithm. Weobtain the principal component of the multicompo-nent rating through a PCA rotation and compute thecorrelation between pairs of users based on their thusidentified principal component ratings on movies.After computing the similarity between the users, weuse original ratings in Equation (22) to compute thepredicted value of a user’s rating on a movie.
The set of collaborative filtering methods comparedis summarized in Table 7.
3. Results and Discussion3.1. Experiments with Random Training SamplesTo compare the effectiveness of the three models weuse a fraction of the user ratings to train our mod-els (training set) and the remaining ratings to test
Table 7 Set of Algorithms Compared
Model-based Instance-based
Multicomponent 1. 5 Dependent subratings 3. Chebyshev2. 5 Independent subratings 4. Mahalanobis
5. PCA
One component 6. Flexible mixture model 7. User-user correlation
the prediction (test set). A certain fraction of eachuser’s records was randomly selected to include inthe training data to make sure that there were sometraining data for each user in the test set. For eachuser-item pair in the test data we predict their overallrating 4O5 using each model. We calculate the meanabsolute error (MAE) of the predictions with the helpof the known ratings. We also evaluate the algorithms’ability to retrieve the highest rated items. These tworesults need not be correlated (Herlocker et al. 2004).Appropriateness of each depends on the applicationenvironment.
For an application where the recommended itemsare presented to the user along with a score for eachitem, it is important to predict the numerical valuesof the ratings accurately. One example of such anapplication environment can be found in the movierecommender system of Netflix. The rating predic-tion accuracy can be measured using the MAE of thepredictions:
MAE =1
Ltest
Ltest∑
l=1
�ol − ol�1
where Ltest = the number of records in the test data;ol = the true rating; and ol = the predicted rating.
However, in many other applications the user isonly presented with the top few items that he is likelyto rate highly. The numerical values of the items aredeemed of no interest. One example of such an appli-cation environment can be found at Amazon.com.Here, if the recommender system can identify the topfew items for the user with little noise, then it isconsidered to have fulfilled the requirement. It doesnot matter if all the predicted ratings are biased upor down, as long as the predicted ratings order theitems in the same way the user would, i.e., a relativelyhigher rating for items that the user would rate A fol-lowed by lower ratings to items that the user wouldrate B, and so on. This correctness of ordering of itemsfor users can be evaluated using precision-recall plots,precision at top five, or mean reciprocal rank (MRR).
To describe them briefly, assume for a moment thatthe user would be only interested in the items ratedA. Consider the top-N item predictions. Precision isthe fraction of the N items that the user would haverated A. Recall is the fraction of items that the userwould have rated A that are in the top N . With increas-ing N , more A-rated items are fetched, improvingrecall. But, at the same time, more of those items thatare rated less than A are also retrieved, damaging theprecision score. A good recommender system shouldbe able to retrieve many of the A-rated items whilemaintaining high precision. Hence, a plot of precisionat 11 standard recall levels 40%110%120%1 0 0 0 1100%5is commonly used to compare the performance of dif-ferent systems (Baeza-Yates and Ribeiro-Neto 1999).
INFORMS
holds
copyrightto
this
article
and
distrib
uted
this
copy
asa
courtesy
tothe
author(s).
Add
ition
alinform
ation,
includ
ingrig
htsan
dpe
rmission
policies,
isav
ailableat
http://journa
ls.in
form
s.org/.

Sahoo et al.: The Halo Effect in Multicomponent Ratings and Its Implications for Recommender SystemsInformation Systems Research 23(1), pp. 231–246, © 2012 INFORMS 241
Often in retrieval and recommendation tasks thequality of only the top few recommendations is ofinterest, because users typically do not look beyondthe first few items. We measure the quality of topitems recommended using two metrics:
1. Mean precision of the top five items recom-mended;
2. MRR of the first relevant item recommended(Voorhees 2000):
MRR =1
#users
#users∑
i
1rankfirstrelevant
0
MRR measures how soon a person gets a relevantrecommendation from the algorithm.
3.1.1. Accuracy in Rating Prediction. The aver-age MAE scores using 30 different random train/testpartitions are shown in Figure 7. As expected, theoverall error for each model decreases with increas-ing amounts of training data. However, we see that inthis set of results using Chebyshev and Mahalanobisdistance metrics in an instance-based multicompo-nent framework best predicts the rating values. Usingthe principal component after a PCA rotation ofthe five component ratings does not do any betteror worse than simply using the overall rating in acorrelation-based single-component rating algorithm.
However, one of the advantages of model-basedapproaches is that after training the models, the ratingprediction step is quick. Therefore, these approachesare more suitable for online recommendation genera-tions. If one is interested in using a model-based rec-ommender system, we have the following insights.Naively extending the existing FMM for collaborative
Figure 7 Plot of Errors by Amount of Training Data Used, forDifferent Models
0.6
0.7
0.8
0.9
1.0
1.1
1.2
0 0.1 0.2 0.3 0.4 0.5 0.6 0.7 0.8
MA
E
Training fraction
5 Dependent subratings5 Independed subratings5 Subrating (Chebyshev)1 Overall rating (FMM)1 Overall rating (Corr)5 Subratings PCA-rotation5 Subratings Maha
filtering with component ratings without consideringthe existing correlation among the component ratingsdoes not lead to any improvement in the prediction ofoverall ratings over using only one component rating.As discussed in §2.2, components of the ratings arecorrelated and assuming independence among themgiven latent class leads to overcounting of evidence.When we capture the dependence among the ratingcomponents through the Overall rating and explic-itly model for it, the prediction accuracy improves.Error plots of the two model-based algorithms, oneusing only the overall rating and the other using fivecomponents with dependency, show that there is anadvantage of using multicomponent ratings when thetraining set is small—up to about 30% of the availabledata set for training in this case. But when there areenough training data, using only the Overall ratingleads to more accurate prediction of Overall rating.This suggests that when we have a user’s Overall rat-ing over a large number of items, adding componentratings does not lead to any further improvement inthe ability to predict the Overall rating the user mightplace on a new item.
To verify that the differences in the average MAEseen in Figure 7 are significant and not a result ofchance, we performed a pairwise t-test using MAEobtained at the 30 different train/test splits. We foundthat the differences are indeed significant exceptwhere the error lines in Figure 7 cross.
3.1.2. Accuracy in Retrieving Top N Items. Theseven algorithms were trained as described in §2.4 atdifferent training set sizes. Then the ratings for eachuser-item pair in the test set were computed using theprediction function of each method. This creates anordering over the test item set for each user. A recom-mender system would recommend items from this listin decreasing order of predicted rating. The goal ofthe precision-recall curve is to find out how the preci-sion of the recommendation is affected as more itemsare included from this list in the pursuit of retriev-ing all the relevant items. In this set of experimentswe treat movies with a rating of 4 in the test set asrelevant. The precision versus recall curve is givenin Figure 8. A separate experiment that treats movieswith a rating of 3 or higher in the test set as relevantreturns similar results, albeit with a higher precisionvalue at each recall level because of the presence ofmore relevant items.
When the training fraction is low the model withdiscovered structure gives the highest precision ateach recall level. However, when we have moretraining data, the instance-based multicomponentrating algorithms using Chebyshev or Mahalanobisdistance do better. The instance-based approachesusing only the overall component or the principal
INFORMS
holds
copyrightto
this
article
and
distrib
uted
this
copy
asa
courtesy
tothe
author(s).
Add
ition
alinform
ation,
includ
ingrig
htsan
dpe
rmission
policies,
isav
ailableat
http://journa
ls.in
form
s.org/.

Sahoo et al.: The Halo Effect in Multicomponent Ratings and Its Implications for Recommender Systems242 Information Systems Research 23(1), pp. 231–246, © 2012 INFORMS
Figure 8 Typical Precision-Recall Curves with Sparse Training Data
Prec
isio
n
Recall
Precision-recall curve @ training fraction = 0.05
Recall
Precision-recall curve @ training fraction = 0.1
0 0.2 0.4 0.6 0.8 1.0 0 0.2 0.4 0.6 0.8 1.0
0.5
0.6
0.7
0.8
0.9
1.0
Prec
isio
n
0.5
0.6
0.7
0.8
0.9
1.05 Dependent subratings5 Independent subratings5 Subrating (Chebyshev)5 Subrating (Maha)5 Subrating (PCA)1 Overall rating (FMM) rating1 Overall rating (corr)
component have the worst precision. The model withindependence assumption among the componentratings returns the lowest precision among the model-based approaches.
We also compute the mean precision after top-fiveretrievals and MRRs of each algorithm at these train-ing fractions. The results shown in Figure 10 agreewith the general observation made in the precision-recall curves in Figure 8. Among the model-basedapproaches, the model with dependency structure per-forms best. However, as we use more training data,instance-based multicomponent rating approachesthat use Chebyshev or Mahalanobis distances outper-form the model-based approaches (Figure 9).
Figure 9 Typical Precision-Recall Curves with Less Sparse Training Data
0 0.2 0.4 0.6 0.8 1.0
Recall0 0.2 0.4 0.6 0.8 1.0
Recall
Precision-recall curve @ training fraction = 0.3
5 Dependent subratings5 Independent subratings5 Subrating (Chebyshev)5 Subrating (Maha)5 Subrating (PCA)1 Overall rating (FMM) rating1 Overall rating (corr)
0.5
0.6
0.7
0.8
0.9
1.0
0.5
0.6
0.7
0.8
0.9
1.0
Prec
isio
n
Prec
isio
n
Precision-recall curve @ training fraction = 0.8
Note. Instance-based algorithms using Chebyshev distance and Mahalanobis distance do best when we use 80% of the data for training.
One possible reason for better performance of model-based approaches over instance-based approacheswhen the training fractions are low is that the latterare based on pairwise similarity computations. Whenthe training data are sparse, the pairwise comparisonsof users are unreliable. However, the model-basedapproaches suffer less from these problems becauseeach user is effectively compared with a model of agroup of users that is less sparse. Thus the users areclassified into the correct class more accurately. How-ever, when there are more training data, the pairwiseuser-to-user comparisons can be done more reliably.This leads to improved performance of the instance-based multicomponent approaches.
INFORMS
holds
copyrightto
this
article
and
distrib
uted
this
copy
asa
courtesy
tothe
author(s).
Add
ition
alinform
ation,
includ
ingrig
htsan
dpe
rmission
policies,
isav
ailableat
http://journa
ls.in
form
s.org/.

Sahoo et al.: The Halo Effect in Multicomponent Ratings and Its Implications for Recommender SystemsInformation Systems Research 23(1), pp. 231–246, © 2012 INFORMS 243
Figure 10 Mean Precision at Top Five and Mean Reciprocal Rank
0.45
0.50
0.55
0.60
0.65
0.70
0 0.1 0.2 0.3 0.4 0.5 0.6 0.7 0.8
Mea
n pr
ecis
ion
at to
p fi
ve
Training fraction
0.65
0.70
0.75
0.80
0.85
0.90
0 0.1 0.2 0.3 0.4 0.5 0.6 0.7 0.8
Mea
n re
cipr
ocal
ran
k
Training fraction
Dependency model (5)
Independent model (5)
Cheby (5)
Overall rating model (1)
Corr (1)
PCA
Maha (5)
Hence, the takeaway from these tests is that wecan improve the rating prediction accuracy by using amulticomponent rating, although the right algorithmto use depends on the sparsity of the training data.It also depends on whether the recommender systemis being used to predict the ratings accurately or toretrieve the most relevant items quickly.
3.2. Filling in Missing Component RatingsRaters find it easier to form an overall impres-sion about their subject than to objectively evaluatespecific aspects of it (Feeley 2002). This leads to twokinds of problems in collecting multicomponent rat-ing data:
1. Halo effect. If they choose to rate the compo-nents without deliberating enough to evaluate themobjectively, rating values get biased by their overallimpression of the subject. This, known as the haloerror, is treated in §§1.2, 2.1, and 2.3.
Figure 11 Records with Partial Information
Complete 66% Some components 2%
Only overall 32%
Available ratings
CompleteSome componentsOnly overall
2. Missing values. If the raters choose to skip rat-ing the components, we have a missing data prob-lem for rating components. In our data set, 34% ofthe records (235,659 of 691,495) had incomplete rat-ing information and thus needed to be discarded forthe experiments described in the previous sections. Ofthose 235,695 incomplete records 225,515 (95%) haveonly the Overall rating (Figure 11). This indicates thedifficulty in obtaining component ratings from theusers.
There are two opportunities for contribution here:1. If we can predict the harder aspect ratings for a
user for an item taking the user’s Overall rating intoaccount, then we can design a rating support system.One use case is: the user gives his Overall rating onthe item and the system prefills the component rat-ings. Then the user confirms them or modifies themif he feels they are different from how he would rate.
2. If we can fill in the missing values in the dataset, we can generate recommendations for more users.Because we need a minimum number of ratings peruser in the data set, discarding incomplete recordseliminates many users, and consequently many oftheir records even with complete ratings. Table 8shows the difference between sizes of the data set
Table 8 Increase in Data Set Size After Filling in Missing Components
With unfilled Percentage ofcomponents Filled-in components increase
Number of users 11058 11680 59Number of items 31430 31926 14Number of records 451892 741110 61
INFORMS
holds
copyrightto
this
article
and
distrib
uted
this
copy
asa
courtesy
tothe
author(s).
Add
ition
alinform
ation,
includ
ingrig
htsan
dpe
rmission
policies,
isav
ailableat
http://journa
ls.in
form
s.org/.
Sahoo et al.: The Halo Effect in Multicomponent Ratings and Its Implications for Recommender Systems244 Information Systems Research 23(1), pp. 231–246, © 2012 INFORMS
when we discard the incomplete records and when wefill in the missing values using the method describedin this section.
We showed in §2 that the probability distributionover all the variables can be factored as
P4U1 ER1 I5 =∑
Zu1Zi
P4Zu5P4Zi5P4I �Zi5P4U �Zu5
·
5∏
j=1
P4Rj �Zu1Zi1PaRj50 (26)
Because we always have Overall ratings in our data,we focus on predicting missing component ratings. Tomake an inference about one of the component ratingssuch as S using the values of U , I , and O variables,we need to carry out two operations on distributiongiven in Equation (26):
1. Marginalize away the variables we do not need,i.e., Rj ∈A1D1V
2. Plug in the values of the variable we have. Let’sdenote them as u1 i1 and o.The operations result in the following:
P4U1I1S1O5
=∑
Zu
P4Zu5∑
Zi
P4Zi5P4O �Zu1Zi5P4I �Zi5
·P4U �Zu5P4S �Zu1Zi1O51
⇒P4u1i1S1o5=∑
Zu
P4Zu5∑
Zi
P4Zi5P4o �Zu1Zi5
·P4i �Zi5P4u �Zu5P4S �Zu1Zi1o51
∝P4S �u1i1o50
The result is a function of S that is proportional toits posterior distribution given the variable valuesu1 i1ando. The mode of this distribution is output asthe predicted value of S.
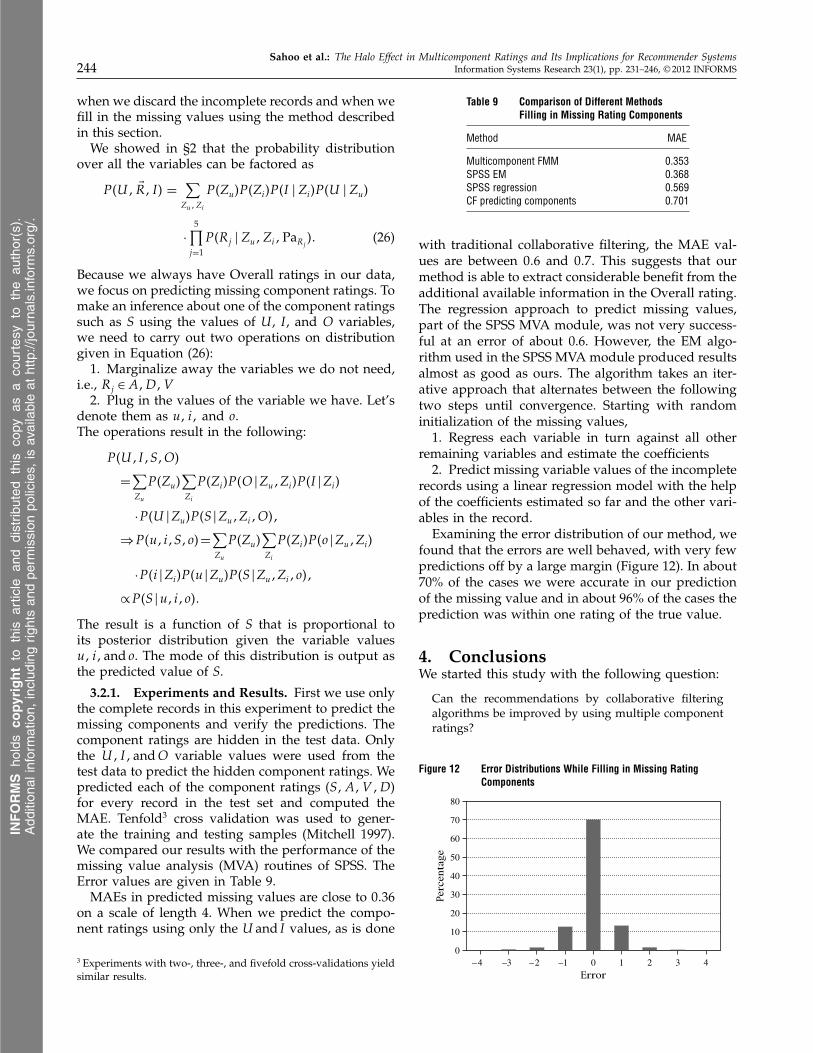
3.2.1. Experiments and Results. First we use onlythe complete records in this experiment to predict themissing components and verify the predictions. Thecomponent ratings are hidden in the test data. Onlythe U1 I1andO variable values were used from thetest data to predict the hidden component ratings. Wepredicted each of the component ratings (S1A1V 1D)for every record in the test set and computed theMAE. Tenfold3 cross validation was used to gener-ate the training and testing samples (Mitchell 1997).We compared our results with the performance of themissing value analysis (MVA) routines of SPSS. TheError values are given in Table 9.
MAEs in predicted missing values are close to 0036on a scale of length 4. When we predict the compo-nent ratings using only the U and I values, as is done
3 Experiments with two-, three-, and fivefold cross-validations yieldsimilar results.
Table 9 Comparison of Different MethodsFilling in Missing Rating Components
Method MAE
Multicomponent FMM 0.353SPSS EM 0.368SPSS regression 0.569CF predicting components 0.701
with traditional collaborative filtering, the MAE val-ues are between 006 and 007. This suggests that ourmethod is able to extract considerable benefit from theadditional available information in the Overall rating.The regression approach to predict missing values,part of the SPSS MVA module, was not very success-ful at an error of about 0.6. However, the EM algo-rithm used in the SPSS MVA module produced resultsalmost as good as ours. The algorithm takes an iter-ative approach that alternates between the followingtwo steps until convergence. Starting with randominitialization of the missing values,
1. Regress each variable in turn against all otherremaining variables and estimate the coefficients
2. Predict missing variable values of the incompleterecords using a linear regression model with the helpof the coefficients estimated so far and the other vari-ables in the record.
Examining the error distribution of our method, wefound that the errors are well behaved, with very fewpredictions off by a large margin (Figure 12). In about70% of the cases we were accurate in our predictionof the missing value and in about 96% of the cases theprediction was within one rating of the true value.
4. ConclusionsWe started this study with the following question:
Can the recommendations by collaborative filteringalgorithms be improved by using multiple componentratings?
Figure 12 Error Distributions While Filling in Missing RatingComponents
–4 –3 –2 –1 0 1 2 3 40
10
20
30
40
50
60
70
80
Error
Perc
enta
ge
INFORMS
holds
copyrightto
this
article
and
distrib
uted
this
copy
asa
courtesy
tothe
author(s).
Add
ition
alinform
ation,
includ
ingrig
htsan
dpe
rmission
policies,
isav
ailableat
http://journa
ls.in
form
s.org/.

Sahoo et al.: The Halo Effect in Multicomponent Ratings and Its Implications for Recommender SystemsInformation Systems Research 23(1), pp. 231–246, © 2012 INFORMS 245
To answer this question we collected multicompo-nent movie rating data from Yahoo! Movies. Becausecomponent ratings are correlated due to halo effect,a structure discovery exercise was carried out to findthe dependency tree that captures most of the depen-dencies among the components. The discovered struc-ture is interesting in itself. It says that the componentratings provided by the users are more correlated tothe Overall ratings than they are to other componentratings. This suggests the possible relation betweenthe Overall impression of the user and the ratingsgiven to the components. In this context we draw aconnection to the work on the halo effect in the psy-chometric literature. The body of work on halo effectindicates that component ratings are influenced by thepresence of other strong factors and by the Overallimpression.
We develop a mixture model-based collabora-tive filtering algorithm incorporating the discovereddependency structure. In addition, several one-com-ponent algorithms and their variations for multi-component ratings were evaluated on the collecteddata set. The multicomponent rating algorithms leadto better performance than the one-component rat-ing algorithms in both predicting the rating val-ues accurately and in retrieving the most relevantmovies quickly. The model-based algorithm usingdependency structure leads to better retrieval perfor-mance when the training data are sparse. However,when more training data are available, using instance-based multicomponent rating approaches that useChebyshev or Mahalanobis distance to measure dis-tance between two ratings perform better. In addition,these two instance-based multicomponent rating algo-rithms are able to predict the ratings more accuratelythan other algorithms that we tested.
One of the advantages of the model-based app-roaches is that after the model is calibrated, it canbe used to quickly generate recommendations. Thismakes them suitable for scenarios like shopping web-sites where real-time recommendation generation isimportant. When the training data are sparse—a com-mon problem faced in real-world scenarios—there isan advantage of using multicomponent ratings in amodel that accounts for the halo effect. However, ifwe have more training data, one component ratingflexible mixture model is able to better predict the rat-ings than other model-based approaches.
The proposed multicomponent model can be usedto predict values of the missing component ratings.This is useful because in the current data set approx-imately one-third of the records have one or moreof the component ratings missing. We show that themissing values can be filled in reliably. This allows usto generate recommendations for 59% more users andto recommend 14% more items.
Multicomponent rating collaborative filtering algo-rithms can suffer because of poor data. One can arguethat objectively rating aspects of an item requiresdeliberation that can only be expected from profes-sional critiques. This can cause the halo effect andreduce the information in the components. In thiswork we provide an approach to use the limited butimportant information in the components to makebetter recommendations. However, with increasedemphasis on user-generated content and on valuableservices using them, we expect the quality of suchdata to improve. The proposed algorithm will be evenmore valuable in such a scenario.
Our work suggests several future research direc-tions. One of foremost importance is the evaluationof the proposed method in other multicomponent rat-ing data sets. Also, in the presence of adequate num-bers of ratings, a more complete dependency graphamong the ratings might be discovered and used, asit will better capture the dependency among the rat-ing components. We have shown that the proposedmodel can be used to fill in the missing rating compo-nents. Such an approach can be used to design a ratersupport system that predicts a user’s component rat-ings using his overall rating. But such a system mightbias the rater. The implementation and evaluation ofsuch a rater support system is an interesting topicto explore.
ReferencesAdomavicius, G., Y. O. Kwon. 2007. New recommendation tech-
niques for multicriteria rating systems. IEEE Intelligent Systems22(3) 48–55.
Adomavicius, G., A. Tuzhilin. 2005. Toward the next generationof recommender systems: A survey of the state-of-the-art andpossible extensions. IEEE Trans. Knowledge Data Engrg. 17(6)734–749.
Adomavicius, G., R. Sankaranarayanan, S. Sen, A. Tuzhilin. 2005.Incorporating contextual information in recommender systemsusing a multidimensional approach. ACM Trans. InformationSystems 23(1) 103–145.
Baeza-Yates, R. A., B. A. Ribeiro-Neto. 1999. Modern InformationRetrieval. ACM Press, Addison-Wesley, New York.
Billsus, D., M. J. Pazzani. 1998. Learning Collaborative InformationFilters. Morgan Kaufmann Publishers, San Francisco.
Borgatta, E. F., J. H. Mann, L. S. Cottrell. 1958. The spectrum of indi-vidual interaction characteristics: An interdimensional analy-sis. Psych. Rep. 4 279–319.
Borman, W. C. 1979. Format and training effects on rating accuracy.J. Appl. Psych. 64(4) 410–421.
Breese, J. S., D. Heckerman, C. Kadie. 1998. Empirical analysisof predictive algorithms for collaborative filtering. Technicalreport, Microsoft Research, Redmond, WA.
Chien, Y. H., E. I. George. 1999. A Bayesian model for col-laborative filtering. Proc. 7th Internat. Workshop on Artifi-cial Intelligence Statist., FT Lauderdale, FL. http://uncertainty99.microsoft.com/proceedings.com.
Chow, C. K., C. N. Liu. 1968. Approximating discrete probabilitydistributions with dependence trees. IEEE Trans. InformationTheory 14(3) 462–467.
Cooper, W. H. 1981. Ubiquitous halo. Psych. Bull. 90(2) 218–244.
INFORMS
holds
copyrightto
this
article
and
distrib
uted
this
copy
asa
courtesy
tothe
author(s).
Add
ition
alinform
ation,
includ
ingrig
htsan
dpe
rmission
policies,
isav
ailableat
http://journa
ls.in
form
s.org/.

Sahoo et al.: The Halo Effect in Multicomponent Ratings and Its Implications for Recommender Systems246 Information Systems Research 23(1), pp. 231–246, © 2012 INFORMS
Dempster, A. P., N. M. Laird, D. B. Rubin. 1977. Maximum likeli-hood from incomplete data via the EM algorithm. J. Roy. Statist.Soc. 39(1) 1–38.
Feeley, T. H. 2002. Comment on halo effects in rating and evaluationresearch. Human Comm. Res. 28(4) 578–586.
Fisicaro, S. A. 1988. A reexamination of the relation between haloerror and accuracy. J. Appl. Psych. 73(2) 239–244.
Getoor, L., M. Sahami. 1999. Using probabilistic relational modelsfor collaborative filtering. Workshop on Web Usage Analysis UserProfiling (WEBKDD’99), San Diego.
Green, P. E., V. Srinivasan. 1978. Conjoint analysis in consumerresearch: Issues and outlook. J. Consumer Res. 5(2) 103–123.
Heckerman, D., D. M. Chickering, C. Meek, R. Rounthwaite,C. Kadie. 2001. Dependency networks for inference, collabo-rative filtering, and data visualization. J. Machine Learn. Res.1 49–75.
Heneman, H. G. 1974. Comparision of self and superior ratings ofmanagerial performance. J. Appl. Psych. 59(5) 638–642.
Herlocker, J. L., J. A. Konstan, L. G. Terveen, J. T. Riedl. 2004. Evalu-ating collaborative filtering recommender systems. ACM Trans.Inform. Systems 22(1) 5–53.
Hofmann, T. 2004. Latent semantic models for collaborative filter-ing. ACM Trans. Inform. Systems (TOIS) 22(1) 89–115.
Hofmann, T., J. Puzicha. 1999. Latent class models for collaborativefiltering. D. Thomas, ed. Proc. 16th Internat. Joint Conf. ArtificialIntelligence (IJCAI-99-Vol2), Morgan Kaufmann Publishers, SanFrancisco, 688–693.
Holzbach, R. L. 1978. Rater bias in performance ratings: Superior,self, and peer ratings. J. Appl. Psych. 63(5) 579–588.
Ivancevich, J. M. 1979. Longtudinal study of the effects of ratertraining on psychometric error in ratings. J. Appl. Psych. 64(5)502–508.
Kafry, D., S. Zedeck, R. Jacobs. 1979. Discriminability in multidi-mensional performance evaluations. Appl. Psych. Measurement3(2) 187–192.
Kevin, R. M., D. H. Reynolds. 1988. Does true halo affect observedhalo? J. Appl. Psych. 73(2) 235–238.
Koller, D., N. Friedman. 2009. Structured Probabilistic Models: Princi-ples and Techniques. MIT Press, Cambridge, MA.
Koltuv, B. B. 1962. Some characteristics of intrajudge trait intercor-relations. Psych. Monograph 76 1–24.
Landy, F. J., J. L. Farr. 1980. Performance rating. Psych. Bull.87(1) 72–107.
Landy, F. J., R. J. Vance, J. L. Barnes-Farrell, J. W. Steele. 1980. Statis-tical control of halo error in performance ratings. J. Appl. Psych.65(5) 501–506.
Latham, G. P., E. D. Pursell, K. N. Wexley. 1980. Training managersto minimize rating errors in observation of behavior. J. Appl.Psych. 60(5) 550–555.
Lee, H. H., W. G. Teng. 2007. Incorporating multi-criteria ratingsin recommendation systems. IEEE Internat. Conf. Inform. Reuseand Integration, Las Vegas, NV, 273–278.
MacKay, D. J. C. 2003. Information Theory, Inference, and LearningAlgorithms. Cambridge University Press, New York.
Mahalanobis, P. C. 1936. On the generalised distance in statistics.Proc. Natl. Inst. Sci. 2(1) 49–55.
Mitchell, T. 1997. Machine Learning. McGraw-Hill Book Company,New York.
Moon, S., G. J. Russell. 2008. Predicting product purchase frominferred customer similarity: An autologistic model approach.Management Sci. 54(1) 71–82.
Morrison, D. F. 1967. Multivariate Statistical Methods. McGraw-HillBook Company, New York.
Myers, J. H. 1965. Removing halo from job evaluation factor struc-ture. J. Appl. Psych. 49(3) 217–221.
Netflix, Inc. 2006. Form 10-K annual report pursuant to Section 13or 15(d) of the Securities Exchange Act of 1934. United StatesSecurities and Exchange Commission, Washington, DC.
Friedman, N., M. Goldszmidt. 1998. Learning in Graphical Mod-els, Chapter 15. Kluwer Academic Publishers, Dordrecht, TheNetherlands, 431–432.
Pearl, J. 2000. Causality: Models, Reasoning, and Inference. CambridgeUniversity Press, New York.
Resnick, P., N. Iacovou, M. Suchak, P. Bergstrom, J. Riedl. 1994.GroupLens: An open architecture for collaborative filteringof netnews. Proc. Conf. Comput.-Supported Cooperative Work,CSCW’94, Chapel Hill, NC, 175–186.
Rizzo, W. A., F. D. Frank. 1977. Influence of irrelevant cues andalternate forms of graphic rating scales on the halo effect. Per-sonnel Psych. 30(3) 405–417.
Shardanand, U., P. Maes. 1995. Social information filtering: Algo-rithms for automating “word of mouth.” In CHI: Proc. SIGCHIConf. Human Factors Computing Systems, ACM Press/Addison-Wesley Publishing, New York, 210–217.
Shweder, R. A. 1975. How relevant is an individual difference inpersonality? J. Personality 43(3) 455–484.
Shweder, R. A., R. G. D’Andrade. 1980. The systematic distortionhypothesis. R. A. Schweder, D. W. Fiske, eds. New Directionsfor Methodology of Behavioral Science: Fallible Judgment BehavioralRes. Jossey Bass, San Franciso, 37–58.
Si, L., R. Jin. 2003. Flexible mixture model for collaborative filtering.Proc. Twentieth Internat. Conf. Machine Learning (ICML), AAAIPress, San Francisco, 704–711.
Thorndike, E. L. 1920. A constant error in psychological ratings.J. Appl. Psych. 4(1) 25–29.
Ungar, L. H., D. P. Foster. 1998. Clustering methods for collabo-rative filtering. Proc. Workshop Recommendation Systems, AAAI,Menlo Park, CA, 112–125.
Voorhees, E. M. 2000. The TREC-8 question answering trackreport. Proc. Eighth Text Retrieval Conf., Gaithersburg, MD.http://trec.nist.gov/pubs/trec8/t8_proceedings.html, 77–82.
Wells, F. L. 1907. A Statistical Study of Literary Merit. R. S. Wood-worth, ed. Science Press, New York.
INFORMS
holds
copyrightto
this
article
and
distrib
uted
this
copy
asa
courtesy
tothe
author(s).
Add
ition
alinform
ation,
includ
ingrig
htsan
dpe
rmission
policies,
isav
ailableat
http://journa
ls.in
form
s.org/.