the h-r diagram physical astronomy professor lee carkner lecture 8
Post on 19-Dec-2015
214 views
TRANSCRIPT

The H-R Diagram
Physical Astronomy
Professor Lee Carkner
Lecture 8

Questions1) Temperature by spectrum shape
2, 5, 3, 1, 4 Where spectrum peaks, from short to long
wavelength
2) Rank the stars in order of the strength of hydrogen lines (strongest to weakest)
5, 3, 1, 4, 2 5 and 3 are strong, 1,4,2 hard to see
3) Rank the stars in order of temperature (hottest to coolest)using the color of the images
2 and 5, 3, 1 and 4 2 and 5 are blue, 3 is white,1 and 4 are reddish

Questions4) Rank the stars in order of temperature (hottest to
coolest) by combining all the information together 2, 5, 3, 1, 4 2 and 5 are hottest, but 2 has no H lines
5) Estimate a spectral type for each star 1 – G 2 – O 3 – F 4 – K 5 – A
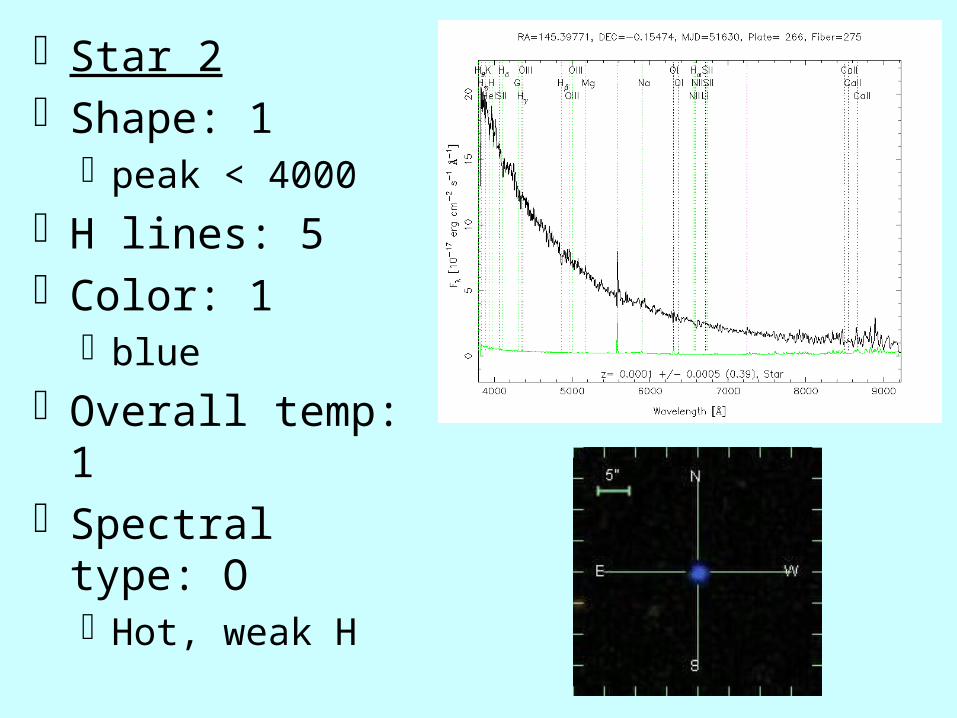
Star 2 Shape: 1
peak < 4000
H lines: 5 Color: 1
blue
Overall temp: 1 Spectral type: O
Hot, weak H

Star 5 Shape: 2
peak ~4000
H lines: 1 Color: 1
blue
Overall temp: 2 Spectral type: A
Hot, strong H

Star 3 Shape: 3
peak ~5000
H lines: 2 Color: 3
white
Overall temp: 3 Spectral type: F
Medium hot, medium H

Star 1 Shape: 4
peak ~6500
H lines: 3 Color: 5
reddish?
Overall temp: 4 Spectral type: G
cool, strong Ca?

Star 4 Shape: 5
peak ~8000
H lines: 4 Color: 5
red-orange
Overall temp: 5 Spectral type: K
coolest, strong Ca

Spectral Type
Start by ordering by strength of hydrogen lines (A, B, C …)
From high temperature (early-type) to low temperature (late-type):
O B A F G K M L T e.g., B9, A0, A1, A2 … A9, F0, F1

The H-R Diagram
We can measure m and d to get M
We can find spectral type
How are they related?
Luminosity increases for increasing temperature Main sequence

Luminosity Class These stars are more or less luminous than main
sequence stars of the same temperature
Main sequence stars are dwarfs
Giant stars also tend to have narrower lines
Represent stars in different stages of their lives

Luminosity Classes
0 – hypergiantI – II – bright giantIII – IV – subgiantV –
Red dwarfBrown dwarf
IV – D (VII) – white dwarf
Red dwarf
Brown dwarf
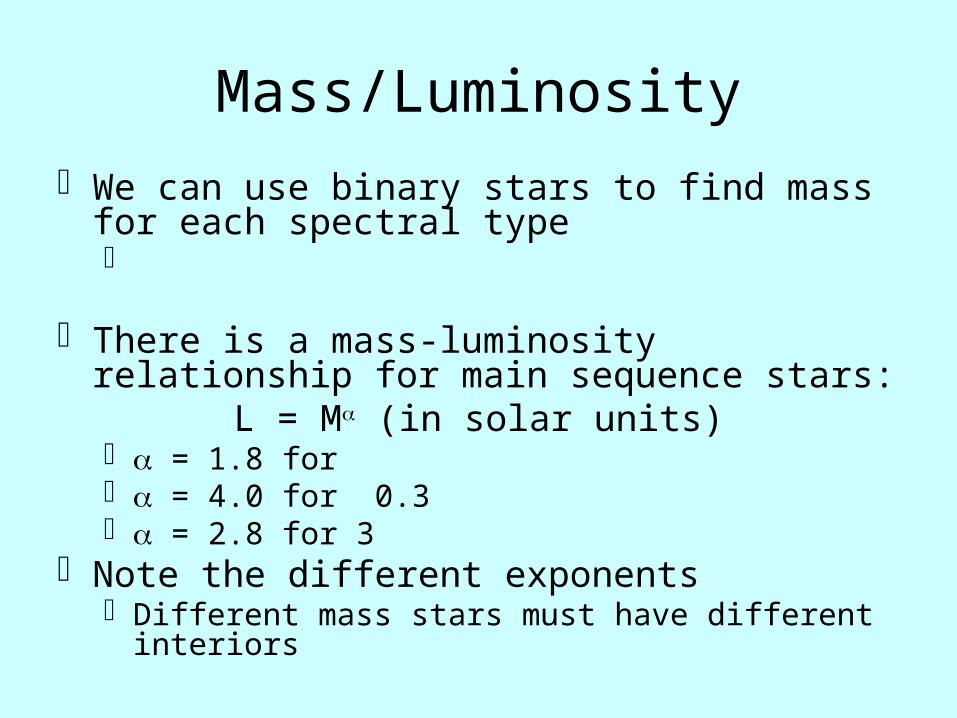
Mass/Luminosity
We can use binary stars to find mass for each spectral type
There is a mass-luminosity relationship for main sequence stars:
L = M (in solar units) = 1.8 for = 4.0 for 0.3 = 2.8 for 3
Note the different exponents Different mass stars must have different interiors

Density
Main sequence stars have similar density Giants have low density
White dwarfs have high density Similar masses to MS stars, but much smaller
radius

Spectroscopic Parallax
If we take a star’s spectrum we can find temperature and luminosity class
d = 10(m-M+5)/5
Not very accurate, but easy to do

Next Time
Read: 10.1-10.2 Homework: 10.3, 10.4, 10.22