the gross domestic - bermuda · 2017-10-27 · gross domestic product (gdp) in constant prices by...
TRANSCRIPT

GROSS DOMESTIC PRODUCT
October 2017 2016 HIGHLIGHTS
**Note to reader** – the GDP analysis has shifted to focus on Real GDP compared to
Nominal GDP as in previous publications.
Real GDP down by 0.1 per cent
Real GDP decreased 0.1 per cent to $4.6 billion in 2016 (Figure 1; Table 1). Values for real GDP
are adjusted for inflation to remove the impact of changes in price levels, providing a more accurate
figure of economic growth. The largest value declines in real terms were recorded for the financial
intermediation and international business industries which decreased by $35.1 million and $28.6
million, respectively. In contrast, the construction industry recorded the largest gain in value added
of $13.2 million.
In 2016, average price levels as measured by the selected basket of goods and services in the
Consumer Price Index (CPI) increased 1.4 per cent. Alternatively, average price levels for all goods
and services produced in the economy (economy-wide inflation) as measured by the GDP Implicit
Price Index (IPI) increased 3.6 per cent (Table 7). Including inflation, GDP in current prices
increased 3.4 per cent compared to 2015 (Figure 2; Table 4).
National Accounts Aggregates
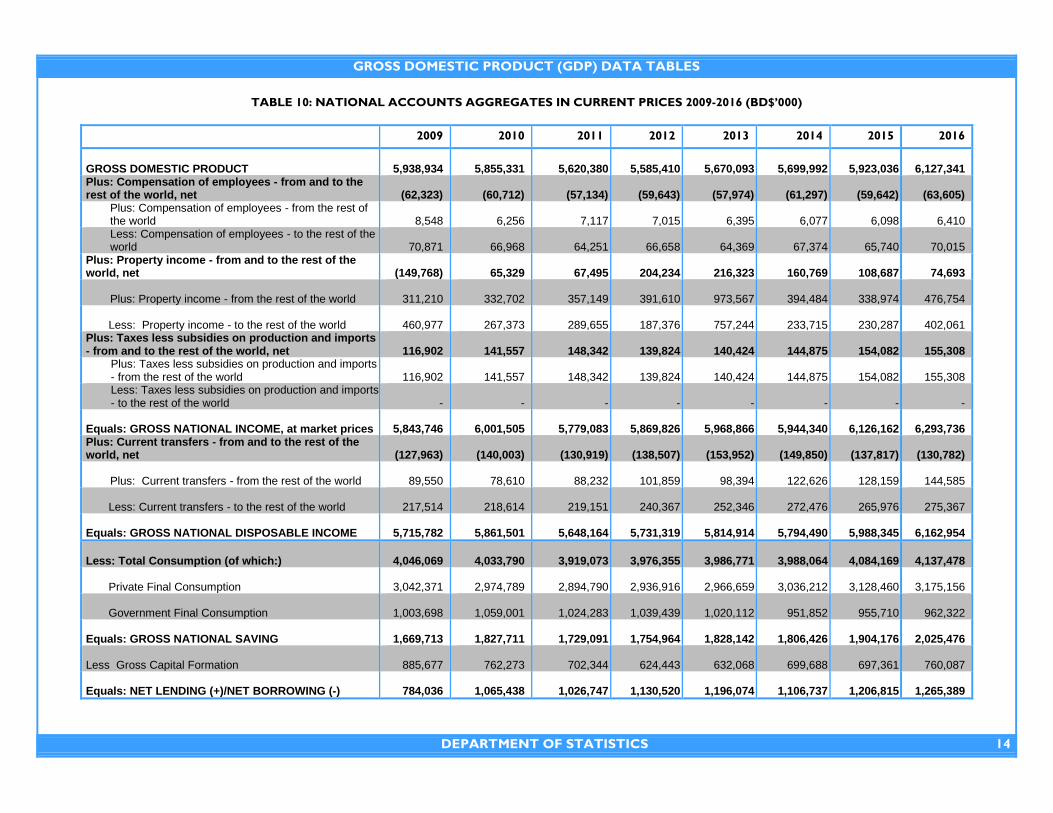
At the end of 2016, Gross National Disposable Income (GNDI) reached $6.2 billion (Table 10).
GNDI represents the income that can be used by households for consumption or savings as well as
the income not distributed to owners of equity for non-financial and financial corporations. GNDI
increased 2.9 per cent compared to 2015 due mostly to a higher GDP. After adjusting GNDI for
consumption expenditure, Gross National Savings was measured at $2.0 billion (Table 10) which
represented a 6.4 per cent increase year-over-year. Of the total savings, $760.1 million was spent on
gross capital formation (investment in capital goods) which positioned the Bermuda economy as a
net lender to the rest of the world in the amount of $1.3 billion.
-4.0
-2.0
-0.3
0.6
-0.1
(5.0)
(4.0)
(3.0)
(2.0)
(1.0)
-
1.0
2012 2013 2014 2015 2016
Figure 1 GDP IN CONSTANT PRICES (Real GDP)
(adjusted for inflation)
Year
%
chan
ge
-0.6
1.5
0.5
3.9
3.4
(1.0)
-
1.0
2.0
3.0
4.0
5.0
2012 2013 2014 2015 2016
Figure 2 GDP IN CURRENT PRICES (Nominal GDP)
(with inflation)
Year
%
chan
ge
GROSS DOMESTIC PRODUCT (GDP) IN CONSTANT PRICES BY INDUSTRY - 2016 HIGHLIGHTS
DEPARTMENT OF STATISTICS 2
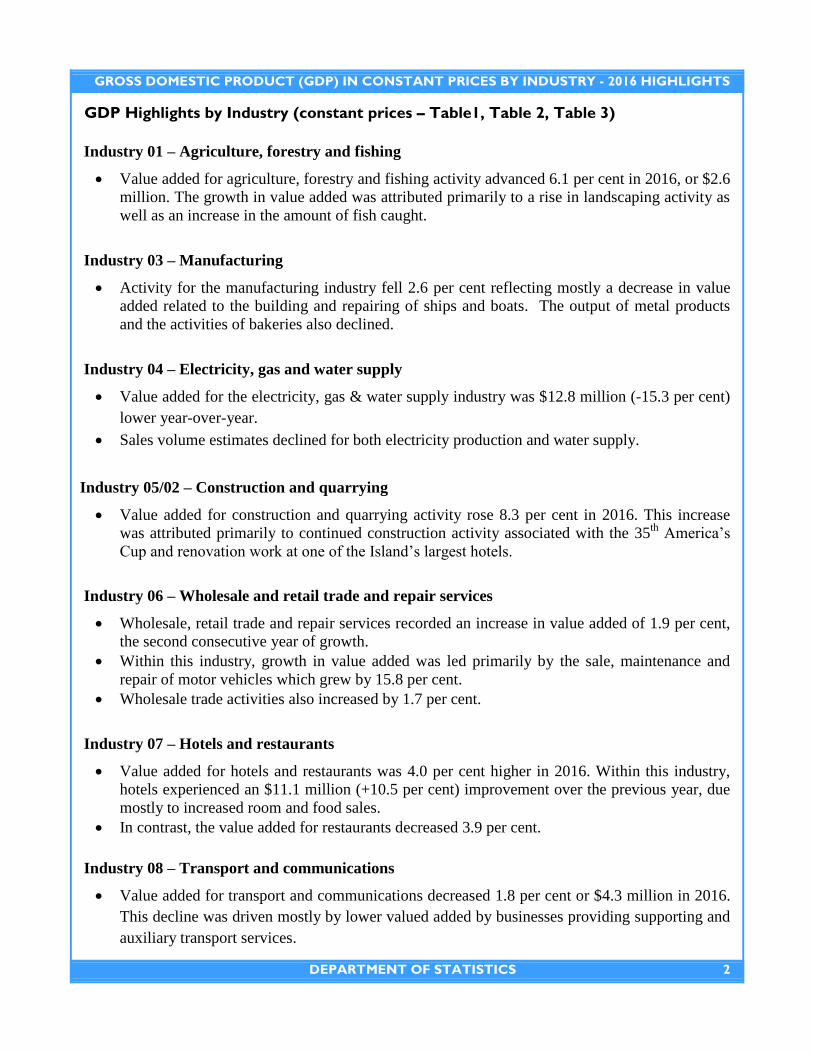
GDP Highlights by Industry (constant prices – Table1, Table 2, Table 3)
Industry 01 – Agriculture, forestry and fishing
Value added for agriculture, forestry and fishing activity advanced 6.1 per cent in 2016, or $2.6
million. The growth in value added was attributed primarily to a rise in landscaping activity as
well as an increase in the amount of fish caught.
Industry 03 – Manufacturing
Activity for the manufacturing industry fell 2.6 per cent reflecting mostly a decrease in value
added related to the building and repairing of ships and boats. The output of metal products
and the activities of bakeries also declined.
Industry 04 – Electricity, gas and water supply
Value added for the electricity, gas & water supply industry was $12.8 million (-15.3 per cent)
lower year-over-year.
Sales volume estimates declined for both electricity production and water supply.
Industry 05/02 – Construction and quarrying
Value added for construction and quarrying activity rose 8.3 per cent in 2016. This increase
was attributed primarily to continued construction activity associated with the 35th
America’s
Cup and renovation work at one of the Island’s largest hotels.
Industry 06 – Wholesale and retail trade and repair services
Wholesale, retail trade and repair services recorded an increase in value added of 1.9 per cent,
the second consecutive year of growth.
Within this industry, growth in value added was led primarily by the sale, maintenance and
repair of motor vehicles which grew by 15.8 per cent.
Wholesale trade activities also increased by 1.7 per cent.
Industry 07 – Hotels and restaurants
Value added for hotels and restaurants was 4.0 per cent higher in 2016. Within this industry,
hotels experienced an $11.1 million (+10.5 per cent) improvement over the previous year, due
mostly to increased room and food sales.
In contrast, the value added for restaurants decreased 3.9 per cent.
Industry 08 – Transport and communications
Value added for transport and communications decreased 1.8 per cent or $4.3 million in 2016.
This decline was driven mostly by lower valued added by businesses providing supporting and
auxiliary transport services.

GROSS DOMESTIC PRODUCT (GDP) IN CONSTANT PRICES BY INDUSTRY - 2016 HIGHLIGHTS
DEPARTMENT OF STATISTICS 3
Industry 09 – Financial intermediation
Value added for businesses involved in financial intermediation (commercial banks and
insurance companies) decreased 5.3 per cent. This decline was attributed mostly to lower
holdings of loans and deposits by commercial banks, which offset an increase in valued added
by non-life insurance companies.
Industry 10 – Real estate and renting activity
Value added for the real estate and renting industry rose 0.8 per cent. This industry remained the
second highest contributor to GDP, contributing 17.5 per cent in 2016. The increase can be
attributed to the rise in the imputed rent for owner-occupied dwellings.
Industry 11 – Business activities
Value added for business services increased 2.2 per cent over 2015. This increase was led by
higher sales of architectural and engineering activities (+24.0 per cent), and other business
activities such as building cleaning and the provision of security services.
Industry 12 – Public administration
Continued reductions in wages, salaries and employee overheads led to a decline in
government spending and a 3.3 per cent decrease in value added to the Bermuda economy.
Industry 13 – Education, health and social work
Value added for education, health and social work activity increased 1.8 per cent, or $5.9
million in 2016. Private health activities and government hospital activities experienced the
largest increases in output.
Industry 14 – Other community, social and personal services
Other community, social and personal services increased 10.2 per cent, or $9.1 million in 2016.
This improvement was due to recreational, cultural & sporting activities related to the 35th
America’s Cup.
Industry 15 – International business activity
Value added by the international business industry decreased 2.3 per cent in 2016. This
industry was the largest contributor to GDP, representing 26.3 per cent of total GDP.
The number of hours worked and the value of output declined within the international business
industry due mostly to businesses offering insurance risk-taking activities, including insurance
underwriting services and reinsurance services.
In contrast, businesses offering insurance management, actuarial services, insurance claims
adjustment services and insurance and pension consultancy services recorded increases in
value added in 2016.

GROSS DOMESTIC PRODUCT (GDP) DATA TABLES
DEPARTMENT OF STATISTICS 4
TABLE 1: GDP AT CONSTANT MARKET PRICES, 2006 = 100 (BD$'000)1
INDUSTRIAL SECTIONS 2008 2009 2010 2011 2012 2013 2014 2015 2016
01 Agriculture, forestry and fishing 50,897 48,343 47,896 45,963 42,638 43,119 39,890 43,210 45,833
03 Manufacturing 86,063 85,992 79,613 74,981 63,792 58,607 54,995 54,674 53,239
04 Electricity, gas and water supply 106,862 95,244 91,038 98,320 91,028 88,594 86,274 84,006 71,160
05/02 Construction & Quarrying 342,530 288,517 227,661 176,214 151,849 148,899 149,870 159,061 172,242
06 Wholesale and retail trade and repair services 362,187 354,973 331,701 310,110 298,777 294,380 293,446 297,272 303,019
07 Hotels and restaurants 254,989 223,689 241,875 243,338 240,294 223,370 203,865 191,536 199,269
08 Transport and communications 294,716 274,689 264,815 245,885 234,951 242,926 248,035 246,244 241,925
09 Financial intermediation 777,680 685,389 690,547 707,740 663,508 670,451 653,371 664,657 629,542
10 Real estate and renting activities 833,374 847,779 845,914 833,638 817,937 806,086 800,599 804,348 810,450
11 Business activities 496,907 478,935 448,277 448,162 420,807 395,143 394,776 402,721 411,732
12 Public Administration 279,358 289,935 291,652 268,521 273,191 270,158 252,743 253,470 245,006
13 Education, health and social work 364,246 355,338 356,438 352,014 353,942 338,532 313,795 323,540 329,430
14 Other community, social and personal services 112,336 104,255 102,549 97,468 95,135 88,582 83,600 89,579 98,728
15 International business activity 1,443,926 1,336,043 1,337,950 1,268,872 1,195,383 1,195,273 1,241,367 1,248,546 1,219,951
Total 5,806,070 5,469,120 5,357,927 5,171,226 4,943,231 4,864,120 4,816,625 4,862,863 4,831,525
Less : Imputed bank service charge 439,476 422,000 436,952 470,146 431,021 442,201 405,333 425,535 398,597
Add : Taxes and duties on imports 242,930 228,831 224,179 216,367 206,828 203,518 201,531 203,465 202,152
GDP at constant market prices 5,609,524 5,275,951 5,145,154 4,917,447 4,719,038 4,625,437 4,612,822 4,640,793 4,635,082
Percentage change from previous year 1.1% -5.9% -2.5% -4.4% -4.0% -2.0% -0.3% 0.6% -0.1%
1 The data shown are the most recent estimates of GDP and include any revisions to industry sectors due to revised figures obtained from businesses during the annual Economic Activity Survey. In general, figures for the most recent year are to be regarded as provisional.

GROSS DOMESTIC PRODUCT (GDP) DATA TABLES
DEPARTMENT OF STATISTICS 5
TABLE 2: PERCENTAGE CHANGE OF GDP AT CONSTANT MARKET PRICES, 2006=1001
INDUSTRIAL SECTIONS 2009 2010 2011 2012 2013 2014 2015 2016
5 - Year
Average
(2012-2016)
01 Agriculture, forestry and fishing -5.0% -0.9% -4.0% -7.2% 1.1% -7.5% 8.3% 6.1% 0.2%
03 Manufacturing -0.1% -7.4% -5.8% -14.9% -8.1% -6.2% -0.6% -2.6% -6.5%
04 Electricity, gas and water supply -10.9% -4.4% 8.0% -7.4% -2.7% -2.6% -2.6% -15.3% -6.1%
05/02 Construction & Quarrying -15.8% -21.1% -22.6% -13.8% -1.9% 0.7% 6.1% 8.3% -0.1%
06 Wholesale and retail trade and repair services -2.0% -6.6% -6.5% -3.7% -1.5% -0.3% 1.3% 1.9% -0.4%
07 Hotels and restaurants -12.3% 8.1% 0.6% -1.3% -7.0% -8.7% -6.0% 4.0% -3.8%
08 Transport and communications -6.8% -3.6% -7.1% -4.4% 3.4% 2.1% -0.7% -1.8% -0.3%
09 Financial intermediation -11.9% 0.8% 2.5% -6.2% 1.0% -2.5% 1.7% -5.3% -2.3%
10 Real estate and renting activities 1.7% -0.2% -1.5% -1.9% -1.4% -0.7% 0.5% 0.8% -0.6%
11 Business activities -3.6% -6.4% 0.0% -6.1% -6.1% -0.1% 2.0% 2.2% -1.6%
12 Public Administration 3.8% 0.6% -7.9% 1.7% -1.1% -6.4% 0.3% -3.3% -1.8%
13 Education, health and social work -2.4% 0.3% -1.2% 0.5% -4.4% -7.3% 3.1% 1.8% -1.2%
14 Other community, social and personal services -7.2% -1.6% -5.0% -2.4% -6.9% -5.6% 7.2% 10.2% 0.5%
15 International business activity -7.5% 0.1% -5.2% -5.8% 0.0% 3.9% 0.6% -2.3% -0.7%
Total -5.8% -2.0% -3.5% -4.4% -1.6% -1.0% 1.0% -0.6% -1.3%
Less : Imputed bank service charge -4.0% 3.5% 7.6% -8.3% 2.6% -8.3% 5.0% -6.3% -3.1%
Add : Taxes and duties on imports -5.8% -2.0% -3.5% -4.4% -1.6% -1.0% 1.0% -0.6% -1.3%
GDP at constant market prices -5.9% -2.5% -4.4% -4.0% -2.0% -0.3% 0.6% -0.1% -1.2%
1 User interpretation: During the past 5 years (2012 - 2016), GDP growth averaged -1.2%.

GROSS DOMESTIC PRODUCT (GDP) DATA TABLES
DEPARTMENT OF STATISTICS 6
TABLE 3: PROPORTION OF GDP AT CONSTANT MARKET PRICES, 2006 = 100
INDUSTRIAL SECTIONS 2008 2009 2010 2011 2012 2013 2014 2015 2016
01 Agriculture, forestry and fishing 0.9% 0.9% 0.9% 0.9% 0.9% 0.9% 0.9% 0.9% 1.0%
03 Manufacturing 1.5% 1.6% 1.5% 1.5% 1.4% 1.3% 1.2% 1.2% 1.1%
04 Electricity, gas and water supply 1.9% 1.8% 1.8% 2.0% 1.9% 1.9% 1.9% 1.8% 1.5%
05/02 Construction & Quarrying 6.1% 5.5% 4.4% 3.6% 3.2% 3.2% 3.2% 3.4% 3.7%
06 Wholesale and retail trade and repair services 6.5% 6.7% 6.4% 6.3% 6.3% 6.4% 6.4% 6.4% 6.5%
07 Hotels and restaurants 4.5% 4.2% 4.7% 4.9% 5.1% 4.8% 4.4% 4.1% 4.3%
08 Transport and communications 5.3% 5.2% 5.1% 5.0% 5.0% 5.3% 5.4% 5.3% 5.2%
09 Financial intermediation 13.9% 13.0% 13.4% 14.4% 14.1% 14.5% 14.2% 14.3% 13.6%
10 Real estate and renting activities 14.9% 16.1% 16.4% 17.0% 17.3% 17.4% 17.4% 17.3% 17.5%
11 Business activities 8.9% 9.1% 8.7% 9.1% 8.9% 8.5% 8.6% 8.7% 8.9%
12 Public Administration 5.0% 5.5% 5.7% 5.5% 5.8% 5.8% 5.5% 5.5% 5.3%
13 Education, health and social work 6.5% 6.7% 6.9% 7.2% 7.5% 7.3% 6.8% 7.0% 7.1%
14 Other community, social and personal services 2.0% 2.0% 2.0% 2.0% 2.0% 1.9% 1.8% 1.9% 2.1%
15 International business activity 25.7% 25.3% 26.0% 25.8% 25.3% 25.8% 26.9% 26.9% 26.3%
Total 103.5% 103.7% 104.1% 105.2% 104.8% 105.2% 104.4% 104.8% 104.2%
Less : Imputed bank service charge -7.8% -8.0% -8.5% -9.6% -9.1% -9.6% -8.8% -9.2% -8.6%
Add : Taxes and duties on imports 4.3% 4.3% 4.4% 4.4% 4.4% 4.4% 4.4% 4.4% 4.4%
GDP at constant market prices 100.0% 100.0% 100.0% 100.0% 100.0% 100.0% 100.0% 100.0% 100.0%

GROSS DOMESTIC PRODUCT (GDP) DATA TABLES
DEPARTMENT OF STATISTICS 7
TABLE 4: GDP AT CURRENT MARKET PRICES (BD$'000)1
INDUSTRIAL SECTIONS 2008 2009 2010 2011 2012 2013 2014 2015 2016
01 Agriculture, forestry and fishing 48,301 42,987 42,971 43,782 41,023 41,539 36,732 41,877 52,260
03 Manufacturing 90,043 76,916 74,799 65,214 52,102 49,078 44,388 49,114 46,471
04 Electricity, gas and water supply 97,783 96,825 96,518 97,644 86,598 83,677 86,728 92,724 97,565
05/02 Construction & Quarrying 370,078 317,531 260,556 203,776 177,278 177,697 178,685 190,606 210,982
06 Wholesale and retail trade and repair services 435,354 419,377 412,488 381,961 373,340 372,056 376,099 416,937 443,056
07 Hotels and restaurants 308,039 253,103 269,554 263,838 246,945 261,906 262,205 263,011 290,853
08 Transport and communications 322,177 307,079 288,390 265,765 268,693 269,419 259,267 245,393 274,549
09 Financial intermediation 943,800 685,821 682,777 719,640 729,916 714,128 721,737 706,320 733,472
10 Real estate and renting activities 895,198 933,645 954,323 960,311 954,379 948,247 962,994 979,741 1,002,070
11 Business activities 587,677 578,749 558,124 535,089 507,559 480,446 525,030 532,405 563,383
12 Public Administration 306,593 339,225 345,487 331,318 340,427 341,204 323,355 327,379 319,747
13 Education, health and social work 399,745 403,512 435,408 468,298 485,254 489,715 463,929 491,013 504,939
14 Other community, social and personal services 122,659 116,753 126,685 122,650 120,750 112,499 111,203 126,427 144,233
15 International business activity 1,602,222 1,539,537 1,537,360 1,432,012 1,455,409 1,570,036 1,575,025 1,659,278 1,675,644
Total 6,529,668 6,111,059 6,085,438 5,891,299 5,839,672 5,911,648 5,927,377 6,122,226 6,359,223
Less : Imputed bank service charge 578,228 395,483 425,232 450,856 423,955 416,506 398,855 393,205 441,366
Add : Taxes and duties on imports 227,250 223,358 195,125 179,936 169,693 174,951 171,470 194,015 209,484
GDP at current market prices 6,178,691 5,938,934 5,855,331 5,620,380 5,585,410 5,670,093 5,699,992 5,923,036 6,127,341
Percentage change from previous year 4.8% -3.9% -1.4% -4.0% -0.6% 1.5% 0.5% 3.9% 3.4%
1 The data shown are the most recent estimates of GDP and include any revisions to industry sectors due to revised figures obtained from businesses during the
annual Economic Activity Survey. In general, figures for the most recent year are to be regarded as provisional.

GROSS DOMESTIC PRODUCT (GDP) DATA TABLES
DEPARTMENT OF STATISTICS 8
TABLE 5: PERCENTAGE CHANGE OF GDP AT CURRENT MARKET PRICES
INDUSTRIAL SECTIONS 2009 2010 2011 2012 2013 2014 2015 2016
5 - Year
Average
(2012-2016)
01 Agriculture, forestry and fishing -11.0% 0.0% 1.9% -6.3% 1.3% -11.6% 14.0% 24.8% 4.4%
03 Manufacturing -14.6% -2.8% -12.8% -20.1% -5.8% -9.6% 10.6% -5.4% -6.0%
04 Electricity, gas and water supply -1.0% -0.3% 1.2% -11.3% -3.4% 3.6% 6.9% 5.2% 0.2%
05/02 Construction & Quarrying -14.2% -17.9% -21.8% -13.0% 0.2% 0.6% 6.7% 10.7% 1.0%
06 Wholesale and retail trade and repair services -3.7% -1.6% -7.4% -2.3% -0.3% 1.1% 10.9% 6.3% 3.1%
07 Hotels and restaurants -17.8% 6.5% -2.1% -6.4% 6.1% 0.1% 0.3% 10.6% 2.1%
08 Transport and communications -4.7% -6.1% -7.8% 1.1% 0.3% -3.8% -5.4% 11.9% 0.8%
09 Financial intermediation -27.3% -0.4% 5.4% 1.4% -2.2% 1.1% -2.1% 3.8% 0.4%
10 Real estate and renting activities 4.3% 2.2% 0.6% -0.6% -0.6% 1.6% 1.7% 2.3% 0.9%
11 Business activities -1.5% -3.6% -4.1% -5.1% -5.3% 9.3% 1.4% 5.8% 1.2%
12 Public Administration 10.6% 1.8% -4.1% 2.7% 0.2% -5.2% 1.2% -2.3% -0.7%
13 Education, health and social work 0.9% 7.9% 7.6% 3.6% 0.9% -5.3% 5.8% 2.8% 1.6%
14 Other community, social and personal services -4.8% 8.5% -3.2% -1.5% -6.8% -1.2% 13.7% 14.1% 3.6%
15 International business activity -3.9% -0.1% -6.9% 1.6% 7.9% 0.3% 5.3% 1.0% 3.2%
Total -6.4% -0.4% -3.2% -0.9% 1.2% 0.3% 3.3% 3.9% 1.6%
Less : Imputed bank service charge -31.6% 7.5% 6.0% -6.0% -1.8% -4.2% -1.4% 12.2% -0.2%
Add : Taxes and duties on imports -1.7% -12.6% -7.8% -5.7% 3.1% -2.0% 13.1% 8.0% 3.3%
GDP at current market prices -3.9% -1.4% -4.0% -0.6% 1.5% 0.5% 3.9% 3.4% 1.8%

GROSS DOMESTIC PRODUCT (GDP) DATA TABLES
DEPARTMENT OF STATISTICS 9
TABLE 6: PROPORTION OF GDP AT CURRENT MARKET PRICES
INDUSTRIAL SECTIONS 2008 2009 2010 2011 2012 2013 2014 2015 2016
01 Agriculture, forestry and fishing 0.8% 0.7% 0.7% 0.8% 0.7% 0.7% 0.6% 0.7% 0.9%
03 Manufacturing 1.5% 1.3% 1.3% 1.2% 0.9% 0.9% 0.8% 0.8% 0.8%
04 Electricity, gas and water supply 1.6% 1.6% 1.6% 1.7% 1.6% 1.5% 1.5% 1.6% 1.6%
05/02 Construction & Quarrying 6.0% 5.3% 4.4% 3.6% 3.2% 3.1% 3.1% 3.2% 3.4%
06 Wholesale and retail trade and repair services 7.0% 7.1% 7.0% 6.8% 6.7% 6.6% 6.6% 7.0% 7.2%
07 Hotels and restaurants 5.0% 4.3% 4.6% 4.7% 4.4% 4.6% 4.6% 4.4% 4.7%
08 Transport and communications 5.2% 5.2% 4.9% 4.7% 4.8% 4.8% 4.5% 4.1% 4.5%
09 Financial intermediation 15.3% 11.5% 11.7% 12.8% 13.1% 12.6% 12.7% 11.9% 12.0%
10 Real estate and renting activities 14.5% 15.7% 16.3% 17.1% 17.1% 16.7% 16.9% 16.5% 16.4%
11 Business activities 9.5% 9.7% 9.5% 9.5% 9.1% 8.5% 9.2% 9.0% 9.2%
12 Public Administration 5.0% 5.7% 5.9% 5.9% 6.1% 6.0% 5.7% 5.5% 5.2%
13 Education, health and social work 6.5% 6.8% 7.4% 8.3% 8.7% 8.6% 8.1% 8.3% 8.2%
14 Other community, social and personal services 2.0% 2.0% 2.2% 2.2% 2.2% 2.0% 2.0% 2.1% 2.4%
15 International business activity 25.9% 25.9% 26.3% 25.5% 26.1% 27.7% 27.6% 28.0% 27.3%
Total 105.7% 102.9% 103.9% 104.8% 104.6% 104.3% 104.0% 103.4% 103.8%
Less : Imputed bank service charge -9.4% -6.7% -7.3% -8.0% -7.6% -7.3% -7.0% -6.6% -7.2%
Add : Taxes and duties on imports 3.7% 3.8% 3.3% 3.2% 3.0% 3.1% 3.0% 3.3% 3.4%
GDP at current market prices 100.0% 100.0% 100.0% 100.0% 100.0% 100.0% 100.0% 100.0% 100.0%

GROSS DOMESTIC PRODUCT (GDP) DATA TABLES
DEPARTMENT OF STATISTICS 10
TABLE 7: IMPLICIT PRICE INDEX, 2006 = 100
INDUSTRIAL SECTIONS 2008 2009 2010 2011 2012 2013 2014 2015 2016
01 Agriculture, forestry and fishing 94.9 88.9 89.7 95.3 96.2 96.3 92.1 96.9 114.0
03 Manufacturing 104.6 89.4 94.0 87.0 81.7 83.7 80.7 89.8 87.3
04 Electricity, gas and water supply 91.5 101.7 106.0 99.3 95.1 94.5 100.5 110.4 137.1
05/02 Construction & Quarrying 108.0 110.1 114.4 115.6 116.7 119.3 119.2 119.8 122.5
06 Wholesale and retail trade and repair services 120.2 118.1 124.4 123.2 125.0 126.4 128.2 140.3 146.2
07 Hotels and restaurants 120.8 113.1 111.4 108.4 102.8 117.3 128.6 137.3 146.0
08 Transport and communications 109.3 111.8 108.9 108.1 114.4 110.9 104.5 99.7 113.5
09 Financial intermediation 121.4 100.1 98.9 101.7 110.0 106.5 110.5 106.3 116.5
10 Real estate and renting activities 107.4 110.1 112.8 115.2 116.7 117.6 120.3 121.8 123.6
11 Business activities 118.3 120.8 124.5 119.4 120.6 121.6 133.0 132.2 136.8
12 Public Administration 109.7 117.0 118.5 123.4 124.6 126.3 127.9 129.2 130.5
13 Education, health and social work 109.7 113.6 122.2 133.0 137.1 144.7 147.8 151.8 153.3
14 Other community, social and personal services 109.2 112.0 123.5 125.8 126.9 127.0 133.0 141.1 146.1
15 International business activity 111.0 115.2 114.9 112.9 121.8 131.4 126.9 132.9 137.4
Total 112.5 111.7 113.6 113.9 118.1 121.5 123.1 125.9 131.6
Less : Imputed bank service charge 131.6 93.7 97.3 95.9 98.4 94.2 98.4 92.4 110.7
Add : Taxes and duties on imports 93.5 97.6 87.0 83.2 82.0 86.0 85.1 95.4 103.6
GDP at constant market prices 110.1 112.6 113.8 114.3 118.4 122.6 123.6 127.6 132.2
GDP IPI percentage change 3.6% 2.2% 1.1% 0.4% 3.6% 3.6% 0.8% 3.3% 3.6%
CPI percentage change 4.8% 1.8% 2.4% 2.7% 2.4% 1.8% 2.0% 1.5% 1.4%

GROSS DOMESTIC PRODUCT (GDP) DATA TABLES
DEPARTMENT OF STATISTICS 11
TABLE 8: PRODUCTION AND COST COMPONENTS OF VALUE ADDED IN CURRENT BASIC PRICES 2016 (BD$’000)
Production Components Cost Components
INDUSTRIAL SECTIONS
Gross
Value
Added
Gross
Output
Intermediate
Consumption
Compensation
of Employees Depreciation
Operating
Surplus/
Mixed Income
Other Taxes
less Subsidies
on Production
01 Agriculture, forestry and fishing
52,260
73,888 21,629 33,407 755 15,437 2,662
03 Manufacturing
46,471
98,307 51,835 33,580 3,218 6,861 2,813
04 Electricity and water
97,565
217,306 119,741 39,495 26,069 27,616 4,385
05/02 Construction & Quarrying
210,982
452,057 241,075 136,281 4,883 59,697 10,122
06 Wholesale and Retail Trade and Repair Services
443,056
626,083 183,028 267,805 21,785 135,956 17,509
061 Sale and maintenance of motor vehicles
61,650
91,938 30,288 27,216 2,075 29,985 2,374
062 Wholesale Trade
112,779
146,491 33,712 61,622 7,802 37,709 5,647
063 Retail Trade
268,627
387,654 119,028 178,967 11,909 68,262 9,488
07 Hotel and restaurants
290,853
523,131 232,278 234,309 36,063 11,648 8,833
071 Accommodation
188,444
317,775 129,331 151,794 31,633 (714) 5,732
072 Restaurants and Bars
102,408
205,356 102,947 82,515 4,430 12,361 3,102
08 Transport and communications
274,549
475,411 200,861 136,193 31,610 89,599 17,148
081 Transport
101,204
196,639 95,435 64,932 3,438 29,468 3,367
082 Communications
173,345
278,772 105,427 71,261 28,173 60,131 13,781
09 Financial intermediation
733,472
1,037,595 304,123 374,553 70,952 239,265 48,702
091 Monetary and other financial intermediation
535,317
681,929 146,612 258,546 56,344 194,502 25,926
092 Insurance and Pension Funding
145,332
285,811 140,480 86,624 13,800 26,342 18,566
093 Activities auxiliary to financial intermediation
52,822
69,855 17,032 29,383 808 18,421 4,210

GROSS DOMESTIC PRODUCT (GDP) DATA TABLES
DEPARTMENT OF STATISTICS 12
TABLE 8 (CONT’D) : PRODUCTION AND COST COMPONENTS OF VALUE ADDED IN CURRENT BASIC PRICES 2016 (BD$’000)
Notes: 1 Compensation of Employees for real estate activities is captured under the category "operating surplus/mixed income"
Production Components Cost Components
INDUSTRIAL SECTIONS Gross Value
Added
Gross
Output
Intermediate
Consumption
Compensation
of Employees Depreciation
Operating Surplus/
Mixed Income
Other Taxes less Subsidies
on Production
10 Real estate and renting
1,002,070
1,286,534 284,464 28,9491 59,148 887,261
1 26,712
11 Business activities
563,383
735,056 171,673 368,004 10,375 150,104 34,901
12 Public administration
319,747
445,668 125,921 319,732 - - 15
13 Education, health & social work
504,939
678,350 173,411 37,025 8,626 438,683 20,605
131 Education
137,885
166,121 28,236 2,790 6,328 109,145 19,622
132 Health
336,262
467,288 131,026 6,051 227 329,384 599
133 Social work activities
30,793
44,941 14,148 28,183 2,071 154 385
14 Other community, social and personal services
144,233
210,038 65,806 119,508 9,981 7,911 6,833
15 International business activity
1,675,644
2,204,021 528,377 1,437,910 - - 237,733
151 Financial and Insurance Activities
1,490,129
1,812,770 322,640 1,352,323 - - 137,806
152 Non-Financial Activities
93,017
112,223 19,206 85,587 - - 7,430
159 Other International Business Activities
92,497
279,029 186,531 - - - 92,497
Add: Taxes and duties on imports
209,484
Less: Imputed Bank Service Charge
441,366
GDP at market prices
6,127,341

GROSS DOMESTIC PRODUCT (GDP) DATA TABLES
DEPARTMENT OF STATISTICS 13
TABLE 9: CROSS CLASSIFICATION OF VALUE ADDED BY INDUSTRIES AND INSTITUTIONAL SECTORS 2016, CURRENT PRICES (BD$’000)
Notes: 1 Data for non-profit institutions serving households have been aggregated with non-financial corporations to maintain confidentiality.
INDUSTRIAL SECTIONS Total Non-Financial
Corporations1
Financial
Corporations General Government Households
01 Agriculture, forestry and fishing 52,260 52,260 - - -
03 Manufacturing 46,471 46,471 - - -
04 Electricity, gas and water supply 97,565 96,280 - 1,284 -
05/02 Construction & Quarrying 210,982 196,613 - 14,369 -
06 Wholesale and retail trade and repair services 443,056 443,056 - - -
07 Hotels and restaurants 290,853 290,853 - - -
08 Transport and communications 274,549 235,694 - 38,855 -
09 Financial intermediation 733,472 - 733,472 -
10 Real estate and renting activities 1,002,070 484,047 - 19,095 498,929
11 Business activities 563,383 563,383 - -
12 Public Administration 319,747 - - 319,747 -
13 Education, health and social work 504,939 186,863 - 318,076 -
14 Other community, social and personal services 144,233 115,421 - 13,062 15,749
15 International business activity 1,675,644 185,514 1,490,129 -
Total 6,359,223 2,896,456 2,223,601 724,488 514,677
Add : Taxes and duties on imports 209,484
Less : Imputed bank service charge 441,366
GDP at current market prices 6,127,341
GROSS DOMESTIC PRODUCT (GDP) DATA TABLES
DEPARTMENT OF STATISTICS 14
TABLE 10: NATIONAL ACCOUNTS AGGREGATES IN CURRENT PRICES 2009-2016 (BD$’000)
2009 2010 2011 2012 2013 2014 2015 2016
GROSS DOMESTIC PRODUCT
5,938,934
5,855,331
5,620,380
5,585,410
5,670,093
5,699,992
5,923,036
6,127,341 Plus: Compensation of employees - from and to the rest of the world, net
(62,323)
(60,712)
(57,134)
(59,643)
(57,974)
(61,297)
(59,642)
(63,605)
Plus: Compensation of employees - from the rest of the world
8,548
6,256
7,117
7,015
6,395
6,077
6,098
6,410
Less: Compensation of employees - to the rest of the world
70,871
66,968
64,251
66,658
64,369
67,374
65,740
70,015
Plus: Property income - from and to the rest of the world, net
(149,768)
65,329
67,495
204,234
216,323
160,769
108,687
74,693
Plus: Property income - from the rest of the world
311,210
332,702
357,149
391,610
973,567
394,484
338,974
476,754
Less: Property income - to the rest of the world
460,977
267,373
289,655
187,376
757,244
233,715
230,287
402,061 Plus: Taxes less subsidies on production and imports - from and to the rest of the world, net
116,902
141,557
148,342
139,824
140,424
144,875
154,082
155,308
Plus: Taxes less subsidies on production and imports - from the rest of the world
116,902
141,557
148,342
139,824
140,424
144,875
154,082
155,308
Less: Taxes less subsidies on production and imports - to the rest of the world
-
-
-
-
-
-
-
-
Equals: GROSS NATIONAL INCOME, at market prices
5,843,746
6,001,505
5,779,083
5,869,826
5,968,866
5,944,340
6,126,162
6,293,736 Plus: Current transfers - from and to the rest of the world, net
(127,963)
(140,003)
(130,919)
(138,507)
(153,952)
(149,850)
(137,817)
(130,782)
Plus: Current transfers - from the rest of the world
89,550
78,610
88,232
101,859
98,394
122,626
128,159
144,585
Less: Current transfers - to the rest of the world
217,514
218,614
219,151
240,367
252,346
272,476
265,976
275,367
Equals: GROSS NATIONAL DISPOSABLE INCOME
5,715,782
5,861,501
5,648,164
5,731,319
5,814,914
5,794,490
5,988,345
6,162,954
Less: Total Consumption (of which:)
4,046,069
4,033,790
3,919,073
3,976,355
3,986,771
3,988,064
4,084,169
4,137,478
Private Final Consumption
3,042,371
2,974,789
2,894,790
2,936,916
2,966,659
3,036,212
3,128,460
3,175,156
Government Final Consumption
1,003,698
1,059,001
1,024,283
1,039,439
1,020,112
951,852
955,710
962,322
Equals: GROSS NATIONAL SAVING
1,669,713
1,827,711
1,729,091
1,754,964
1,828,142
1,806,426
1,904,176
2,025,476
Less Gross Capital Formation
885,677
762,273
702,344
624,443
632,068
699,688
697,361
760,087
Equals: NET LENDING (+)/NET BORROWING (-)
784,036
1,065,438
1,026,747
1,130,520
1,196,074
1,106,737
1,206,815
1,265,389

GROSS DOMESTIC PRODUCT (GDP) DATA TABLES
DEPARTMENT OF STATISTICS 15
TABLE 11: EXPENDITURE ON GROSS DOMESTIC PRODUCT IN CURRENT PRICES 2009- 2016 (BD$’000)
EXPENDITURE COMPONENTS 2009 2010 2011 2012 2013 2014 2015 2016
TOTAL CONSUMPTION (C)
4,044,890
4,030,742
3,919,887
3,976,945
3,980,836
3,976,628
4,079,301 4,179,877
Private
3,041,192
2,971,741
2,895,604
2,937,506
2,960,724
3,024,776
3,117,295
3,204,498
General Government
1,003,698
1,059,001
1,024,283
1,039,439
1,020,112
951,852 962,006 975,379
GROSS CAPITAL FORMATION (I)
885,677
762,273
702,344
624,443
626,222
686,042 686,818 766,428
Construction
545,972
414,994
367,423
308,442
308,331
358,326 374,734 427,282
Machinery
339,705
347,279
334,921
316,002
317,890
327,715
312,084
339,146 GOODS & NON-FACTOR SERVICES (X-M)
1,052,326
1,149,551
1,115,196
1,037,604
1,035,846
989,955
1,076,709 1,066,950
Exports of Goods
39,100
25,115
23,061
21,443
23,507
21,181 21,439 17,990
Exports of Non-Factor Services
2,828,167
2,883,396
2,843,913
2,768,890
2,862,777
2,860,084
2,901,969 2,955,751
Imports of Goods
984,250
876,179
814,947
820,597
920,479
903,883
854,410
887,831
Imports of Non-Factor Services
830,690
882,782
936,831
932,132
929,959
987,428 992,289 1,018,960 EXPENDITURE ON GDP IN CURRENT PRICES
5,982,893
5,942,565
5,737,427
5,638,993
5,642,904
5,652,625
5,842,828 6,013,255
STATISTICAL DISCREPANCY
(43,959)
(87,234)
(117,047)
(53,582)
27,189
47,368 80,208 114,085
GROSS DOMESTIC PRODUCT
DEPARTMENT OF STATISTICS 16
Gross domestic product (GDP) is a measure of economic activity which captures the value of goods and
services produced within a country during a given period. GDP can be expressed in nominal or real terms.
Nominal GDP (GDP in current prices) reflects the value of all the goods and services produced during a given
period, using their price at the time of production.
Real GDP (GDP in constant prices) also reflects the value of produced goods and services, but it uses constant
consumer and producer price indices to remove the effects of rising price levels (inflation).
Published by the Government of Bermuda
October 2017
Department of Statistics
Cedar Park Centre,
48 Cedar Avenue, Hamilton HM 11, Bermuda
P.O. Box HM 3015
Hamilton HM MX, Bermuda
Tel: (441) 297-7761, Fax: (441) 295-8390
E-mail: [email protected]
Website: www.gov.bm/department/statistics
Definitions