the great troubleshooting encounter - eclipse · 2015-06-18 · the great troubleshooting...
TRANSCRIPT
The great troubleshooting encounter:
CDT meets Trace CompassEclipseCon, March 2015
Marc Khouzam
Marc-André Laperle

22
Marc Khouzam
Software Developer at Ericsson since 1998
CDT project co-lead, focusing on Debugging
Working with CDT since 2009
Marc-André Laperle
Software Developer at Ericsson since 2013
Committer for Trace Compass, CDT and Linux Tools
Contributor to other projects (Platform UI, SWT, EGit, Mylyn, PDE)
ABOUT US

3
AGENDA
A bit of background: Debug and Tracing
CDT Debug and Trace Compass integration
– An integration in 4 parts
Conclusion

A little background:
Advanced Debugging

55
Non-Stop Debugging
› Program continues execution while suspending some threads
› Reduced intrusiveness

6
DYNAMIC PRINTFINSERTED AT RUNTIME
WITH GDB
DYNAMIC-PRINTF
COMPILEDPRINTF
DEBUGGER
› Sometimes traces are necessary
› Printf without recompiling or redeploying!

7
OS Awareness
Sockets
Shared Memory Segments
Process Groups
All Processes
All Threads
File Descriptors
Loaded Kernel Modules
Semaphores
Message Queues
› Access to system information while debugging

More background:
Tracing with
Trace Compass
9
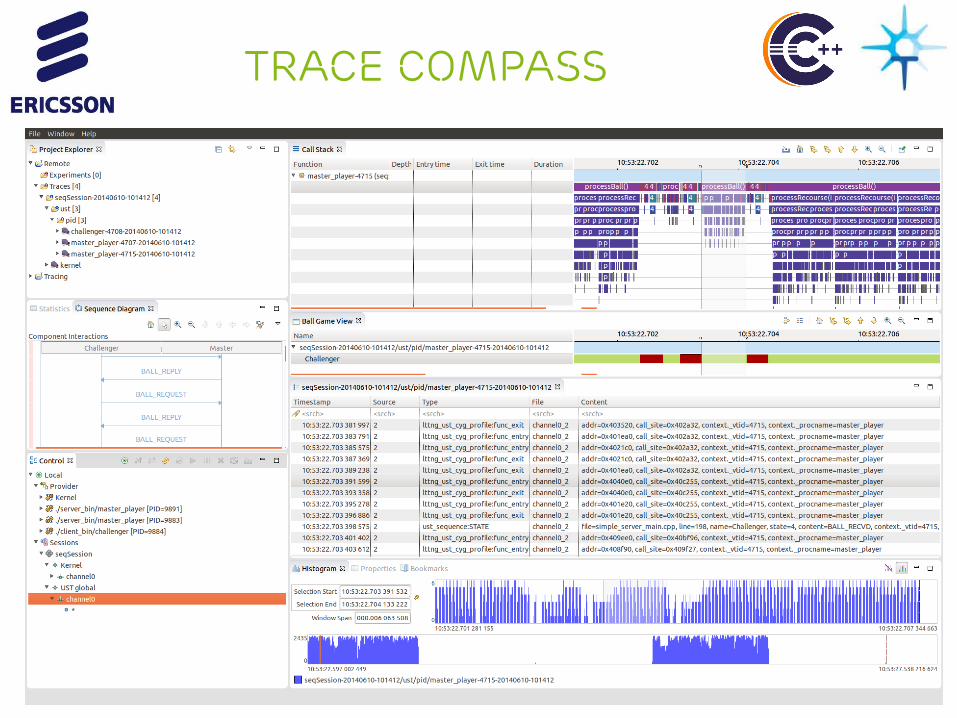
TRACE COMPASS
10
Common Features
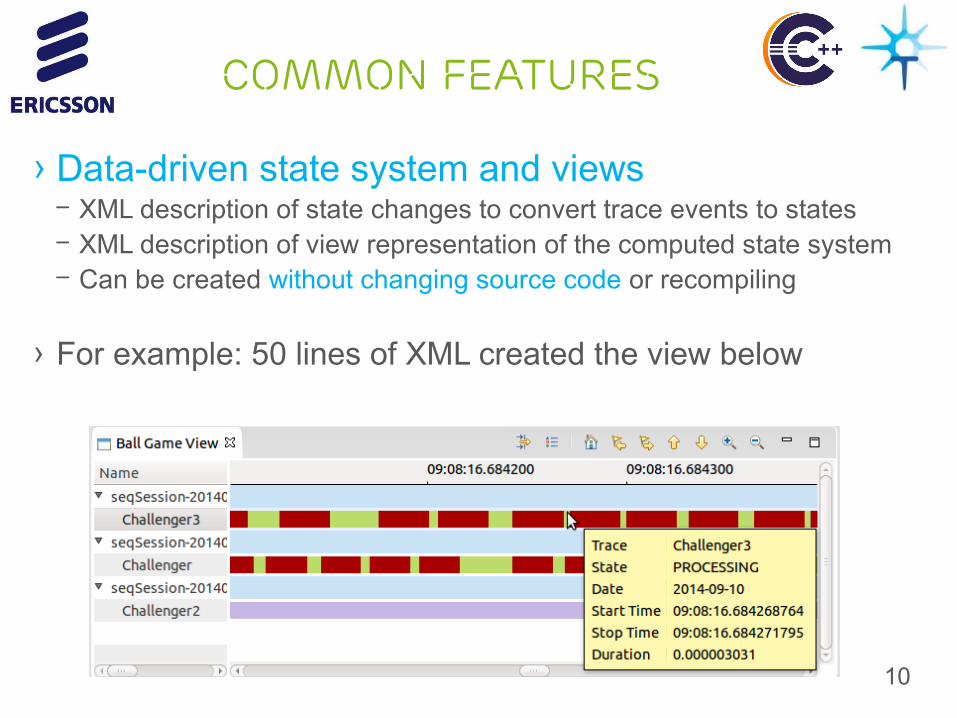
› Data-driven state system and views– XML description of state changes to convert trace events to states– XML description of view representation of the computed state system– Can be created without changing source code or recompiling
› For example: 50 lines of XML created the view below

11
Control flow view
› Displays processes state changes (color-coded) over time

12
Resources view
› Displays system resource states (color-coded) over time
13
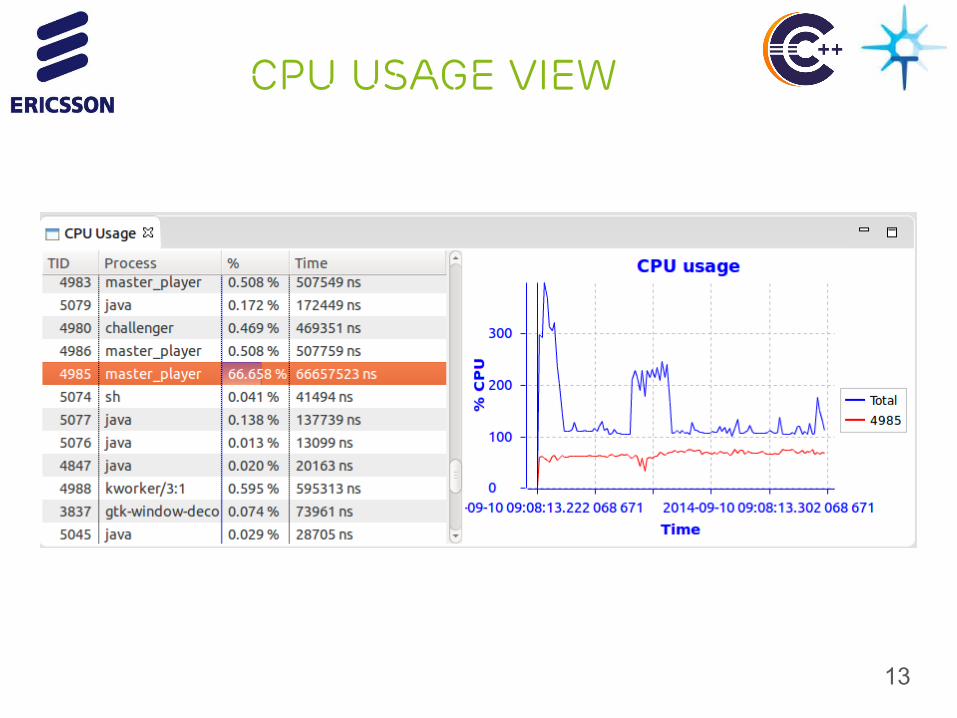
CPU USAGE View

AGENDA
A bit of background: Debug and Tracing
CDT Debug and Trace Compass integration
1. Enhanced Post-mortem troubleshooting
2. Debugging with Trace snapshots
3. Tracing with the (Multicore) Visualizer
4. GDB Traces with Trace Compass
Conclusion
Enhanced Post-Mortem
Troubleshooting

16
Post-Mortem Debug
› Use GDB to examine core file› Variables, Registers, Memory

17
Post-Mortem Trace
› Standard visualization of traces taken upon a crash
18
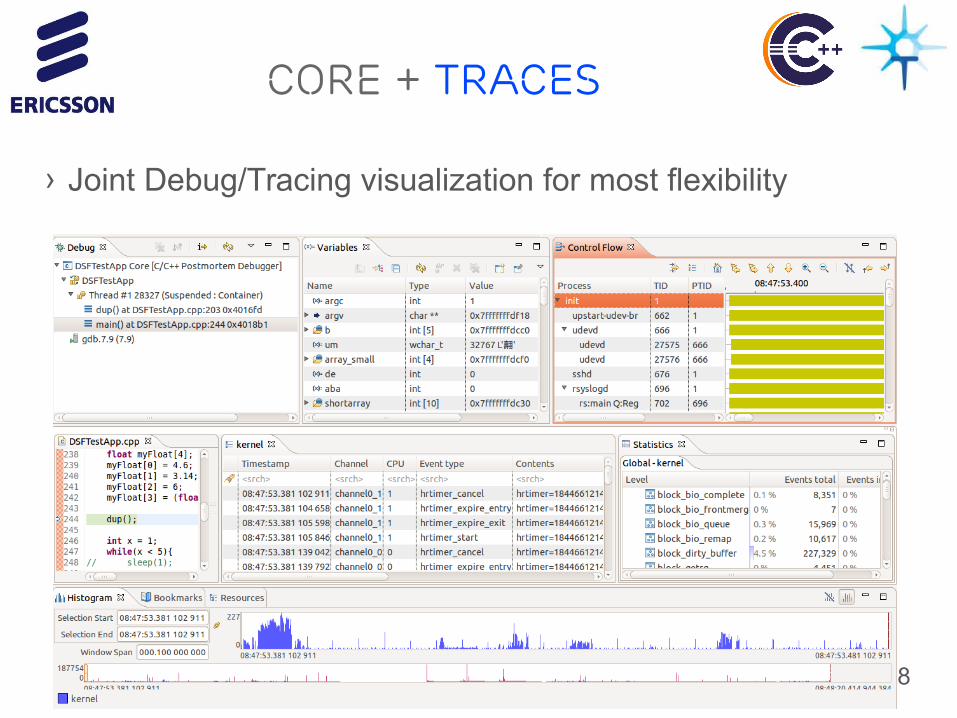
Core + Traces
› Joint Debug/Tracing visualization for most flexibility

19
System setup
1. Enable Tracing e.g., LTTng, UST, etc
2. Register crash handler with Linux kernel (man core)
3. Crash Handler collects/stores traces as well as core file

20
Debug LauncH
1) Use Post-Mortem launch 2) Specify location of Traces

21
Core + Traces

AGENDA
A bit of background: Debug and Tracing
CDT Debug and Trace Compass integration
1. Enhanced Post-mortem troubleshooting
2. Debugging with Trace snapshots
3. Tracing with the (Multicore) Visualizer
4. GDB Traces with Trace Compass
Conclusion

Debugging with
Trace Snapshots
24
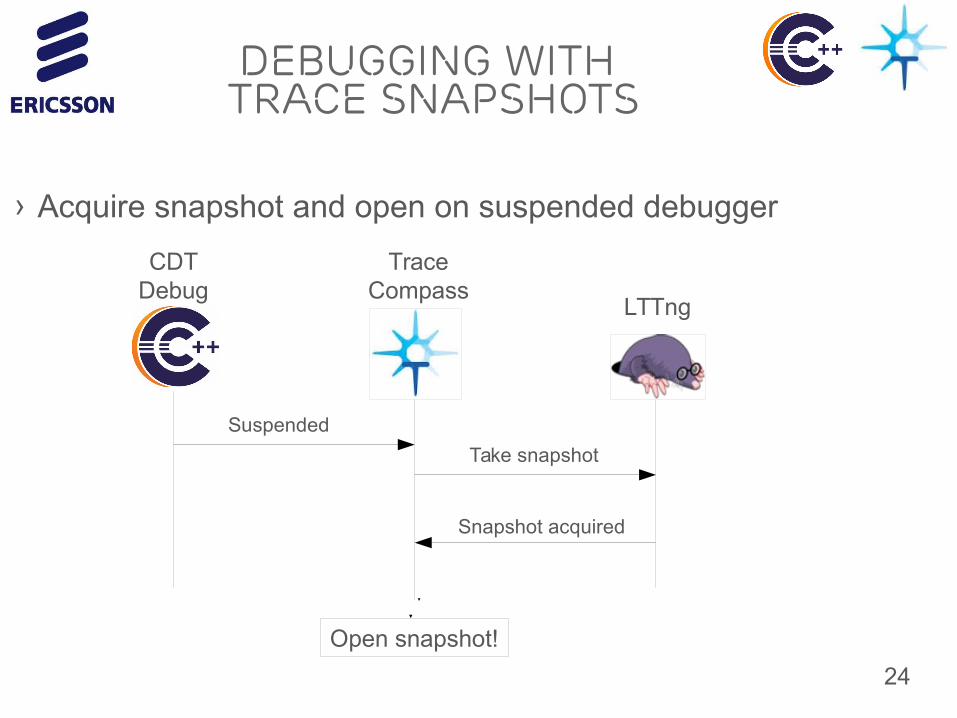
Debugging with Trace Snapshots
› Acquire snapshot and open on suspended debugger
Suspended
CDT Debug
Trace Compass
LTTng
Take snapshot
Snapshot acquired
Open snapshot!

25
Debugging with Trace Snapshots
› Advantages:– Very low overhead– Minimal disk usage
› Disadvantage:– Limited data available (as big as buffer allows)
26
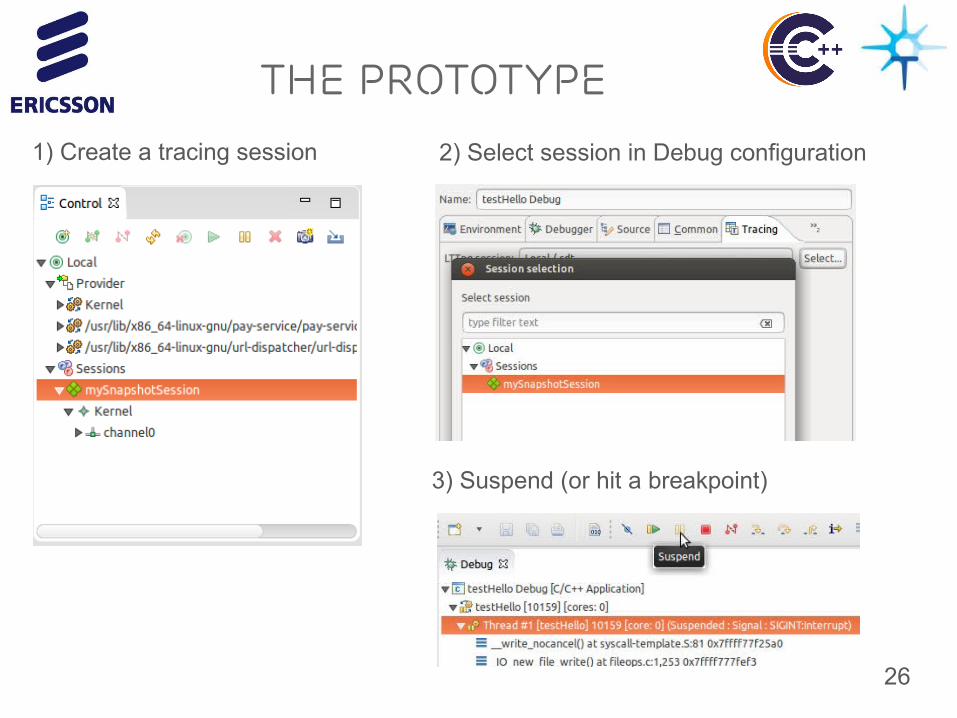
The Prototype
1) Create a tracing session 2) Select session in Debug configuration
3) Suspend (or hit a breakpoint)

27
The Prototype

28
Future improvements
› Configure session fromDebug configuration
• Choose tracer• Choose trace points• Tracer specific options• Persisted
29
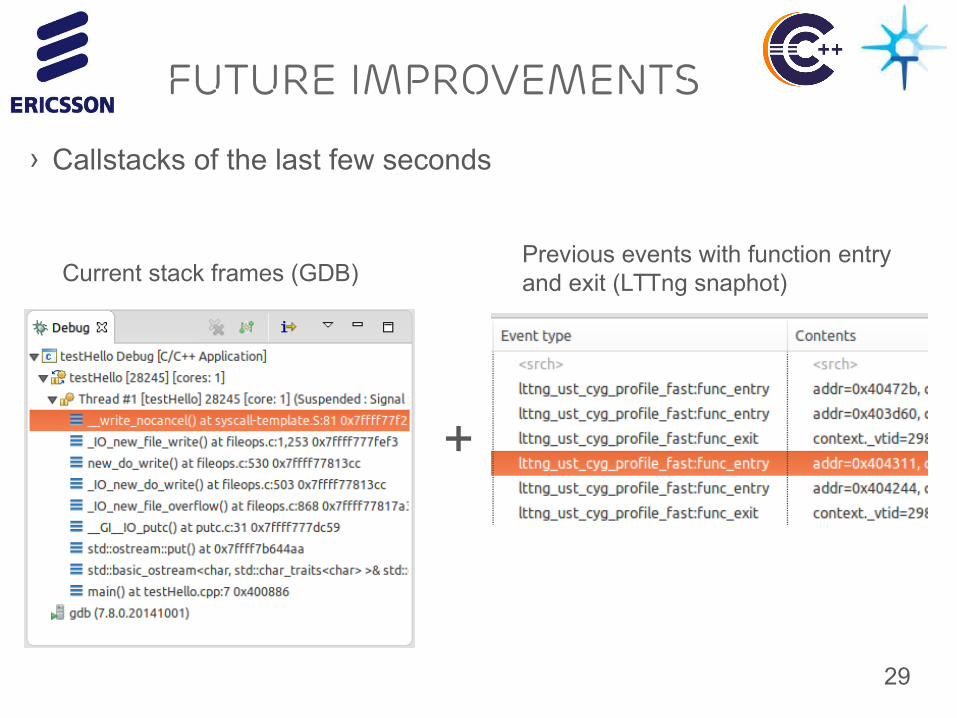
Future improvements
› Callstacks of the last few seconds
Current stack frames (GDB)
+
Previous events with function entry and exit (LTTng snaphot)

30
Future improvements
Result (example)
Callstack can be visualized moments before suspend!

AGENDA
A bit of background: Debug and Tracing
CDT Debug and Trace Compass integration
1. Enhanced Post-mortem troubleshooting
2. Debugging with Trace snapshots
3. Tracing with the (Multicore) Visualizer
4. GDB Traces with Trace Compass
Conclusion

Trace (Multicore)
Visualizer

33
multicore visualizer

34
Trace Visualizer
› Show all threads except sleeping All of them could run
› Coloured by kernel state
› CPU Usage
› We can have a better grasp of level of overload
› Which processes are affected by the overload?

35
TRACE Visualizer
› Colouring by process
› Sorting as improvement

36
TRACE COMPASS and Trace Visualizer

37
TRACE Visualizer
› Another example
› Notice partial CPU usage even with overload
› Could it be the Kernel using CPU?
› Could indicate even stronger overload

38
› Coloured by kernel state (RUNNING & SYSCALL)›
Visualizer with Xeon Phi

39
› Coloured by process
Visualizer with Xeon Phi

40
› Filtering of cores to display
Visualizer with Xeon Phi
AGENDA
A bit of background: Debug and Tracing
CDT Debug and Trace Compass integration
1. Enhanced Post-mortem troubleshooting
2. Debugging with Trace snapshots
3. Tracing with the (Multicore) Visualizer
4. GDB Traces with Trace Compass
Conclusion

GDB Traces with
Trace Compass

43
GDB TRACEpoints
› Instrumentation, collection and visualization in CDT

44
Debug GDB Traces
Collected Data
Line where tracewas collected
Tracepoint thatwas hit

45
GDB TRACEs event table
› Synchronized Trace Compass's Events Table
Conclusion

47
MULTICORE DEBUG GROUP › Joint effort to bring multicore debugging to the CDT
– Visualizer, Pin&Clone, Multiprocess, etc
› Support for those that want to add new features
› Monthly conference calls (open to all interested and free )
– http://wiki.eclipse.org/CDT/MultiCoreDebugWorkingGroup

48
More on Tracing
› Learn more about tracing and Trace Compass:
› Thursday 12 noon in Harbour AB with Marc-Andre:
“Analyzing Eclipse Applications with Trace Compass”

Some References
› Integration on GitHub, https://github.com/MarkZ3/Trace-Compass/tree/dsf-mv-integration
› CDT Project, http://www.eclipse.org/cdt› Trace Compass,
https://projects.eclipse.org/projects/tools.tracecompass
› CDT FAQ, http://wiki.eclipse.org/CDT/User/FAQ› CDT Debug workgroup
http://wiki.eclipse.org/CDT/MultiCoreDebugWorkingGroup › CDT Wiki, http://wiki.eclipse.org/CDT

5050
Feedback

51
Final Q&A

BONUS SLIDES

Other CDT Debug News
54
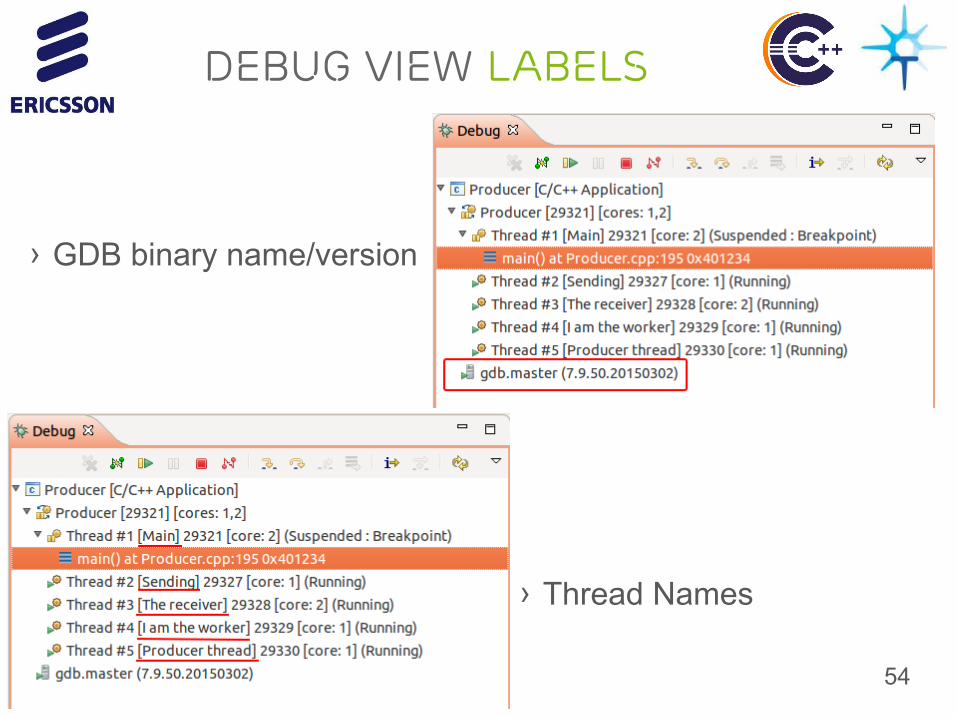
Debug View Labels
› GDB binary name/version
› Thread Names

55
Per-Element Format
› Ability to set format per element
› Variables, Expressions, Registers views

56
Register Groups
› Ability to create groups of registers
57
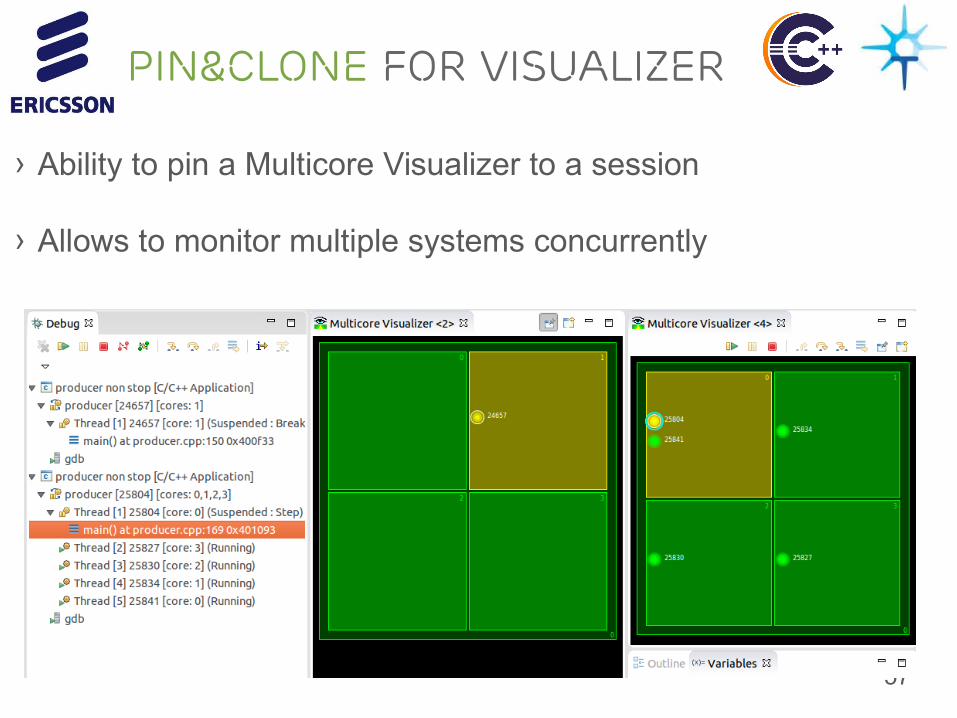
Pin&Clone for Visualizer
› Ability to pin a Multicore Visualizer to a session
› Allows to monitor multiple systems concurrently

58
Mini core dumps
› Effort of the Linux Diamon workgroup (diamon.org)
› Mini core dumps:– Configurable excerpt of full core dump– Space savings (good for embedded)– Storage of multiple mini core dumps
› Coming to a Linux distribution in the near future!

59
Future Plans

60
Global Breakpoints
Applies to every process
Auto attach when hit
Un-started or short lived process
› Contribution to Linux Kernel ongoing

61
Integrated GDB Console
prompt
Eclipse’sGDB-console
Event reporting
Command history
Command completion
Synchronized with GUI
IntegratedOr
stand-alone
› Coming in 2015!
62
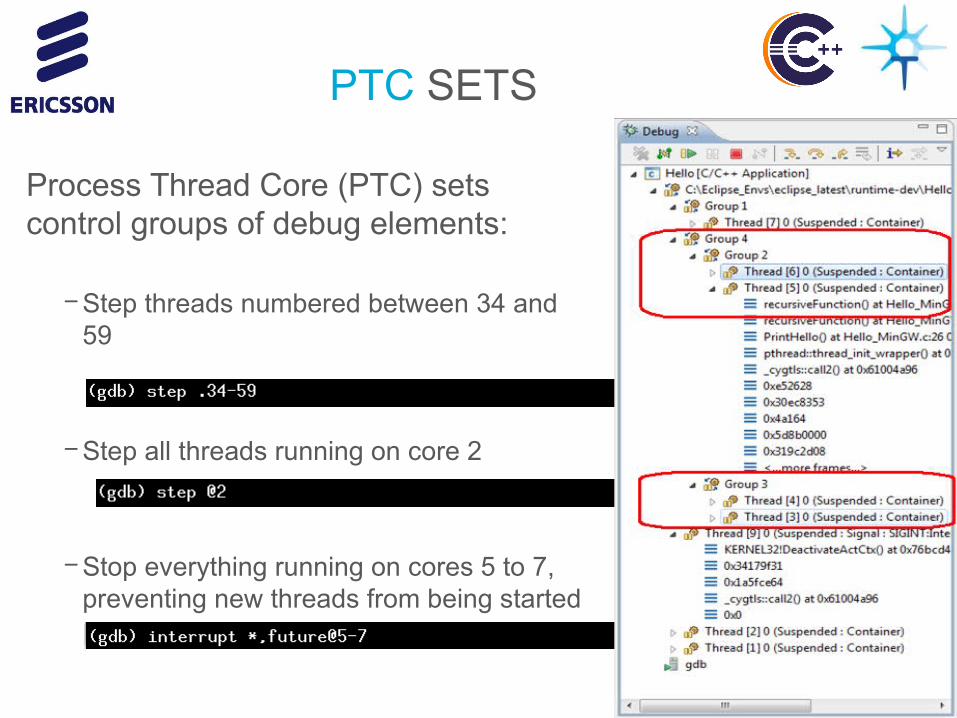
PTC SETS
Process Thread Core (PTC) sets control groups of debug elements:
– Step threads numbered between 34 and 59
– Step all threads running on core 2
– Stop everything running on cores 5 to 7, preventing new threads from being started