the great scheduler migration - asg
TRANSCRIPT

SPONSORED BY:
AN ENTERPRISE MANAGEMENT ASSOCIATES® (EMA™) RESEARCH REPORT SUMMARY
BY DAN TWING
SEPTEMBER 2019
The Great Scheduler MigrationIT Infrastructure Tools’ Disruption in the Wake of Digital Transformation and Application Modernization
ENTERPRISE MANAGEMENT ASSOCIATES®© 2019 Enterprise Management Associates, Inc. All Rights Reserved. | www.enterprisemanagement.com
Table of ContentsExecutive Summary .......................................................................................................................... 1
Objectives, Methodology, and Demographics .............................................................................2
Multiple Means of Scheduling and Executing IT Workloads .....................................................4
Non-WLA Scheduling Solutions .....................................................................................................5
Enterprise-Class Workload Automation (WLA) Scheduling Solutions .................................10
Using Non-WLA Schedulers Only ................................................................................................. 16
Using Both Non-WLA and WLA Products ................................................................................... 17
The Great Scheduler Migration Continues ................................................................................. 18
WLA Span of Use ............................................................................................................................. 19
EMA Perspective ............................................................................................................................. 21

1 ENTERPRISE MANAGEMENT ASSOCIATES®
© 2019 Enterprise Management Associates, Inc. All Rights Reserved. | www.enterprisemanagement.com
Executive SummaryIf there is one theme that comes out loud and clear from this research, it is that application modernization and digital transformation are driving forces in many organizations, and those activities are stressing scheduling and automation tools to the point at which many are looking for better answers. This is true for many organizations using only environment-specific schedulers, such as Windows Task Scheduler, Cron, AWS Batch, and Azure Scheduler. It is true for those using open-source schedulers, such as Apache Airflow, Apache Ozie for Hadoop, and Azkaban. It is also true for those using an enterprise-class workload automation (WLA) product. The top two reasons for discontinuing a product or the criteria for selecting a new one are consistently application modernization and digital transformation.
This study was envisioned following research conducted in 2018, which uncovered that 37% of WLA users had only come to use an enterprise-class WLA in the previous four years. EMA wanted to understand how many organizations remained that were not using an enterprise-class WLA product and, therefore, how much growth in net new users might be on the horizon. EMA conducted a web-based, email invite survey of 423 technical and business users of scheduling software in North America (U.S.), Europe (UK, France, and Germany), and Asia (China, Japan, India).
In contrast to expectations of finding large numbers of potentially new WLA users, only 16% of respondents were using only environment-specific (non-WLA) schedulers, such as Windows Task Scheduler, Cron, and others, while 65% were using one or more non-WLA scheduler and one or more enterprise-class WLA product. However, this study uncovered tremendous pent-up demand to change to new WLA software in Asia, where 73% say they are considering
migrating to new WLA software. This is part of a trend first identified by EMA in 2013 where 30% of respondents, primarily in North America, planned to migrate to new WLA software. By 2016, this number grew to 52% in North America and Europe. In 2018, North America and Europe had 44% of respondents planning to migrate—a decline from 2016 numbers since many had already made their move to new software. The trend seems to have started later in Asia, but looks to be about to break loose.
On average, WLA software currently controls around 40% to 45% of IT workloads, tasks, and activities, with some power users utilizing WLA to control 80% or more. EMA believes that businesses would benefit from a more cohesive automation strategy and a greater span of use of WLA software. It seems most users feel similarly, as 88% agree or strongly agree that their business would benefit from a more centralized view of automation across IT and business. EMA also believes WLA is the class of software best positioned to become one of the key IT operations automation tools and even expand to directly automate business processes. Most users feel similarly, as 85% agree or strongly agree that WLA tools should be expanded to orchestrate automation tools across the enterprise. Modern WLA already includes a variety of ways to automate far more than scheduling of jobs. Many WLA software vendors are working to further expand the reach and possibilities for automation provided by their software, including the sponsors of this research.

2 ENTERPRISE MANAGEMENT ASSOCIATES®
© 2019 Enterprise Management Associates, Inc. All Rights Reserved. | www.enterprisemanagement.com
Objectives, Methodology, and DemographicsThe inspiration for this study came from the results of the 2018 EMA research, “The Shifting Role of Workload Automation.” The 2018 research revealed that 37% of respondents had only started to use a WLA tool within the previous four years, and 38% had changed or added a new WLA product within the previous four years, yielding a total of 75% having changed the core software and processes to schedule IT workloads. This significant movement in one of the oldest categories of IT management software warranted additional study and understanding.
Working with the study sponsors, EMA designed and conducted a web-based, email invite survey of 423 IT and business users of scheduling software. To
gain a global perspective, the study was conducted in North America (U.S.), Europe (UK, France, and Germany), and Asia (China, Japan, and India). While the predominant focus is on IT staff, business users were also included since more business users are monitoring and even kicking off workload processes as dashboards, alerts, and mobile access are extended to business stakeholders.
IT staff, including individual performers, team leaders, managers, and directors, make up 64% of respondents. IT VP and IT CxO titles comprise 25%, while business managers, directors, and below are 7%, and business VP and CxO titles are 4%. IT titles include operations (7%), security (9%), service management (28%), and development (20%).
Geographic Distribution of Respondents
North America
34%
Europe32%
Asia34%
Sample Size = 423
Which of the following best describes your function in the organization?
64%
25%
7%
4%
0% 20% 40% 60% 80%
IT
IT Executive
Business
Business Executive

3 ENTERPRISE MANAGEMENT ASSOCIATES®
© 2019 Enterprise Management Associates, Inc. All Rights Reserved. | www.enterprisemanagement.com
All respondents had to have some involvement with scheduling workloads. Business users were only required to receive alerts and/or use dashboards with workload status information. IT executives needed to be involved in one or
more scheduler-related roles, while the remainder of IT staff were required to perform two or more scheduling-related job functions as noted in the charts.
Role in Scheduling/WLA
30%
20%
14%
11%
9%
8%
7%
0% 5% 10% 15% 20% 25% 30% 35%
Technical decision maker regardingscheduling/workload automation
technologies
Financial decision maker forscheduling/workload automation products
Technical user/operator ofscheduling/workload automation-related
products
Recommend and specifyscheduling/workload automation-related
products/services
Evaluate scheduling/workload automation-related products/services
System designer usingscheduling/workload automation as part of
a larger solution
User of dashboards regarding businessapplications managed by
scheduling/workload automation-relatedproducts
Sample Size = 423
Non-Executive IT Job Functions Performed
52%
50%
47%
45%
45%
45%
44%
42%
42%
41%
39%
36%
0% 10% 20% 30% 40% 50% 60%
Define scheduling/WLA job rights andsecurity
Monitor workload performance
Handle change management for jobworkflows
Handle scheduling/WLA-related SLAs
Design new jobs and job workflows
Root cause analysis for job workflowhealth and performance
Gather job and workflow requirements
Patch and upgrade scheduling/WLAsoftware
Use dashboards to monitor businessapplications
Install adapters for scheduling/WLAsoftware
Produce audit or SLA reports for jobworkflows
Document job workflows
Sample Size = 423, Valid Cases = 423, Total Mentions = 2,241
Respondents represented companies with a total number of employees ranging from 250-499 (1%), 500-999 (18%), 1000-2,499 (30%), 2,500-4,999 (22%), 5,000-9,999 (18%), 10,000-19,999 (4%) and more than 20,000 (7%). These companies included a wide range of industries, including manufacturing (21%); high technology (16%); professional and managed services (15%); finance, banking,
and insurance (12%); retail, wholesale, and distribution (10%); transportation, utilities, and energy (6%); and government and education (5%). Forty percent of these companies have revenues of $1 billion or more, with 37% at $100 million to under $1 billion, 12% at $20 million to under $100 million, and 9% under $20 million.

4 ENTERPRISE MANAGEMENT ASSOCIATES®
© 2019 Enterprise Management Associates, Inc. All Rights Reserved. | www.enterprisemanagement.com
Multiple Means of Scheduling and Executing IT WorkloadsWhen businesses first started using IT much of the work was computational in nature, with data input on punch cards and the processing run as a batch of cards that was available at the end of each day. Batch-oriented processing dominated early business computer use well into the 1980s. The source of the data changed as CRTs, personal computers, and other machine-to-machine sources of data emerged. Networking added a significant way to share data between systems and between companies. The idea of batch processing evolved as more and more systems became near-real time, but the need to run certain processes on a schedule has never ceased to dominate the back office of IT operations.
Early scheduling was nothing more than a list of tasks to be manually executed at certain times of the day or when certain events had happened. As complexity rose, software to automate the execution of certain programs or multiple steps in a longer process was created. This software became known as job scheduling. Initially, the software was calendar- and time-based, but became more sophisticated to include event triggers, such as the availability or arrival of a file or email, or the completion of another process.
All major OS platforms have some form of a job scheduler built into the operating system. Examples include Cron on Unix/Linux environments, Windows Task Scheduler, or IBM Advanced Job Scheduler for iSystems. The emergence of public clouds generated similar environment-specific schedulers, such as AWS Batch and Azure Scheduler, as well as Azkaban and Apache Ozie for the Hadoop ecosystem for big data processing. These schedulers can be sufficient for some users, but this level of job scheduler comes with some disadvantages. Platform-specific schedulers are just that: specific to one platform. There is no coordination between jobs or schedulers on other platforms. Modern IT can see data originate on systems in a variety of environments including Linux, Windows on-premises, cloud environments, and mainframes. Job scheduling often requires manual intervention and change management, which means new coding for new or modified jobs. With different schedulers in different environments, staff need to be trained on different user interfaces and different means of defining job flows.
To rationalize the scheduling function across multiple platforms within an enterprise, the class of software known as workload automation (WLA) was created. WLA offers improvements to the scheduling tasks across an enterprise with multiple environments by bringing consistency in job definitions, broader visibility, and control to the entire enterprise. Processes that begin in one environment and end in another can be executed in an orderly fashion and monitored through completion of the whole process.
Organizations differ in size, technical sophistication, maturity, complexity, volume of processing, and many other characteristics that can affect IT workloads and scheduling needs. As a result, different organizations have different scheduling needs and priorities. Some have only one environment and get by on the native OS scheduler. Others have multiple environments but do not prioritize having an enterprise-class WLA solution, and instead live with two or more native OS schedulers. Those with multiple environments, key processes that span multiple systems, SLAs with significant economic penalties, or other sophisticated needs should adopt an enterprise-class WLA solution. As needs continue to evolve, many companies look to migrate to even more powerful WLA solutions. Still, others remain content (or maybe struggle) with native OS schedulers. This study even uncovered some that continue to function completely with a manually run list. Even as modern enterprise-class WLA continues to advance, adoption is far from ubiquitous.
Past EMA studies on WLA focused on users of this class of software, specifically. This study is different in that using an enterprise-class WLA product was not a requirement to complete the survey. Those using an environment-specific scheduler were included as well. Those using only manually run processes were counted, but terminated from the rest of the survey. EMA found that 65% of respondents use both environment-specific schedulers (non-WLA) and one or more enterprise-class WLA products, while 16% are using only non-WLA schedulers and 6% use a WLA product and no other schedulers. Just 13% have no scheduler of any kind in use.
Non-WLA Schedulers Only,
16%
WLA Schedulers Only, 6%
Both WLA and non-WLA
Schedulers, 65%
No Scheduler, 13%
Scheduler Use
Non-WLA Schedulers OnlyWLA Schedulers OnlyBoth WLA and non-WLA SchedulersSample Size = 423

5 ENTERPRISE MANAGEMENT ASSOCIATES®
© 2019 Enterprise Management Associates, Inc. All Rights Reserved. | www.enterprisemanagement.com
In 2018, EMA found that 37% of respondents had come to use a WLA product for the first time in the previous four years. Now, just 16% remain on non-WLA schedulers and 13% seem to have no automated scheduling needs at all. The bulk of the holdouts to enterprise-class WLA seem to have moved up to more sophisticated scheduling software within the past five years. During this same time, EMA has been monitoring a trend for those already using one or more enterprise-class WLA products to migrate to or standardize on a new WLA product. In this study, 54% said they were considering migrating to new WLA
software. This is closer to the numbers seen in EMA research in 2016 for NA and Europe only. In 2018, 44% in NA and Europe said they were considering a change. The downward trend from 2016 to 2018 in NA and Europe is a result of many having already switched. The larger number in 2019 is a result of including Asia in this study, where 73% said they are considering changing WLA software. NA and Europe seem to be leading in this trend by about four years, but Asia is showing a similar trend.
Is your organization considering migrating to a different WLA software?
Yes54%
No46%
Sample Size = 423
Considering Migrating to a Different WLA Software by Region
48%
40%
73%
52%
60%
27%
0% 20% 40% 60% 80%
North America
EMEA
Asia
Yes No

6 ENTERPRISE MANAGEMENT ASSOCIATES®
© 2019 Enterprise Management Associates, Inc. All Rights Reserved. | www.enterprisemanagement.com
Non-WLA Scheduling SolutionsRespondents were asked which non-WLA schedulers they were using, had previously used, or were evaluating. The blue column represents those using a specific product, the red bar shows those who discontinued use of a product, and the green bar shows those evaluating a product. The chart is sorted from most used to least used. Windows Task Scheduler is the most used non-WLA scheduler at 40%, followed by Azure Scheduler at 28% and AWS Batch at 24%. Cron was reported at just 16%, which was a surprise as a much bigger user
group was expected, and a further surprise is that more are using manually run scripts than Cron. Apache Airflow, Ozie for Hadoop, and Azkaban for Hadoop are all relatively new, but have sizable numbers evaluating them for deployment. Azure Scheduler and AWS Batch share first place for evaluations at 10%. Not surprisingly, manually run scripts have the largest number of previous users at 18%, followed by Windows Task Scheduler at 12%.
Sample Size = 423
40%28% 24% 22%
16%9% 5% 4%
-12%-4% -3%
-18%-5% -5% -4% -3%
4%
10%10%
5%4%
8%8% 7%
-20.00%
-10.00%
0.00%
10.00%
20.00%
30.00%
40.00%
50.00%
Wind
ows T
ask S
ched
uler
Azur
e Sc
hedu
ler
AWS
Batch
Manua
lly ru
n sc
ripts
Cron
Apac
he A
irflow
Apa
che O
zie fo
r Had
oop
Azka
ban
(for H
adoo
p)
Non-WLA Scheduling Solutions
In Use Previously Used Evaluating
62%
20%
11%
5% 3%
0.0%
10.0%
20.0%
30.0%
40.0%
50.0%
60.0%
70.0%
1 2 3 4 5
Number of Non-WLA Schedulers in Use
+
Those using only one non-WLA scheduler represent 62% of respondents, with 20% using two and 11% using three. Less than 8% are using four or more of the non-WLA schedulers.
7 ENTERPRISE MANAGEMENT ASSOCIATES®
© 2019 Enterprise Management Associates, Inc. All Rights Reserved. | www.enterprisemanagement.com
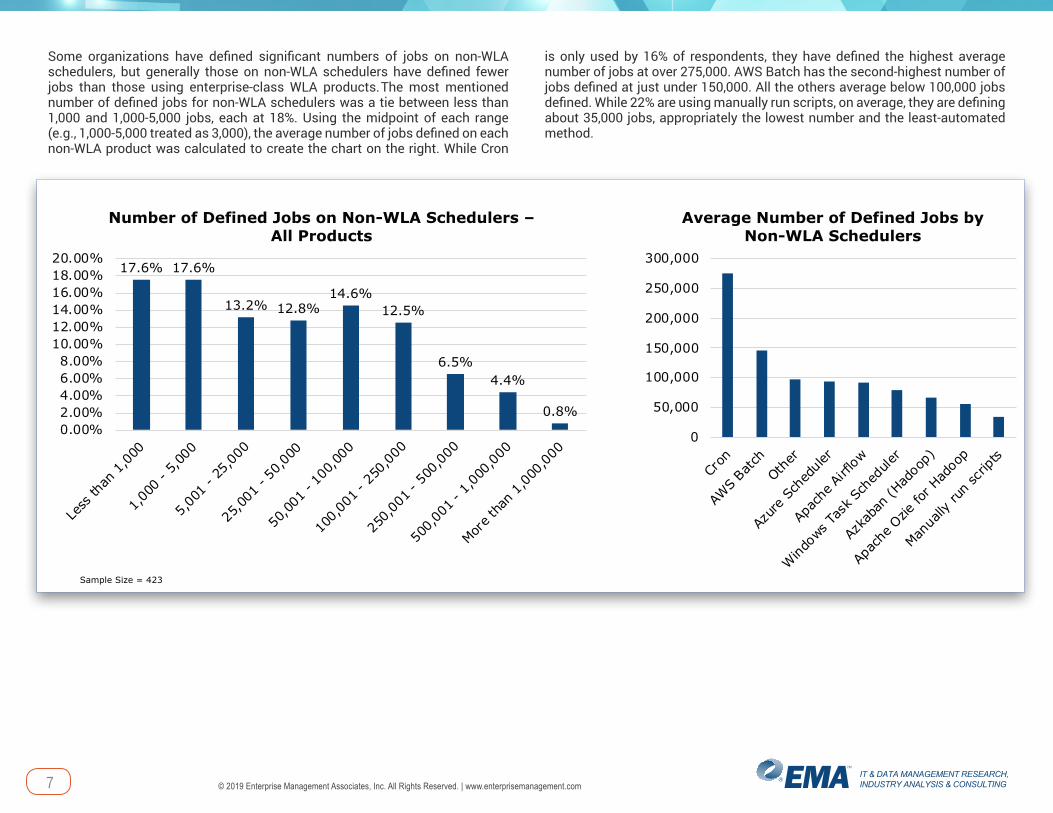
Some organizations have defined significant numbers of jobs on non-WLA schedulers, but generally those on non-WLA schedulers have defined fewer jobs than those using enterprise-class WLA products. The most mentioned number of defined jobs for non-WLA schedulers was a tie between less than 1,000 and 1,000-5,000 jobs, each at 18%. Using the midpoint of each range (e.g., 1,000-5,000 treated as 3,000), the average number of jobs defined on each non-WLA product was calculated to create the chart on the right. While Cron
is only used by 16% of respondents, they have defined the highest average number of jobs at over 275,000. AWS Batch has the second-highest number of jobs defined at just under 150,000. All the others average below 100,000 jobs defined. While 22% are using manually run scripts, on average, they are defining about 35,000 jobs, appropriately the lowest number and the least-automated method.
17.6% 17.6%
13.2% 12.8%14.6%
12.5%
6.5%4.4%
0.8%0.00%2.00%4.00%6.00%8.00%
10.00%12.00%14.00%16.00%18.00%20.00%
Less
than
1,0
00
1,00
0 - 5
,000
5,00
1 - 2
5,00
0
25,0
01 -
50,0
00
50,0
01 -
100,
000
100,
001 -
250
,000
250,
001 -
500
,000
500,
001 -
1,0
00,0
00
More t
han
1,00
0,00
0
Number of Defined Jobs on Non-WLA Schedulers –All Products
Sample Size = 423
0
50,000
100,000
150,000
200,000
250,000
300,000
Cron
AWS
Batch
Other
Azur
e Sc
hedu
ler
Apac
he A
irflow
Wind
ows T
ask S
ched
uler
Azka
ban
(Had
oop)
Apa
che O
zie fo
r Had
oop
Manua
lly ru
n sc
ripts
Average Number of Defined Jobs by Non-WLA Schedulers

8 ENTERPRISE MANAGEMENT ASSOCIATES®
© 2019 Enterprise Management Associates, Inc. All Rights Reserved. | www.enterprisemanagement.com
The number of jobs defined is growing for 68% of organizations, and stable for almost 23%. For most, growth is in the less than 10% category with nearly as many in the 10% to 25% category. Using the midpoint for each range, the average job growth by product is estimated. Azkaban has the highest growth
in number of defined jobs at just over 23%, followed closely by AWS Batch and Azure Scheduler. While Cron adoption is at only 16%, those using it have over 12% growth in the jobs defined. Appropriately, manually run scripts is growing the least.
1.7%3.2%
12.4%
23.9%26.3%
22.8%
4.9%3.6%
1.0%0.2%0.0%0.00%
5.00%
10.00%
15.00%
20.00%
25.00%
30.00%
+>75
%
+50%
to 7
5%
+25%
to 5
0%
+10%
to 2
5%
+<10%
Stay
ed th
e sam
e
-<10
%
-10%
to 2
5%
-25%
to 5
0%
-50%
to 7
5%
->75
%
How Number of Jobs is Changing for Non-WLA Schedulers - All Products
0.00%
5.00%
10.00%
15.00%
20.00%
25.00%
Azka
ban
(Had
oop)
AWS
Batch
Azur
e Sch
edule
rCr
onOth
er
Wind
ows T
ask S
ched
uler
Apac
he A
irflow
Apa
che O
zie fo
r Had
oop
Manua
lly ru
n sc
ripts
Average Growth in Number of Job Definitions for Non-WLA Schedulers

9 ENTERPRISE MANAGEMENT ASSOCIATES®
© 2019 Enterprise Management Associates, Inc. All Rights Reserved. | www.enterprisemanagement.com
Users of non-WLA schedulers were also asked to rate how well each product used meets their needs on a five-point scale in which 5 is very well and 1 is not at all well. All of the non-WLA schedulers had a mean satisfaction of 4 (moderately well or better) with the exception of manually run scripts. Azure
Scheduler scored the highest of all non-WLA schedulers at 4.6. Interestingly, Microsoft has decided to retire Azure Scheduler at the end of September, 2019. Azure Logic Apps will be the replacement. Online forums are not taking this change kindly.
4.60
4.43
4.33
4.26
4.25
4.24
4.15
4.00
3.51
0.00 1.00 2.00 3.00 4.00 5.00
Azure Scheduler
AWS Batch
Azkaban (for Hadoop)
Apache Airflow
Apache Ozie for Hadoop
Cron
Windows Task Scheduler
Other
Manually run scripts
Average Satisfaction Rating for Non-WLA Scheduler Products
Mean
Sample Size = 155
0.0%
0.0%
2.3%
4.6%
5.0%
5.0%
5.3%
7.3%
9.9%
13.0%
13.4%
15.3%
19.1%
0.0% 5.0% 10.0% 15.0% 20.0% 25.0%
Cost
Vendor merger or acquisition
Our merger or acquisition
Poor reliability
Discontinued the functions being scheduled
Poor root cause analysis
Discontinued the underlying platforms
Standardizing on a single tool
Complexity to Manage
Poor workload change management
Advanced needs of app modernization
We had a better tool available
Advanced needs of digital transformation
Primary Reason for Discontinuing Non-WLA Schedulers
Sample Size = 423
Even though satisfaction is high for most non-WLA schedulers, 155 of 423 respondents have moved on from one or more non-WLA scheduler. Of those discontinuing use of non-WLA schedulers, 19% did so because of advanced needs to support digital transformation, which is the most stated reason for making such a change. Other leading reasons include 15% who said they
had a better tool available, 13% who said they discontinued use because of advanced needs of application modernization, and 13% who said they had poor workload change management. All of these concerns can be improved with an enterprise-class WLA product.
10 ENTERPRISE MANAGEMENT ASSOCIATES®
© 2019 Enterprise Management Associates, Inc. All Rights Reserved. | www.enterprisemanagement.com
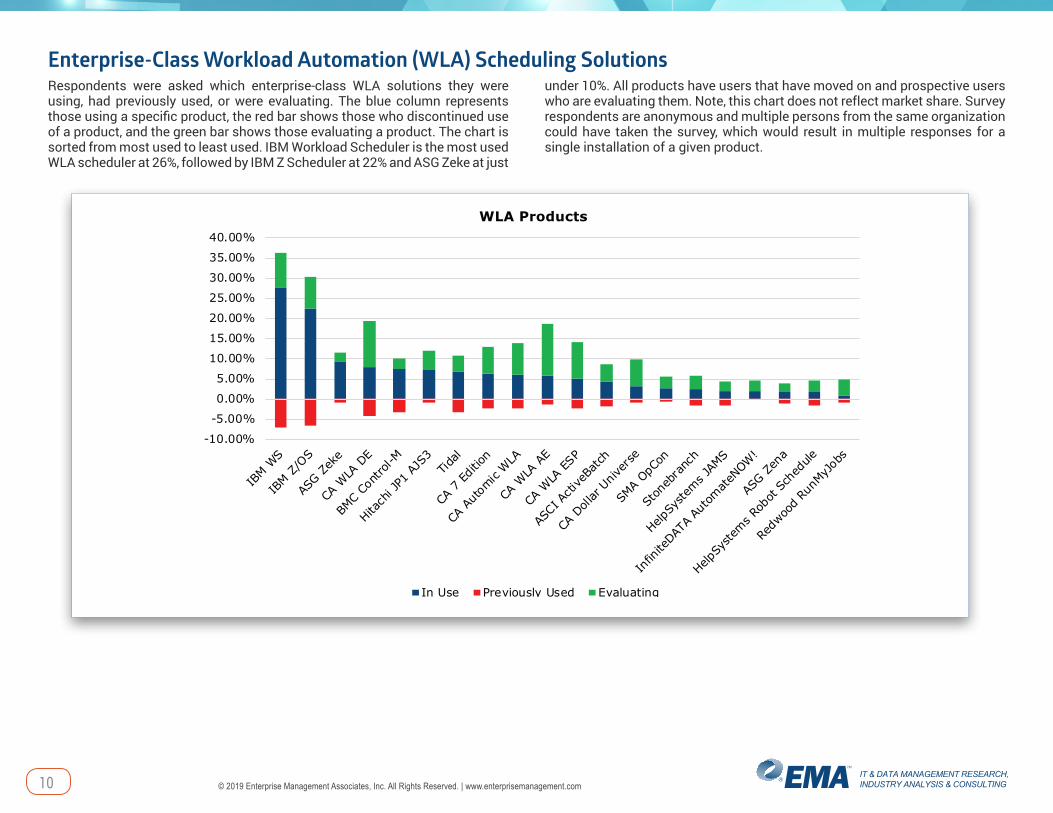
Enterprise-Class Workload Automation (WLA) Scheduling SolutionsRespondents were asked which enterprise-class WLA solutions they were using, had previously used, or were evaluating. The blue column represents those using a specific product, the red bar shows those who discontinued use of a product, and the green bar shows those evaluating a product. The chart is sorted from most used to least used. IBM Workload Scheduler is the most used WLA scheduler at 26%, followed by IBM Z Scheduler at 22% and ASG Zeke at just
under 10%. All products have users that have moved on and prospective users who are evaluating them. Note, this chart does not reflect market share. Survey respondents are anonymous and multiple persons from the same organization could have taken the survey, which would result in multiple responses for a single installation of a given product.
-10.00%
-5.00%
0.00%
5.00%
10.00%
15.00%
20.00%
25.00%
30.00%
35.00%
40.00%
IBM W
S
IBM Z
/OS
ASG Z
eke
CA W
LA D
E
BMC C
ontro
l-M
Hitach
i JP1
AJS
3Tid
al
CA 7
Editio
n
CA A
utom
ic W
LA
CA W
LA A
E
CA W
LA ES
P
ASCI A
ctive
Batch
CA D
ollar
Univ
erse
SMA O
pCon
Ston
ebra
nch
HelpSy
stem
s JAM
S
Infin
iteDAT
A Au
tom
ateN
OW!
ASG Z
ena
HelpSy
stem
s Rob
ot S
ched
ule
Redw
ood
RunM
yJob
s
WLA Products
In Use Previously Used Evaluating
11 ENTERPRISE MANAGEMENT ASSOCIATES®
© 2019 Enterprise Management Associates, Inc. All Rights Reserved. | www.enterprisemanagement.com
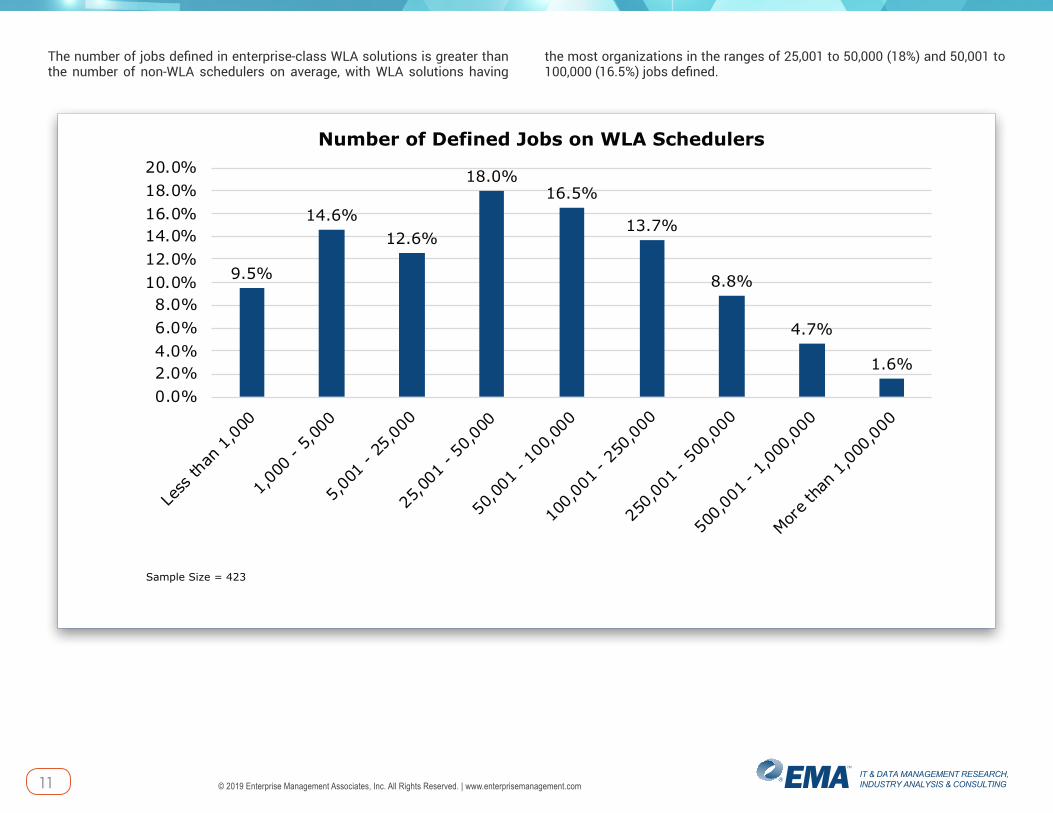
The number of jobs defined in enterprise-class WLA solutions is greater than the number of non-WLA schedulers on average, with WLA solutions having
the most organizations in the ranges of 25,001 to 50,000 (18%) and 50,001 to 100,000 (16.5%) jobs defined.
9.5%
14.6%12.6%
18.0%16.5%
13.7%
8.8%
4.7%
1.6%
0.0%2.0%4.0%6.0%8.0%
10.0%12.0%14.0%16.0%18.0%20.0%
Less
than
1,0
00
1,00
0 - 5
,000
5,00
1 - 2
5,00
0
25,0
01 -
50,0
00
50,0
01 -
100,
000
100,
001 -
250
,000
250,
001 -
500
,000
500,
001 -
1,0
00,0
00
More t
han
1,00
0,00
0
Number of Defined Jobs on WLA Schedulers
Sample Size = 423

12 ENTERPRISE MANAGEMENT ASSOCIATES®
© 2019 Enterprise Management Associates, Inc. All Rights Reserved. | www.enterprisemanagement.com
Just as with the non-WLA schedulers, enterprise-class WLA solutions are also seeing growth in the number of job definitions, with very similar numbers.
Growth in job definitions is the experience of 70% of WLA users, just over 20% have stayed the same, and a few organizations are seeing a decline.
1.8%
5.8%
9.4%
25.5%
28.4%
21.2%
2.9%2.7%1.8%
0.5%0.0%0.0%
5.0%
10.0%
15.0%
20.0%
25.0%
30.0%
Increasedmore than
75%
Increasedbetween50% and
75%
Increasedbetween25% and
50%
Increasedbetween10% and
25%
Increasedless than
10%
Stayedthe same
Decreasedless than
10%
Decreasedbetween10% and
25%
Decreasedbetween25% and
50%
Decreasedbetween50% and
75%
Decreasedmore than
75%
How Number of Jobs is Changing Across all WLA Products
Sample Size = 423

13 ENTERPRISE MANAGEMENT ASSOCIATES®
© 2019 Enterprise Management Associates, Inc. All Rights Reserved. | www.enterprisemanagement.com
Those using only one WLA solution represent almost 69% of respondents, slightly more than those using only one non-WLA scheduler. Two WLA products are in use for 17%, with 8% using three. Less than 6% are using four or more of the WLA solutions. The most common reason stated for using more than one WLA solution is meeting the demands of digitalization and application
modernization (38%). This is the first time EMA has seen digitalization as the number-one reason for multiple products. In the past, the most stated reason was that different groups required different scheduling tools, which was selected by 35% of respondents and is the second-highest response in this study.
68.8%
17.3%
8.3%
1.4%4.3%
0.0%
10.0%
20.0%
30.0%
40.0%
50.0%
60.0%
70.0%
80.0%
1 2 3 4 5
Number of WLA Products in Use
Sample Size = 423
Why are you using multiple WLA products?
38%
35%
31%
30%
29%
27%
26%
25%
25%
25%
0% 5% 10% 15% 20% 25% 30% 35% 40%
To meet the demands of digitization andapplication modernization
Different groups require different scheduling tools
Mainframe platform has one scheduler, distributedplatform(s) has a different scheduler
Integration limitations
Knowledge gap between different WLA solutions
Migrations consume too many resources
Functionality limitations
Legacy systems
In the middle of converting from one to another
Inherited through acquisition
Sample Size = 364, Valid Cases = 364, Total Mentions = 1,060

14 ENTERPRISE MANAGEMENT ASSOCIATES®
© 2019 Enterprise Management Associates, Inc. All Rights Reserved. | www.enterprisemanagement.com
For those with multiple WLA solutions, 29% say they do not have cross-platform dependencies between the several systems. For the 71% who do have cross-platform dependencies, 44% say the impact is minimal, while 11% have regular problems and 16% have addressed cross-platform problems by integrating an
analytics solution to provide a consolidated view of all environments. Though only 11% have ongoing issues and 16% have resolved the issues with analytics, 80% say they are considering rationalizing to a single product.
Do you have cross-platform dependencies between different schedulers?
29%
44%
11%
16%
0% 10% 20% 30% 40% 50%
No
Yes, with minimal impact
Yes, and it regularly causesproblems
Yes, but we have integrated ananalytics solution that provides a
consolidated view
Sample Size = 364
Are you considering rationalizing to a single scheduler product?
Yes80%
No20%
Sample Size = 364

15 ENTERPRISE MANAGEMENT ASSOCIATES®
© 2019 Enterprise Management Associates, Inc. All Rights Reserved. | www.enterprisemanagement.com
There has been a trend for the past seven or eight years for organizations to consider changing their WLA solution. In this study, 110 of 423 respondents have discontinued one or more WLA products and 177 are actively evaluating new WLA software. Both these groups were asked about their reasons for discontinuing a WLA product or for considering a new WLA product. Of those who discontinued using a product, 26% said their primary reason was the
advanced needs of digital transformation, with the second-most common response being the advanced needs of application modernization for almost 19%. Similarly, those evaluating a new WLA product state digital transformation as the most common reason at 34%. Cloud-based jobs (28%) and improving resource utilization (28%) tied for the second-most common reason for looking for new software.
Sample Size = 110
0.5%
1.1%
1.6%
2.7%
4.8%
6.4%
11.8%
12.3%
13.9%
18.7%
26.2%
0.0% 5.0% 10.0% 15.0% 20.0% 25.0% 30.0%
Discontinued the functions beingscheduled
Poor reliability
Poor relationship with the vendor
Discontinued the underlying platforms
Poor workload change management
Poor root cause analysis
Complexity to manage
Cost
We had a better tool available
Advanced needs of app modernization
Advanced needs of digital transformation
Primary Reason for Discontinuing WLA Products
Reasons for Evaluating New WLA Software
34%
28%
28%
26%
24%
21%
21%
20%
20%
19%
18%
18%
17%
16%
16%
12%
0% 5% 10% 15% 20% 25% 30% 35% 40%
Digital transformation
Cloud-based jobs
Improve resource utilization
Scalability concerns
Application modernization
New directives from senior IT management
Improve root cause analysis
Workload change management
Currrent solution is too complicated
Major new application requirements
Audit and compliance concerns
DevOps
ERP implementation
Problems meeting SLAs
Too many disruptions to processing
Merger or acquisition
Sample Size = 177, Valid Cases = 177, Total Mentions = 596
16 ENTERPRISE MANAGEMENT ASSOCIATES®
© 2019 Enterprise Management Associates, Inc. All Rights Reserved. | www.enterprisemanagement.com
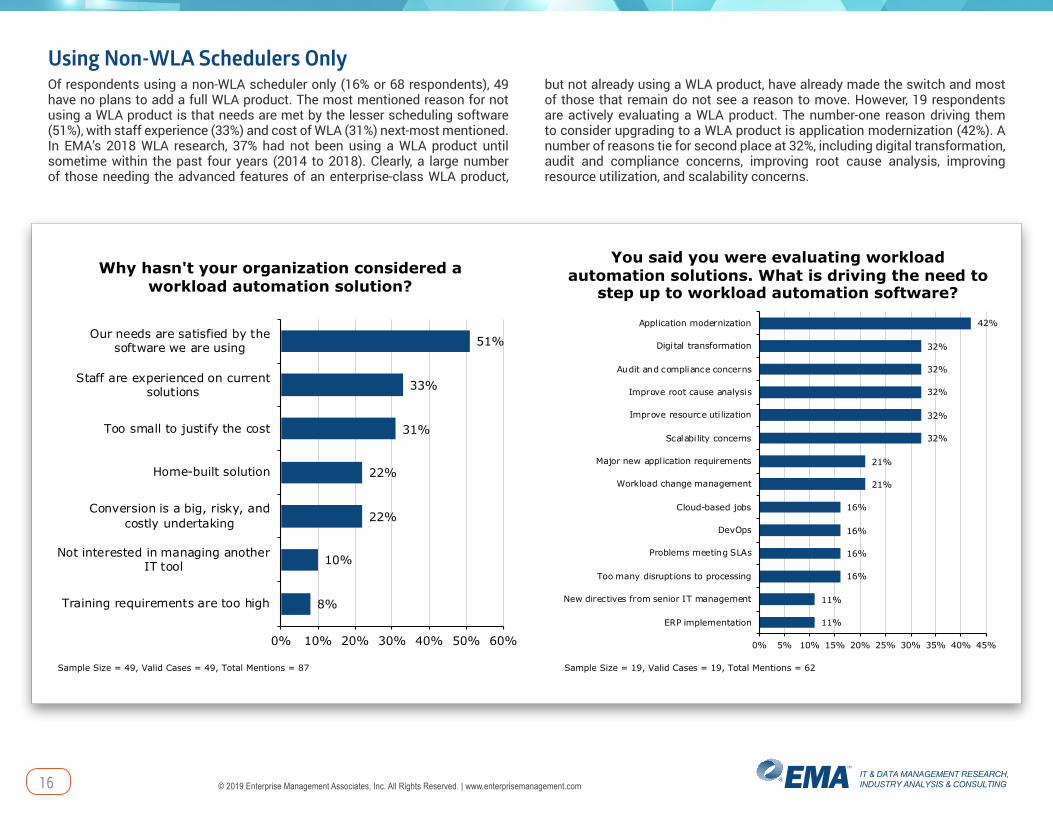
Using Non-WLA Schedulers OnlyOf respondents using a non-WLA scheduler only (16% or 68 respondents), 49 have no plans to add a full WLA product. The most mentioned reason for not using a WLA product is that needs are met by the lesser scheduling software (51%), with staff experience (33%) and cost of WLA (31%) next-most mentioned. In EMA’s 2018 WLA research, 37% had not been using a WLA product until sometime within the past four years (2014 to 2018). Clearly, a large number of those needing the advanced features of an enterprise-class WLA product,
but not already using a WLA product, have already made the switch and most of those that remain do not see a reason to move. However, 19 respondents are actively evaluating a WLA product. The number-one reason driving them to consider upgrading to a WLA product is application modernization (42%). A number of reasons tie for second place at 32%, including digital transformation, audit and compliance concerns, improving root cause analysis, improving resource utilization, and scalability concerns.
Why hasn't your organization considered a workload automation solution?
51%
33%
31%
22%
22%
10%
8%
0% 10% 20% 30% 40% 50% 60%
Our needs are satisfied by thesoftware we are using
Staff are experienced on currentsolutions
Too small to justify the cost
Home-built solution
Conversion is a big, risky, andcostly undertaking
Not interested in managing anotherIT tool
Training requirements are too high
Sample Size = 49, Valid Cases = 49, Total Mentions = 87
You said you were evaluating workload automation solutions. What is driving the need to
step up to workload automation software?
42%
32%
32%
32%
32%
32%
21%
21%
16%
16%
16%
16%
11%
11%
0% 5% 10% 15% 20% 25% 30% 35% 40% 45%
Application modernization
Digital transformation
Audit and compliance concerns
Improve root cause analysis
Improve resource uti lization
Scalability concerns
Major new application requirements
Workload change management
Cloud-based jobs
DevOps
Problems meeting SLAs
Too many disruptions to processing
New directives from senior IT management
ERP implementation
Sample Size = 19, Valid Cases = 19, Total Mentions = 62
17 ENTERPRISE MANAGEMENT ASSOCIATES®
© 2019 Enterprise Management Associates, Inc. All Rights Reserved. | www.enterprisemanagement.com
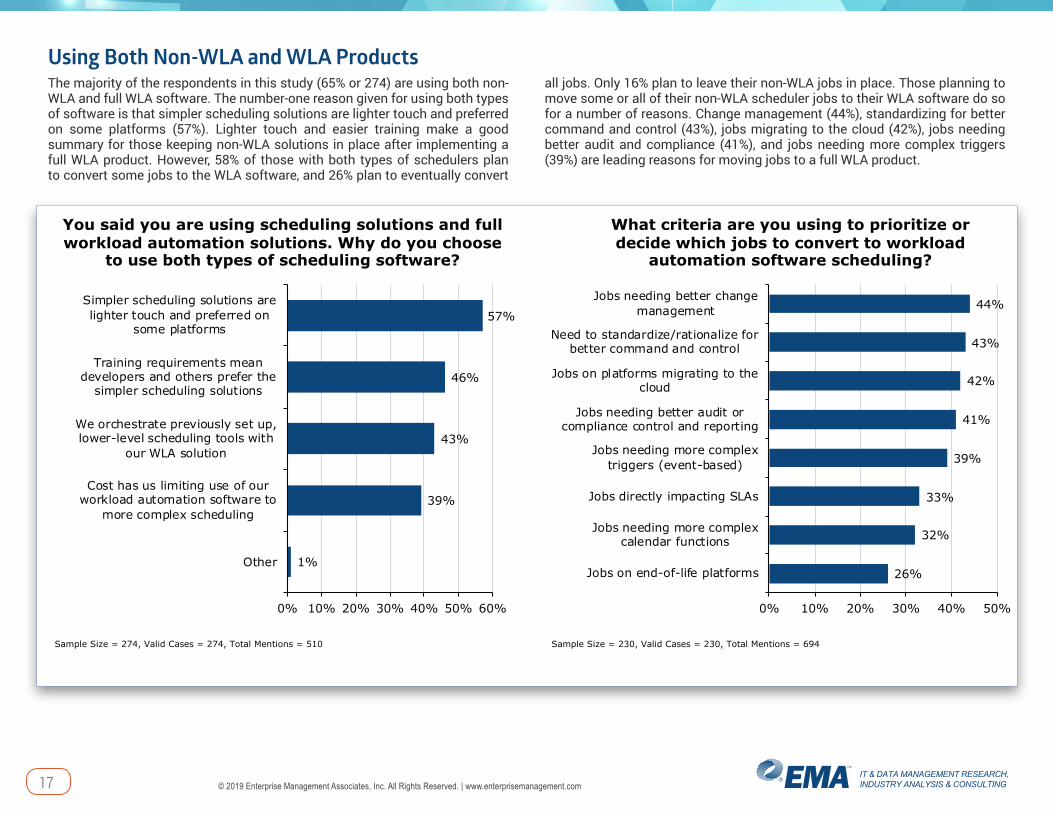
Using Both Non-WLA and WLA ProductsThe majority of the respondents in this study (65% or 274) are using both non-WLA and full WLA software. The number-one reason given for using both types of software is that simpler scheduling solutions are lighter touch and preferred on some platforms (57%). Lighter touch and easier training make a good summary for those keeping non-WLA solutions in place after implementing a full WLA product. However, 58% of those with both types of schedulers plan to convert some jobs to the WLA software, and 26% plan to eventually convert
all jobs. Only 16% plan to leave their non-WLA jobs in place. Those planning to move some or all of their non-WLA scheduler jobs to their WLA software do so for a number of reasons. Change management (44%), standardizing for better command and control (43%), jobs migrating to the cloud (42%), jobs needing better audit and compliance (41%), and jobs needing more complex triggers (39%) are leading reasons for moving jobs to a full WLA product.
You said you are using scheduling solutions and full workload automation solutions. Why do you choose
to use both types of scheduling software?
57%
46%
43%
39%
1%
0% 10% 20% 30% 40% 50% 60%
Simpler scheduling solutions arelighter touch and preferred on
some platforms
Training requirements meandevelopers and others prefer the
simpler scheduling solutions
We orchestrate previously set up,lower-level scheduling tools with
our WLA solution
Cost has us limiting use of ourworkload automation software to
more complex scheduling
Other
Sample Size = 274, Valid Cases = 274, Total Mentions = 510
What criteria are you using to prioritize or decide which jobs to convert to workload
automation software scheduling?
44%
43%
42%
41%
39%
33%
32%
26%
0% 10% 20% 30% 40% 50%
Jobs needing better changemanagement
Need to standardize/rationalize forbetter command and control
Jobs on platforms migrating to thecloud
Jobs needing better audit orcompliance control and reporting
Jobs needing more complextriggers (event-based)
Jobs directly impacting SLAs
Jobs needing more complexcalendar functions
Jobs on end-of-life platforms
Sample Size = 230, Valid Cases = 230, Total Mentions = 694

18 ENTERPRISE MANAGEMENT ASSOCIATES®
© 2019 Enterprise Management Associates, Inc. All Rights Reserved. | www.enterprisemanagement.com
The Great Scheduler Migration ContinuesEMA research has been monitoring a trend to migrate to new WLA software since 2013, where it was uncovered that 30% of organizations were considering migrating to a new WLA software. At the time, that number was a surprise and seemed significant. However, by 2015, 52% of organizations were considering migrating to new WLA software. The trend was fully underway. By 2018, the number had declined to 44% intending to migrate. The reduction was a result of many organizations having fulfilled their plans to migrate to a new WLA software. These numbers were a result of surveys in North America and Europe.
The current study expanded the geographic coverage by adding Asia, represented by China, Japan, and India, in addition to Europe and North America. In 2019, 54% of respondents stated an intention to migrate to new WLA software. The difference is primarily in the addition of one-third of respondents from Asia. The migration trend to new WLA software started in significant numbers in
North America first. Europe started in earnest a couple of years later. Both continue to have a significant number of WLA users looking to migrate, but the numbers are declining because many WLA users have already made their move. When evaluating only North American and European respondents, the data in this study matches the 44% intending to migrate found in the 2018 study. In 2018, Europe and North America each comprised about 50% of the survey respondents. Here, North America has 48% intending to migrate and Europe has 40% intending to migrate. If EMA had only surveyed North America and Europe, there would have been a 44% overall number just like in the 2018 study. However, this study resulted in 54% intending to migrate, and Asia is the difference with 73% intending to migrate to new WLA software. It appears WLA users in Asia are feeling the same pressures to improve the WLA software used, but the trend seems to have started later since most have not yet made the switch. The next several years should see significant WLA migration activities globally as Asia joins the march to new WLA software.
Is your organization considering migrating to a different WLA software?
Yes54%
No46%
Sample Size = 423
Intent to Migrate by Region
48%
40%
73%
52%
60%
27%
0% 20% 40% 60% 80%
North America
EMEA
Asia
Yes No
19 ENTERPRISE MANAGEMENT ASSOCIATES®
© 2019 Enterprise Management Associates, Inc. All Rights Reserved. | www.enterprisemanagement.com
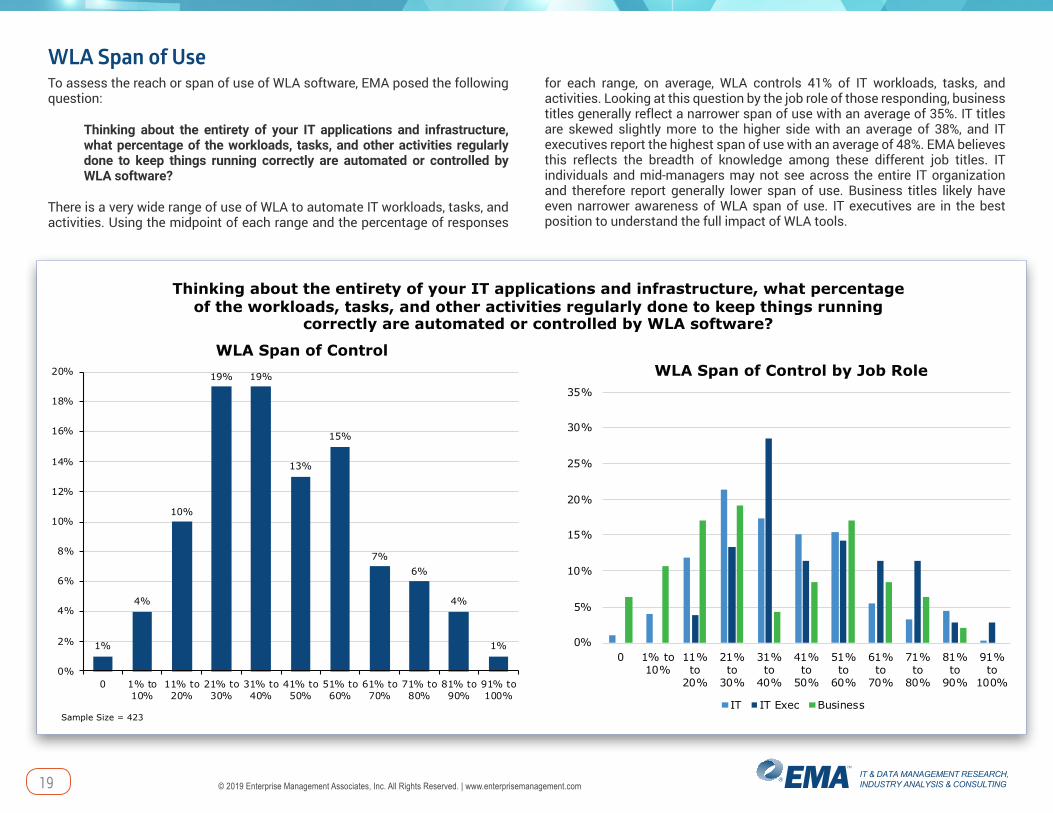
WLA Span of UseTo assess the reach or span of use of WLA software, EMA posed the following question:
Thinking about the entirety of your IT applications and infrastructure, what percentage of the workloads, tasks, and other activities regularly done to keep things running correctly are automated or controlled by WLA software?
There is a very wide range of use of WLA to automate IT workloads, tasks, and activities. Using the midpoint of each range and the percentage of responses
for each range, on average, WLA controls 41% of IT workloads, tasks, and activities. Looking at this question by the job role of those responding, business titles generally reflect a narrower span of use with an average of 35%. IT titles are skewed slightly more to the higher side with an average of 38%, and IT executives report the highest span of use with an average of 48%. EMA believes this reflects the breadth of knowledge among these different job titles. IT individuals and mid-managers may not see across the entire IT organization and therefore report generally lower span of use. Business titles likely have even narrower awareness of WLA span of use. IT executives are in the best position to understand the full impact of WLA tools.
Thinking about the entirety of your IT applications and infrastructure, what percentage of the workloads, tasks, and other activities regularly done to keep things running
correctly are automated or controlled by WLA software?
1%
4%
10%
19% 19%
13%
15%
7%6%
4%
1%
0%
2%
4%
6%
8%
10%
12%
14%
16%
18%
20%
0 1% to10%
11% to20%
21% to30%
31% to40%
41% to50%
51% to60%
61% to70%
71% to80%
81% to90%
91% to100%
WLA Span of Control
Sample Size = 423
0%
5%
10%
15%
20%
25%
30%
35%
0 1% to10%
11%to
20%
21%to
30%
31%to
40%
41%to
50%
51%to
60%
61%to
70%
71%to
80%
81%to
90%
91%to
100%
WLA Span of Control by Job Role
IT IT Exec Business
20 ENTERPRISE MANAGEMENT ASSOCIATES®
© 2019 Enterprise Management Associates, Inc. All Rights Reserved. | www.enterprisemanagement.com
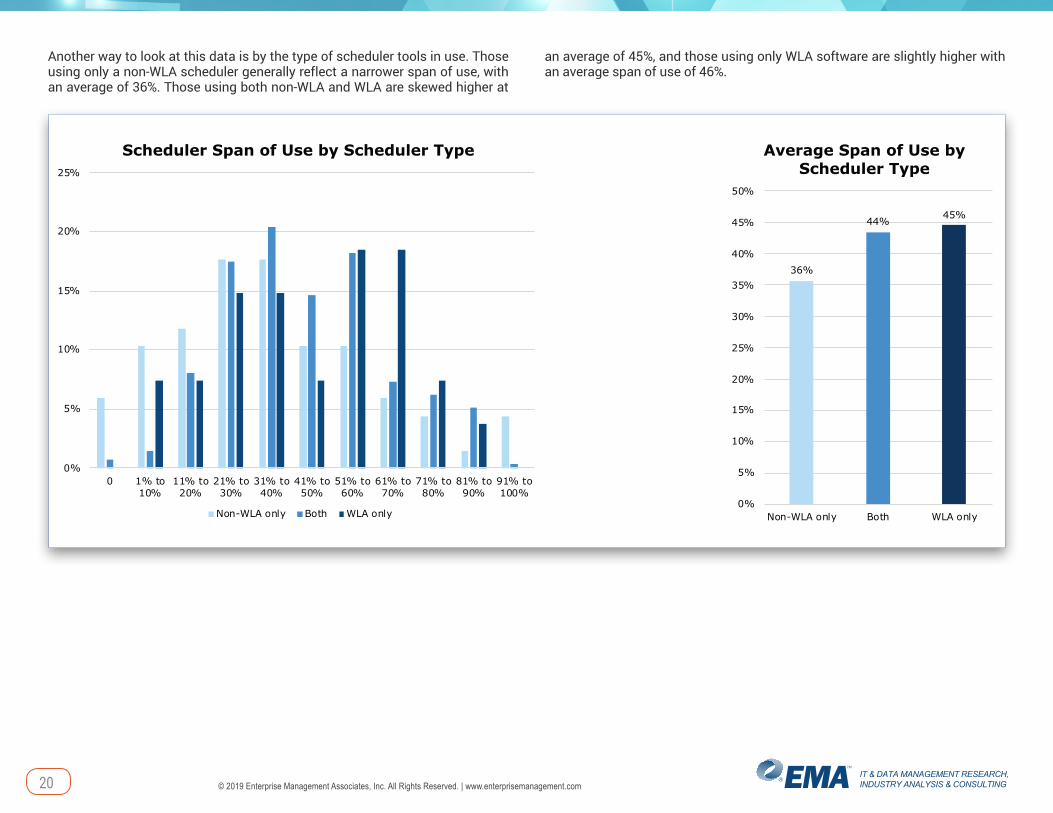
Another way to look at this data is by the type of scheduler tools in use. Those using only a non-WLA scheduler generally reflect a narrower span of use, with an average of 36%. Those using both non-WLA and WLA are skewed higher at
an average of 45%, and those using only WLA software are slightly higher with an average span of use of 46%.
0%
5%
10%
15%
20%
25%
0 1% to10%
11% to20%
21% to30%
31% to40%
41% to50%
51% to60%
61% to70%
71% to80%
81% to90%
91% to100%
Scheduler Span of Use by Scheduler Type
Non-WLA only Both WLA only
36%
44%45%
0%
5%
10%
15%
20%
25%
30%
35%
40%
45%
50%
Non-WLA only Both WLA only
Average Span of Use by Scheduler Type
21 ENTERPRISE MANAGEMENT ASSOCIATES®
© 2019 Enterprise Management Associates, Inc. All Rights Reserved. | www.enterprisemanagement.com
EMA PerspectiveIf there is one theme that comes out loud and clear from this research, it is that application modernization and digital transformation are driving forces in many organizations, and those activities are stressing scheduling and automation tools to the point at which many are looking for better answers. This is true for many organizations using only environment-specific schedulers, such as Windows Task Scheduler, Cron, AWS Batch, and Azure Scheduler. It is true for those using open-source schedulers, such as Apache Airflow, Apache Ozie for Hadoop, and Azkaban. It is also true for those using an enterprise-class workload automation (WLA) product. The top two reasons for discontinuing a product or the criteria for selecting a new one are consistently application modernization and digital transformation.
In contrast to expectations of finding large numbers of potentially new WLA users, only 16% of respondents were using only environment-specific (non-WLA) schedulers, such as Windows Task Scheduler, Cron, and others, while 65% were using one or more non-WLA scheduler and one or more enterprise-class WLA product. However, this study uncovered tremendous pent-up demand to change to new WLA software in Asia, where 73% say they are considering migrating to new WLA software. This is part of a trend first identified by EMA in 2013 where 30% of users, primarily in North America, planned to migrate to new
WLA software. By 2016, this number grew to 52% in North America and Europe. In 2018, North America and Europe had 44% of users planning to migrate—a decline from 2016 numbers since many had already made their move to new software. The trend seems to have started later in Asia, but looks to be about to break loose.
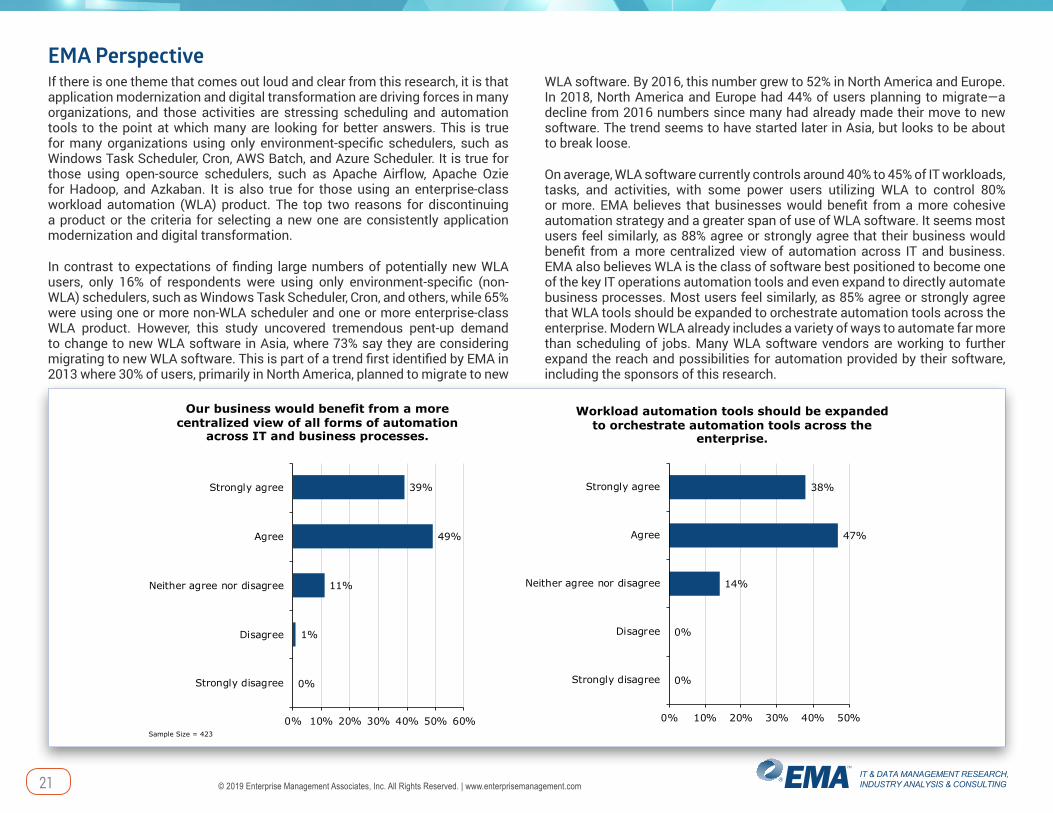
On average, WLA software currently controls around 40% to 45% of IT workloads, tasks, and activities, with some power users utilizing WLA to control 80% or more. EMA believes that businesses would benefit from a more cohesive automation strategy and a greater span of use of WLA software. It seems most users feel similarly, as 88% agree or strongly agree that their business would benefit from a more centralized view of automation across IT and business. EMA also believes WLA is the class of software best positioned to become one of the key IT operations automation tools and even expand to directly automate business processes. Most users feel similarly, as 85% agree or strongly agree that WLA tools should be expanded to orchestrate automation tools across the enterprise. Modern WLA already includes a variety of ways to automate far more than scheduling of jobs. Many WLA software vendors are working to further expand the reach and possibilities for automation provided by their software, including the sponsors of this research.
Workload automation tools should be expanded to orchestrate automation tools across the
enterprise.
38%
47%
14%
0%
0%
0% 10% 20% 30% 40% 50%
Strongly agree
Agree
Neither agree nor disagree
Disagree
Strongly disagree
Sample Size = 423
Our business would benefit from a more centralized view of all forms of automation
across IT and business processes.
39%
49%
11%
1%
0%
0% 10% 20% 30% 40% 50% 60%
Strongly agree
Agree
Neither agree nor disagree
Disagree
Strongly disagree
22 ENTERPRISE MANAGEMENT ASSOCIATES®
© 2019 Enterprise Management Associates, Inc. All Rights Reserved. | www.enterprisemanagement.com
About ASG TechnologiesASG Technologies is an award-winning, industry-recognized and analyst-verified global software company providing the only integrated platform and flexible end-to-end solution for the information-powered enterprise. ASG’s Information Management solutions capture, manage, govern and enable companies to understand and support all types of information assets (structured and unstructured) and stay compliant. ASG’s IT Systems Management solutions ensure that the systems and infrastructure supporting that information lifecycle are always available and performing as expected. ASG has over 3,500 customers worldwide in top vertical markets including Financial Services, Healthcare, Insurance and Government. Visit us at ASG.com, LinkedIn, Twitter and Facebook.
About Enterprise Management Associates, Inc.Founded in 1996, Enterprise Management Associates (EMA) is a leading industry analyst firm that provides deep insight across the full spectrum of IT and data management technologies. EMA analysts leverage a unique combination of practical experience, insight into industry best practices, and in-depth knowledge of current and planned vendor solutions to help EMA’s clients achieve their goals. Learn more about EMA research, analysis, and consulting services for enterprise line of business users, IT professionals, and IT vendors at www.enterprisemanagement.com or blog.enterprisemanagement.com. You can also follow EMA on Twitter, Facebook, or LinkedIn.
This report in whole or in part may not be duplicated, reproduced, stored in a retrieval system or retransmitted without prior written permission of Enterprise Management Associates, Inc. All opinions and estimates herein constitute our judgement as of this date and are subject to change without notice. Product names mentioned herein may be trademarks and/or registered trademarks of their respective companies. “EMA” and “Enterprise Management Associates” are trademarks of Enterprise Management Associates, Inc. in the United States and other countries.©2019 Enterprise Management Associates, Inc. All Rights Reserved. EMA™, ENTERPRISE MANAGEMENT ASSOCIATES®, and the mobius symbol are registered trademarks or common-law trademarks of Enterprise Management Associates, Inc.
Corporate Headquarters: 1995 North 57th Court, Suite 120 Boulder, CO 80301 Phone: +1 303.543.9500 Fax: +1 303.543.7687 www.enterprisemanagement.com
3894.09042019