the great ri flood of 2010: a hydrological assessment great ri flood hydrologi… · ·...
TRANSCRIPT

The Great RI Flood of 2010:A Hydrological Assessment
Dr. Tom BovingUniversity of Rhode Island
Member of the WPWA Board
Blue Pond dam breach; Photo: Chris Fox

Overview
• A few words about statistics
• Preludes to a Disaster• The 2010 Flood• The Aftermath• 2011 …one year later• The Future
WPWA Headquarters; Photo: Chris Fox
Tom Boving - URI

100 yr Rain event vs. 100 yr Flood
Updated valuesPrevious values
Source: NRCC - Northeast Regional Climate CenterTom Boving - URI
100 yr Rain

A few words about Flood Statistics
– “100-year flood” is misleading!
– Recurrence interval: the probability that a given event will be equaled or exceeded in any given year.
• Better: “…a flood having a 100-year recurrence interval.”
• Plain English: “a flood of that magnitude has a 1 percent chance of happening in any year.”
Tom Boving - URI

"100-year floods can happen twice in a year"
• What are the odds of that happening?
• Answer: 0.01% chance of recurrence
Tom Boving - URI
Example:Pawtuxet River at Cranston

• Well,…2010 must have been RI’s “lucky” year then!
Tom Boving - URI
"100-year floods can happen twice in a year"

What about a 500-year flood?
• The probability of a 500-year flood in any given year is 0.2 %.
• Compared to winning the lottery, those odds are act actually pretty high…
This will be on the test.
Tom Boving - URI

But it’s not all about rain amounts!
WarwickMall
PawtuxetRiver

CharlestownMoraine RIGIS
Glacial Geology Map
March: Tree Pumps were not going!swardraws.com

Preludes
Horseshoe Dam, Pawcatuck River in Shannock; Photo: Chris Fox

Groundwater Conditions
Feb. 2010:
USGS designated RI ground-water levels generally as above normal, with the exception of the eastern RI which was generally designated as normal.
USGS – Richmond, RI
Tom Boving - URI
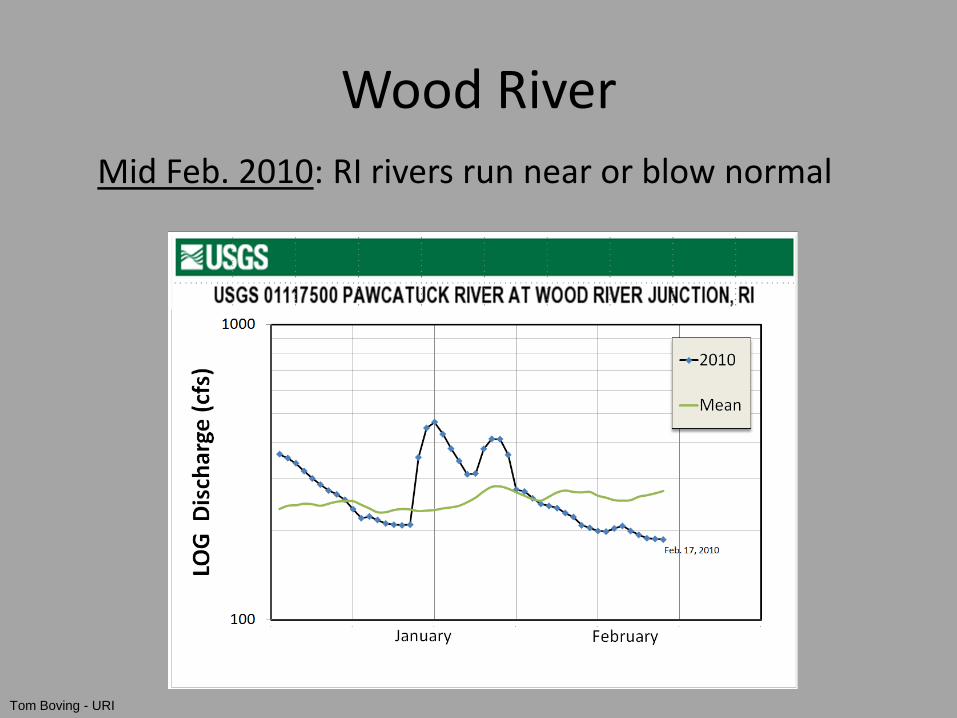
Wood River Mid Feb. 2010: RI rivers run near or blow normal
Tom Boving - URI
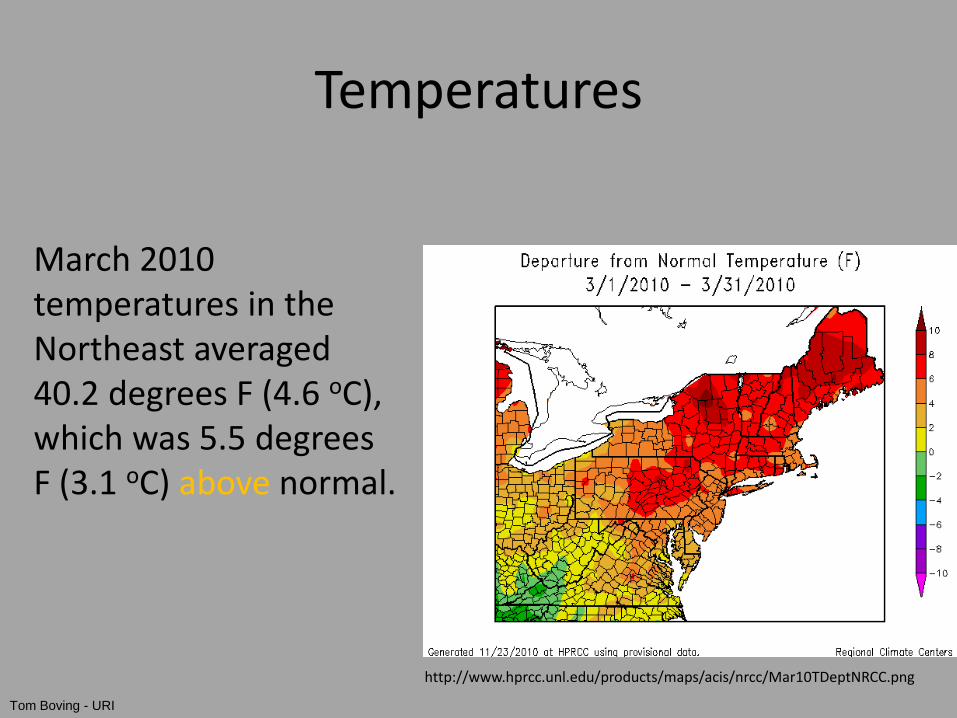
Temperatures
http://www.hprcc.unl.edu/products/maps/acis/nrcc/Mar10TDeptNRCC.png
March 2010 temperatures in the Northeast averaged 40.2 degrees F (4.6 oC), which was 5.5 degrees F (3.1 oC) above normal.
Tom Boving - URI

March 2010: Warmest on record in RI.
http://www.ncdc.noaa.gov/sotc/service/national/timeseries02/037-00/201003-201003.gifTom Boving - URI

“Normal” Precipitation(Average per month: 3.87 in)
Tom Boving - URI

“Normal” Precipitation(Annual Total: 46.45 in)
Tom Boving - URI

2010 Precipitation(TF Green AP)
7.8 in …right on target!
Tom Boving - URI

…and then March ‘10 came around
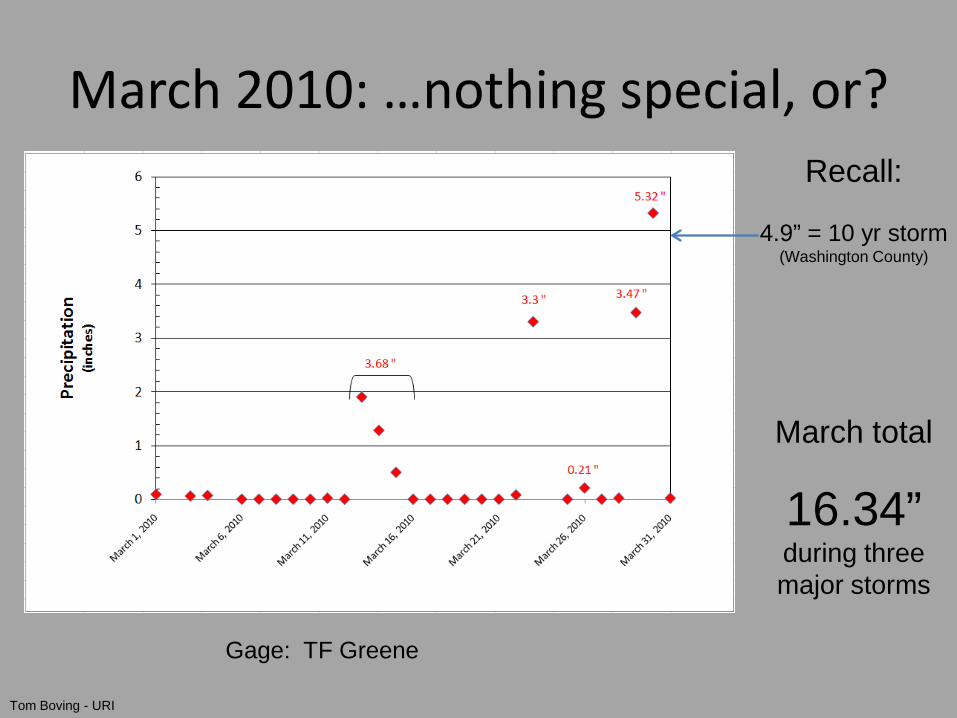
March 2010: …nothing special, or?
Gage: TF Greene
Recall:
4.9” = 10 yr storm(Washington County)
March total
16.34”during three major storms
Tom Boving - URI

2010 Precipitation(TF Green AP)
www.crh.noaa.gov
16.34 in11.91 in
above normal
Tom Boving - URI
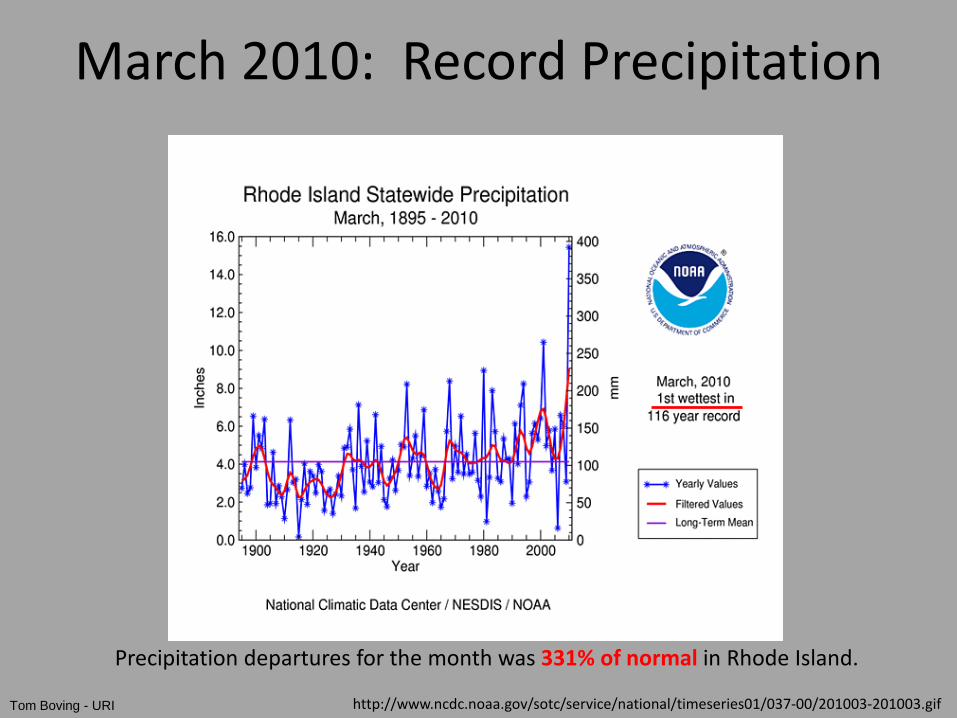
March 2010: Record Precipitation
http://www.ncdc.noaa.gov/sotc/service/national/timeseries01/037-00/201003-201003.gif
Precipitation departures for the month was 331% of normal in Rhode Island.
Tom Boving - URI

Northeast in March 2010331% above normal precipitation
…that’s not good!
http://www.nrcc.cornell.edu/impacts/Impacts_03-10.html#Tom Boving - URI

Three storms…one big disaster.

Source: NOAAhttp://www.erh.noaa.gov/box/pnsevents/wxeventsCalendar.php?month=12&year=2010
Tom Boving - URI
Storm I

The first round of storms left Boston with a monthly total of 7.45
inches; Bridgeport, Conn. at 4.02 inches; and Portland, Maine reported 3.57 inches of rain.
…but that was just the beginning!Tom Boving - URI

Source: NOAA
Tom Boving - URI
Storm II

Source: NOAA
Tom Boving - URI
Storm III

View from Space
• The video shows GOES observations from March 21 through 31, 2010.
• Credit: NASA/GOES Project
http://www.nasa.gov/mp4/438231main_100321-31.floods.mp4
Tom Boving - URI


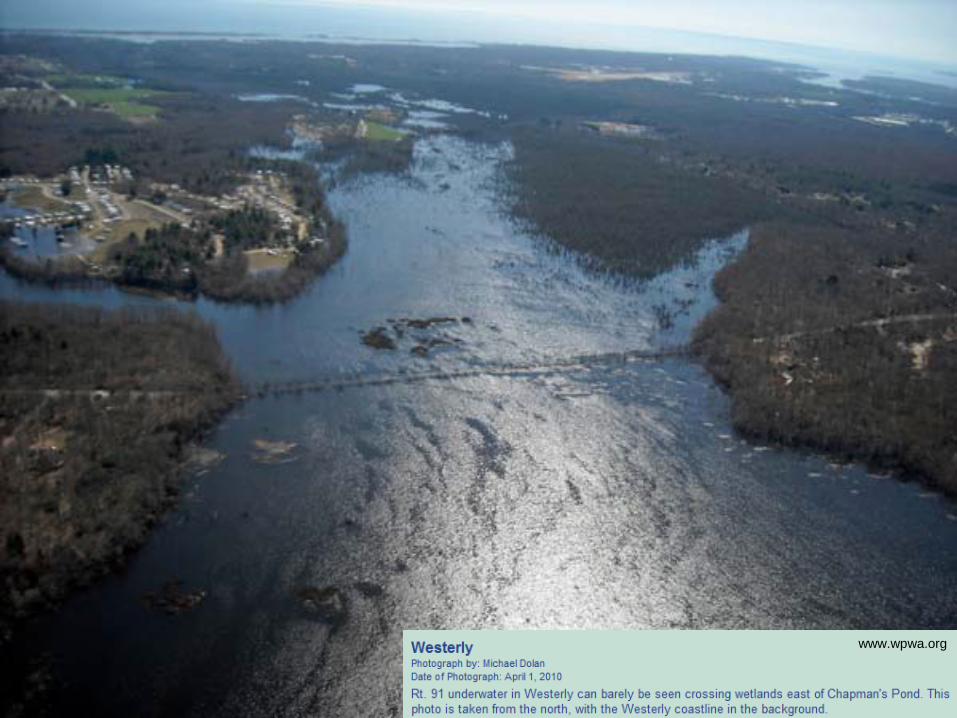
The Flood
Route 91 @ BradfordPhotograph by: Tom Tetzner

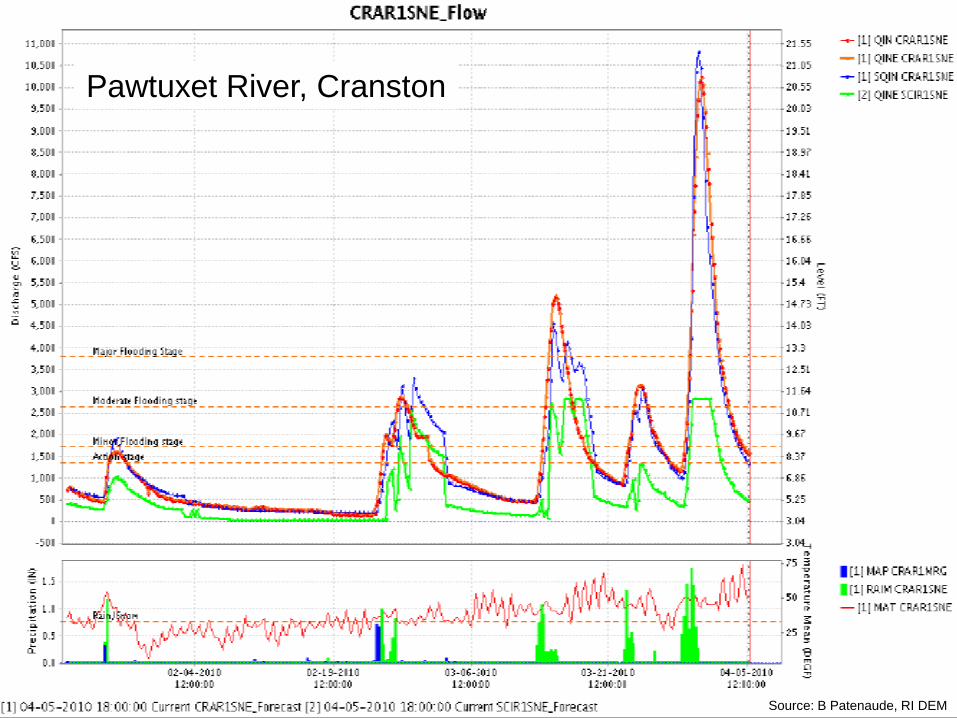
USGS calls RI River Flows “Historic”
• 22 of the 27 long-term network streamgages that measure the state’s rivers and streams exceeded their previous period of record peaks.– The Pawtuxet River at Cranston sets new records, exceeding the 9.00
foot flood stage by 11.79 feet and flow (14,100 cfs) versus the previous records of 5.50 feet above flood stage and 5,440 cfs of flow set in 1982.
– The Pawcatuck River at Westerly also set a new record for flow at 9,390 cfs versus the previous record of 7,070 cfs set in 1982.
– The Blackstone River at Woonsocket exceeded its 9 foot flood stage by 5.5 feet and had a preliminary peak flow of 14,900 cfs.
http://www.usgs.gov/newsroom/article.asp?ID=2432Tom Boving - URI

Source: B Patenaude, RI DEM
Source: B Patenaude, RI DEMTom Boving - URI
Source: B Patenaude, RI DEM
Pawtuxet River, Cranston

10
100
1000
10000
0 30 60 90 120
LOG
Dai
ly D
isch
arge
(cfs
)Mean
Mean
January February March April
Tom Boving - URI

10
100
1000
10000
0 30 60 90 120
LOG
Dai
ly D
isch
arge
(cfs
)
2010
Mean
January February March April
Tom Boving - URI

WOOD RIVER AT HOPE VALLEY, RI
• USGS Station 01118000
• Record: March 30, 2010: *– Gage height: 13.72 ft– Discharge: 5,470 ft3/s
• Previous: June 06, 1982– Gage height: 10.26 ft– Discharge: 2,390 ft3/s
Dam on the Wood River, Hope Valley(Source: RI DEM)
* USGS: <0.2% = >500-year recurrence intervalTom Boving - URI
www.wpwa.org

www.wpwa.org

Switch Road, Hope ValleyPhoto: Tom Boving

Switch Road, Hope ValleyPhoto: Tom Boving

Woodville Road, Wood RiverPhoto: Tom Boving

Woodville Road, Wood RiverPhoto: Tom Boving

Main St., Hope ValleyPhoto: Tom Boving

Main St., Hope ValleyPhoto: Tom Boving
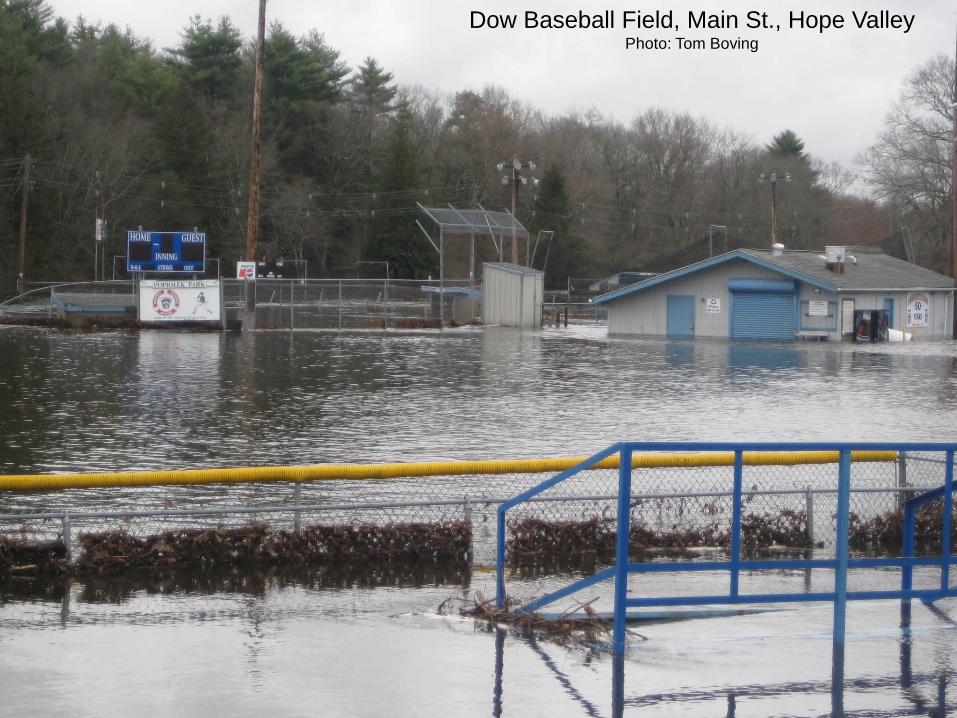
Dow Baseball Field, Main St., Hope ValleyPhoto: Tom Boving


Woodville Road, Wood RiverPhoto: Tom Boving
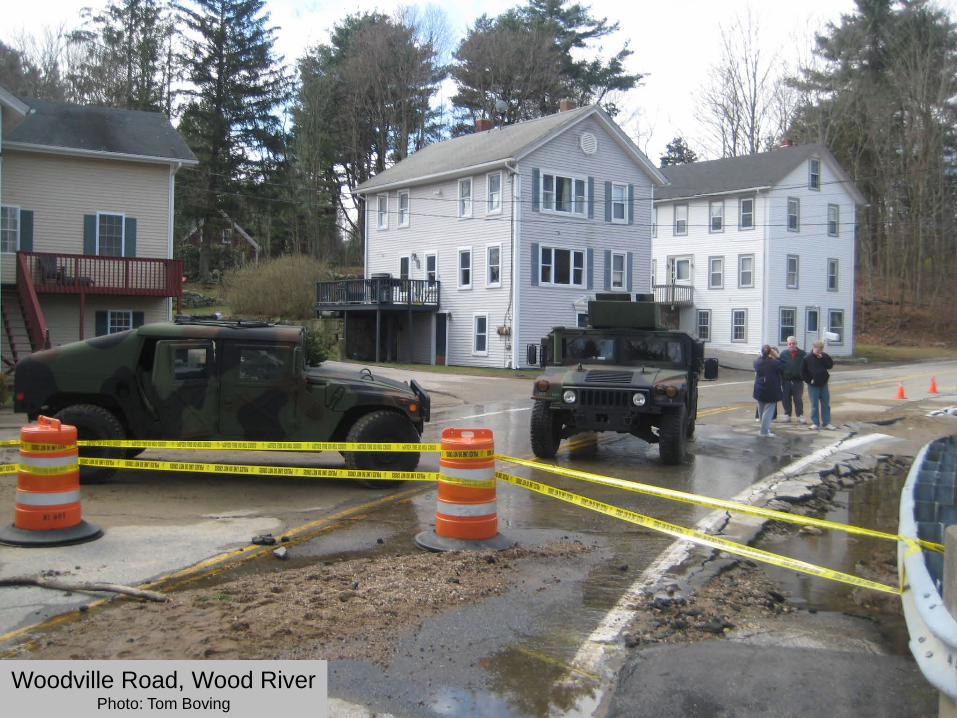
Woodville Road, Wood RiverPhoto: Tom Boving
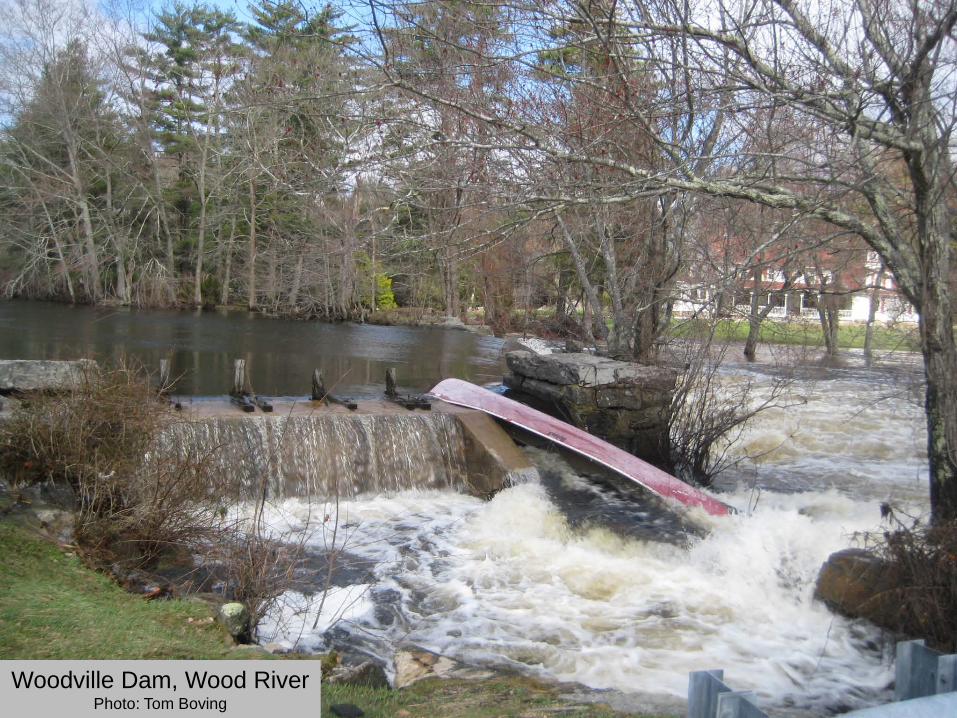
Woodville Dam, Wood RiverPhoto: Tom Boving
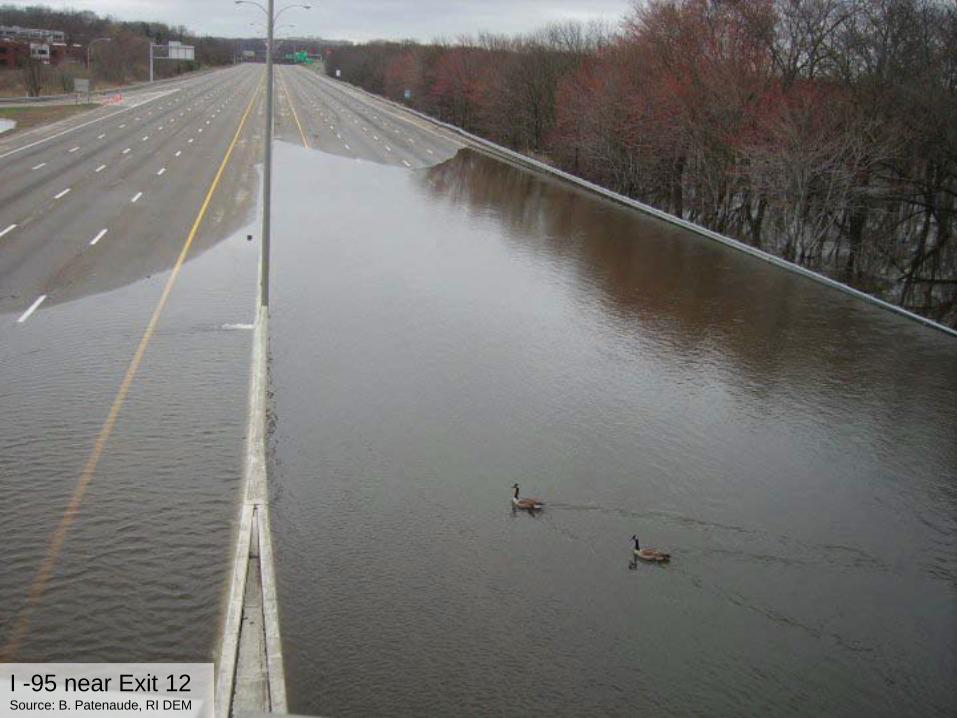
I -95 near Exit 12Source: B. Patenaude, RI DEM


Then and Now
Tom Boving - URI
Wyoming Dam, Wood RiverPhoto: Tom Boving

Putting things into perspective
http://waterwatch.usgs.gov/new/wwapps/ftc.php?site_no=01118000
Tom Boving - URI

10
100
1000
10000
0 30 60 90 120
LOG
Dai
ly D
isch
arge
(cfs
)
2010
2011
Mean
January February March April
Tom Boving - URI

http://waterwatch.usgs.gov/new/index.php?sno=01117800&yr=2011&dt=dv07d&btnGo=GO&m=sitedur&s=&sno2=01118000
USGS Streamflow Duration Hydrographs
Tom Boving - URI

Groundwater levels: Normal
http://groundwaterwatch.usgs.gov/AWLSites.asp?S=412844071422802
Tom Boving - URI

http://waterw
atch.usgs.gov/new/index.php?m
=real&r=ri&w=m
ap
What a differencea year makes….
Tom Boving - URI

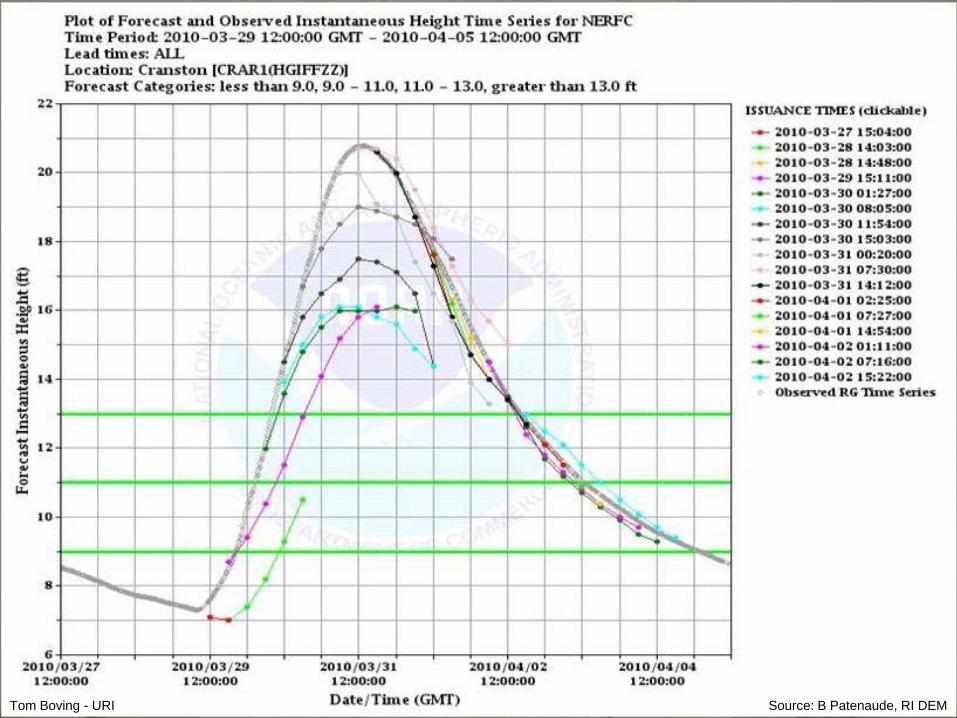
Advanced Hydrologic Prediction Service (AHPS) - River Forecast
http://water.weather.gov/ahps2/index.php?wfo=box
March 08, 2011: Snow melt
March 30, 2011
Pawtuxet River, Cranston
http://www.weather.gov/oh/ahps/
Tom Boving - URI

http://water.weather.gov/ahps2/rfc/CRAR1.QINE.exceed.90day.gif
The conditional simulation (CS) line indicates chances of the river going above given levels based on current conditions. The historical simulation (HS) line indicates the
chances of the river going above given levels based on the total range of past levels.
Tom Boving - URI

Was all the news bad???
Tom Boving - URI

• The flood runoff produced the lowest salinity surface water and the highest April concentrations of phytoplankton ever measured during the 12 years of a study in Narragansett Bay.
http://www.nefsc.noaa.gov/press_release/2010/SciSpot/SS1006/index.htmlTom Boving - URI
R.I. Floods May Have Positive Impact on Commercial Fish, Shellfish Industries
• Perfect timing: When the water is cold, as occurred during the spring 2010 flood, the bacteria do not consume the phytoplankton quickly enough to deplete the dissolved oxygen in the water.”
• “The flooding is likely to benefit Narragansett Bay’s commercial finfish and shellfish industries for some time to come.”
http://www.nefsc.noaa.gov/press_release/2010/SciSpot/SS1006/index.htmlTom Boving - URI

The Future
…more of the same?
Tom Boving - URI

Climate Change: Effects in the Northeast
Precipitation
• Rainfall is expected to become more intense and periods of heavy rainfall are expected to become more frequent.– Number of heavy-precipitation events is projected to
increase 8 % by mid-century, and 12 % to 13 % by the end of the century.
– In Maine, New Hampshire, and Vermont the probability of high-flow events may increase as much as 80 %, accompanied by an increased risk of flooding.
www.northeastclimateimpacts.org/Tom Boving - URI
Climate Change: Effects in the Northeast
Temperature
• Since 1970, the Northeast has been heating up at a rate of 0.5°F per decade. Winter temperatures have been rising even faster—1.3°F per decade between 1970 and 2000.
• Average temperatures are projected to rise another 2.5 to 4 °F in winter and 1.5°F to 3.5°F in summer above historic levels over the next several decades.
www.northeastclimateimpacts.org/Tom Boving - URI

Migrating State Climates
Tom Boving - URI
My suggestion:Start planting palm trees!

The EndQuestions?


More Strong Earthquakes?
0
5
10
15
20
25
1990 1995 2000 2005 2010
No.
Ear
thqu
akes
8.0-9.9 7.0-7.9
http://earthquake.usgs.gov/earthquakes/eqarchives/year/eqstats.phpTom Boving - URI