the george w. bush institute’s education reform initiative...
TRANSCRIPT

MICHAEL CASSERLY, Ex e c u t i v e D i r e c t o r, Co u n c i l o f t h e G r e a t Ci t y Sc h o o l s
MICHAEL EUGENE, Ch i e f O p e ra t i n g Of f i c e r, Ora n g e Co u n t y Pu b l i c Sc h o o l s
Key Performance Indicators: From Promise to Payoff
The George W. Bush Institute’s Education Reform Initiative PresentsThe Productivity for Results Series
NO. 2 FEB 2014

PA G E 1
Key Performance Indicators
I N T R O D U C T I O N
In 2005, when the Council of the Great City Schools and its member districts began developing a series of key performance indicators, we had little idea how useful they would prove to be. At the time, chief financial officers and chief operating officers in the nation’s major urban school systems realized that they lacked the tools to assess their performance or to compare themselves to one another….

PA G E 1
Key Performance Indicators
What followed that realization was a unique project that involved senior staff from large-city school systems across the country. The members of that project came together over several years to design, pilot, and implement a performance management system (PMS) that is unique in public education and maybe in municipal and state government.
The work was carried out under the aegis of two Council task forces—one on leadership, governance, and management, and the other on finance. Both were led by urban school superintendents and school board members. Staff teams from the city school systems were set up in 2005 in four broad functional areas to design the performance management system to its last detail. (The four areas were business operations, budget and finances, human resources and information technology.)
Potential key performance indicators were created, reviewed, debated, and included or excluded based on their value to Council-member school districts. For example, the key value of bus transportation to a school system is a function of safety, timeliness, and cost. So, measures were created around the degree to which those values were realized. Options for measuring the indicators were considered, variations were contemplated, and Six Sigma methodology was applied to make the measures comparable across cities. Formulas for turning the raw data into clear performance measures were written. Draft indicators were tested across cities and the entire process was repeated multiple times until the technical teams were convinced that an item was viable.
An expanding set of KPIs was then tailored to the informational needs of staff at different levels of school district governance and decision-making. Power Indicators, for instance, were designed for school boards and superintendents; a category called the Essential Few indicators were developed for chief officers and department heads; and general Performance Indicators were incorporated for operational staff. (See exhibit 1 for a list of power indicators as of the end of 2013.)
From the outset, the goals of the project included:
• Establishing a common set of key performance indicators (KPIs) in a range of big-city school operational areas;
• Benchmarking and comparing the performance of the nation’s largest urban school systems on these key performance indicators;
• Identifying and documenting effective management practices of the top-performing districts to help urban school districts nationwide improve their operations;
• Automating the performance data in a way that would allow districts to improve resource deployment and decision making over time; and
• Developing standards of excellence on each of the indicators, and eventually expanding the system to incorporate lead indicators in academic areas as well as operations.

Exhibit 1. Power Indicators by Operating Area
Function Operating Area Power Indicator
Finance Accounts Payable Accounts payable per $100k revenue
Accounts payable costs per invoice
Days to process invoices
Invoices processed per FTE per month
Cash Management Cash flow—short-term loans per $100k revenue
Investment earnings per $100k
Compensation Paychecks processed per FTE per month
Payroll costs per $100k spend
Payroll costs per paycheck
Financial Management Debt principal ratio to district revenue
Debt servicing costs ratio to district revenue
Fund balance ratio--unassigned
Fund balance ratio—uncommitted
Fund balance ratio—unrestricted
Expenditure efficiency—final budget vs. actual spend
Revenue efficiency—final budget vs. actual revenue
Grants Management Grant funds as percent of total budget
Grant-funded staff as percent of district FTEs
Returned grant funds per $100k grant revenue
Procurement Competitive procurements ratio
Procurement cost per $100k spent
Procurement cost per purchase order
Procurement savings ratio
Strategic sourcing ratio
Risk Management Cost of risk per student
Workers compensation cost per $100k payroll spend
Workers compensation cost per employee
Workers compensation lost work days per 1,000 FTE
Operations Food Services Cost per meal
Food cost per meal
Fund balance as percent of revenue
Total costs as percent of revenue
Breakfast participation rate
Lunch participation rate
Supper participation rate
PA G E 3
Key Performance Indicators
PA G E 2
Key Performance Indicators

PA G E 3
Key Performance Indicators
PA G E 2
Key Performance Indicators
Function Operating Area Power Indicator
Maintenance & Operations Cost of custodial work per square foot
Custodial workload
Cost of routine maintenance per square foot
Cost of major maintenance per student
Cost of renovations per student
Work-order completion time in days
Safety & Security Assault/battery incidents per 1,000 students
People incidents per 1,000 students
Security expenditures per 1,000 students
Security expenditures as percent of district budget
Security staff per 1,000 students
Training hours per security personnel
Transportation Average age of bus fleet
Cost per mile operated
Cost per rider
On-time performance
Human Resources Substitute placement rate
Teacher absences per teacher
Teacher retention by year
Teacher vacancies on first day of school
Information Technology Average age of computers
Computers per employee
Computers per student
IT spending per district FTE
IT spending per student
IT spending as percent of district budget
Network bandwidth per 1,000 students
Network bandwidth per 1,000 users As the ability to define the measures and collect comparable data on them grew, so did the possibilities of what one could do with such a system. We laid out some of those possibilities in a book chapter, “Managing for Results in America’s Great City Schools.” But in the last several years since that chapter was written, the performance management system has moved ever more convincingly from promise to payoff.

PA G E 4
Key Performance Indicators
The initiative is now managed under the aegis of the Council by its director of management services, Robert Carlson, and the chief operating officer from the Orange County Public Schools, Michael Eugene. The project has backing from Council staff and technical team support from school district executives around the country.
The KPI system is now in use, at least in part, in the vast majority of the nation’s big-city school systems. It is beginning to produce efficiencies and savings in a number of these urban school districts, and is helping to identify best practices. Moreover, it has been evaluated by an independent third-party. It is expanding into the academic arena. And it is being rolled out for the use of other school systems across the nation. Still, there is much more potential to realize. The following chapter summarizes some of the ongoing work on the system, its results to date, and what we envision for its future.
H O W T H E P E R F O R M A N C E M A N A G E M E N T S Y S T E M W O R K S : T H E P R O M I S E
The process of operating and maintaining the performance management system developed by the Council of the Great City Schools begins with annual data collection to ensure districts have the most current indicators available. District staff members provide raw data using an online survey that requests information on some 1,000 data elements, and these data are used to produce some 500 performance measures in four functional areas, including business operations (transportation, food services, facilities maintenance and operations, and safety and security), budget and finance, human resources, and information technology.
Once the performance measures are calculated, the data are placed into a data dashboard that graphically benchmarks the performance of each individual urban school district against the performance of other big-city districts nationwide and the norm or median of all responding urban districts. Immediately, district executives have strategic data that can assist them in identifying where they lead or lag. They can identify top-performing districts in any function or activity on which a district would like to improve. From there a district can work through the Council of Great City Schools to connect to top-performing districts and identify practices that have produced statistically proven results in other city school systems.
A key benefit of the data is this timeliness for strategic planning. While other comparative data exist from other sources, those data have often aged as much as three years before they are published. This lag undermines the relevance of data for planning purposes. In contrast, the Council’s KPI data is based on data from the most recent full fiscal year. This makes the information timely and relevant for a school district’s strategic planning process. Further, the use of the automated data-modeling tool in the online system allows districts with rapidly changing performance to update their information to enhance precision in planning. Finally, once districts have focused on where they need improvement, identified top-performing peers in a particular area, and inventoried practices that produce better results, the automated system and its data-modeling tool help districts identify what initiatives are needed to make improvements. This allows them to set targets, run calculations, and determine whether a contemplated improvement plan is likely to work and what the return-on-investment is likely to be. This is a significant change from the traditional method of incremental target-setting without a basis in business analytics. With this tool, district executives no longer face the dilemma of being “a mile wide and an inch deep,” as they can now prioritize a smaller set of areas on which to focus time and resources, while sustaining current performance in areas that are in good shape. Additionally, executives can move faster to implement effective practices and improve results knowing that they are backed by solid data and good research.
PA G E 5
Key Performance Indicators

PA G E 4
Key Performance Indicators
PA G E 5
Key Performance Indicators
E VA L U AT I O N A N D E M E R G I N G PAY O F F S O F T H E K P I S Y S T E M
In 2010, with modest funding provided by the Hewlett Foundation—the only external funding that has supported the initiative—the Council of the Great City Schools commissioned an external evaluation of the KPI system. The work was done by the American Institutes for Research (AIR). The goal of the evaluation was to provide the Council with feedback on the use, usability, and perceived impact of the key performance indicators in improving urban school district performance. The evaluation involved both individual interviews and surveys to examine how familiar line administrators in city school systems were with the KPIs, how likely they were to look at them, whether they learned things from them, what changes were made as a result of usage, what impact the system had on districts, and whether data were shared and decision-making in districts was improved.
An evaluation survey was administered to chief financial officers, chief operating officers, chief information officers, and human resource directors in the then-65 member districts of the Council. Of the 260 individuals who received the survey, 142 responded for a response rate of 55 percent. A sample of respondents was chosen for in-depth follow-up interviews.
The results of the surveys and the interviews indicated that administrators in the Great City Schools were clearly aware of the key performance indicators. Some 91 percent of respondents knew about the system while only eight percent indicated they were not familiar with it. Most of those indicating they were not familiar were either human resource directors or individuals who had been on the job for less than a year — or both.
In addition, about 85 percent of those who knew about the KPIs reported that they had used the system in the last 12 months, and 64 percent had used it in the last two months. Some 15 percent of those who were familiar with the KPIs did not use them. Those saying that they did not use the system cited not having the time, not knowing enough about the KPIs, not being in their current positions long enough to know how to use the system, or not being able to make the comparisons they wanted with the system.
Each of the 65 districts had at least one registered user of the KPI system, and the average urban school system had 17 registered users. These users were typically senior line managers and program administrators.
Also, the survey results found that 100 percent of administrators who knew of the KPI system reported that it was useful, and 15 percent indicated that it was essential to their jobs. An additional 37 percent reported that the system was very useful, and 48 percent responded that the system was somewhat useful. About 67 percent of respondents reported that they learned something useful from the KPIs that helped them in their jobs; about 20 percent reported that they learned a lot that helped them in their positions; about 10 percent indicated that they learned things but that they were not helpful in performing the job; and three percent reported that they either learned nothing or were unsure.
When asked about what was useful in the KPI data, respondents indicated that the greatest utility rested in their ability to compare their performance with other districts. Others reported that the system was useful in helping to shape and drive district goal-setting and benchmarking efforts. Finally, respondents reported that the system was useful in spurring their internal discussions about school district performance and options for improvement.
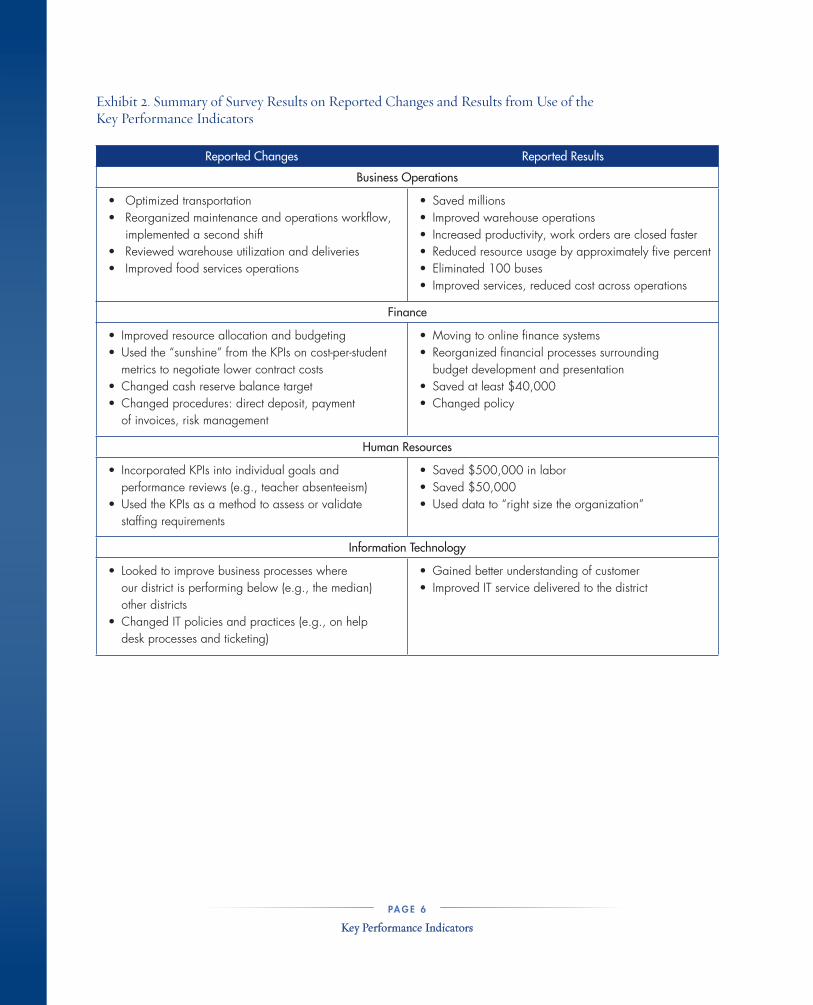
In terms of changes resulting from use of the KPI system, the evaluation results indicated that the KPIs mostly helped participating districts identify areas in need of improvement. Many districts reported acting on the information, many with tangible results. Some 45 percent of respondents indicated that they or their staff members had made changes to their operations based on the KPI data; 42 percent said they had not; and 13 percent were not sure if changes were made. Exhibit 2 below summarizes some of the major changes that respondents indicated they had made in their districts as a result of the KPI system and the results they had seen as of 2011.
PA G E 6
Key Performance Indicators
Exhibit 2. Summary of Survey Results on Reported Changes and Results from Use of the Key Performance Indicators
Reported Changes Reported Results
Business Operations
• Optimized transportation • Reorganized maintenance and operations workflow, implemented a second shift • Reviewed warehouse utilization and deliveries • Improved food services operations
• Saved millions• Improved warehouse operations• Increased productivity, work orders are closed faster• Reduced resource usage by approximately five percent• Eliminated 100 buses• Improved services, reduced cost across operations
Finance
• Improved resource allocation and budgeting• Used the “sunshine” from the KPIs on cost-per-student metrics to negotiate lower contract costs• Changed cash reserve balance target• Changed procedures: direct deposit, payment of invoices, risk management
• Moving to online finance systems• Reorganized financial processes surrounding budget development and presentation • Saved at least $40,000• Changed policy
Human Resources
• Incorporated KPIs into individual goals and performance reviews (e.g., teacher absenteeism)• Used the KPIs as a method to assess or validate staffing requirements
• Saved $500,000 in labor • Saved $50,000 • Used data to “right size the organization”
Information Technology
• Looked to improve business processes where our district is performing below (e.g., the median) other districts• Changed IT policies and practices (e.g., on help desk processes and ticketing)
• Gained better understanding of customer• Improved IT service delivered to the district
PA G E 7
Key Performance Indicators

PA G E 6
Key Performance Indicators
PA G E 7
Key Performance Indicators
U S I N G T H E K P I T O I M P R O V E O P E R AT I O N A L P E R F O R M A N C E A N D S AV E M O N E Y
So how have districts used the KPI to improve operational performance? The AIR evaluation indicated that the KPI system has already helped urban school districts identify areas in need of improvement and maximize resources through cost savings, efficiencies, data collection and benchmarking, budgeting and decision-making, and identification of best practices. Examples of these uses are described briefly below.
Cost Savings
Districts have reported cost savings that have ranged from $25,000 to $12 million through their use of the KPIs. For example, as a result of the KPIs, Cincinnati changed labor practices and menus in its food services operations, altered staffing and supplies in custodial services, and increased training in maintenance staff and found that “cost savings have been substantial, in the range of $10 - 12 million per year.” In addition, Clark County (Las Vegas) reported that “We use the metrics for comparative performance assessment and to identify and target any weak areas,” which has led to “significant” gains in efficiency and savings in the “millions.”
A particularly good example of how the KPI system has saved money for school systems is found in Orange County (Orlando). Orange County Public Schools (OCPS) has one of the larger district-owned bus fleets in the country. To save on transportation costs, initially, the district attempted to reduce costs by making adjustments to its bell schedule. But the changes resulted in significant push-back from parents and others, and created the need to come up with different cost-cutting strategies. To explore other options, OCPS retained a consulting group to conduct an audit of the district’s transportation operations. OCPS management used the KPIs provided by the Council’s performance management system to verify audit findings and vice versa. Further, OCPS management used the data-modeling tool in the Performance Management System to establish targets to implement savings initiatives and efficiencies.
The external audit verified two years of data from the KPI system indicating that the district owned more buses than it needed to run routes for the nearly 73,000 students the school system transports each day. As a result, the district sold 280 buses at auction, generating one-time revenue of $1.7 million and saving an additional $90,000 in costs for mechanics to maintain the unneeded buses as well as untold amounts in fuel to run those buses. Further, the district was able to consolidate a number of routes with buses that were under utilized. The route improvements meant 44 routes were cut from the previous school year for a savings of about $1.9 million. The routing reductions also led to some staff cuts — two routing positions and two area managers — to eliminate redundancy, creating annual savings of an additional $178,000.
In addition, the district removed 71 late-model buses from the fleet and redeployed staff to cover absenteeism, resulting in a savings of approximately $3.7 million in operating costs. Finally, the routing efficiencies ultimately resulted in a reduction in average daily student ride-time (morning and afternoon travel time combined) on the buses from 94 minutes in 2009-10 to 84 minutes in 2010-11, or 11 percent.
The 2013-14 Winter Edition of “Florida School Bus” recently featured the OCPS transportation department’s use of the KPIs to drive sustainability initiatives while reducing costs. For example, through another KPI-driven initiative on anti-idling, OCPS eliminated 1,503 metric tons of emissions from the atmosphere, while saving $537,805. Other performance improvements driven by the KPIs include increased recycling, faster IT customer-service response times, shorter supply-delivery times to schools, increased savings through procurement, reduced false security system alarms, and more.

PA G E 8
Key Performance Indicators
The OCPS transportation team has continued to embed the use of KPIs into its leadership culture. OCPS Superintendent Dr. Barbara Jenkins expects decision-making to be based on data, and each of the eight departments in the operations division of the school system uses KPIs and benchmarks from the Council’s performance management system extensively in their work. KPIs are embedded in department scorecards to monitor progress on priorities in the strategic plan, and are then published in the annual “Service Efforts & Accomplishments” report of the district.
Efficiencies
The KPIs are also demonstrating their value in improving efficiencies over and above saving money. As one district in the Midwest indicated during the AIR interviews, efficiency is the name of the game: “As we approach operational costs more efficiently, the district has more funds for instruction. With limited budgets, this is critical for teaching and learning for children.”
Efficiencies reported by districts varied widely. A number of districts reported using the KPIs to help with the extensive downsizing of resources (five percent or more) that some districts are pursuing, including reducing personnel.
Kansas City, for example, “has been able to save money on the operations side of the house that is then available for instruction. In printing, processing checks and invoices, facilities work orders, and in other areas, we have reduced our costs per transaction.” In some cases, the district was able to move transactions online to speed up services, resulting in thousands of dollars in savings.
Indianapolis reported that as a result of the KPI system, the school system implemented an “Energy Conservation Program” to save on utility costs. It developed a maintenance cost budget and tracked expenses at each school building to reduce maintenance costs. Now “individual schools are much more aware of the cost of their maintenance requests.” The energy program is “projected to produce 10 percent savings in utility costs.”
Another district in the Midwest changed its budget reserve-balance target, revised internal control manuals to reflect updated standards, and initiated reviews of warehouse utilization, all of which the district expects to result in gains in efficiency or productivity.
Data Collection and Benchmarking
Use of the KPIs has also led to district alignment of data and dashboard systems. In several districts, including Charlotte-Mecklenburg, Seattle, Anchorage, Kansas City, and Broward County, the boards of education and staff members are fully aware of the KPIs and have begun integrating the measures into required reporting procedures in their districts.
In addition, the KPIs have spurred some districts to reconsider the types of data they collect and report. For example, one district reported that it began “collecting data on customer satisfaction that we did not collect previously.” Another reported “in-depth tracking of maintenance work” and yet another stated that it “established reports on these indicators to make it easier to pull data.”
Kansas City indicated that, “KPIs are not institutionalized within our district but that is the goal.” Since the evaluation of the system, Kansas City has built movement on some KPIs into the superintendent’s evaluation.
PA G E 9
Key Performance Indicators

PA G E 8
Key Performance Indicators
PA G E 9
Key Performance Indicators
Other districts pointed out that the KPIs serve as a way of validating and supporting functions and operations that are going well. For instance, Seattle reported that the KPIs proved useful as a way of “validating existing process strategies.” Another district noted that the KPIs helped validate some of the school system’s staffing patterns while questioning others.
Palm Beach, meanwhile, compared its information technology (IT) spending per student and per employee to other urban districts of similar size and compared their strategies to the initiatives in other districts, and was able to demonstrate their efficiency to stakeholders inside and outside the school system (and build perceived value for the organization).
Other districts reported that they:
• Use “KPIs as part of our budget reviews for operational areas with our school board.” –Southeastern district
• “Expanded the data that we collect and track to better address the KPIs set forth in the survey so that we can more accurately benchmark ourselves to our counterparts in the Council.” – Boston
• “Used KPIs to establish new and revise their previous KPIs.” – Midwestern district
• “Began to think about ways to better measure our activities. We also adopted some of the KPIs as performance measures we [are] committed to achieving.” – Southwestern district
Moreover, as intended, the KPI has become a benchmarking tool in many districts:
• “We used the KPI data on the percent of teacher absenteeism as a benchmark.” – District on the East Coast
• “[We] looked to improve business processes where our district is performing below the median of the other KPI responding districts.” – District in Midwest
• “We look at ways to reduce costs in areas where we were (are) expending more funds than comparison districts.” – District in the Southeast
• “We set benchmarks for our district to meet and/or exceed in order for the staff to manage their operations more efficiently and effectively.” – Another district in the Southeast

PA G E 1 0
Key Performance Indicators
Budgeting and Decision-Making
More than half of district leaders surveyed reported that the KPIs have also improved decision making in their districts. Decisions regarding staffing, budgeting, and the development of benchmarks were just some of the areas in which districts used KPI data to inform their work. The use of the KPIs allows districts to put costs into understandable terms when discussing the budget as a whole. Transportation staff can debate costs per student, maintenance staff can consider costs per square foot, food services staff can confer on costs per meal, etc. The manner in which the KPIs “unitize” costs, and illustrate those costs over time, can help communicate the budget in terms more accessible to policy makers and the public.
Five districts specifically cited budgeting as the place where KPIs helped decision making the most. For example, the chief financial officer of the Anchorage School District (ASD) reported that “ASD is using KPIs to make budgeting decisions.” Rochester City School District reported that it “reorganized financial processes surrounding budget development and presentation” based on the KPIs.
Others reported using KPI data to identify potential cuts and determine the best places for reductions in force.
Districts also pointed out that the KPIs serve to validate and support functions that are doing well. A southeastern district reported that they “use the KPIs as a method to validate staffing requirements.” Another district noted that it faced mounting pressure to eliminate central-office functions, and the KPIs helped to justify operational-staffing levels.
The KPIs have also helped “in determining which areas we should target for improvement.” The KPI enable the testing of policy and practice choices, so districts can assess “budget value to see that we are making good decisions.”
In other cases, the KPIs have resulted in decision-making that leads to additional investments in areas needing improvement. In Miami-Dade County, for example, “Data on computer-to-student ratios helped support our plans to meet students’ needs.” Boston noted that it was “able to use these benchmarks to advocate for additional resources.”
Throughout the interviews conducted as part of the AIR evaluation, a repeated theme was voiced: “The data helps us assess our situation and often causes us to pause and ask questions about ‘why we do things the way we do.’” Most responses implicitly referred to the idea that managers in the Springfield schools articulated: The KPIs are the “development of an industry standard.”
Orlando, again, has been a particularly active user of the KPI system to improve decision-making in part because its chief operating officer (COO) was one of the system’s key architects and advocates—and is a co-author of this paper. Using the KPIs, the COO and others in Orlando have determined that the district actually performs well compared with other cities in such areas as food service costs and fund balance, transportation safety, security system training and access control, information technology first-call resolution rates, and sole-sourcing procurement.
However, one area in need of improvement in the Orange County Public Schools, according to the KPIs, involved elementary-school breakfast participation rates for its neediest students — an indicator that can affect overall student academic performance. The data in the system indicated that Orlando would have to increase its breakfast participation rate for needy students by some 46 percent or by about 1.7 million additional breakfasts just to reach the national average. This would require significant program and policy changes in the school system — something the district’s managers were determined to accomplish.
PA G E 1 1
Key Performance Indicators

PA G E 1 0
Key Performance Indicators
PA G E 1 1
Key Performance Indicators
The district used the data-modeling feature of the KPI performance management system to help determine the level of effort that would be needed to accomplish such a large goal on a year-by-year basis. The COO and others in the district started by looking at top-performing urban school systems in school breakfast rates and found that those with the best participation actually required and implemented breakfast programs in all schools, had active “breakfast in the classroom” programs, had implemented either Provision 2 or Universal Breakfast programming, and coordinated programming with their principals and teachers.
District leaders took these examples of best practices, set goals, developed a plan, and had the school board consider and approve a wellness policy that requires a breakfast program in every school. The board instituted a universal breakfast program and a breakfast-in-the-classroom program, and administrators changed bus arrival times so children would have sufficient time to eat before classes started. As part of the implementation, the district also tracked factors that might influence the new policies, programs, and their implementation: the willingness of school-based staff to change practices to allow students to eat breakfast in classrooms, program effects on instructional time, meal production capacity at the district and school levels, and the like. While more changes in the plan to reach the national average are now moving into action, simply using the Council’s KPIs, benchmarks, and data-modeling tools, OCPS has already increased participation in its breakfast program for its neediest students by 139 percent (from 16.2 percent of needy students to 38.9 percent) in just two years.
OCPS still has much work to do, as the Council’s KPI system continues to show, given the fact that top-performing districts still far outpace Orlando in breakfast rates for needy students. However, the district has made significant gains, and has shown the capacity of the performance management system to deliver key strategic data quickly to decision makers to show where a district was strong, average or in need of improvement; to set empirically-based improvement targets; and to connect top performers in operational areas to spread the best practices at the root of the indicators.
In addition, OCPS is pursuing ways to rapidly increase its student participation rates in the broader meal program. While the district has built its strategic plan based on the KPI system and best practices of top performing school districts, one distinguishing characteristic comes up when OCPS compares itself to other school districts. In the vast majority of cases, districts with higher participation rates have a higher concentration of students in poverty.
In fact, the KPIs reveal that even accounting for participation among students that are not eligible for free/reduced price meals, districts with higher poverty rates tend to have higher school-meal participation rates. This probably points to a greater acceptance of the program and less feeling of stigmatization in the districts with greater concentrations of poverty. To address this common characteristic, OCPS is examining the need to address program appeal through marketing strategies such as chef partnerships, food shows, customer-designed menus, social media, and the purchasing of a food truck to connect to students through pop culture.
OCPS is also proactively pursuing strategies that do not stigmatize students, such as replacing the meal application with the name “Club Lunch,” and increasing the numbers of schools in Provision 2 and Community Eligibility programs where application forms can be eliminated. In cases like these, the KPIs serve as the basis for asking broader questions about why a school district’s performance looks like it does compared with other districts and what might be done to improve it. Further, using KPIs to assess the effectiveness of a district’s approach allows executives to quickly distinguish strategies and practices that produce efforts without outcomes, versus those that produce results.

PA G E 1 2
Key Performance Indicators
PA G E 1 3
Key Performance Indicators
Identification of Best Practices
Another way in which the key performance indicators are beginning to pay off is in their ability to identify best practices. This is done by identifying consistently top-performing districts using the indicators and then determining the procedures underlying both Power Indicators and the Essential Few—those practices that lead these districts to high performance. This is the type of information districts often spend thousands of dollars getting from high-priced management consulting firms. Now districts have immediate access to this information and the confidence of knowing it is backed up with statistically proven performance outcomes. Further, the Council’s KPI program assists districts in identifying best practices much faster, which is particularly beneficial when the demand for improvements is immediate. By calling management services staff at the Council, districts can be immediately connected to top-performing districts.
A specific example is in the area of accounts payable. Using the most recently collected data in this area, the KPI team determined that eight Great City School districts consistently scored in the top quartile in this area: the Wichita Public Schools, Portland Public Schools, the School District of Palm Beach County, Los Angeles Unified School District, Denver Public Schools, Minneapolis Public Schools, Charlotte-Mecklenburg Public Schools, and the Austin Independent School District.
Once the team identified districts that scored in the top rungs among other major city school districts in accounts payable, it devised a “best practices” survey that allowed chief financial officers and their staffs in these districts to describe the management and operational practices that lead their districts to produce high-quality outcomes. Questions on the survey were derived from best practice recommendations and industry standards promulgated by the Government Finance Officers Association (GFOA), the National Institute of Government Purchasing (NIGP), and the International Accounts Payable Professionals Association (IAPP).
Results from the surveys were analyzed by the project team, which then conducted follow-up phone interviews to clarify responses and obtain needed details. Three indicators proved critical to determining which districts actually performed well in the accounts payable arena: 1) the number of days it took to process a vendor payment; 2) the number of non-purchase order invoices processed per FTE per month; and 3) the number of voided checks as a percent of total checks.
The median number of days that it took the Great City School districts to process payments was 21 days. However, the number of days to process payments among seven of the eight top-performing districts was between two and 15 days. (The range among all districts was from two to 75 days.)
In the area of non-purchase order invoices, the median Great City Schools district processed 328 invoices per employee a month while the numbers of such invoices processed in six of the eight top-performing districts ranged from 417 to 1,118 invoices per employee per month.
Additionally, in the area of voided checks, the Great City School districts ranged from having to void between 1.05 and 3.24 percent of their checks per year. However, the top-performing eight districts ranged from having to void between 0.06 percent and 0.88 percent of their checks per year.
The surveys of the top eight districts determined that three critical practices undergirded the high accounts-payable indicators in the area of vendor processing: the use of electronic payments to vendors instead of traditional check writing, the ability to use automation to decrease invoice-processing time and costs, and the presence of written policies and procedures to govern financial practices.

PA G E 1 2
Key Performance Indicators
PA G E 1 3
Key Performance Indicators
For instance, the top-performing districts often made payments in the form of electronic funds transfers that allowed a vendor to collect recurring payments electronically. Denver, for example, uses system flags in its Enterprise Resource Planning (ERP) system to make direct payments to specified vendors for certain invoiced goods and services. Eighty percent of the top-performing districts also use “purchase cards” or P-cards for small purchases to speed up payments to vendors. Austin reports that its use of P-cards reduced the number of purchase orders processed by two-thirds.
In addition, 60 percent of top-performing districts use electronic fund and wire transfers directly from district bank accounts to third-party administrators for such things as employee health insurance. Moreover, 40 percent of these districts also used “ghost payment” cards that allowed preferred vendors with detailed controls to charge the district automatically when it makes purchases.
The use of automation to decrease invoice-processing time and costs were also found to be common elements among the eight top-performing city school districts. Los Angeles, for instance, used an automated three-way matching system for invoice-receiving reports-purchase order documentation that is linked to the district’s financial system, accelerating invoice- processing time. Other similar practices included the automation of routine business transactions, the processing of early-pay discounts, and electronic data interchanges (EDI). Palm Beach County uses both EDI and spreadsheets to load hundreds of food service, non-purchase order vendor invoices at one time into its ERP system and can transmit the data between other internal systems or to the systems of outside agencies and organizations.
According to survey results from the top-performing cities, districts with the most favorable indicators also had in place specific policies to govern their accounts payable processes. These policies often included: 1) prompt-payment discounts in contract negotiations with vendors; 2) expedited payments of selected transactions that meet specified policy criteria or thresholds; 3) “piggyback” arrangements on previously negotiated master-service agreements to take advantage of discounts on purchases over certain levels; and 4) strict deadlines for reimbursing employee expenses.
Survey data also indicated that districts with top-scoring indicators used such practices as cross-training among their accounts- payable staff, staff-retention initiatives, standardized communications protocols, the consolidation of vendor billing, the regular review of productivity opportunities, invoice-resolution teams, and the regular review of invoice “aging” reports.
Moreover, the data on accounts-payable indicators relating to the number of non-purchase order invoices processed and the number of voided checks identified best practices that drove performance in the eight top-performing districts. In brief, these practices included: use of automation; management oversight of the accounts payable process; the use of formal written policy and procedures manuals; and strong internal-control and monitoring systems.
The KPI teams also identified top-performing districts in the areas of compensation, grants management, cash management, financial management, risk management, and procurement — and is working on identifying best financial practices in each of these areas, something that would have been impossible without the key performance indicators and the data collected and reported in the performance management system.

PA G E 1 4
Key Performance Indicators
A R E A S O F N E E D E D I M P R O V E M E N T I N T H E K P I S Y S T E M
Although districts have found the KPI to be useful, there were also aspects of the tool that users would like to see improved: 1) better and more consistent data definitions; 2) additional contextual data; 3) reduced data-collection burden; and 4) more best practices information.
The most prominent issue that urban districts indicated needed additional work involved data definitions and the ability to “compare apples to apples.” Districts are not always fully confident that all the districts are defining the KPI measures the same or the right way. Districts also want greater ability to make comparisons based on — or that at least account for — certain district characteristics such as student demographics or district size.
For example, one district indicated that “There is too much variation in the size of member districts. Information needs to be bracketed based on district enrollment or some other demographic.” This kind of information would ensure that districts were comparing their performance against those with similar characteristics. This kind of information is now being built into next generation systems, but the Council continues to caution districts not to compare themselves solely to similar districts for fear that it would lead them to rationalize their results and fail to stretch beyond their immediate peer group.
Challenges with the data collection process were also noted (e.g., users reported that the process was time consuming, and that some questions are “confusing or ambiguous”), and a few districts want the Council to “eliminate data collection that does not support KPI calculations.”
Finally, districts were hungry for improvement ideas. One district cited wanting much more “information regarding best performing districts and what they are doing to achieve the results they have,” while another said that one “can’t tell what best practice from the metric is or what is being recommended.” Districts indicated that they wanted guidance from the Council on target levels and help with supporting a “dialogue with other districts to learn what they are doing.”
PA G E 1 5
Key Performance Indicators

PA G E 1 4
Key Performance Indicators
PA G E 1 5
Key Performance Indicators
Since the AIR evaluation results were released, the Council has made a major push to improve the comparability of data. Every survey question has been revisited and most have been tightened to improve how districts interpreted and answered the questions. The data published by the organization in 2013 reflected new and improved definitions of most variables and greater confidence that the results were more comparable across school districts. Still, more work lies ahead in all areas.
Districts also provided more detailed responses to the question about what still needs to be done to improve the system. Sample responses included:
• “It would be nice to have a webinar to discuss EACH operational area section of the survey so that respondents could ask questions of one another.”
• “Establishing protocols for exporting data from commonly used ERPs would be helpful (e.g., PeopleSoft, Lawson, etc.)”
• “I’d like to have a consensus method for counting custodial and grounds productivity and overhead. The difficulty lies in the use of school-based staff in a manner that would not be available under outsourcing, and in how supervisory positions are credited for direct production versus overhead work, as well as differences amongst schools as to usage of teaching staff or students for any such duties.”
• “I think we need to revisit the IT KPIs and definitions to modify where necessary, and to include a teaching and learning focus. I also think that we need to have districts document the sources of their data to ensure that we are using consistent data points to truly be able to use the KPI survey as a benchmarking tool.”
• “Reduce the number of purchasing-related KPIs. There is an over-abundance of those when compared to other areas. Give more details on how the KPIs are calculated — sources of the data.”
• “It would be good to be able to see live data from other districts and what they are doing or changing to influence their measurements.”
• “It would be good to survey the members regarding which KPIs they use: monthly/quarterly/annually/never.”
• “Better metrics are needed for Human Resources than are currently specified. Metrics should measure results not inputs.”
• “Council member districts need to be ‘all in’ for the data set to be as complete and robust as possible for comparability measures to be worthwhile.”
• “Identify only four employee groups: Teachers, Support Employees, Principals and Assistant Principals, Central Office (district Level) Administrators and Professional Technical. While it is useful to know the total number of staff in HR, the probability of those staff members having multiple assignments makes the calculation of a sum difficult and maybe misleading. It might be more practical to ask “Is worker’s compensation (or professional development, risk management, payroll, employee benefits, or others) under the supervision of the human resources department or someone else?” I suggest the definition of general fund is appropriate, and that we really only need to know for these purposes how much money is available from the general fund, the building fund (capital projects funds), and federal programs funds. I think what we want to know is the amount of money available to spend per student (or per employee).”
• “We may need more assistance from Council personnel in completing our reporting requirements.”

PA G E 1 6
Key Performance Indicators
A U T O M AT I O N A N D C O M M E R C I A L I Z AT I O N O F T H E K P I S Y S T E M
The KPIs have now been fully automated by the Council and its partner TransACT Communications, Inc. into a performance management system that is capable of collecting and analyzing operational data, comparing results from one city to another, and better reporting results.
At present, the automated performance management system allows districts to enter their raw data on each of the four major functional areas using a detailed set of electronic surveys, see a district’s overall performance relative to the norm using an automated “EKG” system, and compare a district’s performance with other major city school systems participating in the project. (See exhibit 3.) Once data are entered into the system, it is converted automatically into benchmark graphs and dashboards using a series of complex equations. The system also provides brief narratives that describe each indicator, list factors that are likely to influence each indicator’s value, and discuss why the indicator has value.
A district can also filter out other school systems to look only at those with similar enrollments, poverty levels, geographic region, state laws, or labor status (union or right to work). This work was a direct response to district needs to compare themselves to others with similar characteristics. In addition, a district is able to determine with the automated system whether its performance is improving over time and to compare trends against a peer group’s trends.
Moreover, the upgraded system allows school systems to download data onto PDAs and other hand-held devices, to conduct more sophisticated data analysis, and to make more complex and tailored comparisons.
Finally, the automated system provides school districts immediate feedback on the results of various policy and practice changes and allows districts to answer various “what/if” questions without permanently changing their data.
Now, the system has been packaged for commercial availability to school systems of all sizes and types across the country. Some 60 non-Council school systems across the country have now purchased the system through TransAct Communications, the Council’s sole licensing agent, since the fall of 2012. Over time, the new business arrangement should provide both the Council of the Great City Schools, which owns the KPIs, and TransACT, which owns the software to run it, sufficient revenue to sustain and expand the effort.
PA G E 1 7
Key Performance Indicators

PA G E 1 6
Key Performance Indicators
PA G E 1 7
Key Performance Indicators
Exhibit 3. Sample Screen on Procurement Costs (in dollars) per Purchase Order in the Great City Schools

PA G E 1 8
Key Performance Indicators
F U T U R E P R I O R I T I E S A N D N E X T S T E P S
A considerable amount of work has gone into the performance management system since it was first launched some nine years ago. The system has more and better indicators than was originally planned, and its automation goes beyond what was initially thought possible. Still, there is much more that is envisioned for this unique tool.
First, the Council of the Great City Schools expects to expand the key performance indicators into the academic arena and is working on those indicators now. Over a decade ago, the organization initiated the Trial Urban District Assessment of the National Assessment of Educational Progress (NAEP). This project currently allows 21 major urban school systems — about one-third of the Council’s membership—to be oversampled to allow comparable cross-state results on student achievement. The outcome measures have been instrumental in driving the reforms of urban education nationally over the last decade.
However, what is missing is a set of comparable formative academic or instructional indicators that could be used to predict graduation rates, college and career readiness, and achievement levels. These academic indicators are being designed as predictors of summative or end-results, and may include preschool participation rates, third- and fourth-grade reading proficiency rates, attendance rates in the late elementary grades and middle grades, attendance, promotion and retention rates, instructional minutes per day or year, core-course participation and success rates in ninth grade, numbers of teachers teaching out-of-field, teacher turnover rates, and other similar predictors.
In addition, the Council is currently developing a series of academic cost indicators at the activity level that will help district administrators make better decisions about where to place their scarce instructional dollars. These may include such indicators as average cost per teacher of induction programs; average cost per student for credit-recovery programs; average cost of assessments used to identify students for English as a Second Language programs; and average cost of initial special education evaluations. Technical teams are also exploring the feasibility of creating rudimentary return-on-investment indicators for instructional activities that have a clear academic outcome. Council teams have already developed scores of these potential academic indicators and will be pilot-testing these measures later in 2014 for possible inclusion in the broader KPI system in 2015.
Together with the operational KPIs and TUDA outcome measures, the predictive and cost-related academic data would provide urban school systems with a comparable 360 degree look at their overall status and progress. And while others might be capable of building such a system, only the Council can collect the data on the academic indicators and compare the results across major city school systems.
Second, the system still needs indicators that allow districts to compare spending by functional area and staffing levels by major personnel categories. Some of this already exists in the National Center for Educational Statistics’ (NCES) common core of data. But the spending categories are too broad to be very helpful to school systems, and there are continuing complaints about the accuracy of the state-submitted data. For instance, there is no way to tell from the NCES system how much school systems spend on such broad functional areas as professional development, special education, or textbooks. These comparisons would be enormously helpful to districts as they face additional challenges with right-sizing their operations, staffing, and spending.
PA G E 1 9
Key Performance Indicators

PA G E 1 8
Key Performance Indicators
PA G E 1 9
Key Performance Indicators
Third, the current key performance indicator system allows urban school systems to compare and contrast themselves with other similarly sized districts and to the median of all reporting districts. As we indicated earlier, the Council cautions districts not to compare themselves solely to others that are exactly like them. There is a risk of not setting stretch goals if peer districts uniformly perform poorly.
Still, there may be regional “tolerance” levels of performance that need to be considered. For example, the potential for significant cost reductions in transportation is dependent, in part, on geographic region and weather, and will present administrators with trade-offs in service levels and customer experience. In other words, regional differences may inform differences in how districts set ideal performance levels and how they compare themselves from region to region. At a minimum, the KPIs should facilitate a deliberate and transparent dialogue with the school board, who represents parents and the community, and with executives, who are accountable for results, to determine the performance levels they expect for their district.
Fourth, what the KPI system cannot do yet is to allow school systems to compare themselves against an industry standard. At present, it is difficult to know whether the median of all urban school systems on a particular measure is actually a desirable state or whether the median of all urban school systems is below where it should be. There are a number of operating standards available from various niche organizations that specialize in procurement operations, for instance, but there is no bundle of such indicators that might be applied across large, multi-faceted organizations like urban public schools. The need to build such a system and integrate it with the current system remains a strong priority of the Council and its member school districts, and is on the drawing board for development. We anticipate some of the KPI work will actually inform those standards being used in other sectors.
Fifth, the Council is just beginning to realize the potential of the analytics that may be possible with the system. The possibilities appear to be particularly strong in two areas: cross-indicator analytics and trends. For instance, in the first area, the Council has begun exploring the relationship between voided payments and invoices past due since these two indicators should be minimized simultaneously but are sometimes not.
In addition, the relationship between such indicators as payroll cost per $100,000 and payroll cost per paycheck provides another measure of the overall cost-efficiency of a district’s payroll operations, and in combination with enrollment size will tell a district whether or not it is taking advantage of its scale to maximize payroll efficiency. (See exhibit 4)
Another example involves the relationship between custodial workload and maintenance costs per square foot. Preliminary results of these analytics show that a number of districts have been able to reduce costs through efficiencies other than personnel cuts—a finding that would not be obvious without cross-referencing the indicators with one another.

PA G E 2 0
Key Performance Indicators
Exhibit 4. Payroll Cost per $100k Spend vs. Payroll Cost per Paycheck by District Enrollment
In addition to the cross-indicator analytics, the data on over 100 indicators have been defined and measured consistently enough that creating trend lines are now possible for both individual districts and the Council median. For instance, Exhibit 5 shows the trend across Council districts in average transportation costs per rider in 2009-10, 2010-11, and 2011-12. The results show that average costs have dropped from $1,093 per pupil to $887 per pupil over the period. Some 64 percent of the districts showed a decrease in costs while 36 percent showed an increase. This development means that the organization and its members can begin determining whether operations have improved or not; identifying which districts show improvements and which do not; and determining what changes in practices explain the improvements or lack thereof.
PA G E 2 1
Key Performance Indicators

PA G E 2 0
Key Performance Indicators
PA G E 2 1
Key Performance Indicators
Exhibit 5. Trends in Average Transportation Costs per Rider in the Great City Schools
Sixth, having a comprehensive system that includes both management and academic data suggests the possibility of establishing systems by which one could better align these two halves of school system operations. At present, it is very difficult to build budgets or define staffing levels around district instructional goals and priorities because the academic and management systems are not convincingly linked. A seamless system would allow school districts to start thinking about resource alignment in ways that have never happened before. In fact, the alignment of resources with strategic priorities is just as important a priority as the ability to squeeze operational efficiencies out of program administration.
Finally, the KPI system raises the possibility of designing the system in a way that could enhance accountability for results at the local level, the possibility of assessing and enhancing equity measures to ensure that all students have equal access to school system resources, and the potential that return-on-investment calculations could be produced and economies of scale could be achieved.
It is clear that a considerable amount of program architecture has been built around the original notion of the key performance indicators, but that much remains to be done. Moreover, the nation’s weak economic conditions have spurred fresh questions about how school districts use their resources. These questions now involve public education’s organization, funding, infrastructure, human capital, academic, programming, technology, and other features.
But before critics assume that the enterprise of urban public education is not capable of innovation, of learning from others, or of capitalizing on ideas and practices from other sectors, they should consider this effort by the nation’s urban public schools to create a whole new mechanism — through both the urban NAEP on the instructional side and the KPIs on the non-instructional side — by which they can analyze their performance, assess their efficiencies, streamline their operations, save precious dollars, and improve results. These new tools are not fully developed yet, but their promise is beginning to payoff. And the payoff is resulting in stronger public education in our nation’s major cities.

RESOURCES
Hess, F. and E. Osberg (2010). Stretching the School Dollar: How Schools and Districts Can Save Money While Serving Students Best. Cambridge, MA: Harvard Education Press.
Pane, Natalia. Council of the Great City Schools Key Performance Indicators Evaluation. American Institutes for Research, December 2011.
Boston, Atlanta, Minneapolis, St. Paul, Clark County, Broward County, Norfolk, Milwaukee, Miami-Dade County, and Jefferson County.
Memphis, Miami-Dade County, Norfolk, Columbus, and Boston.
Chicago, Broward County, Atlanta, St. Paul, East Baton Rouge, and Miami-Dade County.
Austin, Pittsburgh, East Baton Rouge, Houston, and Omaha.
Charlotte-Mecklenburg, Little Rock, East Baton Rouge, Anchorage, Clark County, Albuquerque, and Orange County (FL).
Charlotte-Mecklenburg, Norfolk, Houston, Clark County, and Denver.
George W. Bush Institute at the George W. Bush Presidential Center2943 SMU Boulevard | Dallas, Texas 75205 | 214.200.4300www.bushcenter.org | [email protected]