the geology and geochemistry of the indonesia · a summary of rock samples analysed by x-ray...
TRANSCRIPT

THE GEOLOGY AND GEOCHEMISTRY OF THE
GUNUNG PANI GOLD PROSPECT, NORTH SULAWESI,
INDONESIA
by
Imants Kavalieris
A thesis submitted as the requirement for admission to the
Degree of Master of Science at the Australian National University
October 1984

-89-
IV. GEOCHEMISTRY OF THE PANI VOLCANIC COMPLEX AND RELATED ROCKS
4.1 Introduction
The importance of whole rock geochemistry in
this study lies in its possible application to the
following problems:
(1) classification and comparison of the Pani Volcanics
to similar geochemical and lithological suites;
(2) interpretation of tectonic environment, in terms
of island-arc versus continental margin; and
(3) nature of the alteration system.
4.2 Samples, methods and limitations of data
A summary of rock samples analysed by x-ray fluorescence
spectroscopy (XRF) is given in Table 2. In total there
are six samples from Pani ridge, twelve samples from Gunung
Baganite, one from the Tabulo ring-dyke Complex, and two
from the basement granitoids adjacent to the Pani Volcanic
Complex. The samples from Pani ridge and Gunung Baganite
are from lOOgm splits of 2m drill core intervals, crushed
for Au assay at the P.T. Tropic Endeavour laboratory,
Gorontalo.
Sample preparation and laboratory techniques for
the Gorontalo laboratory are described by Carlile and
Hisamuddin (1983) ; it suffices to mention that size
reduction and final milling utilized tool steel equipment.
As a result minor Fe contamination in major elements, and
significant Mn, Cr, V contamination in trace elements is

-90-
Table 2 Summary of geochemical
LOCATION DRILLHOLE DEPTH LITHOLOGY ALTERATION
Pani ridge.
Pani ridge
Pani ridge
Pani ridge
Pani ridge
Gunung Baganite
Gunung Baganite
Gunung Baganite
Gunung Baganite
Gunung Baganite
Gunung Baganite
Gunung Baganite
Gunung Baganite
Gunung Baganite
Gunung Baganite
Gunung Baganite
Gunung Baganite
Pani ridge
Sungai Batudulanga
Tabulo
Transit
(m) s Silicified 0 Oxidised
(Above WT)
GPO l 42-44 Rhyodacite s, 0, Qtz-Alb-Kf Chl-Py-An
GPO l 212-214 Rhyodacite s, Qtz-Alb-Kf Chl-Ser-Py-An
GPO 2 16-18 Rhyodacite s, 0, Qtz-Alb-Chl-py-An
GPO 2 180-182 Rhyodacitic Chl-Ser-Cal lapilli tuff (Little altered)
GPO 3 134-136 Rhyodacite Chl-Ser-Cal
GPO 4 48-50 Rhyodacitic s, 0, Qtz-Alb-Kf lapilli tuff Chl-Ser-Py
GPO 4 122-124 Rhyodacite s, Qtz-Alb-Chl-Py-An
GPO 4 160-162 Rhyodacite s, Qtz-Alb-Kf Chl-Py-An
GPO 4 200-202 Rhyodacite Qtz-Alb-Kf Chl-Py-An
GPO 4 278-280 Rhyodacite Alb-Kf Chl-Py-An
GPO 4 326-328 Rhyodacite Kf-Alb-Chl-Ser-Fe/Mn Carb-Py-An
GPO 4 398-400 Rhyodacite Kf-Alb-Chl-Ser-Fe/Mn Carb-Py-An
GPO 5 102-104 Rhyodacite Alb-Chl-Ser-Py-An
GPO 5 234-236 Rhyodacite Alb-Chl-Ser-Py-An
GPO 6 52-54 Rhyodacite Alb-Chl-Ser-Py-An
GPO 6 118-120 Rhyodacite Alb-Chl-Ser-Py-An
GPO 6 189-190 Rhyodacite Alb-Chl-Ser-Py-An
GPO 7 114-116 Rhyodacite s, 0, Qtz-Alb-Kf Chl-Ser-Py-An
Foliated Minor Chl microgran-odiorite
Hb/Bi Minor Chl, Sph microgran-odiorite
Granodiorite Qtz-Chl-Ep-Py
Symbols used:
Qtz : quartz; Alb : albite; Kf : K-feldspar; Chl : chlorite; Ser : sericite; Py : pyrite; An anatase; Sph sphene; Ep : epidote; WT : Water table
AU ASSAY
(ppm)
0.11
0.94
0.20
0.19
0.68
0.31
0.13
0.18
0.99
0.25
0.86
0.52
0.16
0.17
5.84
samples
SAMPLE UTAH NUMBER SAMPLE NO.
IKS l 40070
IKS 19 40154
IKS 7 44358
IKS 4 44440
IKS 18 44605
IKS 2 44174
IKS 10 44211
IKS ll 44230
IKS 12 44250
IKS 6 44289
IKS 13 44483
IKS 14 44524
IKS 15 44710
IKS 5 44776
IKS 16 44808
IKS 17 44835
IKS 3 44875
IKS 20 44957
IKS 8
IKS 9
IKS 21

-91-
possible. This is apparent for Cr which must be
disregarded for samples IKS 1-7, IKS 10-20. All other
samples were size-reduced and milled to -2~m at the
Geology Department, Australian National University (AND) ,
utilising tungsten carbide equipment.
Major elements, including Na, were determined
in duplicate by XRF methods (Norrish and Hutton, 1969)
on lithium tetraborate glass discs, and trace elements were
determined in duplicate on pressed powder discs (Norrish
and Chappell, 1977), with corrections utilising direct
measurement of mass absorptions of Rb and Sr Kcr (methods
by Chappell, AND, unpublished). FeO was measured in
duplicate by titration against K2Cr207, and H20+ + C02 ·
by collection in microabsorption tubes.
In addition, two samples (S266, Una-Una) were
analysed for major elements by energy-dispersive TPD
electron probe at the Research School of Earth Sciences,
AND (see Ware, 1980 for computer programs and calibration),
on glass beads prepared by fusion (similar methods to
Nicholls, 19 7 4) •
The samples from the basement and the Pani
Volcanic Complex, with the exception of S266, are strongly
modified by hydrothermal alteration and weathering. The
freshest sample excluding Una-Una is IKS 9, a hornblende/
biotite microgranodiorite from the Tabule ring-dyke Complex.
In general, since it is not possible to compare
altered rocks with completely fresh rocks in the Pani
Volcanic Complex, and due to the limited number of samples
representing possible related volcanics, or basement, the
-92-
primary geochemical characteristics of the Pani Volcanics
are difficult to separate from the effects of alteration.
4.3 Major and trace-element data (Table 3)
4.3.1 Pani Volcanics
Within the limited Si02 range (69-75%) available
for the Pani Volcanics a wide scatter of points likely
due to alteration, largely precludes meaningful evaluation
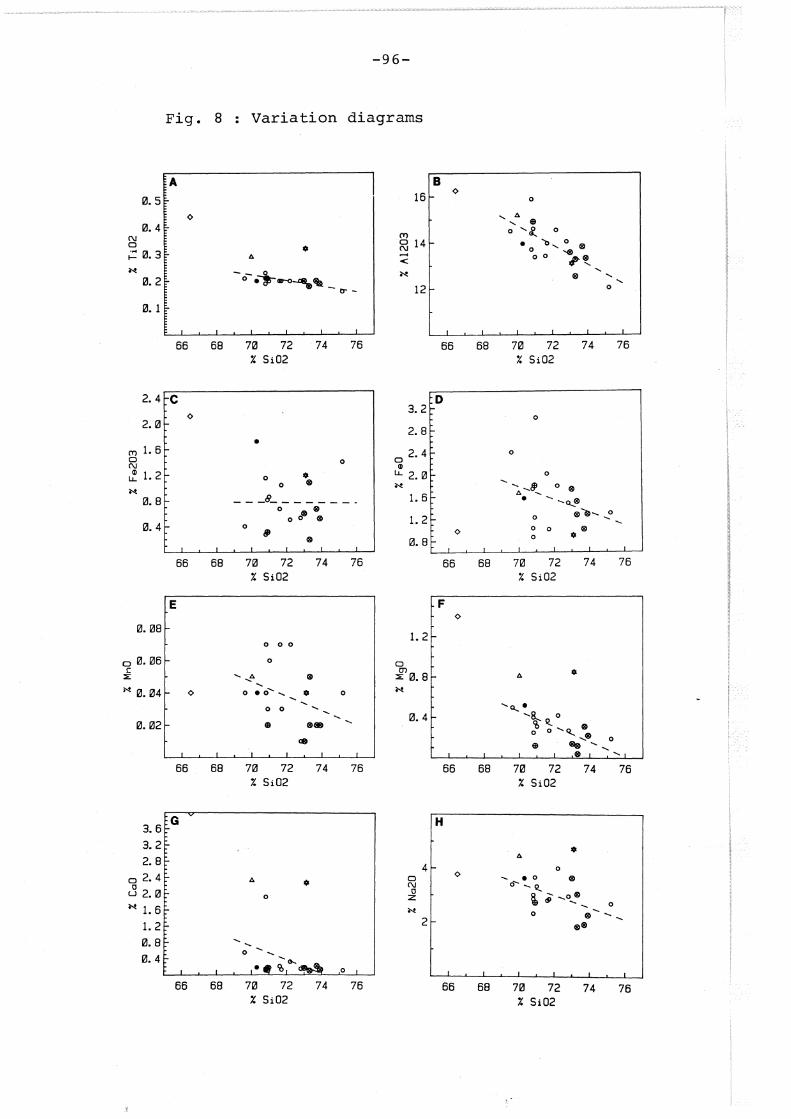
of primary trends of major eleraents (Figs. 8, 9) .
Major elements can be interpreted to exhibit
typical trends for acid calc-alkaline rocks, i.e. Al203,
MgO, CaO, Na20, P205, Ti02, MnO and FeO decrease with
increasing Si02, while K20 shows a slight increase.
These trends are very poorly demonstrated by the variation
diagrams.
The dataare most consistent for Ti02 which
averages 0.2% at 72% Si02. The Tabule ring-dyke (IKS 9)
initially assumed consanguineouson petrographic grounds
to the Pani Volcanic Complex plots within the range of the
data for most elements, and could belong to the same
differentiation trend. Of the basement granitoids IKS 21
is clearly a separate geochemical suite to the Pani
Volcanics.
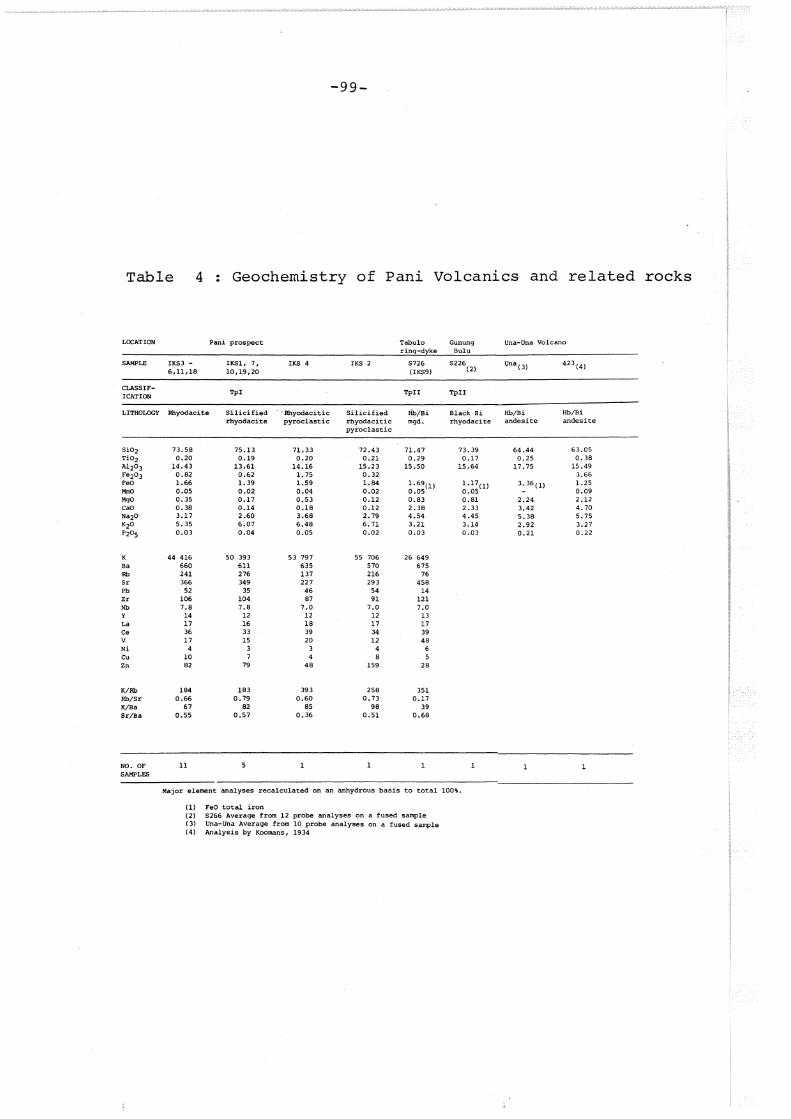
A comparison of silicified with non-silicified rhyodacites
and hornblende/biotite microgranodiorite (Tabule) is shown
in Table 4 • This table also shows data for Gunung
Bulu (unaltered Tpii lithology) and the Una-Una volcano,
a volcanic island 60km SW of Marisa in the Gulf of Tomini.

Table 3 : Major and trace-element data
SaMplet IKS1 IKS2 IKS3 IKS4 IKSS IKS6 IKS7 IKSB IKS9 IKS10
Si02 73.30 70.90 70.90 70.30 70.80 ?5.20 73' 00 66.50 70.00 73.30 Ti02 0.18 0.21 0.21 0.20 0,19 0 '16 0.20 0.44 0.29 0.18 Al203 13.27 14.91 14.60 13.95 13.70 12.05 13.57 16.25 15.18 12.54 Fe203 0.19 0.31 0.81 1.72 0.27 1.40 O.bO 2.12 i. 08 FeO 1.27 i. 80 1 • .22 1.57 1.74 i. 30 i. 73 0.98 i.6b i. 51 HnO 0.02 0.02 0.03 0.04 0.07 0,04 0.01 0.04 0.05 0.05 HgO 0.04 0.12 0.35 0.52 0.44 0.19 0.14 1.40 0.81 0.12 C<>O 0.10 0.12 0.19 0.18 1.92 0 '11 0.17 3.98 2.33 0' 10 Na20 3. 04 2.73 3.66 3.63 3. 01 2.70 3.64 3.77 4.45 i. 84 K20 6.41 6.57 5.58 6.39 3.68 4.72 5.69 2.88 J, 14 7' 10 P20S 0.04 0.02 0.04 o.os 0.03 0.02 O.Ob 0.08 0.03 0.03 s 0.01 0.01 0.17 0.31 0' 20 0.15 0.01 0.01 H20+ 1.24 1.09 0.89 1.35 0.41 0.81 o.ss 0.92 0.52 0.78 H20-· 0.29 0.25 0.45 0.21 0.15 0' 11 0.20 O.Sb 0.22 C02 0.15 0.15 0 '61 0,34 0.10 0.47 0.90 0.22 0.76 0' 12 rest 0.20 0.18 0.20 0.16 0' 19 0' 19 0' 19 0.19 0' 18 0.19
99.71 101.16 96,96 100.71 O=S 0.08 0.15 0.10 0.07 t otol 99.75 99.14 99.63 101.01 96.86 99.51 100.64 99.97 99.97 99.17
Trace eleMents
Ba 1>75 570 690 b3S 640 625 585 750 675 640 Rb 312 216 233 137 221 241 255 82 76 299 I Sr 384 293 375 277 440 400 41>6 462 458 346
1.0 Pb 35 54 57 46 55 57 34 29 14 43 Th w u I Zr 111 91 110 87 97 100 99 111 121 86 Nb o.s 7.0 9.0 7.0 B. 0 8.0 7.5 b.S 7. 0 7. 0 y 12 12 15 12 14 15 11 12 13 13 La 18 17 17 18 1b 1b 14 21 17 14 Ce 35 34 38 39 35 37 33 44 39 29 Sc v ib 12 20 20 13 12 8 27 48 ib Cr 49 75 35 61 54 32 44 6 19 54 Hn 125 440 285 605 120 390 iSS sos 375 435 Co Ni 3 4 5 3 5 5 3 3 6 3 Cu 5 8 10 4 10 19 7 3 s 13 Zn 1>3 159 BS 41> 40 51 80 43 28 61 Ga
CIP~l norMS
Q ;10, 0 28.2 26.9 23.4 33.3 40.4 28.6 23.2 24.7 34.3 c 1.2 3.1 2.2 0.8 1.3 2.3 1 '2 0.2 1.1> or 37.9 38.8 33.0 37.8 21 .a 27.9 33.6 17.0 1B.b 42.0 ab 25.7 23.1 31.0 30 '7 25.5 22.9 30.8 31.9 37.7 15.6 an 0 .s o. 7 0.9 O.B 9.1> 0.7 0.7 18.9 11 '7 0.5 di 0 .5 hy 2.0 3. 0 1.8 1.9 3.5 1.5 2.4 3.3 4.7 2.0 Mt 0.3 0.5 1. 2 2.5 0,4 2.0 0.9 2.0 1.1> i1 0 '3 0.4 0.4 0.4 0.4 0.3 0.4 0 .B 0.1> 0.3 hM 0.7 ap 0' 1 0' 1 0' 1 0' 1 0' 1 0' 1" 0.1 0.2 0' 1 0.1 pr o.o o.o 0.3 O.b 0.4 0.3 0.0 0.0 total 97.9 97.8 97.8 98.8 9b' 1 97.9 99.0 98.5 98.0 97.9
Silicate analyses by Geological Department, ANU.

Table 3 (cont.)
5oMplet IK511 IK512 IK513 IK514 IK515 IK516 IK517 IK518 IK519 IKS20 IK521
Si02 71.00 71.60 69.60 72.20 71.70 70 .so 70.80 72.80 73.70 73.90 73.10 Ti02 0.20 0.20 0.21 0.20 0.20 0.21 0.23 0.20 0.20 0.19 0,32 Al203 13,37 13.42 14.50 14.54 13.97 14.40 15.88 14.05 13.83 13.32 13.10 Fe203 0.86 0.67 0.40 0.50 1.04 1.15 1.15 0.53 0.67 0.52 1.19 FeD 3,02 2.01 2.40 1.79 1. 01 0.87 1. 03 1.48 1. 01 1.28 0,90 MnO o. 06 0.07 0,04 0.07 0.03 0.04 o. 04 0.01 0.02 0.02 0.04 MgO 0. 31 0.37 0.50 0.42 0.27 0.25 0.40 0.27 0.31 0.22 0.85 CoO 0.18 0.21 0,55 0.32 0.13 0.11 0.15 0.15 0.22 0.13 2.27 No20 3,33 2.81 3.40 4.00 2.86 2.33 2.86 2.96 1.92 2.27 4.'12 K20 5.63 5.95 5,18 3,68 6.7'1 6.05 5.30 4.62 4.97 5.51 0,86 P205 0.01 0.12 0.04 0.02 0.02 0.04 0.02 0.01 5 o. 04 0.29 0.16 0.16 0.1'1 0.28 0.10 0.09 H20+ 0.71 0.55 1.02 1. 06 0.85 1.51 1. 51 1.10 1.12 1. 08 1.17 H20- 0.13 0,27 0.21 0.19 0.08 0.31 0.40 0.27 0.20 0.20 0.27 C02 0.34 0.59 0,63 0.65 0.63 0,27 0.12 0.12 0.52 0. 61 0.75 rest 0.20 0.19 0.20 0.18 0.21 0.20 0.20 0.18 0.17 0.18 0.08
99.38 99.21 99.12 100.00 98.91 99.18 99.55 99.72 0=5 0.02 0.14 0.08 0.08 0.08 0.14 0.05 0.04 total 9?.36 'i''i'.07 9'i'. 04 9'i'.92 'i''i'.77 'i'8.52 100.07 98.83 9'i'. 04 99.50 'i'9,68
Trace e:lettents
Bo 650 600 750 535 730 735 '120 590 565 5'i'O 130 I Rb 236 258 230 166 2'i'6 283 251 231 250 266 31.0
1.0 Sr 417 362 411 329 397 318 301 2'12 228 319 216 Pb 52 51 51 43 53 56 49 53 28 36 20 ,j:::.
Th I u Zr 9'i' 9'i' 10'i' 110 102 113 122 110 112 114 116 Nb 8.0 8.5 'i'.5 8. 0 9,0 8.5 10.0 'i'. 0 8.5 7.5 1.0 y 14 14 15 14 13 15 14 15 12 12 35 La 16 16 17 16 16 18 1'i' 1'1 15 1'1 7 Ce 33 35 39 34 33 40 38 36 34 36 17 Sc v 16 17 20 18 18 16 19 19 18 1'1 27
Cr 75 4? 43 48 83 43 36 40 17 4'i' Mn 560 630 375 650 255 365 330 105 140 160 350 Co Ni 4 4 4 4 3 3 4 5 3 2 Cu 15 15 6 8 6 6 3 10 3 5 !:i
Zn 87 85 43 147 55 95 123 87 125 6'1 2'i'
Go
CIPW norMs
Q 27.1 30.3 26.7 32.5 28,1 33.3 32.6 36.4 42.4 38.3 36.2
c 1.4 1.'i' 2.5 3.4 1.7 3.8 5,1 3.8 4.'i' 3.4 0.3
or 33,3 35.2 30.6 21.8 40.0 35.8 31.3 27.3 29.4 32.6 5.1
ob 28.2 23.8 28.8 33.9 24.2 19.7 24;2 25.1 16.3 19.2 39 .. 9
on 1.2 1.2 2.2 1.5 0.8 0.7 1.0 1.0 1.0 0. 7 11.3
dl. 2.2 hy 5.3 3.3 4.7 3.4 1.4 1.0 1.6 2.3 1.2 2.0 Mt 1.3 1.0 0.6 0.7 1.5 1.7 1.7 0.8 1.0 0.8 1.7
l.l 0.4 0.4 0.4 0.4 0.4 0.4 0.4 0.4 0.4 0.4 0.6
h .. o.o op o.o 0.3 0.1 0.1 0.1 0 .1 0.1
0,2 0 .1 0.5 0.3 0.3 0.3 0.5 0.2 pr 97.5
1 o tal 98.0 97.6 9'1.1 97.9 98.1 96.3 97.9 97.2 97.1 97.5
Silicate analyses by Geological Department, ANU.
_____________ ,.,. . ---.-~ .... -.~~·-·-·--~------"-. --·-----~·

Sample
IKS 3-6 11-17
IKS k,7, 10,19,20
IKS 9
IKS 8
IKS 21
Fig. 8
-95-
Sample code and symbols used for variation diagrams (Fig. 8 and 9 )
Symbol Lithology Unit
0 Unsilicified Pani Volcanic rhyodacite Complex (Tpi)
E9 Silicified Pani Volcanic
® rhyodacitics Complex (Tpi) and pyroclastics
Hornblende/ Tabulo ring-biotite micro- dyke Complex granodiorite (possibly Tpii)
0 Fine-grained Basement foliated micro-granodiorite
Medium-grained Basement granodiorite (low K-granitoid)
1) Regression line only for the Pani Volcanic Complex and Tabulo ring-dyke Complex.
2) The regression line has little meaning for 8c,d,e,g, but is shown for uniformity of presentation.
3. The wide scatter of data is generally attributed to alteration.
-96-
Fig. 8 Variation diagrams

-97-
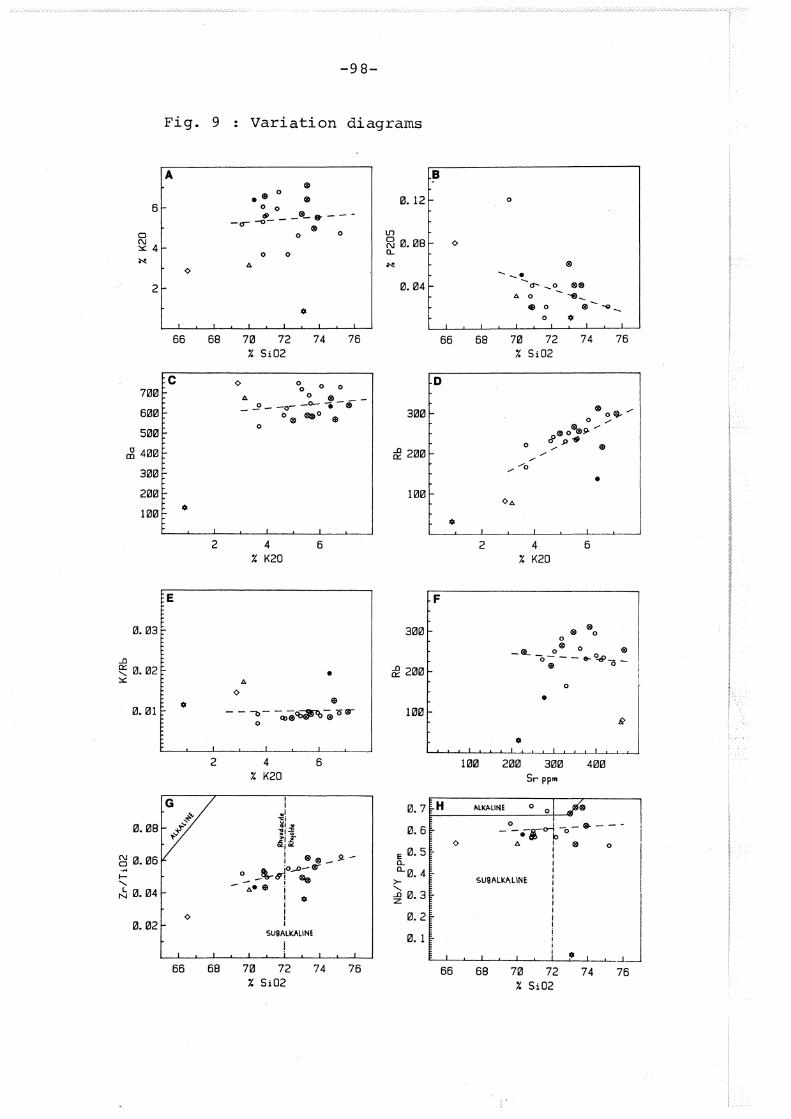
Fig. 9
1) Regression line only for the Pani Volcanic
Complex and Tabule ring-dyke Complex.
2) The wide scatter of data precludes meaningful
interpretation of trends in most cases, especially
9 a,b,f. Regression line is shown for uniformity
of presentation.
3) 9 g ,h show the data in terms of discrimination
diagrams after Winchester and Floyd (1976).
Refer to Fig .. 10.
Alkaline and subalkaline fields are shown and the
dividing line at 72% Si02 divides the data into
rhyolite and rhyodacite. For convenience
rhyodacite is used throughout the text.
6
0
~4
2
700
600
500
dl 400
300
200
100
0. 03
..D
~ 0.02 :::.::
0. 01
0.08
2l 0.06 -~
1-, ~ 0.04
0.02
Fig. 9
A
66 68
c
2
E
2
G
66 68
-98-
Variation diagrams
e o • 0 0 6> _@_ .. ---
-cr-.,-- @
0 0
A
70 72
A
0
X Si02
4 X K20
4 X K20
70 72 X Si02
0 0
74 76
6
•
6
74 76
B
0. 12 0
Ln
~ 0.08 a..
--~ 0.04 ct- _o @@
0. 0 - .... _
• 0 0---o_
0 * 66 68 70 72 74 76
X Si02
D
300
0
• 100
2 4 6 X K20
F
300
100 200 300 400 Sr ppm
0.7~H _____ ~_~ __ LI_NE ______ 0 ~0~1~ 0 i ·---0. 6 - - .-,--o-tlo -0 -
A ~ 0 0 E 0. 5 i a.. i
:- 0· 4 SUQALKALINE l '- I
:@ 0.3 j" ::~~l~~--L-~~~-L~~~--L-~
66 68 70 72 74 76 % Si02
-99-
Table 4 Geochemistry of Pani Volcanics and related rocks
LOCATION Pani prospect Tabule Gunung ring-dyke Bulu
SAMPLE IKS3 - IXSl. 7, IKS 4 IKS 2 S726 S226 6,11,18 10,19,20 (IKS9) (2)
CLASSIF-'l'pi 'l'pii 'l'pii
I CATION
LITHOLOGY Rhyodacite Silicified · · Rhyodacitic Silicified Hb/Bi Black Bi rhyodacite pyroclastic rhyodacitic mgd. rhyodacite
pyroclastic
5102 73.58 75.13 71.33 72.43 71.47 73.39 Ti02 0.20 0.19 0.20 0.21 0.29 0.17 Al2o3 14.43 13.61 14.16 15.23 15.50 15.64 Fe2o 3 0.82 0.62 1. 75 0.32 FeO 1.66 1.39 1.59 1.84 1.69(1) 1.17(1) MnO 0.05 0.02 0.04 0.02 0.05 0.05 MgO Q.35 0.17 0.53 0.12 0.83 0.81 cao 0.38 0.14 0.18 0.12 2.38 2.33 Na2o 3.17 2.60 3.68 2. 79 4.54 4.45 K20 5.35 6.07 6.48 6. 71 3.21 3.14 Pao5 0.03 0.04 0.05 0.02 0.03 0.03
K 44 416 50 393 53 797 55 706 26 649 8a 660 611 635 570 675 Rb 241 276 137 216 76 Sr 366 349 227 293 458 Pb . 52 35 46 54 14 Zr 106 104 87 91 121 Nb 7.8 7.8 7.0 7.0 7.0 y 14 12 12 12 13 La 17 16 18 17 17 Ce 36 33 39 34 39 v 17 15 20 12 48 Ni 4 3 3 6 cu 10 7 4 8 5 Zn 82 79 48 159 28
K/Rb 184 183 393 258 351 Rb/Sr 0.66 o. 79 0.60 o. 73 0.17 K/Ba 67 82 85 98 39 Sr/Ba 0.55 0.57 0.36 0.51 0.68
NO. OF 11 SAMPLES
Major element analyses recalculated on an anhydrous basis to total 100\.
(1) FeO total iron (2} 5266 Average from 12 probe analyses on a fused sample ( 3) Una-Una Average from 10 probe analyses on a fused sample {4) Analysis by l<oomans, 1934
una-una Volcano
una(J) 423(4)
.llb/8i Hb/Bi andesite andesite
64.44 63.05 0.25 0.38
17.75 15.49 3.66
3. 36(1) 1.25 0.09
2.24 2.12 3.42 4. 70 5. 38 5. 75 2.92 3.27 0.21 0.22

-100-
Silicification correlates with an increase in
K20 (and Rb) and depletion in FeO, MnO, MgO, cao and
Na20. A similar trend is apparent for the pyroclastics,
but the data is insufficient to be meaningful.
Of the major elements, Ti02 and possibly P205
are the least affected, while CaO is the most affected
(depleted) by secondary processes.
Table 5 compares oxidised (above the watertable)
and non-oxidised silicified rhyodacites. It suggests
Fe0/Fe203 ratios are unaffected, and in general the effects
of weathering may not be important.
The most strongly altered rhyodacites are
obviously silicified and Na-alkali metasomatised (section
5.2.2), but it is likely all rocks analysed from the prospect
exhibit this alteration to varying degrees. As is apparent
from the Si02 variation diagrams alteration and differentiation
trends are not readily separable and may in fact lead to
similar changes.
This may be consistent with the argument (section
~2) that silicification and accompanying alkali metasomatism
is deuteric, and an extension of late magmatic processes,
rather than due to later superimposed hydrothermal
alteration.
Despite problems of alteration, in general it is
thought that the Pani prospect rhyodacites (Tpi} have a
restricted Si02 (69-75%) and are highly potassic (even if
K2o was added later) and have a high total alkali content,
corresponding with possibly low primary (as well as

Table 5
Si02 Ti02 Al203 Fe203 FeO MnO MgO CaO Na20 K20 P205
-101-
Comparison of major element geochemistry of oxidised and non-oxidised silicified rhyodacites
Non-Oxidised Oxidised
75.47 74.70 0.19 0.19
13.54 13.59 0.90 0.95 1.29 1.45 0.03 0.02 0.23 0.13 0.16 0.13 1.93 3.02 6.20 5.96 0.04 0.04
No. of samples 2 3
Major element analyses recalculated on an anhydrous basis to total 100%.
Note: The small number of samples are individually variable and the value of this comparison is therefore limited.

-102-
secondary) cao and MgO. Upon the alkali content
(K20 + Na20) of 8-10%, the composition is strongly
peraluminous. However the normative corundum shown for
most samples is probably due to loss of CaO. Where cao
has not been lost (IKS 9) corundum is not significant.
It can be argued from a subsequent section
(5.8.1) on the chemistry and alteration of the Baganite
rhyodacite dome that a high K20/Na20 ratio (>1) may be a
primary feature. Irrespective of the Pani Volcanic
Complex data, the K20 content from the unaltered sample
IKS 9 from the Tabule ring-dyke Complex still allows these
rocks generally to be classified as high K-rhyolites
(Ewart, 1979).
In addition the Tabule Complex rocks (Tpii) contain
hornblende, and therefore higher cao, whereas the Tpi
rhyodacites in the prospect show no evidence from their
crystallisation history (section 3.5.1.6)to have precipitated
either early or late hornblende. Instead the main
ferromagnesian mineral is biotite, with sphene (Ca bearing)
as a late accessory phase in the groundmass. Consequently
Tpi volcanics are likely to be more potassic, than Tpii.
Finally, petrographic studies of alteration
(section 5.2) suggests that alkali metasomatism mainly
involves albitisation.
Therefore an addition of a few percent K20
during alteration is unlikely, and although there is good
evidence for a loss of CaO (lack of Ca bearing minerals,
primary or secondary) a high K20 would probably correlate
with low primary CaO in Tpi volcanics.

-103-
In general, the 'incompatible', large ion trace
elements Ba, Rb, Sr, Pb of 'potassic-type' are particularly
important in understanding the geochemistry of felsic
rocks. Unfortunately they may be susceptible to secondary
alteration, particularly alkali metasomatism of the
feldspar phenocrysts. Noble et al. (1979) suggest Sr is
added rather than depleted during near surface alteration
of silicic ash-flow tuffs.
Sr (av 403 ppm) seems high for the quartz
biotite-sanidine rhyodacites, and may have been affected
by Na alkali metasomatism, but it is also high in the
Tabule ring-dyke Complex (Sr 458 ppm) which does not show
appreciable albitisation.
Rb (av 243 ppm) is also high and corresponds to
high K20 in Tpi (K/Rb<200), while at Tabule, Rb is
relatively lower (K/Rb 351) .
Pb (av 47 ppm) (as well as Cu and Zn) are part
of the sulphide alteration mineralogy at the Pani prospect
and higher levels are not surprising. Ba abundance
(av 640 ppm) in silicic rocks follows K, being held in
K-feldspar, but also in biotite, which complicates its
behaviour at high Si02 compositions (Jake~ and White, 1972)
and final differentiation trends for silicic rocks often
show a decrease in Ba. Tabule with lower K2o has a
relatively higher Ba content (675 ppm) . Whether the
Ba content of the Pani Complex is due to differentiation
or depletion due to alkali metasomatism of plagioclase
and chloritisation of biotite is not clear.
-104-
In summary, the usefulness of Ba, Rb, Sr, Pb
is complicated by possible mobility due to alteration;
nevertheless by comparison with Tabulo it is thought
high Sr, and a low K/Rb ratio (<400) may be a primary
characteristic of the Tpi rhyodacites.
The 'immobile' trace elements La, Ce, Y, Nb, Zr
show a strong coherence for all the Pani Volcanics and
suggest very strongly that the Tabulo ring-dyke Complex
is consanguineous.
The absolute abundance of the light rare earth
elements (LREE), (La and Ce) is low, particularly when
compared to silicic rocks formed by crystal fractionation
(e.g. Noble et al., 1979).
With respect to chrondritic REE abundances
(Hanson, 1980) enrichment of La is by a factor of 54, and
Ce by 43.
Y can be correlated with the behaviour of the
HREE (Taylor, 1966, p.l61) and with Zr and Nb. The low
abundances of these elements reflect low levels of the
HREE's as well. With respect to chrondritic abundances
(Taylor, 1980) Y shows an enrichment of about 7.
Therefore, with the exception of Eu for which no
data are available it is concluded that the Pani Volcanics
are characterised by low and possibly relatively
unfractionated REE abundances.
The content of Zr (av 104 ppm) is close to Zr
saturation in peraluminous melts (Watson, 1979).

-105-
In contrast to the behaviour of the REE, and
the high field strength elements (HFSE) (Zr, Nb, Ti, P),
it seems the Pani Volcanics are strongly enriched in the
large ion lithophile elements (LILE) (K, Rb, Ba, Sr),
possibly including U and Th. This conclusion is based on
data from the unaltered sample from the Tabulo ring-dyke
Complex and accepting arguments that high K20 is a
primary feature of the Pani Volcanic Complex. Hence the
volcanics have a high LILE/HFSE ratio, perhaps unusually
high. Tarney and Saunders (1979) suggest a high LILE/HFSE
ratio may be a fundamental characteristic of subduction
related magmas.
Ni, Ti and V are low (Tables 3, 4. in the
Pani Complex and comparatively higher in the Tabulo ring-
dyke, which has a correspondingly higher content of
ferromagnesian minerals, particularly hornblende.
On discriminant diagrams based on Y/Nb and
Zr/Ti02 ratios (Winchester and Floyd, 1976) the Pani
Volcanics plot in the subalkaline field, as expected
(Fig. 9g, h, Fig. 10).
Usefulness of AFM diagrams or FeO total/MgO
versus Si02 plots (Miyashiro, 1974) are limited due to
alteration. They illustrate that MgO is abnormally low.
4.4 Comparison of the Pani Volcanics with silicic igneous rocks from island arcs and continental margins
Mineralogically the Pani Volcanics in the
prospect area (Tpi) are characterised by phenocryst-rich

-106-
Fig. 10 Y/Nb and Zr/Ti02-sio2 discriminant diagrams
'16 Pan." RHYOLITE ' 12. I
I COHENOITE I
6'd R.H'r'OOKITE I
I PANTELLERITE
64 TRACHYTE
~ &0 0 v; ANDESITE ~ 0 56 PHONOLITE
St S'U8- ALK.l.LINE
1+1 B A.SI\LT
44 NEPI-\ELINITE
40 0·01
Zr-/TaO'J. 0·10 1·00
1(, PaM
RHYOLITE
11 COMENDITE
PI\NTELLER\TE f,~ RHYODACITE
w
f, ~ z
TRili.CH'<TE
C'l '0 .... < 0
~
ANDESITE eo ~ :::> ...I
"' <( TRAC.HY-
ll>.NOESITE
S1 ALKALI
48 SUG -ALKALINE BASALT
eASALT
44
ItO 0·01 o-10 Nb/Y
1·00
Chemtcal d1scnmmatton d1a~rams aHer Winchester <9- Flo~ d. ,(I '116).
PHONOLITE
......... , BMINITE
NEPHELINIT£
10·0

-107-
assemblages comprising plagioclase, quartz, biotite,
sanidine, in rhyodacites and rhyolites; and plagioclase,
quartz, hornblende, biotite, in microgranodiorites; with
accessory phases of magnetite, allanite, sphene and
apatite, as well as zircon.
This mineralogy is compatible in general with
orogenic acid calc-alkaline volcanics and in particular
to high K types (Ewart, 1979, p.l4). It is also
consistent with classifying these rocks as derived from
I-type magmas (Chappell and White, 1974).
Tpii volcanics, including the Tabule ring-dyke
Complex, share textural and mineralogical characteristics
with Tpi, but differ in that they are more intermediate in
composition. Total ferromagnesian phenocryst amount to
10% and hornblende can exceed biotite, while quartz
phenocrysts are generally less than 5%. The presence
of hornblende generally characterises Tpii volcanics.
In addition Tpii eruptives have characteristically
smaller phenocrysts than Tpi. Common characteristics with
Tpi include rare sanidine megacrysts or phenocrysts and
bipyramidal quartz. Biotite-hornblende andesites from
the Una-Una volcano may correlate to Tpii.
The ferromagnesian minerals from the Pani
Volcanics and related rocks are relatively Fe and Ti-rich
(Table 5, Appendix 6).
In island-arcs, calc-alkaline rocks with Si02>63%
are rare, and volumetrically insignificant (Jakes and

-108-
White, 1972) in contrast to continental margins where
silicic igneous rocks often predominate. Useful
comparative examples to the Pani Volcanics of sub-alkaline
silic rocks from island arcs are lacking. Table 6
compares the Pani Volcanics with rocks of broadly the
same composition.
The comparison highlights the apparent high
K20/Na2o ratio exhibited by Tpi, with concurrent low
cao. Ti02 and P205 are lower in the Pani
Volcanics than in most other highly silicic rocks, with
the exception of the most differentiated Bishop Tuff.
Possibly Tio2 can be used as a differentiation index at
Gunung Pani.
The LREE's, Y, Zr, Nb are very low in the Pani
Volcanics; lower than in the SW USA, Western South America,
N Queensland and Lachlan continental tectonic settings and
lower than in New Zealand at Taupo, the Banda-Arc in
Indonesia and the SW Pacific island arcs.
The remarkable trace element gradients
(Bandelier Tuff; Smith, 1979) (Bishop Tuff, Hildreth, 1979)
shown by rhyolites in caldera-type silicic magmatism are
clearly absent at Gunung Pani.
The disparate behaviour between the REE's, Y, Zr,
Nb, Ti, P (HFSE) and K, Rb, Sr, Ba, or LILE's contrasts
with somewhat more coherent behaviour in examples of
fractional crystallisation (Tarney and Saunders, 1979).
This is also consistent with the behaviour of REE and HFSE
trace element patterns of the Lachlan granitoids, where

.....
Table 6 . Comparison of the Pani Volcanics with silicic igneous rocks from island . arcs and continental margin
Pani Volcanics
Pani Prospect
Non- Western USA Western Bishop Tuff Tabulo
SiliCified All South
rhyodacite Data America West Belt East Belt Early Late (1) (2) (3)
Si02 71.47 73.58 73.8 71.11 71.60 70.45 77.40 75.5 Ti02 0.29 0.20 0.20 0.40 0.35 '0.46 0.07 0.21 Al203 15.50 14.43 14.23 15.06 15.02 15.43 12.30 13.0 Fe2o 3 - 0.82 0.79 1. 75 1.46 1. 76 - -FeO 1.69 1.66 1.59 0.65 0.89 0.98 0.7t l.lt MnO 0.05 0.05 0.(\4 0.07 0.06 0.05 0.04 0.02 MgO 0.83 0.35 0.30 0.64 0.50 0.84 0.01 0.25 CaO 2.38 0.38 0,28 1.83 1.96 2.27 0.45 0.95 Na20 4.54 3.17 3.01 3.82 3. 73 3. 72 3.9 3.35 K20 3.21 5.35 5.68 4.58 4.34 3.90 4.8 5.55 P2o5 0.03 0.03 0.03 0.11 0.09 0.14 0.01 0.06
K 26 649 44 416 47 155 38 023 36 030 32 377 39 850 46 076 Ba 675 660 640 1 330 1 324 570 < 10 465 Rb 76 241 243 163 140 173 190 95 Sr 458 366 403 339 455 214 < 10 110 Pb 14 52 47 30 28 Zr 121 106 104 248 176 79 85 140 Rb 7.0 7.8 8.3 18 17 > 25 < 5 y 13 14 13 29 29 25 12 La 17 17 17 77 95 19 61 Ce 39 36 35 174 184 45 98 Yb 2.5 3.8 2.6 1.1 v 48 15 16 26 27 40 Cr 4 15 3.0 2.5 Mn 270 175 Ni 6 4 4 5 8 13 < 3 < 3 cu 5 10 9 13 12 16 Zn 28 82 83 43 90 38 40
K/Rb 351 184 194 233 257 187 210 485
Rb/Sr 0.17 0.66 0.60 0.48 0.31 0.81 0.86
K/Ba 39 67 74 28 27 57 99
Sr/Ba 0.68 0.55 0.63 0.25 0.34 0.37 0.24
Major element analyses recalculated on an anhydrous basis to total 100'.
'"
tectonic settings
Upper Palaeozoic Lachlan rvld Belt Volcanics Granites SW Georqetown Average Averaqe Indonesia Pacific Taupo Antarctic Inner Nth Qld I-type s-type Rhyolite Peninsula
N.ZI8) Granite( 9 ) (4) (5} (6) (7}
73.5 69.03 70.33 70.91 71.28 74.91 76.34
0.31 0.45 0.56 0.35 0.42 0.26 0.16
13.59 14.71 14.56 15.10 14,49 13.53 12.75
1.13 1.29 0.74 1.68 1.43 1.04 1.09t
1.42 2.61 3.29 1.30 1. 75 0.80
0.06 0.08 0.06 0.05 0.08 0.05 0.03
0.50 1. 78- 1.85 0.77 0.65 0.29 0.12
1.56 3.84 2.54 2.58 2.44 1.58 0.57
3.47 2.99 2.24 3.53 4.57 4.07 4.34
4.39 3.10 3.70 3.67 2.81 3.38 4.55
0.06 0.03 0.13 0.07 0.09 0.05 0.04
36 445 25 736 30 717 30 468 23 328 28 060 37 774
605 520 480 762 870 167
212 132 180 154 100 108 173
105 253 139 155 152 125 24
24 16 27 25 14 18 22
201 143 170 351 160 92
9 11 35 11
49 27 32 35 51 25 19
45 29 31 48 26 19
86 63 69 76 43.5 49 7. 7
74 72 13 13 1.7
4 17 3 - <1
9 12 7 6 -83 64 49 62 - 21
169 195 171 250 218
2.01 0.52 1.29 0.86 7.2
59 49 64 32.3 226
0.17 0.48 0.29 0.14 0.14
Feat : Total iron as FeO
Sources of data : (1), (2), (6), (7) Ewart (1979); (3) Hildreth (1979); {4\ Shen:t+on Qnd. L.abonne (l~ll) (5) White and Chappell (1983); (8) Ewart .. nd Stipp (1968); (9) Tarney and Saunders (1979).
I I-' 0 1.0 I

-110-
fractional crystallisation is not considered to be of
p~imary importance (Chappell, 1984) and where these
trace elements may reflect the nature of the source.
The occurrence of silicic, high K, igneous
rocks in a young island-arc is highly unusual,
particularly since not far, along the arc to the east,
the active Sangihe arc is clearly on oceanic crust.
4.5 Basement granitoids
4.5.1 Foliated hornblende-biotite microgranodiorite
The major element chemistry of this lithology
is consistent with acid calc-alkaline trends (Fig. 11).
On this diagram and in terms of mineralogy these rocks
can also be reasonably compared to the Tabulo ring-dyke.
The trace element data (Table 3) suggest these
rocks may be geochemically coherent to the Pani Volcanics
generally if compared to data from the Tabulo ring-dyke
(IKS 8). Values for Ba, Rb and Sr are similar.
However Rb from the quartz-biotite-rhyodacites (Tpi)
in the prospect is three times higher than for Tabulo
and the microgranodiorite and may not be primary.
La and Ce are slightly higher than for the
Pani Volcanics while Y is lower, suggesting the REE
pa·ttern may be relatively more fractionated. Zr, Ti,
P are probably comparable as the Sio2 content is lower.
Although the Pani Volcanic Complex clearly
intrudes the foliated microgranodiorite the age difference

Fig. 11
-111-
Alkalinity diagram.
I
, , I
lO 6 +--1
I I
,o
60 I I I
I
PE RALKALINE
I I
I I
1 4
Ah03 + (G\0 + K7.0+ No.,O
A h. 03-t CllO- (Kt0+ No.1o)
6
ALKALINITY
DIAG-RAM.
(after Wru:~hi 1 l%9)
0 PanL CompleX' rnl1o dacite
+---?- Trend.. ciu.e to poss1ble (QQ d<eplehon
6. T abu\o Rm9 d.y ke
0
I I
I
Fme foliated.. Hb /BL m1croqranod.1onte basement
C ale alka \rne trend.
-112-
is not known. The above arguments suggest the foliated
microgranite may be genetically related to the Pani
Volcanics.
4.5.2 Low K-granitoid- amphibolite basement
Medium-grained equigranular or foliated
hornblende/biotite granodiorites from the basement
petrographically and chemically may have affinity to
low K-granitoids of oceanic crustal environments.
Unfortunately the specimen analysed (IKS 21) is strongly
altered; apart from epidote replacing the ferromagnesian
minerals, silicification and loss of K20 cannot be
excluded.
Ba (130 ppm) and Rb (31 ppm) are consistent
with the low K20 (0.86%), but together with Sr (216 ppm)
cannot be reliably used due to possible mobility.
The LREE's La (7 ppm) and Ce (17 ppm) are
low, and in terms of chrondritic abundances (Hanson,
1980) correspond to enrichment factors of 22 and 21
respectively. The Y value (35 ppm) at least suggests
the HREE are not abnormally low in the sample analysed.
The mineralogy, La, Ce and to a lesser extent Y
abundances are comparable to low K-granitoids of the
Tholo group in Viti Levu, Fiji, which may have been
derived by parital fusion of an amphibolite source
(Gill and Stork, 1979).

-113-
Their occurrence would be consistent with
the associated amphibolites and geological setting of
the Marisa hinterland as it is currently understood.
However, this interpretation must be considered as
tentative only.
4.6 Tpii rhyodacites, Pinogu Volcanics and Una-Una
Sample 266 is typical of Tpii lithology,
which represents the latest phase of volcanic activity
in the Pani Volcanic Complex, and is characteristically
very fresh with vitreous black biotite phenocrysts.
Comparison petrographically and chemically with
Tabule (Table 4) suggests close similarity, with the
microgranodiorites representing a deeper intrusive level.
Una-Una (Table 4) is a compositionally unusual
volcanic island and may be related to Tpii volcanicity.
The major element data alone does not substantiate this
hypothesis. However the composition as well as
optical properties of hornblende and biotite from Una
Una (Appendix 6, Table 10) is comparable to that in
Tpii units (Gunung Bulu, 8266) and Tabulo (8276).
The Pinogu Volcanics outcropping near Narisa
are mainly basaltic rocks, but elsewhere, such as east of
Gorontalo, they have remarkable resemblance to Tpii
volcanics. This is compatible if the Pinogu Volcanics
are a bimodal acid-basic volcanic suite, with acid
lithologies correlating to Tpii.

-114-
4.7 Relationships between Tpi and Tpii and their magma source
Mineralogy and texture, as well as field
relationships, strongly indicate Tpi and Tpii volcanics
are genetically related and originate from a common
magmatic source. This is supported by the trace
element geochemistry and helps establish the primary
major element characteristics of Tpi, by comparison
with unaltered Tpii. Tpi lithologies are the most
differentiated, silica-rich and potassic and
mineralogically characterised by quartz, sanidine, biotite
and sphene. While Tpii lithologies share this
mineralogy, hornblende is typically the predominant
ferromagnesian phase.
Composite and glomeroporphyritic aggregates
of phenocrysts of relatively large size suggests a
relatively long rest time for Tpi magma in the upper part
of a high level crustal magma chamber. It is inferred
from the mineralogy and eruptive history that the magma
chamber was compositionally zoned with Tpii magma below
Tpi. The absence of early hornblende in Tpi and
lack of evidence from trace elements abundance patterns
for differentiation by extensive crystal fractionation
tends to support liquid state compositional zoning in
the magma chamber (e.g. Hildreth, 1979).
4.8 Speculations on tectonic environment and petrogenesis
The Marisa hinterland is interpreted to be
at least in part composed of a deeply eroded terrain,

-115-
representing the root zone of a former Oceanic island
arc (low K-granitoid-amphibolite basement), possibly
of pre-Tertiary age, intruded by younger foliated
calc-alkaline granitoids. The volumetric significance
of low K-granitoids is poorly known but they are unlikely
to exceed basic and metabasic rocks. This older
basement underlies or more likely is faulted against
the Eocene Tinornbo Fm. The Pani Volcanic Complex and
other related volcanic structures are due to the latest
igneous events and are most likely controlled by
extensional tectonics.
A major problem then, in terms of crust of
predominantly oceanic derivation, is the generation of
potassic and silicic magmas. Despite the alteration,
the geochemistry of the Pani Volcanics suggests a
continental affinity.
The occurrence of peraluminous K-rhyolites is
restricted mainly to continental margin settings, and
seems to require thickened continental crust (e.g. Coulon
and Thorpe, 1981).
In continental margin settings such as Western
USA there is a close association between high K-rhyolites
and bimodal rhyolites-basalts (Christiansen and Lipman,
1972; Ewart, 1979).
Despite lack of evidence for extensive
fractional crystallisation in the differentiation of
the Pani Volcanics, the high K-rhyolites of Western USA
(Ewart, 1979) provide a reasonable comparison to the
Pani Volcanics in terms of overall chemistry and mineralogy.

-116-
In this analogy the Pinogu Volcanics are
consistent with an associated bimodal suite.
It is believed that the geochemistry for
the Pani Volcanics is consistent with partial melting
of relatively unfractionated source rocks.
The crystallisation sequence for the quartz
biotite rhyodacites (section 3.5.1.6) shows that
titanium-rich biotite was an early phase, rather than
hornblende, which may reflect a high silica activity
and a relatively hydrous early melt (Wones, 1981).
Experimental work (Clemens and Wall, 1981) shows that
at temperatures up to 800°C, for a wide range of melt
water content titanium-rich biotite is the main
ferromagnesian phase that crystallises from moderately
peraluminous magmas.
Hydrous melts are low temperature and can be
'generated at crustal levels by anatexis, but have
limited intrusive capacity (Cann, 1970). Their
composition is strongly controlled by their source.
The foliated microgranodiorite is chemically
compatible with the Pani Volcanics (section 4.5.1) and is
interpreted as an early deep level intrusion.
A special tectonic environment for the
generation of the Pani Volcanics based on the
tectonic evolution of Sulawesi by Hamilton (197.9) and
bthers is speculated upon.
The deformation of Sulawesi, involving collision
of the microcontinent (Sula spur) and large scale

-117-
obduction of oceanic crust is shown in Fig. 3
(Section 2.4).
In this model the Marisa hinterland is
involved in the collision zone between the arc and
the continental fragment. A consequence of such a
scenario may be underplating by continental crust,
and therefore sialic source rocks for magma genesis,
but irrespective of this, it would produce a rapid
thickening of the crust, and possibly metamorphism
and partial melting. In addition magma genesis can
be related to subduction in the North Sulawesi Trench.
Subsequent high level silicic magmatism may be controlled
by rifting, following the compressional collision.
Generation of S-type magmas at continent
continent collisions zones, by anatexis of marginal
basin and crust, has been advocated for the Malaysian
tin belt (Beckinsdale, 1979; Mitchell, 1977). The
nature of magmas that could be produced in a continent
island arc collision would depend on the mechanism and
nature of the materials incorporated.
An alternate hypothesis to generating magmas
with a continental aspect would be to consider that
older cratonised crust extends east from Palu to the
Marisa area (Fig. 4) and this influences the composition
of subduction related magmatism.
Finally, irrespective of whether or not
anatectic melting due to collision played a role in

-118-
generation of parental magma, the I-type character
istics of the Pani Volcanics suggest subduction
related processes must also be involved.