the genetic basis of haploid induction in maize identified
TRANSCRIPT

HIGHLIGHTED ARTICLE| COMMUNICATIONS
The Genetic Basis of Haploid Induction in MaizeIdentified with a Novel Genome-Wide
Association MethodHaixiao Hu,*,1 Tobias A. Schrag,*,1 Regina Peis,† Sandra Unterseer,† Wolfgang Schipprack,*
Shaojiang Chen,‡ Jinsheng Lai,§ Jianbing Yan,** Boddupalli M. Prasanna,†† Sudha K. Nair,‡‡
Vijay Chaikam,§§ Valeriu Rotarenco,*** Olga A. Shatskaya,††† Alexandra Zavalishina,‡‡‡ Stefan Scholten,*
Chris-Carolin Schön,† and Albrecht E. Melchinger*,2
*Institute of Plant Breeding, Seed Science, and Population Genetics, University of Hohenheim, 70593 Stuttgart, Germany, †PlantBreeding, School of Life Sciences Weihenstephan, Technische Universität München, 85354 Freising, Germany, ‡Beijing Key
Laboratory of Crop Genetic Improvement and National Maize Improvement Center, and §State Key Laboratory ofAgrobiotechnology and National Maize Improvement Center, China Agricultural University, 100193 Beijing, China, **National KeyLaboratory of Crop Genetic Improvement, Huazhong Agricultural University, 430070 Wuhan, China, ††International Maize and
Wheat Improvement Center (CIMMYT), World Agroforestry Centre (ICRAF) House, Gigiri, 00621 Nairobi, Kenya, ‡‡CIMMYT,International Crops Research Institute for the Semi-Arid Tropics (ICRISAT) Campus, Patancheru, 502324 Greater Hyderabad, India,§§CIMMYT, 56237 Texcoco, Mexico, ***Procera Genetics, Fundulea, 915200 Calarasi, Romania, †††P. P. Luk’yanenko KrasnodarAll-Russia Research and Development Institute of Agriculture, Russian Academy of Agricultural Sciences, 350012 Krasnodar-12,
Russia, and ‡‡‡Department of Genetics, Faculty of Biology, Saratov State University, 410012, Russia
ABSTRACT In vivo haploid induction (HI) triggered by pollination with special intraspecific genotypes, called inducers, is unique to Zea maysL. within the plant kingdom and has revolutionized maize breeding during the last decade. However, the molecular mechanisms underlyingHI in maize are still unclear. To investigate the genetic basis of HI, we developed a new approach for genome-wide association studies(GWAS), termed conditional haplotype extension (CHE) test that allows detection of selective sweeps even under almost perfect confoundingof population structure and trait expression. Here, we applied this test to identify genomic regions required for HI expression and dissectedthe combined support interval (50.34 Mb) of the QTL qhir1, detected in a previous study, into two closely linked genomic segments relevantfor HI expression. The first, termed qhir11 (0.54 Mb), comprises an already fine-mapped region but was not diagnostic for differentiatinginducers and noninducers. The second segment, termed qhir12 (3.97 Mb), had a haplotype allele common to all 53 inducer lines but notfound in any of the 1482 noninducers. By comparing resequencing data of one inducer with 14 noninducers, we detected in the qhir12region three candidate genes involved in DNA or amino acid binding, however, none for qhir11. We propose that the CHE test can beutilized in introgression breeding and different fields of genetics to detect selective sweeps in heterogeneous genetic backgrounds.
KEYWORDS in vivo haploid induction; selective sweep; genome-wide association study; population structure; Zea mays L
THE double haploid (DH) technology based on in vivo hap-loid induction (HI) has become one of themost important
tools in maize breeding during the past decade and is replac-
ing the conventional method of line development by recur-rent selfing (Melchinger et al. 2013). The success of this newtechnology became possible, because dozens of maize in-ducer lines have been developed worldwide (reviewed inSupplemental Material, File S1) which, when used as polli-nators, trigger the production of seeds with haploid embryoat an acceptable rate, i.e.,.2% (Coe 1959). Double fertiliza-tion followed by elimination of the inducer chromosomes inthe embryo at later developmental stages (Li et al. 2009; Xuet al. 2013) as well as parthenogenesis (Sarkar and Coe 1966;Beckert et al. 2008) have been proposed as mechanisms for
Copyright © 2016 by the Genetics Society of Americadoi: 10.1534/genetics.115.184234Manuscript received November 6, 2015; accepted for publication February 16, 2016;published Early Online February 19, 2016.Supplemental material is available online at www.genetics.org/lookup/suppl/doi:10.1534/genetics.115.184234/-/DC1.1These authors contributed equally to this work.2Corresponding author: University of Hohenheim, Fruwirthstrasse 21, 70593 Stuttgart,Germany. E-mail: [email protected]
Genetics, Vol. 202, 1267–1276 April 2016 1267

HI in maize, but a proof of these hypotheses requires pro-found knowledge about the genetic and physiological factorsunderlying this phenomenon.
All previous QTL mapping studies for unraveling the ge-netic architecture of HI detected amajor QTL on chromosome1 (Röber 1999; Beckert et al. 2008; Prigge et al. 2012). Themost comprehensive study with four biparental populations(Prigge et al. 2012) mapped this QTL, termed qhir1, to bin1.04 and hypothesized that it is required for HI, but QTLpositions and 1-LOD support intervals differed substantiallyamong populations. In another study with population 16803 UH400, Dong et al. (2013) fine mapped a 3.57-Mb regionbetween markers umc1917 and bnlg1811, which targetedthe QTL qhir1 and identified a 243-kb region with significanteffect on HI. Both studies employed inbred UH400 as inducerparent, which limits the inference on HI to this specific in-ducer line. Moreover, in view of the uncertainties associatedwith the exact QTL position, concentrating the fine mappingon a very narrow region carries the risk of overlooking im-portant adjacent segments. Therefore, our objectives were to(i) detect selective sweeps for HI in a worldwide collectionof inducers (cases) and noninducers (controls) by a genome-wide association study (GWAS); (ii) identify a candidateregion(s) underlying qhir1; (iii) validate the fine-mappingresults reported by Dong et al. (2013) in a broader set ofgenetic material with an independent, complementary ap-proach; and (iv) resequence the qhir1 region for identifi-cation of candidate genes involved in HI in maize. Forapplication of GWAS, we developed a novel method thatcan deal with almost perfect confounding between geneticancestry and trait expression.
Results and Discussion
We genotyped a worldwide collection of 53 maize inducerlines from 29 breeding programs (Table S1) for 56,110 SNPson the Illumina MaizeSNP50 Bead Chip (50k SNP chip;Ganal et al. 2011). From various public and private data-bases, we gathered marker data obtained with this SNP chipfor 1482 inbred lines (File S2) chosen to represent theglobal genetic diversity of maize from seven germplasmgroups. To the best of our knowledge, these lines possesszero or very low HI rate, and therefore, are subsequentlyreferred to as noninducers. To balance the number of lineswithin each noninducer group with the number of inducers,we created a core set of 363 lines using established methods(Liu and Muse 2005). The core set consisted of the 53 in-ducers and 310 noninducers (50 lines from each noninducergermplasm group with two groups having fewer than 50lines, Table S2).
Principal component analysis (PCA) of the core set clearlyseparated the group of inducers from all seven germplasmgroups of noninducers, and cluster analysis revealed closerelatedness among subsets of the 53 inducers (Figure 1). Theclear separation between inducers and noninducers was cor-roborated by plots of the first two principle components from
separate PCAs of inducers against all lines from each germ-plasm group of the 1482 noninducers (Figure S1).
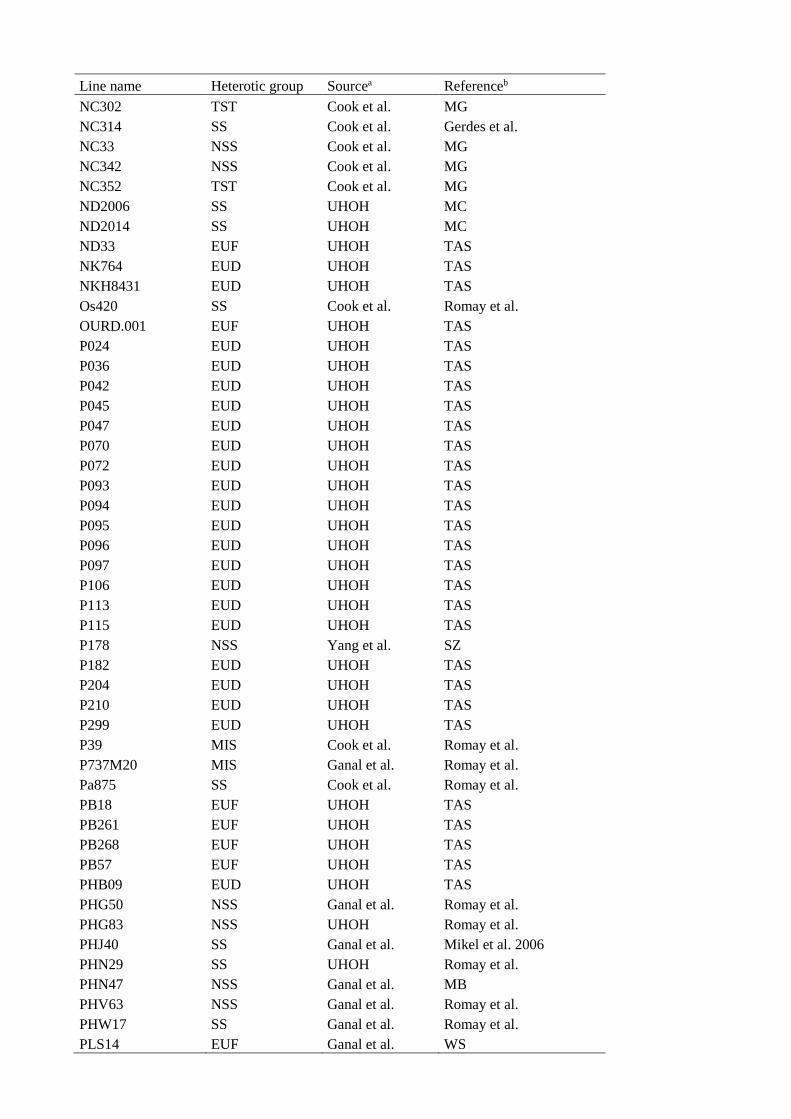
To identify genomic segments associated with HI, weperformed a GWAS with various established methods forcase-control association analysis (Purcell et al. 2007; Well-come Trust Case Control Consortium 2007) and detection ofselective sweeps (Voight et al. 2006; Tang et al. 2007; Chenet al. 2010; Fariello et al. 2013). The standard case-controlassociation analysis (Purcell et al. 2007) detected no strikingsignals and showed a high genomic inflation factor (l=33.3,Figure S3, A and B). Likewise, several popular methods foridentifying selective sweeps in humans and animals (Vittiet al. 2013) failed to detect clear signals (Figure S3, C–F).Neither the within-population test applied to the 53 inducersusing the iHS score (Voight et al. 2006) nor the between-population test treating the 53 inducers and 310 noninducersas two populations and employing the Rsb score (Tang et al.2007) yielded significant signals. In addition, we applied twopopulation differentiation-based tests that implemented dif-ferent algorithms. Using the hapFLK score (Fariello et al.2013) based on the differences of haplotype frequencies be-tween populations, we detected a few significant signals onchromosome 9. Likewise, the cross population compositelikelihood ratio (XP-CLR) score (Chen et al. 2010) yieldedhigh XP-CLR values on chromosomes 1 and 6. However,further analyses of haplotypes in these regions detected witheither method revealed that the major haplotypes found inthe inducer group were present only in a subset of them(Figure S4), indicating that these regions are not requiredfor HI.
Although the various methods for GWAS differ in theirrationale, their common assumption is that the individualsunder investigation are largely unrelated to each other(Voight et al. 2006; Purcell et al. 2007; Tang et al. 2007; Chenet al. 2010; Fariello et al. 2013). However, in this study, weencountered a different data structure, in which the cases(inducers) are closely related with each other because theyshare a common ancestor (Stock6 or a later version of itmaintained by the Maize Stock Center; Lawrence et al.2005) not more than six breeding cycles distant, whereasthe controls (noninducers) can be considered largely unre-lated among themselves and with the cases (inducers). Thus,this resulted in almost perfect confounding of populationstructurewith cases and controls (Figure 1; Figure S1), whichrepresents an unsolved problem for all GWAS approachesmentioned above.
To solve this problem, we developed a novel approach,termed conditional haplotype extension (CHE) test, in whichthe cases are first scanned for detection of long haplotypesfixed in this set of genotypes. The rationale behind this stepis that linkage drag results in long segments of DNA beingtransferred during trait introgression (Sabeti et al. 2002).In the second step, a formal statistical test based on theClopper–Pearson confidence interval (Clopper and Pearson1934) is applied for testing the hypothesis that transmissionof the detected haplotypes through known pedigrees of the
1268 H. Hu et al.

cases cannot be explained by chance alone (described in de-tail in File S3).
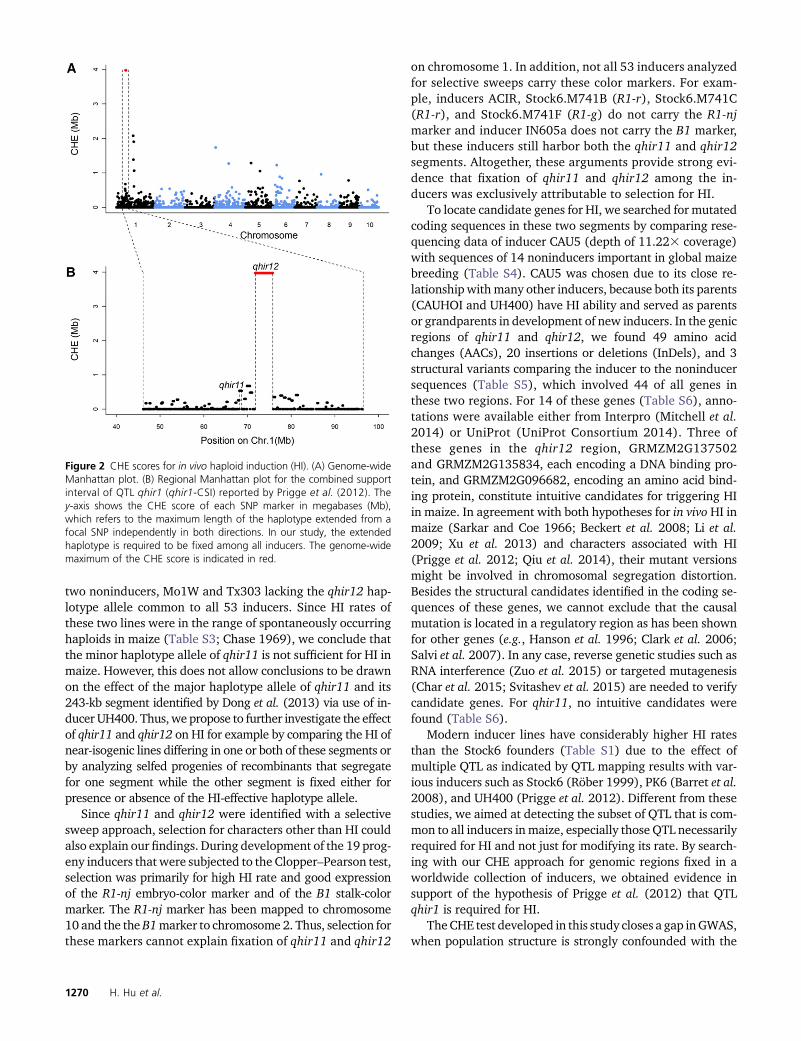
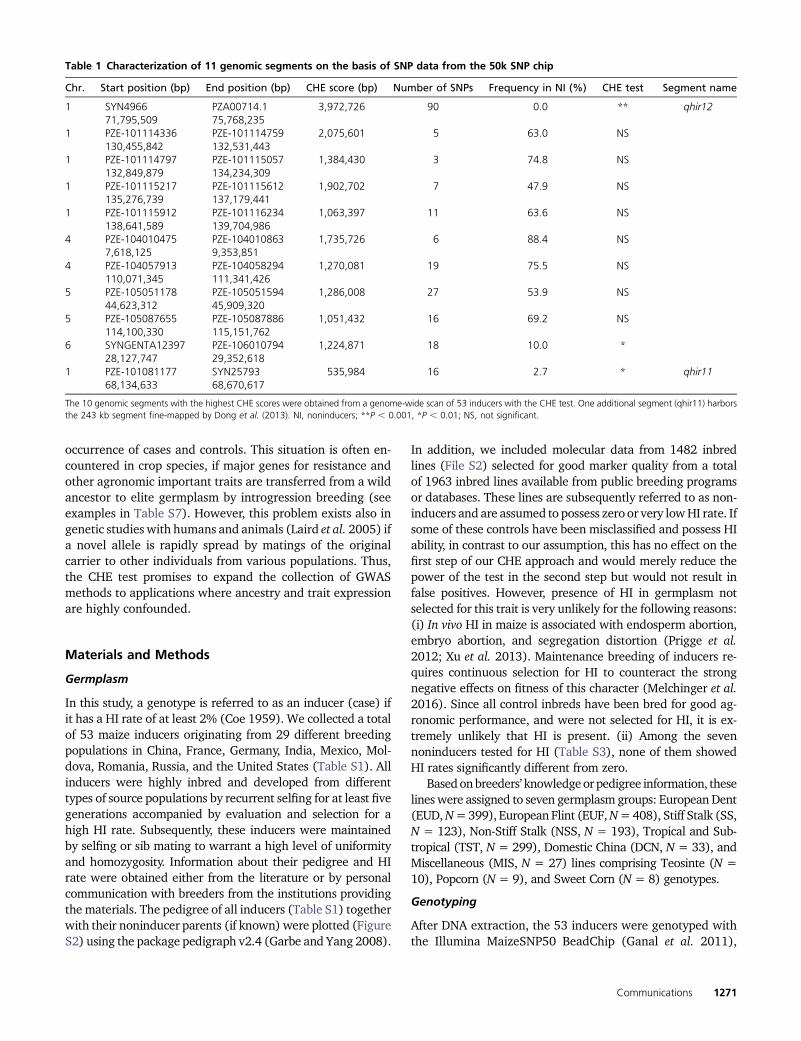
In thefirst step, the top 10 segmentsfixed in all 53 inducers(cases) exceeded 1 Mb in length (Figure 2, Table 1). In thesecond step, among 19 inducers (described in File S3) de-rived from matings between inducers and noninducers, onlythe longest segment on chromosome 1 and another shortersegment on chromosome 6 were significant at P, 0.01 (Fig-ure 2, Table 1). The segment identified on chromosome 1spanned 3.97 Mb on the physical map, overlapped with allsupport intervals of qhir1 from four QTL mapping popula-tions (Figure 3, A–C; Prigge et al. 2012), and was denotedqhir12. Adjacent to this region was a shorter 0.54-Mb seg-ment denoted qhir11 (Figure 2B), which harbored the243-kb region fine mapped by Dong et al. (2013) and wasfixed in all inducers and significant in the Clopper–Pearsontest (Table 1); for these reasons, this segment was also con-sidered in our subsequent analyses.
The qhir12 segment was not detected by Dong et al.(2013), as it lies 985 kb outside (downstream) the markerinterval originally chosen for fine mapping, but their resultsfrom cross 16803UH400 provide strong evidence in supportof a second region linked to their 243-kb fine-mapped seg-ment, because the effect of the entire qhir1 region found inthe F2 generation (see figure 2 in Dong et al. 2013) was morethan twice the effect of the 243-kb segment segregating in F3progeny of recombinant F2 individuals (see figure 3 in Donget al. 2013). Thus, the 243-kb segment making up about halfof the qhir11 segment detected in our study, explained lessthan one quarter of the genetic variance of HI attributable toQTL qhir1.
On chromosome6, a 1.22-Mb segmentwasfixed among allinducers and significant in the Clopper–Pearson test (Table
1). Consequently, this segment may also have an effect on HI,but the evidencewas not as strong as for qhir12, because 10%of the controls also harbored this segment (Table 1). For thisreason and due to the prominent role of QTL qhir1 in pre-vious studies, we decided to focus subsequently on genomicsegments detected on chromosome 1.
To determine whether both or only one of these regionsharbor the gene(s) required forHI,we traced the transmissionof both segments in the pedigree of all 53 inducers andreconstructed the respective recombination events (Laiet al. 2010) in a 50.34-Mb genomic region denoted asqhir1-combined support interval (CSI), which covered the1-LOD support intervals of qhir1 from four QTL mappingpopulations (Prigge et al. 2012) and contained the qhir11and qhir12 segments (Figure 3A). Based on the 1123 SNPmarkers of the 50k SNP chip found in this region, both qhir11and qhir12 were regarded as identical by descent among the53 maize inducers and derived from one of the various ver-sions of Stock6 (Figure 3C). To corroborate this result witheven higher marker density, we genotyped a representativesubset of 17 inducers (indicated in Table S1)with a 600k SNPchip described by Unterseer et al. (2014), which included15,602 SNP markers in the qhir1-CSI. While the segmentqhir12 had a single haplotype across all inducers, two haplo-types were observed for qhir11 (Figure 3D, Figure S5). Thisindicates that the minor haplotype allele of qhir11 togetherwith its neighbor segments present in Stock6.M741H andStock6.ROM either did not originate from the original ver-sion of Stock6 (i.e., Stock6.M741F; Lawrence et al. 2005) orwas altered due to genomic rearrangements caused by active(retro-)transposons. This haplotype allele, which has stillhigh congruency with the major haplotype allele of qhir11within the 243-kb fine-mapped fragment, was also found in
Figure 1 Genetic diversity between inducers and a worldwide germplasm collection of noninducers in maize. (A) Genetic structure of inducers incomparison with noninducers revealed by the first three principal components obtained from PCA with 29,533 SNPs of a core set of 53 inducers and310 noninducers from worldwide germplasm. Different germplasm groups are shown in different colors (red, inducers; green, EUF; pink, EUD; blue, SS;yellow, NSS; purple, TST; brown, DCN; and gray, MIS). (B) Neighbor-joining tree of 53 maize haploid inducers.
Communications 1269
two noninducers, Mo1W and Tx303 lacking the qhir12 hap-lotype allele common to all 53 inducers. Since HI rates ofthese two lines were in the range of spontaneously occurringhaploids in maize (Table S3; Chase 1969), we conclude thatthe minor haplotype allele of qhir11 is not sufficient for HI inmaize. However, this does not allow conclusions to be drawnon the effect of the major haplotype allele of qhir11 and its243-kb segment identified by Dong et al. (2013) via use of in-ducer UH400. Thus, we propose to further investigate the effectof qhir11 and qhir12 on HI for example by comparing the HI ofnear-isogenic lines differing in one or both of these segments orby analyzing selfed progenies of recombinants that segregatefor one segment while the other segment is fixed either forpresence or absence of the HI-effective haplotype allele.
Since qhir11 and qhir12 were identified with a selectivesweep approach, selection for characters other than HI couldalso explain our findings. During development of the 19 prog-eny inducers that were subjected to the Clopper–Pearson test,selection was primarily for high HI rate and good expressionof the R1-nj embryo-color marker and of the B1 stalk-colormarker. The R1-nj marker has been mapped to chromosome10 and the the B1marker to chromosome 2. Thus, selection forthese markers cannot explain fixation of qhir11 and qhir12
on chromosome 1. In addition, not all 53 inducers analyzedfor selective sweeps carry these color markers. For exam-ple, inducers ACIR, Stock6.M741B (R1-r), Stock6.M741C(R1-r), and Stock6.M741F (R1-g) do not carry the R1-njmarker and inducer IN605a does not carry the B1 marker,but these inducers still harbor both the qhir11 and qhir12segments. Altogether, these arguments provide strong evi-dence that fixation of qhir11 and qhir12 among the in-ducers was exclusively attributable to selection for HI.
To locate candidate genes for HI, we searched for mutatedcoding sequences in these two segments by comparing rese-quencing data of inducer CAU5 (depth of 11.223 coverage)with sequences of 14 noninducers important in global maizebreeding (Table S4). CAU5 was chosen due to its close re-lationship with many other inducers, because both its parents(CAUHOI and UH400) have HI ability and served as parentsor grandparents in development of new inducers. In the genicregions of qhir11 and qhir12, we found 49 amino acidchanges (AACs), 20 insertions or deletions (InDels), and 3structural variants comparing the inducer to the noninducersequences (Table S5), which involved 44 of all genes inthese two regions. For 14 of these genes (Table S6), anno-tations were available either from Interpro (Mitchell et al.2014) or UniProt (UniProt Consortium 2014). Three ofthese genes in the qhir12 region, GRMZM2G137502and GRMZM2G135834, each encoding a DNA binding pro-tein, and GRMZM2G096682, encoding an amino acid bind-ing protein, constitute intuitive candidates for triggering HIin maize. In agreement with both hypotheses for in vivo HI inmaize (Sarkar and Coe 1966; Beckert et al. 2008; Li et al.2009; Xu et al. 2013) and characters associated with HI(Prigge et al. 2012; Qiu et al. 2014), their mutant versionsmight be involved in chromosomal segregation distortion.Besides the structural candidates identified in the coding se-quences of these genes, we cannot exclude that the causalmutation is located in a regulatory region as has been shownfor other genes (e.g., Hanson et al. 1996; Clark et al. 2006;Salvi et al. 2007). In any case, reverse genetic studies such asRNA interference (Zuo et al. 2015) or targeted mutagenesis(Char et al. 2015; Svitashev et al. 2015) are needed to verifycandidate genes. For qhir11, no intuitive candidates werefound (Table S6).
Modern inducer lines have considerably higher HI ratesthan the Stock6 founders (Table S1) due to the effect ofmultiple QTL as indicated by QTL mapping results with var-ious inducers such as Stock6 (Röber 1999), PK6 (Barret et al.2008), and UH400 (Prigge et al. 2012). Different from thesestudies, we aimed at detecting the subset of QTL that is com-mon to all inducers in maize, especially those QTL necessarilyrequired for HI and not just for modifying its rate. By search-ing with our CHE approach for genomic regions fixed in aworldwide collection of inducers, we obtained evidence insupport of the hypothesis of Prigge et al. (2012) that QTLqhir1 is required for HI.
TheCHE test developed in this study closes a gap inGWAS,when population structure is strongly confounded with the
Figure 2 CHE scores for in vivo haploid induction (HI). (A) Genome-wideManhattan plot. (B) Regional Manhattan plot for the combined supportinterval of QTL qhir1 (qhir1-CSI) reported by Prigge et al. (2012). They-axis shows the CHE score of each SNP marker in megabases (Mb),which refers to the maximum length of the haplotype extended from afocal SNP independently in both directions. In our study, the extendedhaplotype is required to be fixed among all inducers. The genome-widemaximum of the CHE score is indicated in red.
1270 H. Hu et al.
occurrence of cases and controls. This situation is often en-countered in crop species, if major genes for resistance andother agronomic important traits are transferred from a wildancestor to elite germplasm by introgression breeding (seeexamples in Table S7). However, this problem exists also ingenetic studies with humans and animals (Laird et al. 2005) ifa novel allele is rapidly spread by matings of the originalcarrier to other individuals from various populations. Thus,the CHE test promises to expand the collection of GWASmethods to applications where ancestry and trait expressionare highly confounded.
Materials and Methods
Germplasm
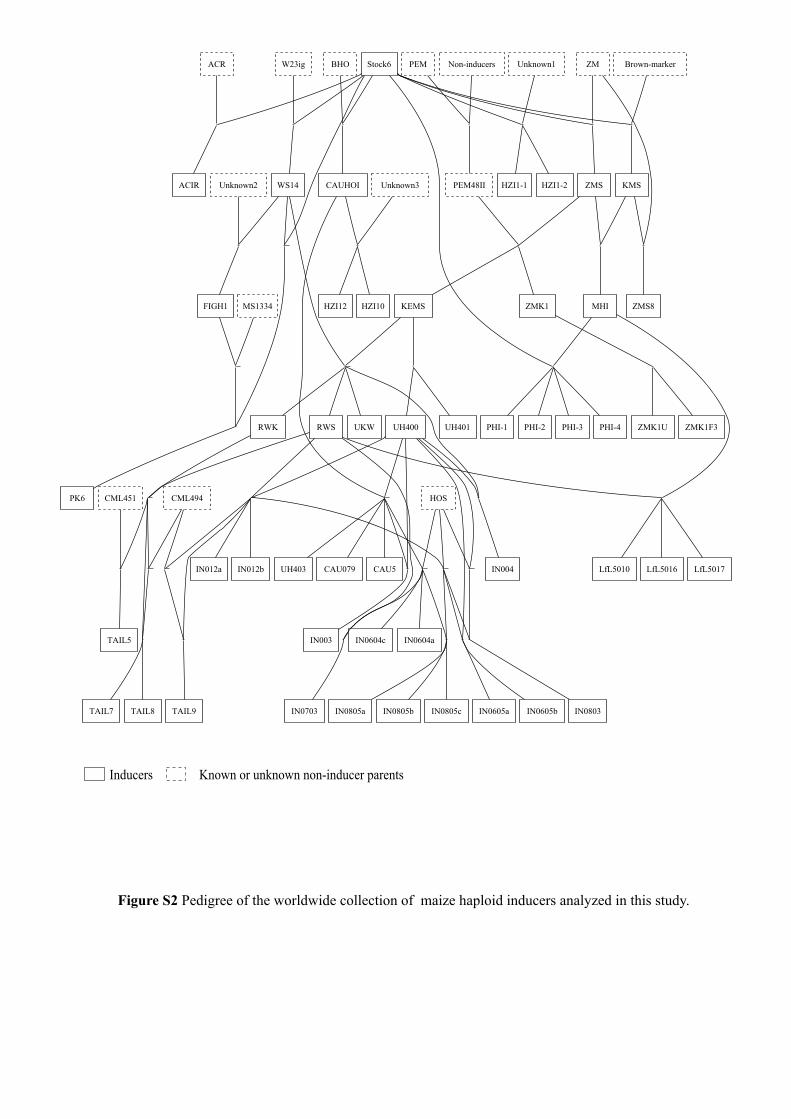
In this study, a genotype is referred to as an inducer (case) ifit has a HI rate of at least 2% (Coe 1959). We collected a totalof 53 maize inducers originating from 29 different breedingpopulations in China, France, Germany, India, Mexico, Mol-dova, Romania, Russia, and the United States (Table S1). Allinducers were highly inbred and developed from differenttypes of source populations by recurrent selfing for at least fivegenerations accompanied by evaluation and selection for ahigh HI rate. Subsequently, these inducers were maintainedby selfing or sib mating to warrant a high level of uniformityand homozygosity. Information about their pedigree and HIrate were obtained either from the literature or by personalcommunication with breeders from the institutions providingthe materials. The pedigree of all inducers (Table S1) togetherwith their noninducer parents (if known) were plotted (FigureS2) using the package pedigraph v2.4 (Garbe and Yang 2008).
In addition, we included molecular data from 1482 inbredlines (File S2) selected for good marker quality from a totalof 1963 inbred lines available from public breeding programsor databases. These lines are subsequently referred to as non-inducers and are assumed to possess zero or very lowHI rate. Ifsome of these controls have been misclassified and possess HIability, in contrast to our assumption, this has no effect on thefirst step of our CHE approach and would merely reduce thepower of the test in the second step but would not result infalse positives. However, presence of HI in germplasm notselected for this trait is very unlikely for the following reasons:(i) In vivo HI in maize is associated with endosperm abortion,embryo abortion, and segregation distortion (Prigge et al.2012; Xu et al. 2013). Maintenance breeding of inducers re-quires continuous selection for HI to counteract the strongnegative effects on fitness of this character (Melchinger et al.2016). Since all control inbreds have been bred for good ag-ronomic performance, and were not selected for HI, it is ex-tremely unlikely that HI is present. (ii) Among the sevennoninducers tested for HI (Table S3), none of them showedHI rates significantly different from zero.
Basedonbreeders’knowledgeor pedigree information, theselineswere assigned to seven germplasm groups: European Dent(EUD,N=399), European Flint (EUF,N=408), Stiff Stalk (SS,N = 123), Non-Stiff Stalk (NSS, N = 193), Tropical and Sub-tropical (TST, N = 299), Domestic China (DCN, N = 33), andMiscellaneous (MIS, N = 27) lines comprising Teosinte (N =10), Popcorn (N = 9), and Sweet Corn (N = 8) genotypes.
Genotyping
After DNA extraction, the 53 inducers were genotyped withthe Illumina MaizeSNP50 BeadChip (Ganal et al. 2011),
Table 1 Characterization of 11 genomic segments on the basis of SNP data from the 50k SNP chip
Chr. Start position (bp) End position (bp) CHE score (bp) Number of SNPs Frequency in NI (%) CHE test Segment name
1 SYN4966 PZA00714.1 3,972,726 90 0.0 ** qhir1271,795,509 75,768,235
1 PZE-101114336 PZE-101114759 2,075,601 5 63.0 NS130,455,842 132,531,443
1 PZE-101114797 PZE-101115057 1,384,430 3 74.8 NS132,849,879 134,234,309
1 PZE-101115217 PZE-101115612 1,902,702 7 47.9 NS135,276,739 137,179,441
1 PZE-101115912 PZE-101116234 1,063,397 11 63.6 NS138,641,589 139,704,986
4 PZE-104010475 PZE-104010863 1,735,726 6 88.4 NS7,618,125 9,353,851
4 PZE-104057913 PZE-104058294 1,270,081 19 75.5 NS110,071,345 111,341,426
5 PZE-105051178 PZE-105051594 1,286,008 27 53.9 NS44,623,312 45,909,320
5 PZE-105087655 PZE-105087886 1,051,432 16 69.2 NS114,100,330 115,151,762
6 SYNGENTA12397 PZE-106010794 1,224,871 18 10.0 *28,127,747 29,352,618
1 PZE-101081177 SYN25793 535,984 16 2.7 * qhir1168,134,633 68,670,617
The 10 genomic segments with the highest CHE scores were obtained from a genome-wide scan of 53 inducers with the CHE test. One additional segment (qhir11) harborsthe 243 kb segment fine-mapped by Dong et al. (2013). NI, noninducers; **P , 0.001, *P , 0.01; NS, not significant.
Communications 1271

Figure 3 Graphical genotypes of 53 inducers and two noninducers (Mo1W and Tx303). (A) Support intervals of QTL qhir1 in four segregatingpopulations reported by Prigge et al. (2012). Red bars indicate flanking markers of QTL qhir1 in the respective mapping populations. (B) Physicaland genetic maps of the qhir1-CSI. (C) Graphical genotypes indicating the origin of genomic fragments of 53 inducers from their founders in theqhir1-CSI region based on the 50k SNP chip. N indicates the number of markers in respective regions. (D) Zooming in a subregion of qhir1-CSI thatshows the graphical genotypes of 17 inducers from different breeding populations selected from the 53 inducers and genotyped with the 600k SNPchip.
1272 H. Hu et al.

referred to as 50k SNP chip. Genotypic data collected withthe same SNP chip for the 1482 noninducers were obtainedfor 834 lines from our own database, for 335 lines from Yanget al. (2011) and for the remaining 313 lines from Cook et al.(2012) and Ganal et al. (2011). Quality control of the SNPdata encompassed two steps for screening of markers andgenotypes. Markers were selected if (i) their call frequencyexceeded 0.80 across all inducers and 0.90 across all nonin-ducers and (ii) heterozygosity was ,10% across all inducersand,5% across all noninducers. Noninducer genotypes wereincluded if (i) their call rate exceeded 95% and (ii) their het-erozygosity across all markers was ,5%. A total of 40,572SNPs and 1482 noninducers met these criteria and were usedfor further analyses together with the 53 inducers. The 1.05%missing marker data in all 1535 lines were subsequently im-puted with software Beagle 3.3.2 (Browning and Browning2007).
Inadditiontogenotypingwiththe50kSNPchip,17inducers(indicated in Table S1) were chosen for genotyping with theAffymetrix Axiom Maize Genotyping Array (Unterseer et al.2014), referred to as 600k SNP chip. These 17 inducers werechosen to represent most of the genetic diversity among all53 inducers according to pedigree information. Additionally,two noninducer inbred lines, Mo1W and Tx303, were alsogenotyped with this 600k SNP chip.
Genetic structure analyses
Genetic structure analyses of inducers and noninducers werebased on a subset of 29,553markers obtained after excluding11,019 Syngenta markers from the entire set of 40,572 SNPs.Thiswas taken as a precautionmeasure tominimize a possibleascertainment bias, because the Syngenta markers were spe-cifically selected for polymorphism between B73 and Mo17(Ganal et al. 2011). First, we determined with softwarePowerMarker v3.25 (Liu and Muse 2005) a subset of 50 linescapturing maximum diversity for each of the five germplasmgroups (EUD, EUF, SS, NSS, and TST) with N. 50. Togetherwith the 53 inducers, and the 33 DCN and 27 MIS lines, thisyielded a core set of 363 lines (Table S2). Second, a PCAwasperformed with this core set as well as with inducers againstall lines from each germplasm group of the 1482 nonin-ducers. A three-dimensional plot for PCA of the core setand two-dimensional plots for the other PCAs were obtainedby using R package rgl (Adler et al. 2014) and standard Rsoftware (R Development Core Team 2013), respectively.Third, we produced a neighbor-joining tree of the 53 inducersbased on cluster analysis of Rogers’ distance (Rogers 1972)estimates using R package ape (Paradis et al. 2004).
Application of established GWAS methods for detectingindividual SNPs or selective sweeps associated with HI
We analyzed our data with the following methods for detect-ing individual SNPs or selective sweeps associatedwith targettraits. First, a genome-wide case-control association analysis(Wellcome Trust Case Control Consortium 2007), in whichinducers were considered as cases and noninducers as con-
trols, was performed using software package Plink1.07 (Purcellet al. 2007). Second, we computed iHS and Rsb scores follow-ing Voight et al. (2006) and Tang et al. (2007), respectively,using R package rehh (Gautier and Vitalis 2012) to detectselective sweeps with long-range haplotypes (Sabeti et al.2002) associated with HI. Third, we applied a populationdifferentiation-based approach to detect selective sweepsassociated with HI with the hapFLK score following Farielloet al. (2013) using their software package hapFLK. Finally, acomposite likelihood method, the XP-CLR score (Chen et al.2010), for detecting selective sweeps was applied using theXP-CLR package.
A novel method for identifying selective sweeps underpopulation structure–trait confounding
Since all methods described in the previous section failed inthe analysis of our data, we developed a novel two-stepapproach for detecting selective sweeps underlying HI.
In the first step, a conditional haplotype extension pro-cedure was applied to the group of cases (i.e., inducers) fordetecting all segments with both high frequency and longstretch. In a genome-wide scan, where markers are orderedaccording to their physical positions on the chromosome,each marker is analyzed one by one with the following pro-cedure (see an illustration in Figure S6). Starting withmarker m, we considered the genome segment spanningfrom marker m 2 l on the left side to marker m + r on theright side as a haplotype block. The values of l and r start atzero and are subsequently increased stepwise to the next in-teger, but independently in both directions. For each stepof haplotype block extension, the frequency of the majorhaplotype within the block is determined in the cases. Themaximum values of l and r for which the frequency of themajor haplotype from m 2 l to m + r does not fall below agiven threshold t are designated as l* and r*, respectively. Thephysical distance (in megabases) from marker m 2 l* tomarkerm+ r* is referred to as CHE score, as an abbreviationfor conditional haplotype extension in physical map units,and used as criterion for screening the entire genome. Vari-ous threshold t values can be chosen depending on the pop-ulation under study. In our study, the objective was to detectthe genomic segments required for HI among all maize in-ducers; therefore, we chose the very stringent threshold t =1.0, which results in detection of long genomic segmentsfixed among all 53 inducers.
In the secondstep,a formal statistical testwas carriedout forthe top n (n=10 in our study) segments with the highest CHEscores detected in the first step (details were described in FileS3) as well as for the qhir11 segment that was not among the10 segments with the highest CHE score but for which priorknowledge existed from Dong et al. (2013). Briefly, we calcu-lated for each genomic segment separately a Clopper–Pearsonconfidence interval (Clopper and Pearson 1934) for testing thehypothesis that transmission of the detected segment throughknown pedigrees of the cases cannot be explained by chancealone in the development of new inducers.
Communications 1273

Graphical genotype analysis
Based on the 1-LOD support intervals of QTL qhir1 from foursegregating populations (Prigge et al. 2012), we first deter-mined a combined support interval for qhir1 (qhir1-CSI) withthe following steps: (i) search for the eight nearest markersoutside the 1-LOD support intervals of qhir1 from the foursegregating populations, and (ii) determine the farthest leftand farthest right markers among the eight markers. Thisrevealed a genomic region spanning from position 46.21 to96.55 Mb on chromosome 1 (Figure 3A) according to themaize B73 AGP_v2 (Schnable et al. 2009).
Subsequently, we inferred the segment transmission fromfounders to progeny inducers on the basis of the pedigreeprovided by maize breeders (Figure S2) using the 50k SNPchip marker data. Briefly, the segment of Stock6.M741F inthe qhir1-CSI was considered as source genome fragment inthe entire region of qhir1-CSI, because it represents the orig-inal Stock6 (Lawrence et al. 2005). For the 52 remaininginducers, we determined the origin of their genomic frag-ments in the qhir1-CSI in two steps. First, we compared themarker profile of a specific inducer with that of all possiblefounders involved in its pedigree (Figure S2) to identify themap positions of former recombination sites. Thus, its ge-nome in the qhir1-CSI was divided into several fragmentson the basis of putative recombination sites. Second, for aspecific fragment flanked by a pair of adjacent recombinationsites, we determined its oldest founder among all foundershaving identical marker profile with this fragment.
To examine the reliability of graphical genotypes con-structedwith the 50k SNP chip, we also constructed graphicalgenotypes in the qhir1-CSI region for the 17 selected maizeinducers (indicated in Table S1 and described in the sectionGenotyping) genotyped with the 600k SNP chip using thesame procedure as described above.
Evaluation of HI rate of two noninducers
As shown in the text (Figure 3D), based on the 186 SNPmarkers from the 600k SNP chip in the qhir11 region,the minor haplotype allele present in two inducers was alsofound in two noninducers, Mo1W and Tx303. To testwhether this haplotype allele alone confers HI in maize,Mo1W and Tx303, together with five inducers and five ran-domly chosen noninducers as controls (Table S3) werecrossed to a liguleless (lg2) tester for evaluating their HI rate.After harvest, we randomly chose �1000 kernels from eachof the testcrosses and seeded them in the greenhouse to iden-tify haploid plants in growth stage v3 (Abendroth et al. 2011)on the basis of the liguleless phenotype followed by flowcytometry analysis to confirm haploidy of the plants classifiedas liguleless.
Resequencing data analysis
Inducer line CAU5 and noninducer line 1680 from ChinaAgricultural University as well as noninducer lines Lo11,D06, F98902, B73, EP1, PH207, and Teosinte from the Uni-versity of Hohenheim were sequenced by the Illumina HiSeq
2000 platform (NCBI BioProject PRJNA260788; Unterseeret al. 2014). Genome resequencing data of noninducerlines Mo17, CML103, Dan340, Huangzaosi, Chang7-2,and Zheng58 were obtained from Chia et al. (2012; NCBISequence Read Archive SRA051245) and Jiao et al. (2012;NCBI Sequence Read Archive SRA049859).
The complete resequencing analysis for the qhir1-CSI re-gionwas performedwith software CLCGenomicsWorkbench7.5.1 (CLC Bio, http://www.clcbio.com). If not mentionedspecifically, the parameter setting was default. After im-port of the raw genome sequencing data, the reads weretrimmed: minimum number of nucleotides of a read = 15.Trimmed reads weremapped to the B73 genome (RefGen_v2;Schnable et al. 2009). The parameters for read mapping (onemapping per line) are length fraction of alignment = 0.8,auto-detect paired distances = no, and nonspecific matchhandling = ignore. A detailed mapping report was createdfor the qhir1-CSI region (Table S4). InDels and structuralvariants were detected for each mapping.We performed theFixed Ploidy Variant Detection model of CLC GenomicsWorkbench on each mapping file to detect sequence varia-tions. Splice site effects and amino acid changes were ana-lyzed using genome annotation of B73 genome RefGen_v2(Zea_mays.AGPv2.15.gtf.gz at ftp://ftp.ensemblgenomes.org/pub/plants/release-15/gtf/zea_mays/). A genotypewas calledif it was supported by at least 10 reads with at least 90% ofthe reads being consistent with the major allele (thresholdfor homozygous calls) and with ,10% of the reads indicat-ing gaps or missing calls. Genotype calls from each mappingfile were combined and only biallelic SNPs with at least oneinducer and at least one noninducer call were consideredfor further analyses. All analyses were performed within R(R Development Core Team 2013).
Data availability
File S4 and File S5, contain information about SNP markerand genotypes analyzed in this study with the 50k SNP chipand the 600k SNP chip, respectively. Resequencing data ofinducer line CAU5 and noninducer line 1680 has been sub-mitted to NCBI (accession: SRP065659). File S6 containsliterature cited in the supplemental files.
Acknowledgments
The authors thank J. Eder, F. Qiu, M. Sachs, and M. Beckertfor providing materials of maize inducers used for genotyp-ing; H. Silva, M. Halilaj, and J. Böhm for help with theliguleless and flow cytometry analyses; and W. Molenaarand H. Zhao for comments on earlier versions of the man-uscript. We thank two anonymous reviewers for very helpfulsuggestions for improving the content of this publication.
Author contributions: A.E.M. designed this project andsupervised the research. H.H., T.A.S., and A.E.M. wrotethe manuscript, and all co-authors were involved in editingthe manuscript. H.H. and T.A.S. performed most of the dataanalyses and developed the CHE test. C.C.S. contributed to
1274 H. Hu et al.
production of the genotyping; S.C and J.L. produced theresequencing data; and R.P., S.U., and C.C.S. analyzed theresequencing data. J. Y. contributed genotypic data forsome maize inbred lines. W.S., S.C, B.M.P., O.A.S., V.R.,A.Z., S.K.N. and V.K. developed maize inducers.
Literature Cited
Abendroth, L. J., R. W. Elmore, M. J. Boyer, and S. K. Marlay,2011 Corn Growth and Development, Iowa State UniversityExtension, Ames, Iowa.
Adler, D., O. Nenadic, and W. Zucchini, 2014 rgl: 3D visualiza-tion device system (OpenGL). R package version 0.93.1098.Available at: http://CRAN.R-project.org/package=rgl. Accessed:January 20, 2016.
Barret, P., M. Brinkmann, and M. Beckert, 2008 A major locusexpressed in the male gametophyte with incomplete penetranceis responsible for in situ gynogenesis in maize. Theor. Appl.Genet. 117: 581–594.
Browning, S. R., and B. L. Browning, 2007 Rapid and accuratehaplotype phasing and missing-data inference for whole-genome association studies by use of localized haplotype clus-tering. Am. J. Hum. Genet. 81: 1084–1097.
Char, S. N., E. Unger-Wallace, B. Frame, S. a. Briggs, M. Main et al.,2015 Heritable site-specific mutagenesis using TALENs inmaize. Plant Biotechnol. J. 13: 1002–1010.
Chen, H., N. Patterson, and D. Reich, 2010 Population differenti-ation as a test for selective sweeps. Genome Res. 20: 393–402.
Chase, S. S., 1969 Monoploids and monoploid-derivatives ofmaize (Zea mays L.). Bot. Rev. 35: 117–167.
Chia, J.-M., C. Song, P. J. Bradbury, D. Costich, N. de Leon et al.,2012 Maize HapMap2 identifies extant variation from a ge-nome in flux. Nat. Genet. 44: 803–807.
Clark, R. M., T. N. Wagler, P. Quijada, and J. Doebley, 2006 Adistant upstream enhancer at the maize domestication gene tb1has pleiotropic effects on plant and inflorescent architecture.Nat. Genet. 38: 594–597.
Clopper, C., and E. S. Pearson, 1934 The use of confidence orfiducial limits illustrated in the case of the binomial. Biometrika26: 404–413.
Coe, E. H., 1959 A line of maize with high haploid frequency. Am.Nat. 93: 381–382.
Cook, J. P., M. D. McMullen, J. B. Holland, F. Tian, P. Bradburyet al., 2012 Genetic architecture of maize kernel compositionin the nested association mapping and inbred association pan-els. Plant Physiol. 158: 824–834.
Dong, X., X. Xu, J. Miao, L. Li, D. Zhang et al., 2013 Fine mappingof qhir1 influencing in vivo haploid induction in maize. Theor.Appl. Genet. 126: 1713–1720.
Fariello, M. I., S. Boitard, H. Naya, M. SanCristobal, and B. Servin,2013 Detecting signatures of selection through haplotype dif-ferentiation among hierarchically structured populations. Ge-netics 193: 929–941.
Ganal, M. W., G. Durstewitz, A. Polley, A. Bérard, E. S. Buckleret al., 2011 A large maize (zea mays L.) SNP genotyping array:development and germplasm genotyping, and genetic mapping tocompare with the B73 reference genome. PLoS One 6: e28334.
Garbe, J. R., and D. Yang, 2008 Pedigraph: A Software Tool for theGraphing and Analysis of Large Complex Pedigree. User ManualVersion 2.4, Department of Animal Science, University of Min-nesota Saint Paul, Minnesota.
Gautier, M., and R. Vitalis, 2012 rehh: an R package to detectfootprints of selection in genome-wide SNP data from haplotypestructure. Bioinformatics 28: 1176–1177.
Hanson, M. A., B. S. Gaut, A. O. Stec, S. I. Fuerstenberg, M. M.Goodman et al., 1996 Evolution of anthocyanin biosynthesisin maize kernels: the role of regulatory and enzymatic loci.Genetics 143: 1395–1407.
Jiao, Y., H. Zhao, L. Ren, W. Song, B. Zeng et al., 2012 Genome-wide genetic changes during modern breeding of maize. Nat.Genet. 44: 812–815.
Lai, J., R. Li, X. Xu, W. Jin, M. Xu et al., 2010 Genome-widepatterns of genetic variation among elite maize inbred lines.Nat. Genet. 42: 1027–1030.
Laird, N., P. Kraft, C. Lange, and K. V. Stehen, 2005 Testing forassociation in genetic studies, pp. 27–46 in Respiratory Genetics,edited by E. Silverman, S. Weiss, S. Shapiro, and D. Lomas. CRCPress, Boca Raton, FL.
Lawrence, C. J., T. E. Seigfried, and V. Brendel, 2005 The maizegenetics and genomics database. The community resource foraccess to diverse maize data. Plant Physiol. 138: 55–58.
Li, L., X. Xu, W. Jin, and S. Chen, 2009 Morphological and mo-lecular evidences for DNA introgression in haploid induction viaa high oil inducer CAUHOI in maize. Planta 230: 367–376.
Liu, K., and S. V. Muse, 2005 PowerMarker: an integrated analy-sis environment for genetic marker analysis. Bioinformatics 21:2128–2129.
Melchinger, A. E., W. Schipprack, T. Würschum, S. Chen, and F.Technow, 2013 Rapid and accurate identification of in vivo-induced haploid seeds based on oil content in maize. Scientificreports. Nature 3: 1–5.
Melchinger, A. E., P. C. Brauner, J. Böhm, and W. Schipprack,2016 In vivo haploid induction in maize: comparison of differ-ent testing regimes for measuring haploid induction rates. CropSci (in press).
Mitchell, A., H.-Y. Chang, L. Daugherty, M. Fraser, S. Hunter et al.,2014 The InterPro protein families database: the classificationresource after 15 years. Nucleic Acids Res. 43: D213–D221.
Paradis, E., J. Claude, and K. Strimmer, 2004 APE: analyses ofphylogenetics and evolution in R language. Bioinformatics 20:289–290.
Prigge, V., X. Xu, L. Li, R. Babu, S. Chen et al., 2012 New insightsinto the genetics of in vivo induction of maternal haploids, thebackbone of doubled. Genetics 190: 781–793.
Purcell, S., B. Neale, K. Todd-Brown, L. Thomas, M. A. Ferreiraet al., 2007 PLINK: a tool set for whole-genome associationand population-based linkage analyses. Am. J. Hum. Genet.81: 559–575.
Qiu, F., Y. Liang, Y. Li, Y. Liu, L. Wang et al., 2014 Morphological,cellular and molecular evidences of chromosome random elim-ination in vivo upon haploid induction in maize. Curr. Plant Biol.1: 83–90.
R Development Core Team, 2013 R: A language and environmentfor statistical computing. R Foundation for Statistical Comput-ing. Vienna. Available at: http://www.R-project.org. Accessed:March 07, 2016.
Röber, F., 1999 Fortpflanzungsbiologische und genetische Unter-suchungen mit RFLPMarkern zur in-vivo-Haploideninduktionbei Mais. Ph.D. Thesis. Universität Hohenheim, Stuttgart, Ger-many.
Rogers, J. S., 1972 Measures of similarity and genetic distance,pp. 145–153 in Studies in Genetics VII. University of Texas Pub-lication, Austin, Texas.
Sabeti, P. C., D. E. Reich, J. M. Higgins, H. Z. P. Levine, D. J.Richter et al., 2002 Detecting recent positive selection inthe human genome from haplotype structure. Nature 419:832–837.
Salvi, S., G. Sponza, M. Morgante, D. Tomes, X. Niu et al.,2007 Conserved noncoding genomic sequences associatedwith a flowering-time quantitative trait locus in maize. Proc.Natl. Acad. Sci. USA 104: 11376–11381.
Communications 1275

Sarkar, K., and E. H. Coe, 1966 A genetic analysis of the origin ofmaternal haploids in maize. Genetics 54: 453–464.
Schnable, P. S., D. Ware, R. S. Fulton, J. C. Stein, F. Wei et al.,2009 The B73 maize genome: complexity, diversity, and dy-namics. Science 326: 1112–1115.
Svitashev, S., J. Young, C. Schwartz, H. Gao, S. C. Falco et al.,2015 Targeted mutagenesis, precise gene editing and site-specific gene insertion in maize using Cas9 and guide RNA.Plant Physiol. 169: 931–945.
Tang, K., K. R. Thornton, and M. Stoneking, 2007 A newapproach for using genome scans to detect recent positiveselection in the human genome. PLoS Biol. 5: 1587–1602.
UniProt Consortium, 2014 UniProt: a hub for protein information.Nucleic Acids Res. 43: D204–D212.
Unterseer, S., E. Bauer, G. Haberer, M. Seidel, C. Knaak et al.,2014 A powerful tool for genome analysis in maize: develop-ment and evaluation of the high density 600 k SNP genotypingarray. BMC Genomics 15: 823.
Vitti, J. J., S. R. Grossman, and P. C. Sabeti, 2013 Detecting nat-ural selection in genomic data. Annu. Rev. Genet. 47: 97–120.
Voight, B. F., S. Kudaravalli, X. Wen, and J. K. Pritchard, 2006 Amap of recent positive selection in the human genome. PLoSBiol. 4: 0446–0458.
Wellcome Trust Case Control Consortium, 2007 Genome-wide association study of 14,000 cases of seven com-mon diseases and 3,000 shared controls. Nature 447:661–678.
Xu, X., L. Li, X. Dong, W. Jin, A. E. Melchinger et al.,2013 Gametophytic and zygotic selection leads to segregationdistortion through in vivo induction of a maternal haploid inmaize. J. Exp. Bot. 64: 1083–1096.
Yang, X., S. Gao, S. Xu, Z. Zhang, B. M. Prasanna et al.,2011 Characterization of a global germplasm collection andits potential utilization for analysis of complex quantitative traitsin maize. Mol. Breed. 28: 511–526.
Zuo, W., Q. Chao, N. Zhang, J. Ye, G. Tan et al., 2015 A maizewall-associated kinase confers quantitative resistance to headsmut. Nat. Genet. 47: 151–157.
Communicating editor: A. H. Paterson
1276 H. Hu et al.

GENETICSSupporting Information
www.genetics.org/lookup/suppl/doi:10.1534/genetics.115.184234/-/DC1
The Genetic Basis of Haploid Induction in MaizeIdentified with a Novel Genome-Wide
Association MethodHaixiao Hu, Tobias A. Schrag, Regina Peis, Sandra Unterseer, Wolfgang Schipprack,Shaojiang Chen, Jinsheng Lai, Jianbing Yan, Boddupalli M. Prasanna, Sudha K. Nair,
Vijay Chaikam, Valeriu Rotarenco, Olga A. Shatskaya, Alexandra Zavalishina, Stefan Scholten,Chris-Carolin Schön and Albrecht E. Melchinger
Copyright © 2016 by the Genetics Society of AmericaDOI: 10.1534/genetics.115.184234

-0.2 -0.1 0.0 0.1 0.2
-0.3
-0.2
-0.1
0.0
0.1
PC1(9.7%)
PC
2(5.
8%)
-0.2 -0.1 0.0 0.1
-0.1
0.0
0.1
0.2
PC1(9.9%)P
C2(
4.1%
)
-0.1 0.0 0.1 0.2 0.3
-0.2
-0.1
0.0
0.1
0.2
PC1(7.7%)
PC
2(3.
7%)
-0.2 -0.1 0.0 0.1 0.2
-0.1
0.0
0.1
0.2
PC1(13.7%)
PC
2(5.
9%)
-0.3 -0.2 -0.1 0.0 0.1
-0.3
-0.2
-0.1
0.0
0.1
PC1(7.5%)
PC
2(2%
)
-0.2 -0.1 0.0 0.1 0.2
-0.2
-0.1
0.0
0.1
0.2
PC1(14.4%)P
C2(
6.9%
)
-0.1 0.0 0.1 0.2
-0.2
-0.1
0.0
0.1
0.2
PC1(11.9%)
PC
2(7.
8%)
EUD(N=399) (N=408)
EUF(N=193)
NSS
(N=123)SS
(N=299)TST (N=33)
DCN
(N=27)MIS
Non-inducers (controls) present in respective germplasm group
Legend:
Inducers (cases)
Figure S1 Genetic structure revealed by the first two principal components (PC) obtained from PCA with 29,533 SNP for 53 inducers against all lines from the respective germplasm group of 1,482 non-inducers analyzed in this study.
ACR Stock6 PEM Non-inducers ZM
ACIR
BHO
PEM48II ZMS
KEMS ZMK1
UH400 UH401
Brown-marker
CAUHOI
CAU079 CAU5UH403
W23ig
WS14
RWSRWK UKW
CML451 CML494
IN012a IN012b
Unknown2
MS1334FIGH1
HOS
Unknown1
HZI1-1 HZI1-2Unknown3
HZI10HZI12
IN003
IN004
IN0604aIN0604c
IN0605a IN0605bIN0703 IN0803IN0805a IN0805b IN0805c
KMS
MHI
LfL5010 LfL5016 LfL5017
PHI-1 PHI-2 PHI-3 PHI-4
PK6
TAIL5
TAIL7 TAIL8 TAIL9
ZMK1F3ZMK1U
ZMS8
Figure S2 Pedigree of the worldwide collection of maize haploid inducers analyzed in this study.
Inducers Known or unknown non-inducer parents

Figure S3 Genome-wide scans for molecular markers or selective sweeps associated with in vivo haploid induction (HI). Case-control association analysis: (A) Manhattan plot, (B) Q-Q plot. Manhattan plot for selective sweeps withthe (C) iHS score, (D) Rsb score, (E) hapFLK score and (F) XP-CLR score. For (A), (C), (D) and (E), P values are shown on a log10 scale. P values were colored in red in (C), (D) and (E) if significant with FDR < 0.01.
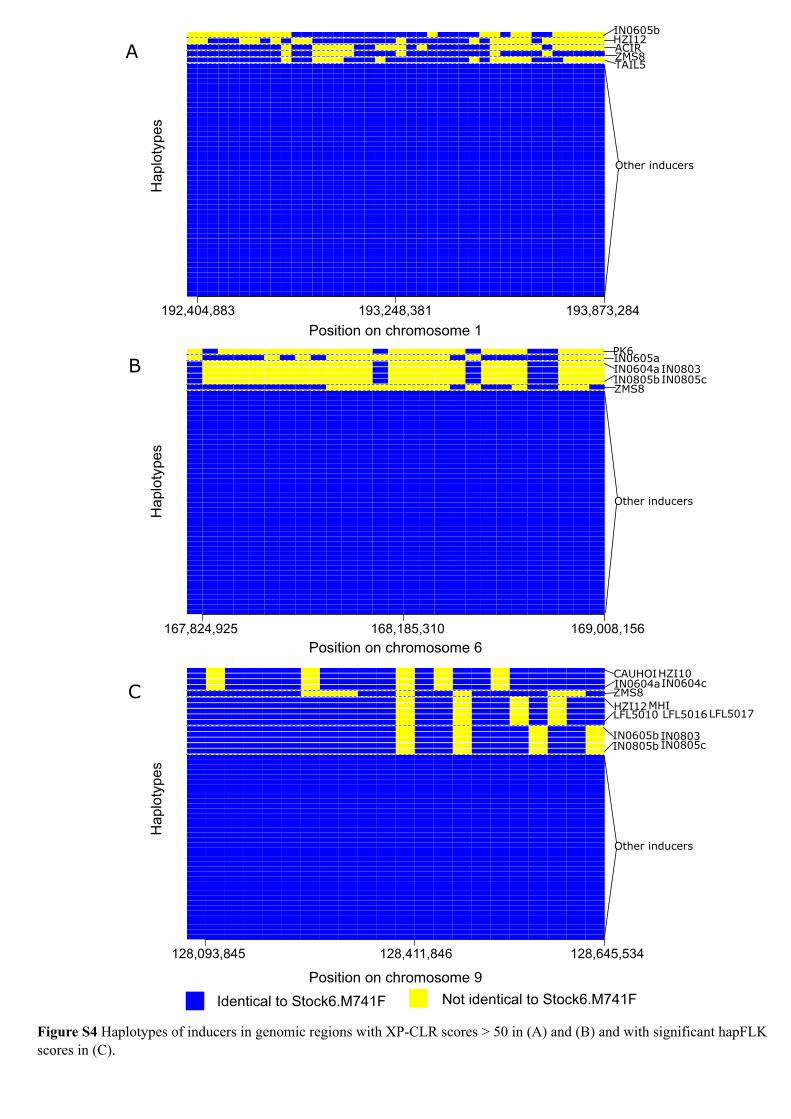
Figure S4 Haplotypes of inducers in genomic regions with XP-CLR scores > 50 in (A) and (B) and with significant hapFLK scores in (C).
Identical to Stock6.M741F Not identical to Stock6.M741F
192,404,883 193,248,381 193,873,284
Position on chromosome 1
Hap
loty
pes
AIN0605bHZI12
ZMS8ACIR
TAIL5
Other inducers
167,824,925 168,185,310 169,008,156
Position on chromosome 6
Hap
loty
pes
B IN0803IN0805bIN0604aIN0605aPK6
IN0805cZMS8
Other inducers
128,093,845 128,411,846 128,645,534
Position on chromosome 9
Hap
loty
pes
C IN0604c
IN0805b
IN0604aHZI10CAUHOI
IN0805c
ZMS8HZI12LFL5010 LFL5016LFL5017
MHI
IN0605b IN0803
Other inducers

(N=1071)(N=186)
unknown
HOSW23
ZMK1F3
F168
Stock6.M741H
Stock6.M741C
Stock6.M741F
Tx303
Mo1W
IN0803
IN0604a
CAUHOI
MHI
TAIL5
IN0703
RWS
UKW
IN0805a
UH400
ZMS8
KMS
ACIR
Stock6.ROM
Stock6.M741H
Stock6.M741C
Stock6.M741F
85.2
87.8
89.2
93.5
95.1
96.2
97.8
98.8
100.
6
104.
3
106.
5
108.
1
109.
5
110.
7
112.
5
113.
8
114.
9
116.
1
118.
5
119.
4
46 50 60 70 80 90 97
Genetic map (cM)
Physical map (Mb)
qhir11 qhir12
Figure S5 Graphical genotypes of 17 maize haploid inducers and non-inducers of Mo1W and Tx303 in the combined support interval of QTL qhir1 (qhir1-CSI) based on marker data of the 600k chip. (A) Physical and genetic maps. (B) Graphical genotypes indicating the origin of genomic fragments of inducers from their founders.
A
B

Figure S6 Illustration of the conditional haplotype extension (CHE) method.
Genotype 5 4 3 2 1 1 2 3 4 5
1 … 0 0 0 0 0 0 0 0 0 0 0 …
2 … 0 0 0 0 0 0 0 0 0 0 0 …
3 … 0 0 0 0 0 0 0 0 0 0 0 …
4 … 0 0 0 0 0 0 0 0 0 0 0 …
5 … 0 0 0 0 0 0 0 0 0 0 0 …
6 … 0 0 0 0 0 0 0 0 0 0 0 …
7 … 1 1 0 0 0 0 0 0 0 0 1 …
8 … 1 1 1 0 0 0 0 0 0 0 1 …
9 … 1 1 1 0 0 0 0 0 0 1 1 …
10 … 1 1 1 1 0 0 0 0 0 1 1 …
Markers on the left side
threshold t = 0.8
CHE score of marker m
step 1
step 2
step 3
step 4
step 5
m+5m+4m+3m+2m+1m-5 m-4 m-3 m-2 m-1
0 16151211 1413101 2 3 4 5 6 7 8 9
mMarkers
Physical position
1.0
0.9
0.9
0.8
0.6
Frequency of the major haplotype
Markers on the right sidemarker m
(10kb)

Table S1 Information about the 53 inducers analyzed in this study.
Namea Country Sourceb Pedigreec Typed CRe HETf HIRg Referenceh
Stock6.M741B US MGCSC Unknown − 0.997 0.002 2.3 Coe
Stock6.M741C* US MGCSC Unknown − 0.995 0.000 2.3 Coe
Stock6.M741F* US MGCSC Unknown − 0.992 0.003 2.3 Coe
Stock6.M741H* US MGCSC Unknown − 0.991 0.025 2.3 Coe ; Eder & Chalyk
Stock6.M741I US MGCSC Unknown − 0.993 0.000 2.3 Coe
Stock6.HOH US UHOH Unknown − 0.992 0.008 2.3 Coe
Stock6.INRA US INRA Unknown − 0.994 0.001 2.3 Coe
Stock6.ROM* US USAMV Unknown − 0.995 0.007 2.3 Coe
ACIR* IN IARI (Stock6×ACR)×Stock6 3 0.986 0.007 3 Sarkar
CAU079 CN CAU CAUHOI×UH400 5 0.992 0.001 6 Xu et al.
CAU5 CN CAU CAUHOI×UH400 5 0.991 0.003 8 Xu et al.
CAUHOI* CN CAU BHO×Stock6 4 0.988 0.001 3 Prigge et al.
HZI1.1 CN HZAU Synthetic including Stock6 4 0.992 0.005 6-8 FQ
HZI1.2 CN HZAU Synthetic including Stock6 4 0.990 0.008 4-6 FQ
HZI10 CN HZAU Synthetic including CAUHOI 4 0.986 0.021 6-8 FQ
HZI12 CN HZAU Synthetic including CAUHOI 4 0.982 0.030 5-6 FQ
IN003 DE UHOH (UH400×CAUHOI)×UH400 5 0.994 0.001 9 WS
IN004 DE UHOH UH400×UKW 5 0.993 0.002 9 WS
IN012a DE UHOH UH400×RWS 5 0.992 0.014 10 WS
IN012b DE UHOH UH400×RWS 5 0.987 0.011 11 WS
IN0604a* DE UHOH (UH400×CAUHOI)×HOS 1 0.986 0.002 10 WS
IN0604c DE UHOH (UH400×CAUHOI)×HOS 1 0.951 0.006 3 WS

Namea Country Sourceb Pedigreec Typed CRe HETf HIRg Referenceh
IN0605a DE UHOH ((UH400×RWS)×HOS)×UH400 3 0.981 0.001 6 WS
IN0605b DE UHOH ((UH400×RWS)×HOS)×UH400 3 0.986 0.001 8 WS
IN0703* DE UHOH ((UH400×CAUHOI)×HOS)×RWS 3 0.993 0.002 11 WS
IN0803* DE UHOH ((UH400×RWS)×HOS)×(UH400×HOS) 2 0.985 0.006 5 WS
IN0805a* DE UHOH ((UH400×CAUHOI)×HOS)×((UH400×RWS)×HOS) 2 0.981 0.008 4 WS
IN0805b DE UHOH ((UH400×CAUHOI)×HOS)×((UH400×RWS)×HOS) 2 0.972 0.011 3 WS
IN0805c DE UHOH ((UH400×CAUHOI)×HOS)×((UH400×RWS)×HOS) 2 0.892 0.015 3 WS
LfL5010 DE LfL MHI×RWS 5 0.995 0.005 17 JE
LfL5016 DE LfL MHI×RWS 5 0.997 0.001 10 JE
LfL5017 DE LfL MHI×RWS 5 0.997 0.004 17 JE
MHI* MD IG KMS×ZMS 5 0.910 0.005 7-9 Chalyk
PHI.1 RO USAMV MHI×Stock6 5 0.989 0.029 11-12 Rotarenco et al.
PHI.2 RO USAMV MHI×Stock6 5 0.986 0.020 12-15 Rotarenco et al.
PHI.3 RO USAMV MHI×Stock6 5 0.983 0.019 14-15 Rotarenco et al.
PHI.4 RO USAMV MHI×Stock6 5 0.995 0.000 10-16 Rotarenco et al.
PK6 FR INRA Synthetic of Stock6, WS14, FIGH1 and MS1334 4 0.991 0.001 6 Barret et al.
RWK DE UHOH KEMS×WS14 5 0.996 0.000 9-10 Geiger
RWS* DE UHOH KEMS×WS14 5 0.998 0.000 8 Röber et al.
TAIL5* MX CIMMYT (CML451×(RWS×RWK))×(RWS×RWK) 3 0.990 0.018 5 Prigge et al.
TAIL7 MX CIMMYT (CML494×(RWS×RWK))×(RWS×RWK) 3 0.992 0.003 11 Prigge et al.
TAIL8 MX CIMMYT (CML494×(RWS×RWK))×(RWS×RWK) 3 0.988 0.022 11 Prigge et al.
TAIL9 MX CIMMYT (CML494×(RWS×UH400))×(RWS×UH400) 3 0.978 0.028 10 Prigge et al.
UH400* DE UHOH KEMS 4 0.998 0.000 8 Prigge et al.
UH401 DE UHOH KEMS 4 0.985 0.000 8 WS

Namea Country Sourceb Pedigreec Typed CRe HETf HIRg Referenceh
UH403 DE UHOH UH400×CAUHOI 5 0.994 0.014 9 WS
UKW* DE UHOH KEMS×WS14 5 0.976 0.006 11 WS
WS14 FR INRA Stock6×W23ig 1 0.991 0.002 3-5 Lashermes & Beckert
ZMK1F3 RU KLARI Zarodishevy marker krasnodar (ZMK1) synthetic 4 0.963 0.039 5-8 Shatskaya
ZMK1U RU KLARI ZMK1 synthetic 4 0.953 0.082 3-10 Zabirova et al.
KMS* RU SSU Brown Marker × Stock6 1 0.964 0.009 2-4 AZ
ZMS8* RU SSU ZM × KMS 1 0.758 0.040 8-10 Zavalishina et al.aName: *indicates lines genotyped with the 600k chip
bSource:
CAU = China Agricultural University, Beijing, China
CIMMYT = International Maize and Wheat Improvement Center, Mexico
HZAU = Huazhong Agricultural University, Wuhan, China
IARI = Indian Agricultural Research Institute, India
IG = Institute of Genetics, Kishinev, Moldova
INRA = The National Institute for Agricultural Research, France
KLARI = Krasnodar Lukyanenko Agricultural Research Institute, Russia
LfL = Bayerische Landesanstalt für Landwirtschaft, Freising, Germany
MGCSC = Maize Genetics Cooperation Stock Center, Illinois, United States
of America
SSU = Saratov State University, Russia
UHOH = University of Hohenheim, Stuttgart, Germany
USAMV = University of Agronomic Science and Veterinary Medicine,
Bucharest, Romania cPedigree:
BHO = Beijing High Oil Synthetic
HOS = Hohenheim High Oil Synthetic
KEMS = Krasnodar Embryo Marker Synthetic dType of source population:
1= N×I, in which I=inducer and N=non-inducer
2 = (I×N)× (I×N)
3 = (I×N)×I
4 = Synthetic
5 = I ×I
eCall rate fHeterozygosity gHaploid induction rate according to literature or personal communication hReference:
FQ = F. Qiu, personal communication 2013
JE = J. Eder, personal communication 2013
WS = W. Schipprack, personal communication 2013
AZ = Alexandra Zavalishina, personal communication 2014

H. Hu et al. 21 SI
Table S2 Information about the 310 non-inducer lines included in the core set analyzed in this study.
Line name Heterotic group Sourcea Referenceb A188 NSS Cook et al. Gerdes et al. A554 SS Cook et al. BT A619 NSS Yang et al. MBS Inc. A654 SS Cook et al. MB Ab28A SS Cook et al. MB B10 SS Cook et al. Gerdes et al. B103 NSS Cook et al. Romay et al. B104 SS UHOH Romay et al. B107 EUD UHOH TAS B114 NSS Yang et al. Gerdes et al. B164 SS Cook et al. Romay et al. B2 NSS Cook et al. MB B47 SS Ganal et al. Romay et al. B52 NSS Cook et al. Nelson B73Htrhm EUD Cook et al. TAS BUGA.084 EUF UHOH TAS By809 NSS Yang et al. SC By843 NSS Yang et al. SC C8605 SS Yang et al. SZ Carg_2369 SS UHOH TAS CH27_17 EUF UHOH TAS CH28_2 EUF UHOH TAS Chang3 DCN Yang et al. SZ Chang7.2 DCN Yang et al. SZ chuan48.2 DCN Yang et al. SZ CI31A NSS Cook et al. MB CI7 NSS Yang et al. Gerdes et al. CIMBL1 TST Yang et al. Yang et al. CIMBL100 TST Yang et al. Yang et al. CIMBL106 TST Yang et al. Yang et al. CIMBL108 TST Yang et al. Yang et al. CIMBL11 TST Yang et al. Yang et al. CIMBL117 TST Yang et al. Yang et al. CIMBL122 TST Yang et al. Yang et al. CIMBL123 TST Yang et al. Yang et al. CIMBL157 TST Yang et al. Yang et al. CIMBL18 TST Yang et al. Yang et al. CIMBL24 TST Yang et al. Yang et al. CIMBL29 TST Yang et al. Yang et al. CIMBL38 TST Yang et al. Yang et al. CIMBL48 TST Yang et al. Yang et al. CIMBL63 TST Yang et al. Yang et al. CIMBL70 TST Yang et al. Yang et al. CIMBL81 TST Yang et al. Yang et al. CIMBL89 TST Yang et al. Yang et al. CIMBL90 TST Yang et al. Yang et al. CM.GER.MPS1.P2 TST UHOH TAS

Line name Heterotic group Sourcea Referenceb CM.GER.MPS1.P24 TST UHOH TAS CM.GER.MPS1.P25 TST UHOH TAS CM.GER.MPS1.P29 TST UHOH TAS CM.GER.MPS1.P30 TST UHOH TAS CM.GER.MPS1.P31 TST UHOH TAS CM174 SS Cook et al. MBS Inc. CML103 TST Cook et al. Flint-Garcia et al. CML139 TST Yang et al. Yang et al. CML154Q TST Cook et al. Flint-Garcia et al. CML162 TST Yang et al. Yang et al. CML220 TST Cook et al. Flint-Garcia et al. CML258 TST Cook et al. Flint-Garcia et al. CML261 TST Cook et al. Flint-Garcia et al. CML264 TST Cook et al. Flint-Garcia et al. CML314 TST Cook et al. TAS CML32 TST Yang et al. Yang et al.
CML361 TST Yang et al. Yang et al. CML431 TST Yang et al. Yang et al. CML451 TST Yang et al. Yang et al. CML471 TST Yang et al. Yang et al. CML494 TST UHOH TAS CMlL69 TST Ganal et al. Ganal et al. CORU.002 EUF UHOH TAS CZL0618 TST UHOH TAS D01 EUD UHOH TAS D06 EUD UHOH TAS D102 EUF UHOH TAS D118 EUF UHOH TAS D147 EUF UHOH TAS D199 EUF UHOH TAS D21 EUD UHOH TAS D51 EUD UHOH TAS Dan340 DCN Yang et al. SZ Dan4245 DCN Yang et al. TW Dan598 DCN Yang et al. SZ Dan599 NSS Yang et al. SZ Dong237 DCN Yang et al. SZ Dong46 DCN Yang et al. SZ EC218 EUF UHOH TAS EC326A EUD UHOH TAS EC334 EUD UHOH TAS EP1 EUF Cook et al. Strigens et al. EP2 EUD UHOH TAS EP55 EUD UHOH TAS EP64 EUF UHOH TAS EP65 EUF UHOH TAS ES40 SS Yang et al. SZ F045 EUF UHOH TAS

Line name Heterotic group Sourcea Referenceb F054 EUF UHOH TAS F056 EUF UHOH TAS F070 EUF UHOH TAS F073 EUF UHOH TAS F091 EUF UHOH TAS F105 EUF UHOH TAS F109 EUF UHOH TAS F132 EUF UHOH TAS F138 EUF UHOH TAS F142 EUF UHOH TAS F150 EUF UHOH TAS F151 EUF UHOH TAS F359 EUF UHOH TAS F373 EUF UHOH TAS F47 EUF UHOH TAS F7028 EUD UHOH TAS F7059 EUD UHOH TAS F759 EUF UHOH TAS F888 EUD UHOH TAS F912 EUD UHOH TAS F924 EUD UHOH TAS F98902 EUD UHOH TAS FAPW SS Ganal et al. Romay et al. FBHJ SS Ganal et al. Romay et al. FC13 EUF Ganal et al. WS Florida.56 MIS Ganal et al. Romay et al. FV18 EUF UHOH TAS FV181 EUD UHOH TAS FV324 EUF UHOH TAS FV331 EUD Ganal et al. WS Gy1007 NSS Yang et al. SC H105W SS Cook et al. Romay et al. H84 SS Cook et al. Romay et al. H95 NSS Cook et al. Romay et al. HP301 MIS Cook et al. Romay et al. HTH.17 NSS Yang et al. SZ Hu803 SS Yang et al. SZ Hua83.2 SS Yang et al. SZ HuangC SS Yang et al. SZ Hy SS Cook et al. MB HYS DCN Yang et al. SZ HZS DCN Yang et al. SZ I29 MIS Cook et al. Cook et al. IA2132 MIS Cook et al. Romay et al. IA5125 MIS Cook et al. Romay et al. IB02 NSS Ganal et al. Romay et al. IBB14 SS UHOH Romay et al. IDS28 MIS Cook et al. Romay et al.

Line name Heterotic group Sourcea Referenceb IDS69 MIS Cook et al. Romay et al. IDS91 MIS Cook et al. Romay et al. IL101 MIS Cook et al. Romay et al. IL14H MIS Cook et al. Romay et al. IL677A MIS Cook et al. Romay et al. Indiana4722 MIS Cook et al. Gerdes et al. Ji53 DCN Yang et al. SZ Ji63 DCN Yang et al. SZ Ji853 DCN Yang et al. SZ Jiao51 NSS Yang et al. TW Jing24 DCN Yang et al. SZ K10 SS Yang et al. HL K12 DCN Yang et al. SZ Ki3 TST Cook et al. Romay et al. L011 EUF UHOH TAS L032 EUF UHOH TAS L050 EUF UHOH TAS L139_Lif NSS UHOH Romay et al. L317 NSS Cook et al. Gerdes et al. LH1 SS Ganal et al. Romay et al. LH145 SS Ganal et al. Romay et al. LH146Ht SS UHOH Romay et al. LH149 SS Ganal et al. Romay et al. LH162 NSS UHOH MBS Inc. LH196 SS UHOH Romay et al. LH202 SS UHOH MBS Inc. LH220Ht SS UHOH Romay et al. LH38 NSS Ganal et al. Romay et al. LH57 NSS Ganal et al. Romay et al. LH74 SS Ganal et al. Romay et al. LP1.CMS.HT SS Ganal et al. Romay et al. Lv28 DCN Yang et al. SZ Lx9801 DCN Yang et al. SZ M14 NSS Cook et al. Gerdes et al. MO113 NSS Yang et al. SZ Mo15W EUD UHOH TAS Mo17 NSS Yang et al. SZ Mo1W EUD Cook et al. TAS Mo44 NSS Cook et al. Gerdes et al. MONE.112 EUF UHOH TAS MS153 SS Cook et al. Gerdes et al. Nan21.3 DCN Yang et al. SZ NC236 NSS Cook et al. MG NC250 SS Cook et al. MBS Inc. NC258 NSS Cook et al. MBS Inc. NC260 NSS Cook et al. Romay et al. NC290A NSS Cook et al. MG NC296 TST Cook et al. MG
Line name Heterotic group Sourcea Referenceb NC302 TST Cook et al. MG NC314 SS Cook et al. Gerdes et al. NC33 NSS Cook et al. MG NC342 NSS Cook et al. MG NC352 TST Cook et al. MG ND2006 SS UHOH MC ND2014 SS UHOH MC ND33 EUF UHOH TAS NK764 EUD UHOH TAS NKH8431 EUD UHOH TAS Os420 SS Cook et al. Romay et al. OURD.001 EUF UHOH TAS P024 EUD UHOH TAS P036 EUD UHOH TAS P042 EUD UHOH TAS P045 EUD UHOH TAS P047 EUD UHOH TAS P070 EUD UHOH TAS P072 EUD UHOH TAS P093 EUD UHOH TAS P094 EUD UHOH TAS P095 EUD UHOH TAS P096 EUD UHOH TAS P097 EUD UHOH TAS P106 EUD UHOH TAS P113 EUD UHOH TAS P115 EUD UHOH TAS P178 NSS Yang et al. SZ P182 EUD UHOH TAS P204 EUD UHOH TAS P210 EUD UHOH TAS P299 EUD UHOH TAS P39 MIS Cook et al. Romay et al. P737M20 MIS Ganal et al. Romay et al. Pa875 SS Cook et al. Romay et al. PB18 EUF UHOH TAS PB261 EUF UHOH TAS PB268 EUF UHOH TAS PB57 EUF UHOH TAS PHB09 EUD UHOH TAS PHG50 NSS Ganal et al. Romay et al. PHG83 NSS UHOH Romay et al. PHJ40 SS Ganal et al. Mikel et al. 2006 PHN29 SS UHOH Romay et al. PHN47 NSS Ganal et al. MB PHV63 NSS Ganal et al. Romay et al. PHW17 SS Ganal et al. Romay et al. PLS14 EUF Ganal et al. WS

Line name Heterotic group Sourcea Referenceb PLS42 EUF Ganal et al. WS PP147 EUD UHOH TAS PP85 EUF UHOH TAS Q1261 DCN Yang et al. SZ Q381 EUD UHOH TAS Qi205 SS Yang et al. SZ Qi319 NSS Yang et al. SZ R229 SS Cook et al. Gerdes et al. RZ07 EUD UHOH TAS S036 EUD UHOH TAS S044 EUD UHOH TAS S046 EUD UHOH TAS S069 EUD UHOH TAS S22 NSS Yang et al. TW S37 TST Yang et al. SZ SA24 MIS Cook et al. Romay et al. SATU.245 EUF UHOH TAS SDp254 EUD UHOH TAS Sg1533 MIS Cook et al. Romay et al. SG18 MIS Cook et al. Romay et al. Shen137 NSS Yang et al. SZ Si444 DCN Yang et al. SZ Si446 DCN Yang et al. SZ STGA.151 EUF UHOH TAS SW92E114 TST Yang et al. SZ Sy1032 NSS Yang et al. SZ Sy1035 NSS Yang et al. SZ Tian77 DCN Yang et al. TW TIP.454.2 MIS Ganal et al. Ganal et al. TIP.458.2 MIS Ganal et al. Ganal et al. TIP.466.2 MIS Ganal et al. Ganal et al. TIP.485.2 MIS Ganal et al. Ganal et al. TIP.498.2 MIS Ganal et al. Ganal et al. TIP.503.2 MIS Ganal et al. Ganal et al. TIP.512.2 MIS Ganal et al. Ganal et al. TIP.521.2 MIS Ganal et al. Ganal et al. TIP.523.2 MIS Ganal et al. Ganal et al. TIP.534.2 MIS Ganal et al. Ganal et al. TT16 DCN Yang et al. TW TX601 TST Cook et al. Romay et al. TZI9 TST Cook et al. Romay et al. VACQ.053 EUF UHOH TAS VACQ.065 EUF UHOH TAS VIEY.001 EUF UHOH TAS W117HT NSS Cook et al. Gerdes et al. W138 DCN Yang et al. SZ W182B NSS Cook et al. Gerdes et al. W612S NSS UHOH Gerdes et al.

Line name Heterotic group Sourcea Referenceb WD NSS Cook et al. BT WF9 SS Cook et al. Romay et al. WH413 DCN Yang et al. SZ X18.599 NSS Yang et al. TW X2MA22 NSS Ganal et al. Romay et al. X3H.2 DCN Yang et al. SZ X5237 DCN Yang et al. TW X7327 NSS Yang et al. TW X78002A SS Ganal et al. Romay et al. X812 SS Yang et al. SZ X8902 SS Yang et al. SZ Xi502 DCN Yang et al. SZ XZ698 NSS Yang et al. SZ Yan414 DCN Yang et al. SZ Ye515 DCN Yang et al. SZ Yu374 DCN Yang et al. SZ ZaC546 NSS Yang et al. SZ ZH68 SS Yang et al. SZ Zheng22 DCN Yang et al. HL Zheng29 SS Yang et al. SZ Zheng32 DCN Yang et al. SZ Zheng35 SS Yang et al. SZ Zheng58 SS Yang et al. HL
aSource of MaizeSNP50 marker data bReference of heterotic group of respective line:
BT = Bill Tracy, personal communication 2013
HL = Haochuan Li, personal communication 2013
MB = Michael Blanco, personal communication 2013
MC = Marcelo Carena, personal communication 2013
MG = Major Goodman, personal communication 2013
SC = Shaojiang Chen, personal communication 2013
SZ = Blog of Shihuang Zhang (http://chinamaize.blog.sohu.com/140461157.html)
TAS = Tobias Schrag, personal communication 2013
TW = Tianyu Wang, personal communication 2013
WS = W. Schipprack, personal communication 2013

Table S3 Estimated HI rate by crossing of various maize inbreds (inducers and non-inducers) to a ligueless
(lg2) tester and phenotyping the testcross progeny for ligueless phenotype and verifying their ploidy status
by flow cytometry analysis and phenotyping in the field.
Type/Line name Sowed seeds Germinated plants Germination rate (%) Haploids Rate of HI (%)
Inducers
UH400 770 641 83.25 49 7.64
UH402 770 676 87.79 64 9.47
UH600 770 640 83.12 66 10.31
UH601 770 700 90.91 37 5.29
UH602 770 682 88.57 42 6.16
Non-inducers
Tx303 849 766 90.22 5 0.65
Mo1W 1155 1095 94.81 0 0.00
1107 948 903 95.25 0 0.00
5267 528 478 90.53 0 0.00
5172 1155 1101 95.32 2 0.18
L012 1155 1113 96.36 5 0.45
L015 1155 1100 95.24 5 0.45
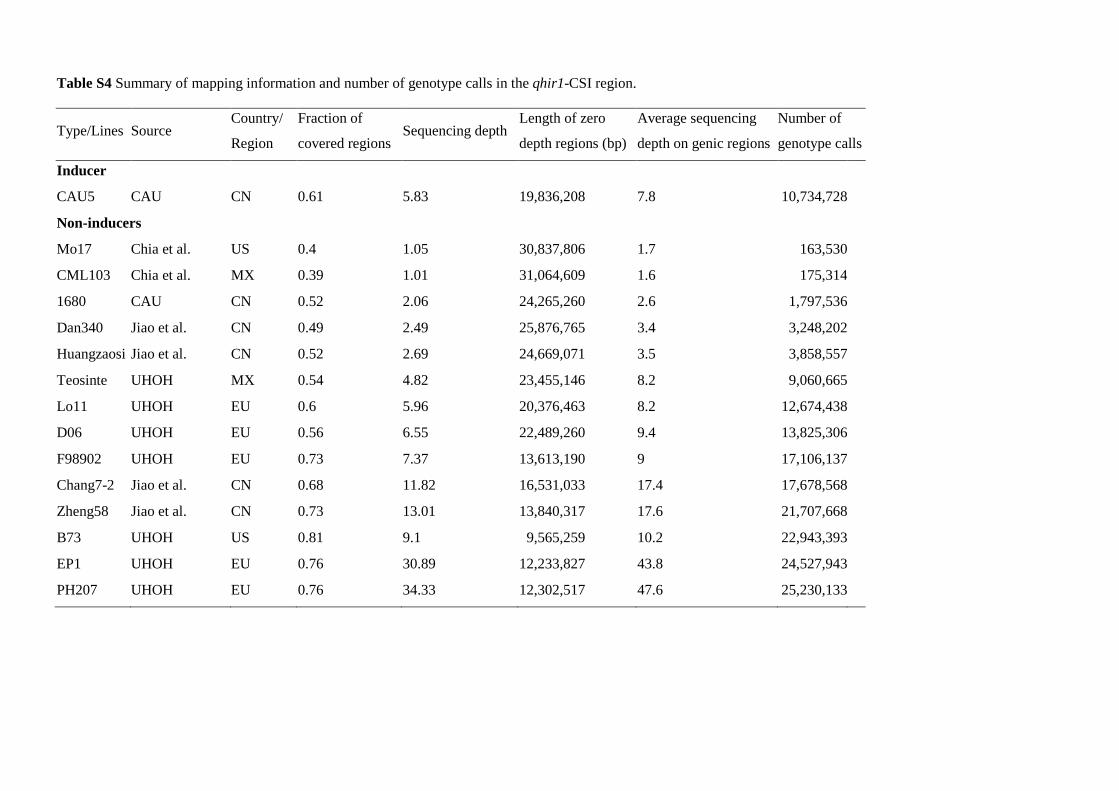
Table S4 Summary of mapping information and number of genotype calls in the qhir1-CSI region.
Type/Lines Source Country/
Region
Fraction of
covered regionsSequencing depth
Length of zero
depth regions (bp)
Average sequencing
depth on genic regions
Number of
genotype calls
Inducer
CAU5 CAU CN 0.61 5.83 19,836,208 7.8 10,734,728
Non-inducers
Mo17 Chia et al. US 0.4 1.05 30,837,806 1.7 163,530
CML103 Chia et al. MX 0.39 1.01 31,064,609 1.6 175,314
1680 CAU CN 0.52 2.06 24,265,260 2.6 1,797,536
Dan340 Jiao et al. CN 0.49 2.49 25,876,765 3.4 3,248,202
Huangzaosi Jiao et al. CN 0.52 2.69 24,669,071 3.5 3,858,557
Teosinte UHOH MX 0.54 4.82 23,455,146 8.2 9,060,665
Lo11 UHOH EU 0.6 5.96 20,376,463 8.2 12,674,438
D06 UHOH EU 0.56 6.55 22,489,260 9.4 13,825,306
F98902 UHOH EU 0.73 7.37 13,613,190 9 17,106,137
Chang7-2 Jiao et al. CN 0.68 11.82 16,531,033 17.4 17,678,568
Zheng58 Jiao et al. CN 0.73 13.01 13,840,317 17.6 21,707,668
B73 UHOH US 0.81 9.1 9,565,259 10.2 22,943,393
EP1 UHOH EU 0.76 30.89 12,233,827 43.8 24,527,943
PH207 UHOH EU 0.76 34.33 12,302,517 47.6 25,230,133

Table S5 Genetic changes revealed by sequence comparison between CAU5 and 14 non-inducers in the
qhir11 and qhir12 region.
ID Region Genetic changesa Reference allele/sequence CAU5 allele/sequence Gene qhir11 region 1 68113989 1 C T GRMZM2G382717 2 68133550-
68133553 2 TTTA - GRMZM2G120587
3 68237718 1 C T GRMZM2G703616 4 68241406-
68241413 2 GCATGCAT - GRMZM2G471240
5 68437173-68437174
3 - AACCCC GRMZM2G003530
6 68444236 1 G T GRMZM2G301743 7 68561973 1 C A GRMZM2G077897 8 68563560 1 G T GRMZM2G077897 9 68563604 1 C G GRMZM2G077897 qhir12 region 10 71794984-
71794985 3 - CCGCCTCCGCCTCC
GCCT GRMZM2G035557
11 72012420 1 G C GRMZM5G835433 12 72012529 1 G A GRMZM2G313009 13 72041330-
72041331 3 - TCCATTTCCATC GRMZM2G313104
14 72192659 1 C T AC210719.3 15 72234480-
72234481 3 - TGCTCTCCCATCCC
CATCC GRMZM2G135834
16 72235167-72235168
3 - GGCGGCGGC GRMZM2G135834
17 72402957 1 C G GRMZM5G837210 18 72411336 1 T A GRMZM2G060617 19 72618114-
72618115 3 - ACGGTGGTC GRMZM2G137502
20 72703124-72703136
4 CAAATATTGTTTG GAAATGTTTGCCA GRMZM2G096682
21 72796140 1 T C AC177908.3 22 72796440 1 G A AC177908.3 23 72883524 1 C T GRMZM2G351259 25 72884024 1 A T GRMZM2G351259 26 72884346 1 A G GRMZM2G351259 24 72884006-
72884024 4 CGCGCCTGCGCCGCCG
CCA TGCGCCT GRMZM2G351259,
GRMZM2G051224 27 72938407 1 A T GRMZM2G568442 28 73101227-
73101228 3 - CTTTGTA AC212231.3_FG003
29 73102017- 2 GGAATATATACTGTTA - AC212231.3_FG003

ID Region Genetic changesa Reference allele/sequence CAU5 allele/sequence Gene 73102071 TATATATTACGACGTA
CGTACGTGTAATATATACTGTAC
30 73232428-73232433
2 ACAGTG - GRMZM2G117930
31 73233044 1 G T GRMZM2G552697 32 73344674 1 A T GRMZM2G496269 33 73379506-
73379507 3 - GTGGT GRMZM2G172244
34 73512009-73512012
2 TCTC - GRMZM2G067371
35 73967088-73967089
3 - ACGACAGG GRMZM2G125241
36 73967552-73967553
3 - ACGCCG GRMZM2G125241
37 74264018-74264022
2 ACAGA - GRMZM2G036629
38 74274773-74274775
2 TGG - GRMZM2G036543
39 74279629 1 A G GRMZM2G036484 40 74279670 1 G C GRMZM2G036484 41 74279675 1 C T GRMZM2G036484 42 74279690 1 C T GRMZM2G036484 43 74279701 1 C T GRMZM2G036484 44 74280722 1 T G AC217311.3 45 74280928 1 C T AC217311.3 46 74280937 1 T A AC217311.3 47 74280984 1 A C AC217311.3 48 74280988-
74280989 1 TG CC AC217311.3
49 74281033 1 C T AC217311.3 50 74281051 1 C T AC217311.3 51 74281453 1 G A AC217311.3 52 74281455-
74281456 1 AG GA AC217311.3
53 74281466-74281467
1 GG AT AC217311.3
54 74281480 1 T G AC217311.3 55 74281489 1 G A AC217311.3 56 74491394 1 T G GRMZM2G464580 57 74606411-
74606418 4 CGATACAG AGATACAT GRMZM2G086992
58 74608550 1 T C GRMZM2G181218 59 74608805 1 G C GRMZM2G481691 60 74630494 1 C G GRMZM2G130121

ID Region Genetic changesa Reference allele/sequence CAU5 allele/sequence Gene 61 74769786-
74769830 2 GTTAAACAGTTTTGTT
TCAGAAAACAGTTGTCACTACCCCCCACT
- GRMZM2G030955
62 74770969 1 G A GRMZM2G030955 63 74785214 1 A G AC208123.3 64 74785457 1 A G AC208123.3 65 74800417 1 T C AC208123.3 66 74800422 1 T C AC208123.3 67 75143942-
75143951 2 ATATTGCAGG - GRMZM2G042881
68 75145218 1 T C AC200879.4 69 75145236 1, 5 A C AC200879.4 70 75149675 1 A G GRMZM2G043141 71 75319146 1 T A GRMZM2G583289 72 75405727-
75405728 3 - TCAAATAGTGT GRMZM2G032821
aGenetic changes: 1=AAC; 2=Deletion; 3=Insertion; 4=Replacement; 5=Possible splice site disruption

Table S6 List of genes with function prediction in the qhir11 and qhir12 genomic regions. The highlighted genes are putative candidate genes for HI in maize. Gene Genetic changes B73 Allele/Sequence CAU5 Allele/Sequence Biological functiona References qhir11 region GRMZM2G120587 Deletion TTTA - serine-type carboxypeptidase
activity Mitchell et al.
GRMZM2G471240 Deletion GCATGCAT - hydrolase activity Consortium TU GRMZM2G035557 Insertion - CCGCCTCCGCCTCCGCCT calcium ion binding Mitchell et al. GRMZM2G313009 AAC G A metal ion binding Mitchell et al. qhir12 region GRMZM2G135834 Insertion - TGCTCTCCCATCCCCATCC DNA binding Mitchell et al.
Insertion - GGCGGCGGC GRMZM2G137502 Insertion - ACGGTGGTC DNA binding Mitchell et al. GRMZM2G096682 Replacement CAAATATTGTTTG GAAATGTTTGCCA amino acid binding Mitchell et al. AC177908.3 AAC T C polygalacturonate 4-alpha-
galacturonosyltransferase activity Mitchell et al.
AAC G A GRMZM2G351259 AAC C T heme binding; iron ion binding;
monooxygenase activity; oxidoreductase activity
Mitchell et al. Consortium TU AAC A T
AAC A G GRMZM2G036629 Deletion ACAGA - metal ion binding Mitchell et al. GRMZM2G036543 Deletion TGG - 1 Mitchell et al. GRMZM2G464580 AAC T G metal ion binding Mitchell et al. GRMZM2G130121 AAC C G ATP binding Consortium TU GRMZM2G030955 Deletion GTTAAACAGTTTTGTTTCAG
AAAACAGTTGTCACTACCCCCCACT
- zinc ion binding Mitchell et al.
AAC G A aBiological function: 1=1-(5-phosphoribosyl)-5-[(5-phosphoribosylamino) methylideneamino] imidazole-4-carboxamide isomerase activity
Table S7 List of typical examples of introgression breeding in crop species.
Plant Spices Target trait Genes involved Progenitor Description of major gene transmission References Wheat reduced plant
height Reduced height gene 8 (Rht8)
Japanese variety Akakomugi
i) The first geographical pathway of the Rht8 gene (from variety Akakomugi) was from Japan toItaly at the beginning of the 20th century. In the 1950s, Italian short straw varieties, mostlycarriers of Rht8 and were transferred to former Yugoslavia and to South and Central Europe,where they were used for breeding of semi-dwarf winter wheat varieties.ii) The second geographical pathway of Rht8 (from variety Akakomugi) was from Japan toItaly, from Italy (by derivatives of Akakomugi) to Argentina before and during World War II(1940–45), and from Argentina to Europe and the former Soviet Union after World War II.Conclusion: the Rht8 gene was introgressed into numerous wheat varieties by differentbreeding programs.
Borojevic& Borojevic
Wheat reduced plant height
Reduced height gene 1 (Rht1) and Reduced height gene 2 (Rht2)
Japanese variety Norin 10
The Japanese wheat variety Norin 10 (source of genes Rht1 and Rht2) was transferred fromJapan to the United States after World War II, and from the United States to CIMMYT inMexico. Via the breeding program of CIMMYT, the Rht1 and Rht2 genes were distributed allaround the world, including Europe.Conclusion: the Rht1 and Rht2 genes were introgressed into numerous wheat varieties bydifferent breeding programs.
Borojevic& Borojevic
Wheat Imidazolinone-resistance
Imidazolinone-resistant (IR) gene
FS4 The original mutant (FS4) and most of the early released imidazolinone-resistant cultivarscarried the resistance trait on the long arm of chromosome 6 in the D genome (renamed AhasL-D1) (Anderson et al., 2004; Pozniak and Hucl, 2004). Using backcrossing programs, wheat lineswith resistant genes of AhasL-B1 and AhasL-A1 were created and multiple-genome resistantcultivars have been developed.Conclusion: the IR gene was introgressed into numerous wheat varieties by different breedingprograms.
Hanson et al.
Maize high level of lysine and tryptophan
opaque2(o2) opaque2(o2) The disadvantages of the original o2 mutant include lower yields and a soft, chalky kernel.Based on the original o2 mutant, CIMMYT developed a range of hard endosperm o2 genotypeswith better protein quality through selection, which are popularly known as quality proteinmaize (QPM). This was followed by the large-scale development of QPM germplasm with awide range of genetic backgrounds, representing tropical, subtropical and highland maizegermplasm and involving different maturities, grain color and texture.Conclusion: the o2 gene was introgressed into numerous maize varieties by different breedingprograms.
Babu & Prasanna
Rice Submergence tolerance
Sub1A Indian landrace FR13A
FR13A was from Orissa, India. An international collaborative project evaluated variousprocedures for submergence screening, in which FR13A had best performance. Thus, it waswidely used as source for developing submergence tolerant cultivars and constructingsegregating populations for mapping the submergence tolerance gene. Numerous varieties ofrice in Asia have been converted to submergence tolerant versions and greatly contribute to
Xu et al.; Septiningsih et al. ; Bailey-Serres et al.

Plant Spices Target trait Genes involved Progenitor Description of major gene transmission References increased rice production and more stable yields in these regions. Effectiveness in Africa has been verified. It is one the real success stories of international plant breeding in the last decade. Conclusion: the Sub1A gene was introgressed into numerous rice cultivars by different breeding programs.
Rapeseed low erucic acid
Erucic acid genes are located on A8 and C3.
German cultivar Liho
The first low erucic acid rapeseed ORO, derived from a spontaneous mutant of the German spring rapeseed cultivar Liho by Keith Downey, was released in Canada in 1968. Afterwards, many new varieties derived from the source germplasm were developed in Canada, and then spread to other countries. Conclusion: the low erucic acid gene was introgressed into numerous rapeseed varieties by different breeding programs.
Delourme et al. Snowdon et al.
Rapeseed low glucosinolate
Three major recessive genes (names are unknown currently)
Polish variety Bronowski
In 1969, the Polish spring rape variety Bronowski was identified having low glucosinolate content, and this cultivar provided the basis for an international backcrossing programme to introduce this trait into high-yielding erucic acid-free material. The result was the release in 1974 of the first 00-quality spring rapeseed variety, Tower, with zero erucic acid and low glucosinolate content, and thus began the advance of oilseed rape (canola) in the following decades to one of the most important oil crops in temperate regions. Conclusion: the low glucosinolate genes were introgressed into numerous rapeseed varieties by different breeding programs.
Snowdon et al.
Soybean Soybean cyst nematode (SCN) resistance
rhg1-b PI 88788 Roughly 90% of the commercially cultivated soybean varieties marketed as SCN-resistant in the central United States use the rhg1-b allele (haplotype), derived from the soybean line PI 88788, as the main SCN resistance locus. Conclusion: the rhg1-b gene was introgressed into numerous soybean varieties by different breeding programs.
Cook et al.

File S1
History of maize haploid inducer development in the public domain
The history of in vivo haploid induction in maize started with observations by Emerson and Randolph
in the 1930s on spontaneously occurring haploids in certain crosses (Chase 1969). Subsequently, marker stocks
were developed to identify haploids in the seed or seedling stage such as Randolph’s (1940) tester stock and
the Purple Embryo Marker (PEM) stock derived by Nanda and Chase (1966).
Chase (1949) described the crucial influence of pollinator genotypes on the frequency of in vivo
haploid induction. This initiated the development of new pollinators with improved haploid induction rate
(HIR). The highest HIR at that time was reported by Coe (1959), who found 343 haploids in 10,616 observed
plants from selfed progeny of his “Stock 6”. Chumak (1979) at the Krasnodar Lukyanenko Agricultural
Research Institute (KLARI) developed synthetic populations (PEM48II and others; HIR ~ 0.02 to 0.29%)
on the basis of PEM and non-inducer lines and hybrids. In 1986, they observed that a hybrid from the
cross of synthetic population PEM48II (HIR ~ 0.08%) and Zarodishevy Marker Saratov (ZMS, HIR ~
0.55 to 3.43%; Tyrnov and Zavalishina 1984) introduced from Saratov State University (SSU) has HIR of
0.27%. In 1989, Shatskaya and colleagues developed a high HIR inducer-population Zarodishevy Marker
Krasnodar (ZMK1, HIR~6 to 8%) using four lines from the cross PEM48II×ZMS. One family of inducer
ZMK1 is also known as the Krasnodar Embryo Marker Synthetic (KEMS). The improved inducer
ZMK1U (HIR~11 to 13%) was created by direct selection of ZMK1 (Shatskaya 2010). At SSU, besides
ZMS, Zavalishina and colleagues also developed KMS (HIR ~ 3%) by crossing Brown markers with Stock 6
in 1979 (A. Zavalishina, personal communication 2014) and subsequently developed ZMS8 in 1987 (HIR ~ 8
to 10%; Zavalishina and Tyrnov 1992). In 1987, Lashermes and Beckert (1988) developed WS14 (HIR ~ 3 to
5%) from the cross Stock 6 × W23ig. These inducers were introduced into Germany, Moldova and Romania,
and served as basis of further improved inducers, such as RWS (HIR ~ 8%; Röber et al. 2005), UH400 (HIR
~ 8%; Prigge et al. 2012b), LfL inducers (HIR > 10%, J. Eder, personal communication 2013), MHI (HIR ~ 7
to 9%; Chalyk 1999), and PHI inducers (HIR ~ 10 to 16%; Rotarenco et al. 2010). Recently, the University of
Hohenheim released inducers UH600 and UH601 combining high oil content in the seeds (OC ~ 10.5 to 11.6%)
with good HIR > 8% (Melchinger et al. 2013).
Inducer development was also conducted independently in several Asian countries. Sarkar developed

inducer ACIR (HIR ~ 3%) from a cross with Stock 6 (Sarkar et al. 1994). Liu and Song (2000) developed the
first Chinese maize inducer CAUHOI (HIR ~ 3%) by crossing Stock 6 and Beijing High-oil synthetic in 1998.
Chen continued this work and developed CAU5 (HIR ~ 8%) and CAU079 (HIR ~ 6%) by crossing UH400
and CAUHOI (Xu et al. 2013). The HZI inducers were also developed in China by Huangzhong Agricultural
University with HIR ~ 4 to 8% (F. Qiu, personal communication 2013). CIMMYT in collaboration with the
University of Hohenheim developed tropically adapted inducer lines (TAIL5, and TAIL7 to TAIL9, HIR ~ 5
to 11%) as described by Prigge et al. (Prigge et al. 2012a).

File S2
Source and germplasm group of 1,482 non-inducers analyzed in this study
1) 93 lines from Ganal et al. (2011)
• EUD
A374 F252 FV331 MBS847 ND283 Tzi8 W401 X807
• EUF
AK3 CH10 D105 F471 FC13 FC24 FC25 FC26 FV2 FV283 FV286 FV4 FV71 FV79 LO3 LO32 ND36
NYS302 PLS14 PLS27 PLS42 W85
• MIS
Florida.56 P737M20 TIP.454.2 TIP.458.2 TIP.466.2 TIP.485.2 TIP.498.2 TIP.503.2 TIP.512.2 TIP.521.2
TIP.523.2 TIP.534.2
• NSS
CR1HT IB014 IB02 LH123HT LH156 LH38 LH39 LH52 LH54 LH57 LH59 LH60 LH82 LH85 LH93 MBNA
NQ508 PHG39 PHG50 PHG72 PHK76 PHN47 PHR25 PHR32 PHR36 PHV63 PHV78 PHW65 PHZ51
X2MA22
• SS
B47 FAPW FBHJ FR19 G80 LH1 LH132 LH145 LH149 LH74 LP1.CMS.HT NS701 PB80 PHG71 PHJ40
PHR47 PHW17 PHW52 X78002A X78004
• TST: CMlL69
2) 220 lines from Cook et al. (2012)
• EUD
B115 B73Htrhm CH9 CM37 CM7 CML287 CML91 CMV3 CO125 F44 Ky21 Ky228 M162W M37W
Mo18W Mo1W Mo24W SC213R T8 Tx303
• EUF: CO255 EP1 F7
• MIS
HP301 I29 IA2132 IA5125 IDS28 IDS69 IDS91 IL101 IL14H IL677A Indiana4722 P39 SA24 Sg1533 SG18
• NSS
A188 A6 A659 A661 A682 B103 B2 B52 B57 B75 B97 C103 C123 CI187.2 CI31A CI90C DE.2 DE.3
DE1
DE811 GT112 H95 H99 Hi27 I205 K4 K55 L317 M14 Mo44 Mo46 Mo47 MoG MS71 Mt42 N6 NC222
NC230 NC232 NC236 NC238 NC258 NC260 NC262 NC264 NC290A NC318 NC320 NC33 NC342 NC344
ND246 OH40B OH43 OH43E OH7B Pa762 T232 VA102 VA14 VA17 VA22 VA35 VA59 VA85 VA99
W117HT W153R W182B W22 W22.R.r.std WD
• SS
A239 A554 A632 A634 A635 A641 A654 A679 A680 Ab28A B10 B105 B109 B14A B164 B37 B46 B64
B68 B76 B79 B84 CM105 CM174 H105W H49 H84 H91 Hy MS153 N192 N28HT N7A NC250 NC294
NC306 NC310 NC314 NC324 NC326 NC328 NC368 Os420 Pa875 Pa880 PA91 R229 WF9
• TST
CML10 CML103 CML108 CML11 CML14 CML154Q CML157Q CML158Q CML218 CML220 CML238
CML247 CML254 CML258 CML261 CML264 CML277 CML281 CML311 CML314 CML321 CML322
CML328 CML331 CML332 CML333 CML341 CML38 CML45 CML5 CML52 CML61 CML92 Ki11 Ki14
Ki2021 Ki21 Ki3 Ki43 Ki44 NC296 NC296A NC298 NC300 NC302 NC304 NC336 NC340 NC346 NC348
NC350 NC352 NC354 NC356 NC358 TX601 TZI10 TZI11 TZI16 TZI18 TZI25 TZI9
3) 834 lines from our own database
• EUD:
A148 A158 A3 A310 A340 A347 A375 AS5707 B100 B101 B102 B106 B107 B108 B89 B98 Carg_11430
CG1 CL30 Co151 Co158 CO316 CQ201 CQ502 DJ7 DK11 DK3D DK4676A DK78010 DK78371A
DKHBA1 DKMBPM DKMBST DKMDF_13D EA1163 EA3076 EC130 EC133A EC136 EC140 EC151
EC175 EC232 EC242C EC326A EC334 EP2 EP27 EP28 EP29 EP51 EP52 EP55 EP56 EP67 EP72 EP77
EZ11A EZ19 EZ31 EZ37 EZ46 EZ48 F1808 F544 F670 F7009 F7019 F7025 F7028 F7038 F7057 F7058
F7059 F7081 F748 F752 F838 F888 F904 F908 F912 F918 F922 F924 F98902 FC1852 FC1890 FV113 FV181
FV218 FV230 FV252 FV271 FV277 FV284 FV288 FV292 FV317 FV330 FV332 FV335 FV353 FV354
FV356 GEMS_0092 GL27 GL62 Ia153 IOD.0663 KW5361 LAN496 Lp5 Mo15W N16 N22 N25 NC262B
NC288 NC290 ND211 NDB8 NK764 NKH8431 nr.38_11 Oh02 Oh33 Os426 Pa374 PA405 PB116 PB7
PB98TR PH207 PHB09 PHG35 PHG86 PHH93 PHK29 PHT55 PHT77 PP147 Q381 RZ07 SDp254 Va26
W117 W182E W23 W33 W59E W602S W604S W64A W79A W9 WH WJ YUBC1a D01 D06 D09 D17 D21
D22 D23 D24 D30 D32 D403 D408 D46 D48 D51 D60 D61 D63 D64 D66 D67 D83 D851 D95 P001 P006
P009 P017 P022 P024 P027 P029 P031 P033 P034 P036 P038 P040 P042 P043 P045 P046 P047 P048 P053
P054 P057 P060 P063 P064 P065 P066 P068 P069 P070 P071 P072 P074 P075 P079 P080 P081 P083 P084
P085 P086 P087 P089 P091 P092 P093 P094 P095 P096 P097 P099 P100 P101 P102 P103 P104 P105 P106
P107 P108 P110 P111 P112 P113 P114 P115 P118 P119 P120 P122 P123 P126 P127 P128 P129 P130 P131
P133 P135 P136 P137 P140 P142 P144 P145 P146 P148 P149 P150 P154 P159 P165 P167 P182 P184 P188
P194 P197 P202 P204 P206 P209 P210 P211 P212 P213 P214 P215 P217 P219 P223 P224 P233 P235 P239
P245 P250 P255 P261 P271 P272 P275 P284 P286 P289 P290 P291 P299 P304 P312 P317 P330 P336 P342
P351 P352 P353 P354 P357 PD1001H.72 PD1003H.109 PD1022H.149 PD1022H.49 PD1022H.98
PD1023H.72 PD1113H.111 PS06522322n S002 S015 S016 S018 S020 S021 S025 S028 S033 S034 S035
S036 S037 S040 S044 S046 S048 S049 S050 S051 S052 S053 S054 S055 S058 S060 S064 S065 S066 S067
S069 S070 S072 S073 S074 S077 VD01 VD02 VD03
• EUF
BARE.002 BARE.017 BUGA.005 BUGA.032 BUGA.064 BUGA.084 CAMP.104 CAMP.107 CAMP.125
CAMP.304 CH10.3 CH10.4 CH16.1_295 CH17.3 CH19.1 CH19.3 CH22 CH27_17 CH28_2 CH34 CH36
CH39 CH4.2 CH446A CH5.2 CH7.1 CH8.7 CORU.001 CORU.002 EA1027 EA1070 EA1301 EA1349
EA2000 EA2024 EA2087 EA2841 EC209 EC212A EC214 EC218 EC22 EC237 EC23A EC243 EC244
EC245B EC246 EC248 EC35G EC45 EC46 EC49A EC50 EC51 EP16 EP31 EP32 EP37 EP39 EP4 EP40
EP42 EP43 EP44 EP45 EP46 EP47 EP53 EP64 EP65 EP66 EP68 EP69 EP71 EP73 EP79 EP80 EP86
ESTE.001 EZ1 EZ10 EZ14 EZ2 EZ22 EZ3 EZ30 EZ32 EZ33 EZ38 EZ4 EZ49 EZ5 EZ51 EZ53 EZ59 F02803
F03801 F03802 F337 F347 F350 F359 F361 F362 F363 F364 F373 F41 F45 F47 F564 F64 F657wx F7012
F7048 F759 F810 F9003 F902 F920 FC1571 FC1772 FC201 FC209 FC21 FC23 FC30 FC352 FC46 FP1 FV1
FV10 FV11 FV160 FV18 FV226 FV268 FV324 FV65 FV69A FV70 FV72 FV74 FV75 FV76 FV77 FV83
FV85 GELB.104 GELB.109 GELB.A119 GELB.A203 LACA.002 LACA.004 LACA.005 LACA.006 LO33
MONE.102 MONE.106 MONE.112 ND33 nr.469 nr.470 NY302 NY303 OURD.001 P465P PB18 PB261
PB268 PB40 PB53 PB57 PB6R PB79_2 PB86 PB97 PLS41 PP85 PP87 PV125 PV135 PV139 RT10 RT9
SATU.106 SATU.131 SATU.163 SATU.203 SATU.245 SCHM.112 SCHM.133 SCHM.134 SCHM.213
STGA.104 STGA.151 STGA.173 STGA.178 STRE.130 STRE.138 STRE.142 STRE.302 VACQ.053
VACQ.065 VIEY.001 W617 WALL.108 WALL.175 WALL.213 WALL.316 YUBR5 YUBR6 D102 D107
D114 D118 D131 D140 D141 D142 D143 D144 D145 D146 D147 D149 D150 D152 D157 D164 D167 D171
D199 D305 D503 D504 D800 DE101 DK105 F005 F012 F013 F016 F018 F020 F023 F027 F030 F034 F035

F037 F038 F039 F040 F043 F045 F047 F048 F050 F052 F054 F055 F056 F057 F058 F059 F060 F061 F062
F066 F068 F070 F072 F073 F074 F077 F082 F083 F084 F087 F088 F090 F091 F093 F094 F096 F098 F099
F101 F103 F104 F105 F106 F108 F109 F110 F117 F121 F123 F124 F125 F126 F127 F128 F129 F130 F131
F132 F133 F134 F135 F136 F137 F138 F139.STRE F142 F145 F147 F148 F150 F151 F154 F157 F159 F160
F161 F162 F169 F173 F174 F178 F179 F181 F182 F183 F185 F186 F192 F195 F198 F199 FF0823.n.6.2.2.1
FF1002H.453 FF1008H.20 FF1023H.78 FL1002H.40 L001 L003 L005 L007 L010 L011 L012 L015 L016
L017 L019 L021 L023 L024 L025 L031 L032 L035 L037 L038 L041 L042 L043 L045 L046 L047 L048 L050
L051 L054 L055 L056 L057 L058 L059 L060
• NSS
L127_Lif L139_Lif LH127 LH160 LH162 LH65 ML606 OQ603 PHG29 PHG47 PHG83 PHG84 PHJ75
PHN37 PHP76 W606S W608S W609S W611S W612S cn1680
• SS
B104 Carg_2369 CR14 DeKalb_2FACC Funk_4N506 IBB14 IBB15 LH146Ht LH196 LH202 LH220Ht
ND2002 ND2006 ND2014 PHN29 PHV37 PHW03 W610S
• TST
CM.GER.MPS1.P1 CM.GER.MPS1.P10 CM.GER.MPS1.P13 CM.GER.MPS1.P16 CM.GER.MPS1.P18
CM.GER.MPS1.P19 CM.GER.MPS1.P2 CM.GER.MPS1.P22 CM.GER.MPS1.P23 CM.GER.MPS1.P24
CM.GER.MPS1.P25 CM.GER.MPS1.P26 CM.GER.MPS1.P27 CM.GER.MPS1.P28 CM.GER.MPS1.P29
CM.GER.MPS1.P30 CM.GER.MPS1.P31 CM.GER.MPS1.P32 CM.GER.MPS1.P33 CM.GER.MPS1.P35
CM.GER.MPS1.P37 CM.GER.MPS1.P39 CM.GER.MPS1.P40 CM.GER.MPS1.P42 CM.GER.MPS1.P43
CM.GER.MPS1.P44 CM.GER.MPS1.P45 CM.GER.MPS1.P5 CM.GER.MPS1.P6 CM.GER.MPS1.P8
CM.GER.MPS1.P9 CML246 CML539 CZL00009 CZL0618 CZL0719 CZL0723 CZL0724 CZL074
VL062645 VL062655 CML494
4) 335 lines from Yang et al. (2011)
• DCN
Chang3 Chang7.2 chuan48.2 Dan340 Dan4245 Dan598 Dong237 Dong46 HYS HZS Ji53 Ji63 Ji853 Jing24
K12 Lv28 Lx9801 Nan21.3 Q1261 Si444 Si446 Tian77 TT16 W138 WH413 X3H.2 X5237 Xi502 Yan414
Ye515 Yu374 Zheng22 Zheng32
• EUD: B113
• NSS
A619 B114 By4839 By4944 By4960 By804 By807 By809 By813 By815 By843 By855 Cheng698 CI7
Dan3130 Dan599 DH29 Gy1007 Gy1032 Gy220 Gy237 Gy386 GY386B Gy462 Gy798 Gy923 H127 HTH.17
JH59 Ji842 Ji846 Jiao51 L3180 Liao159 LK11 LXN MO113 Mo17 P178 Qi319 R08 R15 Ry684 Ry697 Ry713
Ry729 Ry732 Ry737 S22 Shen135 Shen137 Sy1032 Sy1035 Sy1039 Sy1052 Sy1077 Sy1128 Sy3073 Sy998
Sy999 TX5 X18.599 X238 X4F1 X5213 X7327 X7381 XZ698 Yu87.1 ZaC546
• SS
B11 B110 B111 B73 C8605 DH3732 ES40 HB Hu803 Hua83.2 HuangC J4112 K10 K14 K22 Liao5114 Qi205
Shen5003 Tie7922 U8112 Wu109 X501 X7884.4Ht X81162 X812 X835b X8902 X9782 Ye107 Ye478
Ye8001 ZH68 Zheng29 Zheng30 Zheng35 Zheng58 Zheng653
• TST
CIMBL1 CIMBL10 CIMBL100 CIMBL101 CIMBL103 CIMBL105 CIMBL106 CIMBL107 CIMBL108
CIMBL109 CIMBL11 CIMBL110 CIMBL111 CIMBL112 CIMBL113 CIMBL114 CIMBL115 CIMBL116
CIMBL117 CIMBL118 CIMBL119 CIMBL12 CIMBL120 CIMBL121 CIMBL122 CIMBL123 CIMBL127
CIMBL128 CIMBL129 CIMBL13 CIMBL133 CIMBL134 CIMBL136 CIMBL138 CIMBL14 CIMBL141
CIMBL142 CIMBL143 CIMBL144 CIMBL145 CIMBL146 CIMBL148 CIMBL150 CIMBL151 CIMBL152
CIMBL153 CIMBL154 CIMBL156 CIMBL157 CIMBL16 CIMBL17 CIMBL18 CIMBL19 CIMBL2
CIMBL20 CIMBL21 CIMBL22 CIMBL24 CIMBL25 CIMBL26 CIMBL28 CIMBL29 CIMBL3 CIMBL30
CIMBL31 CIMBL32 CIMBL33 CIMBL34 CIMBL38 CIMBL39 CIMBL4 CIMBL40 CIMBL43 CIMBL44
CIMBL46 CIMBL47 CIMBL48 CIMBL49 CIMBL5 CIMBL50 CIMBL52 CIMBL53 CIMBL55 CIMBL56
CIMBL57 CIMBL58 CIMBL59 CIMBL6 CIMBL60 CIMBL61 CIMBL62 CIMBL63 CIMBL65 CIMBL66
CIMBL68 CIMBL69 CIMBL7 CIMBL70 CIMBL71 CIMBL72 CIMBL73 CIMBL74 CIMBL75 CIMBL77
CIMBL8 CIMBL80 CIMBL81 CIMBL82 CIMBL83 CIMBL84 CIMBL86 CIMBL87 CIMBL88 CIMBL89
CIMBL9 CIMBL90 CIMBL91 CIMBL92 CIMBL93 CIMBL94 CIMBL95 CIMBL98 CIMBL99 CML113
CML114 CML115 CML116 CML118 CML121 CML122 CML130 CML134 CML139 CML162 CML163
CML165 CML166 CML168 CML169 CML170 CML171 CML172 CML191 CML192 CML20 CML223
CML226 CML228 CML290 CML298 CML300 CML304 CML305 CML307 CML31 CML32 CML323
CML324 CML325 CML326 CML327 CML338 CML360 CML361 CML364 CML408 CML411 CML412
CML415 CML422 CML423 CML426 CML428 CML430 CML431 CML432 CML433 CML451 CML454

CML465 CML471 CML473 CML474 CML480 CML486 CML493 CML496 CML497 CML50 CML51
CML69 S37 SW92E114 Yun46

File S3
Statistical tests for selective neutrality and hitchhiking of 10 segments with
highest CHE scores
For each segment, we denote its two alleles as A and a. We consider inducers developed from crosses
of type 1 (I × N), type 2 ((I×N) × (I×N)) or type 3 ((I×N) × I), where I represents an inducer genotype
homozygous for presence of the A allele and N is a non-inducer sampled at random from the set of non-inducers
which has frequency 𝑝𝑝𝐴𝐴∗ for allele A and frequency (1 − 𝑝𝑝𝐴𝐴∗) for allele a. According to the description in
Supplementary Table 1, we have 11 crosses of type 1 and 2, and 8 crosses of type 3.
The probability of recovering genotype AA in a progeny inducer
The probability of recovering genotype AA in a progeny inducer I descending from one of the three
type of crosses described above is given by:
𝑃𝑃[𝐈𝐈 = 𝐴𝐴𝐴𝐴] = 𝑝𝑝𝐴𝐴∗ × 1 + (1 − 𝑝𝑝𝐴𝐴∗) �12
+ ∆� (1)
or 𝑃𝑃[𝐈𝐈 = 𝐴𝐴𝐴𝐴] = 𝑝𝑝𝐴𝐴∗ × 1 + (1 − 𝑝𝑝𝐴𝐴∗) �34
+ ∆� (2)
where Δ corresponds to the change in the frequency of allele A due to directional selection for HI in the
development of progeny inducers for I descending from a cross of type 1 or 2 (Eqn. (1) and a cross of type 3
(Eqn.(2)).
Null hypothesis and alternative hypothesis
The biological hypothesis that allele A is selectively neutral, corresponds to the null hypothesis H0: Δ
= 0, whereas the alternative hypothesis H1: Δ > 0 corresponds to the statement that allele A was selected for
and, as a result, its frequency increased.
Test for selection of allele A at a specific locus
For a specific segment detected in the inducers, the frequency 𝑝𝑝𝐴𝐴∗ , which corresponds to the probability
that a randomly chosen non-inducer carries this haplotype, and can be directly obtained from Table 1. Thus,
using Eqns. (1) and (2), the probability of observing genotype AA in a newly developed inducer at the locus
under investigation is given by the expression
𝑓𝑓(∆) = �𝑝𝑝𝐴𝐴∗ × 1 + (1 − 𝑝𝑝𝐴𝐴∗) �12
+ ∆��11�𝑝𝑝𝐴𝐴∗ × 1 + (1 − 𝑝𝑝𝐴𝐴∗) �3
4+ ∆��
8 (3)
By solving the equation 𝑓𝑓(∆) = 𝛼𝛼, we obtain the lower limit u∆ of the (1−α)% Clopper-Pearson confidence

u∆
interval (Clopper and Pearson 1934), corresponding to a statistical test of H0 at the significance level α. If
> 0 , we reject the null hypothesis H0 based on our experimental data, indicating there is a positive selection
at this locus; otherwise, we accept the null hypothesis, indicating that allele A is selectively neutral.
In this study, we used the significance level α=0.01 and 0.001 and the Bonferroni adjusted multiple
testing significance level α=0.001 and 0.0001 for the top 10 segments with the highest CHE score (Table 1).

File S4: marker data of the MaizeSNP50 chip
This compressed zip file contains SNP ID numbers and locations and genotypes of 53 inducers listed in Table S1, 834 lines from our own database and 335 lines from Yang et al. (2011) listed in File S2. (.zip, 9313 KB)
Available for download as a .zip file at:
http://www.genetics.org/lookup/suppl/doi:10.1534/genetics.115.184234/-/DC1/FileS4.zip

File S5: Marker data of the 600k chip. This compressed zip file contains SNP ID numbers and locations and genotypes of 17 inducers indicated with the * symbol and listed in Table S1. (.zip, 188 KB)
Available for download as a .zip file at:
http://www.genetics.org/lookup/suppl/doi:10.1534/genetics.115.184234/-/DC1/FileS5.zip
Literature Cited
Babu, R., B. M. Prasanna, 2014, Molecular breeding for quality protein maize (QPM) pp 489–505 in Genomics of plant genetic resources, edited by R. Tuberosa, A. Graner, E. Frison. Springer, Heidelberg.
Bailey-Serres, J., T. Fukao, P. Ronald, A. Ismail, S. Heuer et al., 2010 Submergence tolerant rice: SUB1’s journey from landrace to modern cultivar. Rice 3: 138–147.
Beckert, P., M. Brinkmann, M. Beckert, 2008 A major locus expressed in the male gametophyte with incomplete penetrance is responsible for in situ gynogenesis in maize. Theor. Appl. Genet. 117: 581–594.
Borojevic, K., and K. Borojevic, 2005 The transfer and history of “reduced height genes” (Rht) in wheat from Japan to Europe. Journal of Heredity 96: 455–459.
Chalyk, S. T., 1999 Creating new haploid-inducing lines of maize. Maize Genet Coop Newsletter 73: 53–54.
Chase, S. S., 1949 Monoploid frequencies in a commercial double cross hybrid maize, and its component single cross hybrids and inbred lines. Genetics 34: 328−332.
Chase, S. S., 1969 Monoploids and monoploid-derivatives of maize (Zea mays L.). Bot. Rev. 35: 117–167.
Chia, J.-M., C. Song, P. J. Bradbury, D. Costich, N. de Leon et al., 2012 Maize HapMap2 identifies extant variation from a genome in flux. Nature Genetics 44: 803–807.
Chumak, M. V., 1979 The use of haploid in breeding maize. Proceedings of the tenth meeting of the maize and sorghum section of EUCARPIA. Varna - 17 - 19 - September.
Clopper, C., E.S. Pearson, 1934 The use of confidence or fiducial limits illustrated in the case of the binomial. Biometrika 26: 404–413.
Coe, E.H., 1959 A line of maize with high haploid frequency. Am. Nat. 93: 381–382.
Consortium, T. U., 2014 UniProt: a hub for protein information. Nucleic Acids Research 43: D204–D212.
Cook, D. E., T. G. Lee, X. Guo, S. Melito, K. Wang et al., 2012 Copy number variation of multiple genes at Rhg1 mediates nematode resistance in soybean. Science (New York, N.Y.) 338: 1206–9.
Cook, J. P., M. D. McMullen, J. B. Holland, F. Tian, P. Bradbury et al., 2012 Genetic Architecture of Maize Kernel Composition in the Nested Association Mapping and Inbred Association Panels. Plant Physiology 158: 824–834.
Delourme, R., C. Falentin, B. F. Fomeju, M. Boillot, G. Lassalle et al., 2013 High-density SNP-based genetic map development and linkage disequilibrium assessment in Brassica napus L. BMC genomics 14: 120.
Eder, J., and S. Chalyk, 2002 In vivo haploid induction in maize. Theoretical and Applied Genetics 104: 703–708.
Flint-Garcia, S. A., A. C. Thuillet, J. Yu, G. Pressoir, S. M. Romero et al., 2005 Maize association population: A high-resolution platform for quantitative trait locus dissection. Plant Journal 44: 1054–1064.
Ganal, M. W., G. Durstewitz, A. Polley, A. Bérard, E. S. Buckler et al., 2011 A large maize (zea mays L.) SNP genotyping array: Development and germplasm genotyping, and genetic mapping to compare with the B73 reference genome. PLoS ONE 6.:

Geiger, H. H., and G. A. Gordillo, 2009 Doubled haploids in hybrid maize breeding. Maydica 54: 485–499.
Gerdes, J. T, C. F. Behr, J. G. Coors, W. F. Tracy, 1993 Compilation of North American Maize Breeding Germplasm. Crop Sci Soc of Am. Madison, USA.
Hanson, B. D., L. Fandrich, D. L. Shaner, P. Westra, and S. J. Nissen, 2007 Recovery of imidazolinone-resistant hard red wheat lines following imazamox application. Crop Science 47: 2058–2066.
Jiao, Y., H. Zhao, L. Ren, W. Song, B. Zeng et al., 2012 Genome-wide genetic changes during modern breeding of maize. Nature Genetics 44: 812–815.
Lashermes, P., M. Beckert, 1988 Genetic control of maternal haploidy in maize (Zea mays L.) and selection of haploid inducing lines. Theor Appl Genet 76: 405–410.
Liu, Z., T. Song, 2000 The breeding and identification of haploid inducer with high frequency parthenogenesis in Maize. ACTA AGRONOMICA SINICA 26: 570–574.
MBS Inc, 2000 Genetics Handbook. Ames, Iowa, USA.
Melchinger, A. E., W. Schipprack, T. Würschum, S. Chen, and F. Technow, 2013 Rapid and accurate identification of in vivo-induced haploid seeds based on oil content in maize. Scientific reports, Nature 3: 1–5.
Mitchell, a., H.-Y. Chang, L. Daugherty, M. Fraser, S. Hunter et al., 2014 The InterPro protein families database: the classification resource after 15 years. Nucleic Acids Research 43: D213–D221.
Nanda, D. K., and S. S. Chase, 1966 An Embryo Marker for Detecting Monoploids Of Maize (Zea Mays L.)1. Crop Science 6: 213.
Nelson, P. T., 2009 Genetic and phenotypic characterization of maize germplasm resources: Ex-PVPA inbreds, NCSU inbreds, and elite exotic inbreds. PhD dissertation of North Carolina State University, Raleigh, North Carolina.
Prigge, V., W. Schipprack, G. Mahuku, G. N. Atlin, and A. E. Melchinger, 2012a Development of in vivo haploid inducers for tropical maize breeding programs. Euphytica 185: 481–490.
Prigge, V., X. Xu, L. Li, R. Babu, S. Chen et al., 2012b New Insights into the Genetics of in Vivo Induction of Maternal Haploids , the Backbone of Doubled. Genetics 190: 781–793.
Randolph, L. F., 1940 Note on haploid frequencies. Maize Genet Coop Newsletter 14: 23−24.
Röber, F. K., G. A. Gordillo, and H. H. Geiger, 2005 In vivo haploid induction in maize - Performance of new inducers and significance of doubled haploid lines in hybrid breeding. Maydica 50: 275–283.
Romay, M. C., M. J. Millard, J. C. Glaubitz, J. A. Peiffer, K. L. Swarts et al., 2013 Comprehensive genotyping of the USA national maize inbred seed bank. Genome biology 14: R55.
Rotarenco, V., G. Dicu, D. State, S. Fuia, 2010 New inducers of maternal haploids in maize. Maize Genet Coop Newsletter 84: 21−22.
Sarkar, K. R., A. Pandey, P. Gayen, J.K. Madan, R. Kumar et al., 1994 Stabilization of high haploid inducer lines. Maize Genet Coop Newsletter 68: 64−65.
Septiningsih, E. M., A. M. Pamplona, D. L. Sanchez, C. N. Neeraja, G. V. Vergara et al., 2009 Development of submergence-tolerant rice cultivars: The Sub1 locus and beyond. Annals of Botany 103: 151–160.

Shatskaya, O. A., 2010 Haploinductors isolation in maize: three cycles of selection on high frequency of induction of matroclinal haploids. Agricultural Biology 5: 79−86.
Snowdon, R. J., W. Lühs, W .Friedt, 2006 Oilseed rap, pp 55−114 in Genome Mapping and Molecular Breeding in plants, edited by C. Kole. Springer, Heidelberg.
Strigens, A., C. Grieder, B. I. G. Haussmann, and A. E. Melchinger, 2012 Genetic variation among inbred lines and testcrosses of maize for early growth parameters and their relationship to final dry matter yield. Crop Science 52: 1084–1092.
Tyrnov, V. S., A. N. Zavalishina, 1984 Induction of high frequency occurrence of matroclinal haploids in maize. Report of USSR Academy of Science. Genetics 276: 735−738.
Xu, X., L. Li, X. Dong, W. Jin, A. E. Melchinger et al., 2013 Gametophytic and zygotic selection leads to segregation distortion through in vivo induction of a maternal haploid in maize. J. Exp. Botany 64: 1083–1096.
Xu, K., X. Xu, T. Fukao, P. Canlas, R. Maghirang-Rodriguez et al., 2006 Sub1A is an ethylene-response-factor-like gene that confers submergence tolerance to rice. Nature 442: 705–708.
Yang, X., S. Gao, S. Xu, Z. Zhang, B. M. Prasanna et al., 2011 Characterization of a global germplasm collection and its potential utilization for analysis of complex quantitative traits in maize. Molecular Breeding 28: 511–526.
Zabirova, J.R., M.V. Chumak, O. A. Shatskaya, V. S. Scherbak, 1996 Technology of rapid mass generation of homozigous lines. Kukuruza i sorgo 4: 17−19.
Zavalishina, A. N., V. S. Tyrnov, 1992 Induction of matroclinal haploidy in maize in vivo, pp221−222 in XIIIth Eucarpia Congress, Reproductive Biology and Plant Breeding. Angers, France.