the gatt's starting point: tariff levels circa 1947 · 1 1. introduction the general agreement...
TRANSCRIPT

NBER WORKING PAPER SERIES
THE GATT'S STARTING POINT:TARIFF LEVELS CIRCA 1947
Chad P. BownDouglas A. Irwin
Working Paper 21782http://www.nber.org/papers/w21782
NATIONAL BUREAU OF ECONOMIC RESEARCH1050 Massachusetts Avenue
Cambridge, MA 02138December 2015
For useful comments, we thank Michael Finger, Judith Goldstein, Bernard Hoekman, Manfred Elsig,Carlos Primo Braga, Alan Winters, Alejandro Jara, Frieder Roessler, Robert Staiger, and participantsat the World Trade Forum 2015 in Bern. Semira Ahdiyyih and Taylor Ng provided outstanding researchassistance. Research for this paper has been supported in part by the World Bank’s Multidonor TrustFund for Trade and Development Strategic Research Partnership on Economic Development. Anyopinions expressed in this paper are the authors’ and should not be attributed to the World Bank orthe National Bureau of Economic Research. All remaining errors are our own.
NBER working papers are circulated for discussion and comment purposes. They have not been peer-reviewed or been subject to the review by the NBER Board of Directors that accompanies officialNBER publications.
© 2015 by Chad P. Bown and Douglas A. Irwin. All rights reserved. Short sections of text, not to exceedtwo paragraphs, may be quoted without explicit permission provided that full credit, including © notice,is given to the source.

The GATT's Starting Point: Tariff Levels circa 1947Chad P. Bown and Douglas A. IrwinNBER Working Paper No. 21782December 2015JEL No. F13
ABSTRACT
How high were import tariffs when GATT participants began negotiations to reduce them in 1947?Establishing this starting point is key to determining how successful the GATT has been in bringingdown trade barriers. If the average tariff level was about 40 percent, as commonly reported, the impliedearly tariff reductions were substantial, but this number has never been verified. This paper examinesthe evidence on tariff levels in the late 1940s and early 1950s and finds that the average tariff levelgoing into the first Geneva Round of 1947 was about 22 percent. We also find that tariffs fell by relativelymore in the late 1940s and early 1950s for a core group of GATT participants (the United States, UnitedKingdom, Canada and Australia) than they did for many other important countries, including the setof other (non-core) GATT participants.
Chad P. BownDevelopment Economics Research GroupThe World Bank1818 H Street, NW, MSN MC3-303Washington, DC 20433 [email protected]
Douglas A. IrwinDepartment of EconomicsDartmouth CollegeHanover, NH 03755and [email protected]

1
1. Introduction
The General Agreement on Tariffs and Trade (GATT) is usually given substantial credit for the
liberalization of world trade that took place after World War II. At the time it was formed in
1947, barriers to world trade were considerable. The Great Depression of the 1930s saw the
imposition of higher tariffs, tighter import quotas, foreign exchange controls, and discriminatory
trade arrangements around the world (Irwin 2012). World War II brought additional
governmental controls on foreign trade. Had they remained in place, these restrictions would
have stifled the growth of world trade in the postwar period, and presumably slowed the
economic recovery from the war.
Of course, as is well known, leading countries met in Geneva in 1947 to address this state
of affairs. They negotiated tariff reductions and reached an agreement regulating the use of trade
policies. Three subsequent negotiating rounds expanded the number of GATT participants
(notably adding Germany and Japan) and reduced tariffs further. By the start of the Kennedy
Round in 1964, average tariffs for the major players in the GATT – the United States, the
European Economic Community (EEC), Japan, and the United Kingdom – were about 15
percent.
But what were the average tariff levels immediately prior to the establishment of the
GATT at the eve of the Geneva conference in 1947? Because tariff compilations from this period
do not exist, the starting point of the GATT has never really been determined. A frequently cited
figure is that average tariffs in 1947 were 40 percent; this figure can be traced back as far as the
World Bank’s flagship World Development Report for 1987, which stated
From the end of World War II until 1974, protectionism seemed to be in decline.
Successive rounds of negotiations in the GATT had cut tariffs on trade in manufactures –
from an average level of 40 percent in 1947 to between 6 and 8 percent for most of the
industrial countries – even before the last round of multilateral trade negotiations (the
Tokyo Round, 1974-79) had taken place. (World Bank 1987, 134-35)
A 40 percent figure for average tariffs in 1947 would imply that the first 15 years of
GATT negotiations made enormous progress in reducing applied tariffs. Unfortunately, although
this figure has been widely cited, no source was provided and it has never been verified. By

2
contrast, the World Trade Organization (2007, 207) later suggested average tariffs at the time of
the GATT’s founding were “situated in a range between 20 and 30 per cent,” implying that early
applied tariff reductions were more modest.
The initial level of the average applied tariff matters for how we assess the GATT’s early
success in reducing tariffs. Going from 40 percent in 1947 to 15 percent in 1964 is quite different
from going from 20 percent to 15 percent.
Determining the GATT’s actual starting point is also relevant to a growing body of
contemporary research, both theoretical and empirical, that seeks to provide conceptual
foundations for the role and impact of the GATT and WTO, as well as to provide empirically-
based estimates of their impact.1 First, such pre-GATT tariff estimates may be a useful
benchmark to compare against the non-cooperative Nash tariff that one might calculate in a
computational model as the outcome of a multi-country “trade war.” For example, Ossa (2014, p.
4122) finds in his seven-country computational model that the “median Nash tariff across all
countries is 58.1 percent which is remarkably close to the average tariff of 50 percent typically
reported for the trade war following the Smoot-Hawley Tariff Act of 1930.” Second, such
estimates are important for understanding and contextualizing the outcomes of negotiations
under the early GATT Rounds, the micro-level bargaining analysis of which is subject to
research given newly available de-classified data (for the Torquay Round of 1951, see Bagwell,
Staiger and Yurukoglu 2015).
In this paper we review the scattered and incomplete evidence on tariff levels circa 1947
in an attempt to pin down the GATT’s starting point. We provide some new evidence on tariff
levels and perform some new calculations (such as backcasting tariff rates from the 1960s) to
shed light on the likely height of tariff barriers in place at this time. Our results indicate that
average tariff levels for the major GATT participants were about 22 percent, much lower than
the oft-cited 40 percent figure. This leads us to the conclusion that the tariff reductions
negotiated in the initial GATT rounds had a modest impact on average tariff levels. We also
provide statistical evidence on whether the early GATT participants experienced noticeable
reductions in their average tariffs as a result of the first negotiating rounds. Here we find some
1 Recent surveys include Bagwell, Bown and Staiger (forthcoming) and Anderson (forthcoming).

3
evidence of lower tariffs resulting for the GATT core of the United States, United Kingdom,
Canada, and Australia, relative to other contracting parties and non-GATT participants.
Finally, and although we find that the reduction in the average applied tariff before the
Kennedy Round was apparently modest, this does not lead us to conclude that the GATT’s early
contribution to trade liberalization was unimportant. For in addition to facilitating applied tariff
reductions, the early GATT accomplished many things, most of which are arguably much more
difficult to measure and thus to capture empirically in summary statistics. These would include
binding the negotiated tariff reductions for an extended period (made more permanent in 1955),
establishing the generality of nondiscrimination through most-favored nation (MFN) treatment
and national treatment, ensuring increased transparency of trade policy measures, and providing
a forum for future negotiations and for the peaceful resolution of bilateral disputes. All of these
elements contributed to the rationalization of trade policy and the reduction of trade barriers and
policy uncertainty. The focus of this paper is simply on one element of the GATT’s contribution,
the reduction in average applied tariff levels.
2. Methods for measuring average tariff levels
Before presenting data on tariff levels for the period, the term “average tariffs” deserves
discussion. There is no unique way of measuring the level of a country’s tariff or comparing
tariff levels across countries. In this section we therefore introduce the predominant approaches
and discuss the tradeoffs associated with each.
2.1 Trade-weighted average tariffs
The easiest method for calculating average tariffs is to simply use the weighted average tariff,
where the weights are the value of imports. This average tariff measure is straightforward to
construct because it can be readily calculated from only two pieces of aggregate-level data for a
country: it is defined as the value of a country’s total customs revenue divided by the value of its
total imports. Because data on these two components are frequently available, this measure can
be easily calculated even without requiring access to the individual, product-specific rates of

4
duty in the country’s tariff code. For the United States, for example, data is reported on both the
trade-weighted average tariff on total imports and the trade-weighted average tariff on dutiable
imports.2
The most important problem with the import-weighted average tariff measure is its
downward bias. Because imports of goods subject to high duties will be very small, those duties
will receive low weights in the index; prohibitive duties will receive no weight in the calculation
at all. An alternative approach to trade-weighting would be to use the imports of ‘someone else’
(e.g., the rest of the world) as opposed to the importing country itself, in order to construct the
weights used in the measure. Of course, the major problem concern introduced by such an
approach is that the measure is then no longer easily calculable from the readily available,
aggregate-level customs revenue and total import value data. That is, such an approach would
require detailed information on product-level tariff rates and product-level imports (of the
‘someone else’) and this would also require that the products be categorized under the same
classification scheme across countries. As we describe in more detail below, achieving a
product-level classification scheme consistently defined across countries is a relatively recent
(late twentieth century) historical phenomenon.
Second, in comparing the tariff levels of two countries, a higher trade-weighted average
tariff does not necessarily mean that trade is more restricted or that it imposes a greater welfare
cost than a lower tariff. The Anderson and Neary (2005) “trade restrictiveness index” is an
alternative method, albeit a fairly complicated and computationally challenging one, that
attempts to deal with these problems in order to draw economic inference from measures of
import protection.3
Third, for the inter-temporal assessment of tariff policy changes, another problem with
relying on trade-weighted averaging especially is that the weights (imports) may change from
year-to-year for reasons that are completely independent of policy changes. For example, a
2 These two measures often diverge substantially because many imports are given duty free status in the tariff code. Unfortunately, other countries do not report the average tariff on dutiable imports, which might be a more accurate indication of a country’s protective duties on imported manufactures. Lloyd (2008) reports such data for Australia. 3 Empirical applications and estimating such trade restrictiveness indices on contemporary tariff data include Kee, Nicita and Olarreaga (2008, 2009) and Kee, Neagu and Nicita (2013) and on US historical tariff data includes Irwin (2010).

5
negative supply shock abroad (drought, floods, etc.) could lead to a severe decline in imported
quantities of certain products that will affect the relative weighting. This could similarly result
from product- or industry-specific (positive or negative) demand shocks at home. For this reason,
it is often difficult to interpret changes in the import-weighted average tariff as necessarily
reflecting a change in commercial policy that would arise through changes to the official tariff
rates.
2.2 Simple average tariffs
A second approach is to simply take an unweighted average of all tariff rates across all products
within a country. However, unlike the trade-weighted average which can be calculated solely
from data on customs revenue and the total value of imports, calculation of even the simple
average requires much additional information. Furthermore, even if the problems of the
availability of such additional information can be overcome (so that the measure can be
constructed), there remain difficulties in drawing inference from cross-country and inter-
temporal comparisons of simple average tariffs.
The first requirement for construction of a simple average tariff is the conversion of all
non-ad valorem tariffs – e.g., specific duties, compound rates, etc. – into ad valorem equivalent
rates. This requires, at a minimum, additional information on import prices.
The second requirement is of access to detailed, consistently-defined, product-level tariff
rates listed in the tariff code. If the unweighted average is simply an arithmetic average of the
duties in the individual lines in the tariff code, the calculation is potentially misleading if there
are many rates for a small number of imports and few rates for the broadest base of imports.4
Thus it may be difficult to compare across countries if two countries do not have the same
nomenclature defining the scope of products and tariff lines. The Brussels tariff nomenclature
(BTN) was not established by the Customs Co-operation Council until December 1950 and
slowly came into use during that decade. It is only after this time that disaggregated tariff
averages could be usefully compared across countries. The lack of something comparable for the
4 To take an extreme example, if a country has only two tariff lines and two rates of duties, 100 percent on imported rhinoceroses and 0 percent on everything else, the average duty is 50 percent because every duty gets a weight of 1/n in the calculation where n is simply the number of tariff lines.

6
early post-war era is likely to severely hamper any “bottoms up” effort to generate average tariff
measures that would build from the product level. And, of course, the United States never
adopted the BTN.
The concerns associated with this second requirement are particularly relevant for trade
policy analysis even until 1988, the point at which the major trading economies finally
introduced and adopted the common, Harmonized System (HS) for product-level tariff
classification.5 One of the resulting benefits has been to make such accounting exercises for
constructing measures of average tariffs potentially more meaningful across countries and over
time; however, it is important to note that this innovation did not arise until relatively late in the
twentieth century.
Finally, in addition to there being no ideal weighting scheme to comprise a tariff index or
tariff average, it is also important to note that even basic information on tariffs was not readily
available in the 1930s and 1940s.6 While the United States was transparent about its tariff code,
this was not the case for most other countries. And for the tariff schedules of the leading
countries that may have existed, no government or international organization made the effort to
present a compilation of rates that are comparable across countries. Only by the Kennedy Round
in the 1960s did GATT negotiators have access to detailed figures about average tariffs using
various weighting schemes. We will show later how the different calculations under these
schemes affect the reported tariff averages.
3. Initial evidence based on trade-weighted and simple average tariffs
Unlike today, there was no GATT or WTO secretariat in 1947 that could present compilations
and summary statistics on the tariff codes of the participating governments. In addition, it is only
recently that official, declassified documents have begun to be made publicly available so as to
5 Since 1988, the Harmonized System has adopted a definition of roughly 5200 products that are common at the 6-digit level across all countries. The products at the 6-digit level are also consistently defined over time, subject to revisions – e.g., taking place in 1996, 2002, 2007, and 2007 – that have changed the definition of upwards of 200 products at each revision. 6 The League of Nations (1927) presented some tariff index numbers in preparation for the 1927 World Economic Conference.

7
allow researchers to potentially judge the results of the first few GATT rounds.7 Thus this
section describes some sources that we can use to fill in the gaps in our knowledge until such
tariff schedules of different countries are analyzed in greater detail.
3.1 Trade-weighted average tariffs in 1947 and peak tariffs over 1929-1947
Table 1 presents the first set of evidence, which is based on the import-weighted average tariffs
for 1947 and other selected years over the 1929-1964 period for the main GATT participants as
well as a number of other major economies for which data is available.8
The column for 1947 (Geneva) lists the average tariff in that year and indicates relatively
low tariffs of under 10 percent for most of the countries. By this measure, India and Canada have
tariffs of about 11 percent, New Zealand at about 20 percent, Australia nearly 30 percent, and the
United Kingdom at more than 40 percent.
The average tariff levels were lower in 1947 (even before the first GATT tariff reductions
had been negotiated and implemented) than in 1939 for all reported countries with the exception
of New Zealand, Peru, Spain and the United Kingdom. Thus, in terms of tariffs, the situation
appears to have improved in the immediate postwar period relative to the prewar period. The
lower postwar duties may be due to inflation and specific duties; this is certainly the case for the
United States, but the degree to which other countries used specific duties is not as well known.
Of the exceptions, the substantially higher average tariffs for the UK may be due to fiscal
reasons. However, and with the exception of the UK, the data presented in Table 1 do not
suggest average tariffs in 1947 were close to 40 percent for any of these countries.
Another possibility is that countries had already reduced their average tariffs substantially
by 1947, and so scholarly reference to “pre-GATT” tariffs at rates of 40 percent or more had in
mind the peak levels that took place either during, or in the aftermath of, the Great Depression. 7 The results of the first bilateral negotiations have recently been posted on the WTO website: https://www.wto.org/english/docs_e/gattbilaterals_e/indexbyround_e.htm . Nevertheless, even eventual analysis of detailed tariff schedules in place at the time will still run into the averaging “problems” described in the last section that are associated with inconsistent product nomenclatures across countries and over time. 8 The average tariff is calculated as the value of customs revenue divided by the value of imports. Like Clemens and Williamson (2004), our source is International Historical Statistics (Palgrave Macmillan, 2013) originally compiled by Brian Mitchell and now edited and updated by Palgrave Macmillan.

8
We examine this possibility as Table 1 also reports the peak level for the trade-weighted average
tariff by country over the 1929-1947 period. However, while the peak levels were significantly
higher than 1947 (or even 1939) levels for most all countries, for only five (Australia, India, New
Zealand, Portugal and UK) of the 25 countries in Table 1 did the peak average tariff even reach
40 percent.
For the United States, the average import-weighted tariff on total imports was 8.2 percent
in 1947 and the peak trade-weighted tariff in the United States over the 1929-1947 period
reached 24.4 percent in 1932. One contributing explanation as to why the U.S. average tariff in
1947 is so low is because 61 percent of imports (by value) at the time were duty free (USITC,
2014). The U.S. International Trade Commission also reports the average tariff on dutiable
imports, which is calculated as collected duties divided by dutiable imports. The U.S. average
tariff on dutiable imports alone in 1947 was 20.1 percent,9 and this measure of tariffs for the U.S.
peaked at 59.1 percent in 1932. While this particular data series is not, to our knowledge,
systematically available for all GATT countries for this time period, it is possible that scholars
could be making reference to this series (at least for the United States) when they are describing
pre-GATT average tariffs at 40 percent or above.
Of course, as already noted, the import-weighted average tariff may also be downward
biased. Later figures will allow us to assess the extent of that potential bias.
3.2 Later evidence: simple average tariffs
While the trade-weighted average tariff data contained in Table 1 are the only broad tariff
measures that exist, to our knowledge, for the period just prior to the first GATT negotiations in
1947, the discussions that eventually led to the European Common Market meant that more
attention was paid to European tariff levels throughout the 1950s. As a result, published reports
of tariff averages become available, although still relatively infrequently.
9 The US International Trade Commission (USITC 2014, Table 1) reports values for the trade-weighted average tariff data that are slightly different from that reported in the International Historical Statistics and which we report in Table 1. In particular, they find the US trade weighted average tariff to be 7.9 percent as opposed to 8.2 percent in 1947.

9
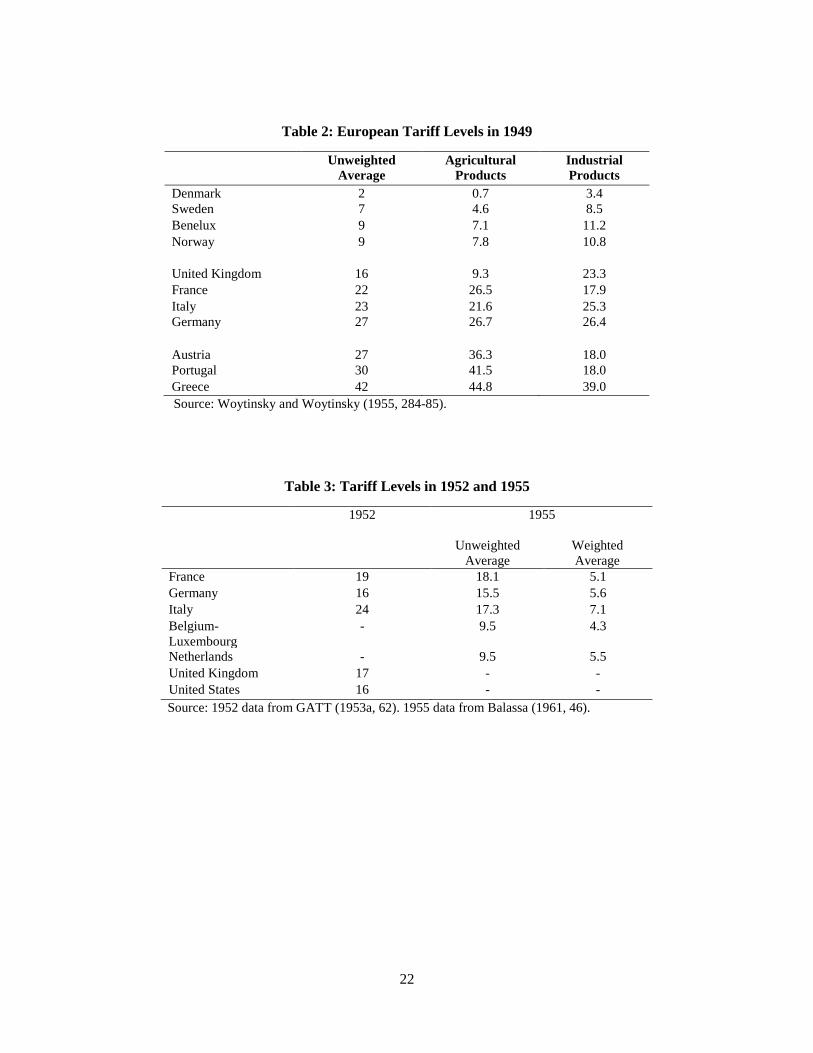
One of the first compilations was in Woytinsky and Woytinsky (1955), which is
presented in Table 2 as an unweighted tariff average for 1949 (after the first Geneva Round but
before the second Annecy Round).10 While Benelux and Scandinavian countries have low tariffs
at under 10 percent, the larger continental European countries of France, Germany, and Italy as
well as the United Kingdom have higher tariffs ranging from 16 to 27 percent.11 Furthermore, a
comparison of these simple averages in Table 4 with the 1949 trade-weighted averages reported
in Table 1 reveals mixed results – for Denmark, Sweden, and UK the simple average is lower,
whereas for Benelux, Norway, France, and Portugal the simple average is substantially higher.
Table 3 presents two sources of data on tariff levels in 1952 and 1955. The 1952 data
originally appeared in a 1953 GATT report, although unfortunately the report provides no details
on how it was calculated. The 1955 data are from two German publications as reported by
Balassa (1961) and show the difference between the import-weighted average and the
unweighted average. The difference in levels between these two figures indicates that the 1952
tariffs reported by the GATT are unweighted averages. These sources also indicate that the
average tariff across Western Europe was about 16 percent in the early 1950s.
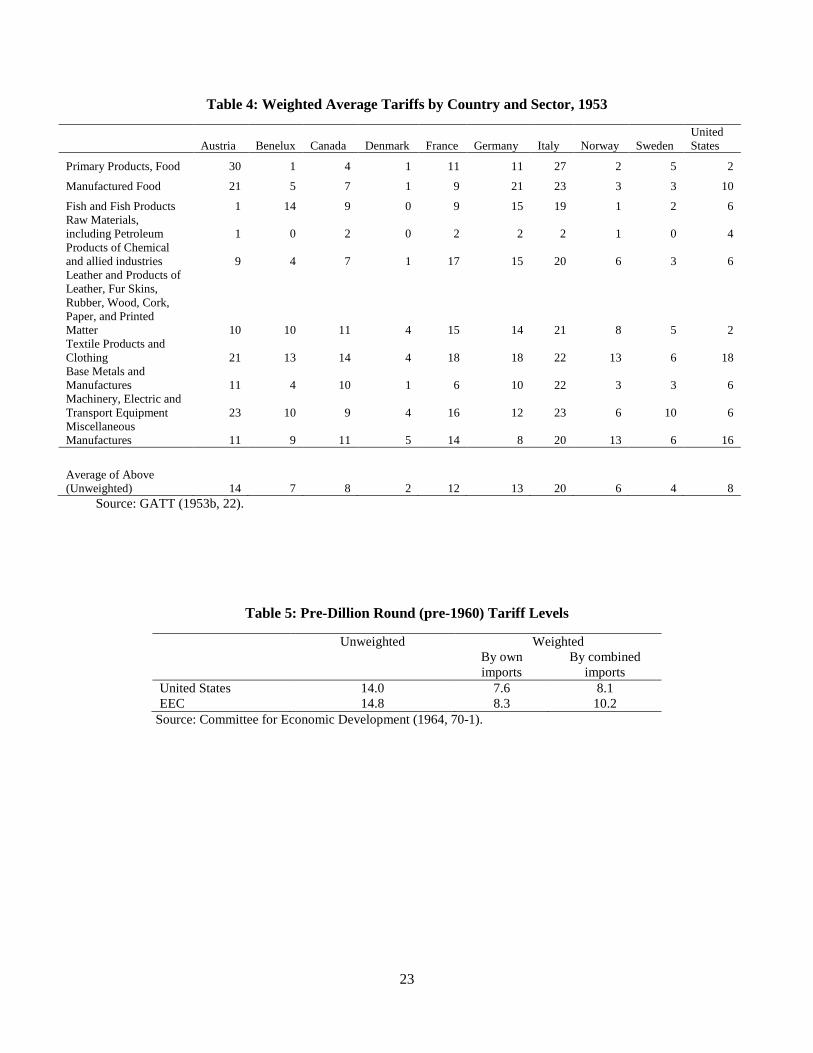
Table 4 presents disaggregated tariff data (based on the Brussels product classification)
compiled by the GATT in 1953 for use in future tariff negotiations. This table reveals that the
unweighted average of tariffs was about 12-13 percent for Germany and France and 7-8 percent
for Benelux, Canada, and the United States.
This exhausts our findings for tariff averages that were compiled for the late 1940s and
early 1950s. The general conclusion that emerges is that European tariff levels were in the 15-20
percent range during this period, although Benelux and the Scandinavian countries had lower
tariffs than the larger continental European countries and the UK.
10 The source for the Woytinsky data is given as Groupe d’Études pour l’Union Douanière Européenne, Comité Spécial Restreint de la Nomenclature, Average Rates of Duty dated 31 August 1949 and Draft Revised Tariff Nomenclature in two volumes published in Brussels in 1950. 11 However, the WTO (2007, 206) reports: “A recalculation of the Woytinski results showed several inaccuracies. For some of the low rate countries errors in the averaging calculations were found which imply that the, relatively low, average rate for Denmark and Norway had been actually somewhat higher than reported. For Austria, Germany and Greece, however, the estimates are upward biased, as the underlying trade flows (and prices) refer not to 1950 but to pre-World War II imports with their much lower average prices. Therefore the actual average tariff rates of Austria and Germany (both not yet Contracting Parties in 1950) had been far less above the country group average than indicated by Woytinski and Woytinski (1955).”

10
Once we move into the late 1950s and especially the early 1960s, published data on
average tariff levels are more readily available.12 In 1958, the EEC was formed with its common
external tariff, which required extensive tariff harmonization among the six European
participants. In addition, the United States was preparing to launch the Kennedy Round, whose
purpose was to reduce the external tariff of the EEC and hence the margin of preference for
intra-EEC trade. Tables 5, 6 and 7 present average tariffs for the late 1950s and early 1960s prior
to the Kennedy Round negotiations. Table 5 shows the average U.S. and EEC tariff before the
1961-62 Dillon Round. This table also reveals the bias of import-weighted versus unweighted
tariff averages. In both the U.S. and EEC, the import-weighted tariff is about 8 percent whereas
the unweighted tariff is about 14 percent. Therefore, the unweighted average tariff is about
double the weighted average tariff.
Tables 6 and 7 show the pre-Kennedy Round average tariffs that are, once again, in the
low teens. However, these tariffs are for dutiable imports, meaning that duty free imports have
not been included in the calculation. Still, the unweighted tariffs are in the mid-teens for both the
U.S. and EEC; the weighting scheme seems to be much less important in considering only
dutiable imports.
In sum, from the evidence that we have been able to compile, the average tariff in the
mid-1950s for the major players in the GATT was in the range of about 15 percent.
4. United States: evidence on levels and cuts
This section provides additional information on the tariff level and reductions in U.S. tariffs
during this period. As the World Trade Organization (2007, 205) reports: “To our knowledge the
only comprehensive estimate concerning the average tariff reduction rate in the first GATT
Round of tariff negotiations is provided by the United States Tariff Commission for U.S. tariffs.”
The United States is the most transparent country in terms of its tariff policy, and also the
country with the best information on its average tariff. In 1947, the average U.S. tariff on total
imports was 7.9 percent and the average tariff on dutiable imports was 20.1 percent. This had
12 For a look at European tariff levels pre-EEC, but unfortunately highly disaggregated without import weights, see Political and Economic Planning (1959).

11
already come down sharply from pre-war levels; the rates were 14.4 percent and 37.3 percent,
respectively, in 1939. As Irwin (1998) points out, this decline is mainly due to the impact of
higher inflation during and after the war in reducing the ad valorem equivalent of the many
specific duties in the tariff code.13 Throughout the 1950s, the average tariff on imports was about
6 percent and the average tariff on dutiable imports was about 12 percent; neither of these figures
changes much over the course of the decade.
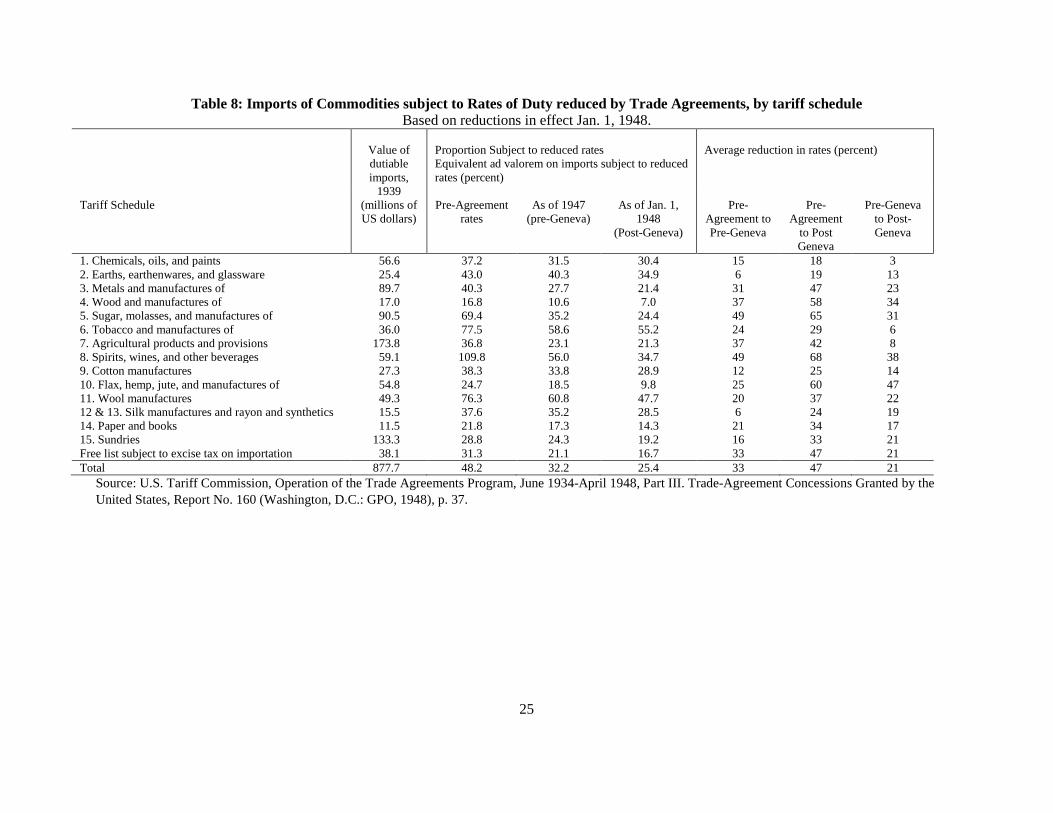
The Tariff Commission (1948) also presented clear details on the degree to which U.S.
tariffs were reduced in the reciprocal trade agreements reached in the 1930s as well as the 1947
Geneva negotiations. Table 8 reports the average pre-agreement rates (those established in the
Tariff Act of 1930, the infamous Smoot-Hawley tariff), those that prevailed in 1947 prior to the
Geneva conference, and those implemented in 1948, the year after the GATT was created. As
Table 8 reports, the average tariff on goods (subject to negotiated rate changes) was 32 percent in
1947 and 25 percent in 1948, an average reduction associated with the timing of the Geneva
Round of 21 percent.
Furthermore, Table 8 also suggests that while the average pre-agreement tariff for the
United States was 48 percent, the bilateral agreements under the Reciprocal Trade Agreements
Act of 1934 reduced those tariffs by a third, cutting them to 32 percent by 1947. These tariff
changes are based on fixed weights (imports in 1939) and therefore focus exclusively on change
in tariff rates as a result of trade negotiations. The calculation does not take into account the
impact of higher import prices or changing import composition in changing the import-weighted
average tariff during this period.
Finally, Table 8 also provides useful information on the variation in tariff reductions
across different tariff schedule categories for the United States during this period. Some
schedules saw large reductions (duties on flax, hemp, and jute manufactures were cut by 47
percent), while others were cut very little (chemicals and oils were cut by only 3 percent) in the
first round.
13 See also Crucini (1994).

12
5. Backcasting to 1947
Given the lack of any official information on tariff levels circa 1947, one way to ascertain those
levels is to take later tariff levels known with confidence and to “backcast” (as opposed to
forecast) the 1947 tariff levels based on the tariff reductions that are thought to have taken place.
As we have seen, the earliest, most solid estimates of the post-war average tariff come
from calculations done during the Kennedy Round. Around 1964, before the Kennedy Round
tariff cuts had been negotiated, the average combined tariff for the United States, European
Economic Community (EEC-6), the United Kingdom, and Japan – the four major players – was
14 percent. This figure is based on the import-weighted average of tariff rates in each of the four.
The country tariff averages are from Preeg (1970, 208-11), also presented here as column 1 of
Table 6 and column 2 of Table 7. These are combined together in one figure by weighting the
four tariffs by the region’s value of imports in 1964; these weights are 0.4 for the EEC, 0.3 for
the United States, 0.175 for the UK, and 0.125 for Japan (WTO 2007, p. 208).
Table 7 reveals two main results. First, the average tariffs were roughly comparable
across countries, ranging from 12.8 for the EEC to 16.6 for the UK. Second, the weighting
scheme (whether unweighted or weighted by world imports or the country’s imports) does not
make a large difference to these country averages.
If we therefore accept that the average tariff was about 14 percent before the Kennedy
Round – something that Table 7 seems to confirm – what does this imply about the average tariff
prior to the 1947 Geneva Round? Fortunately, the percentage average tariff reduction – but not
the average tariff level – in each of the previous GATT rounds is widely reported. As Table 9
reports, the average tariff reduction in the first Geneva Round was estimated to be 26 percent,
followed by 3 percent in the Annecy Round, 4 percent in the Torquay Round, 3 percent in the
Geneva Round, and then 4 percent in the Dillon Round. This amounts to a cumulative tariff
reduction of 36 percent. Where do the figures on the tariff cuts by round come from? These
figures are based on the concessions made by the United States, the country with the most
transparent trade policy of the period, and reported by the Tariff Commission.14 However, this
figure may exaggerate the amount by which all average tariffs were reduced because the United
14 See Finger (1979, Table 1 and 10) for a discussion of the tariff reductions and information on the Tariff Commission reports.

13
States was thought to have made most of the concessions in the first negotiating round.15 In
addition, the 26 percent reduction excludes U.S. agricultural tariffs; for all products, as we have
seen, the average tariff reduction was 21 percent (Table 8, last column).
If the United States made the most significant tariff reductions during this period, as is
commonly thought, applying these cuts to other countries should give us an upper bound of the
level of the tariff in 1947. Thus, applying these tariff reductions to the 14 percent pre-Kennedy
Round average tariff implies that the average tariff was 21.8 percent in 1947, and fell to 16.8
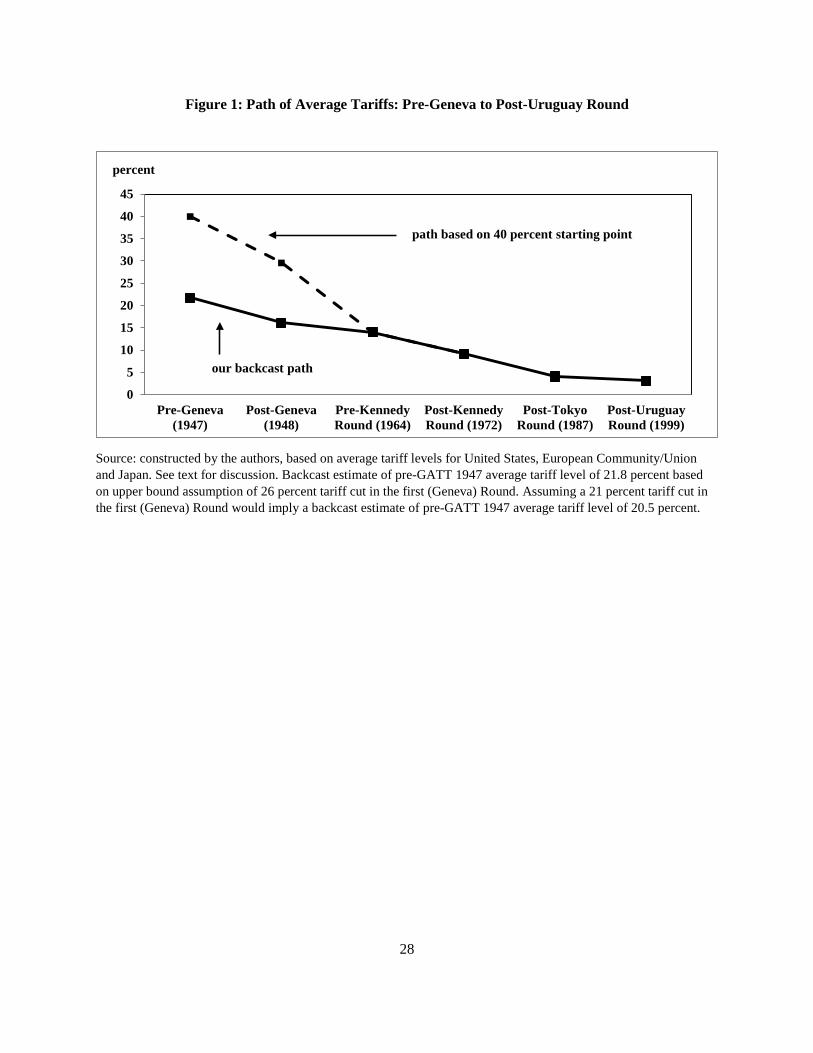
percent following the first Geneva conference. This is depicted in Figure 1, which shows two
paths for average tariffs, one starting at 40 percent and the other at 21.8 percent. If tariffs had in
fact been at 40 percent in 1947, the average tariff level would have been subject to enormous
cuts prior to the Kennedy Round. The calculation presented here, in which the average tariff was
about 22 percent in 1947, shows that the downward path of average tariffs was slower but
smoother. If the tariff going into the 1947 GATT negotiation was as high as 40 percent, then
given the degree of tariff cutting that took place, the average tariff should have been about 26
percent prior to the Kennedy Round instead of the actual figure of 14 percent.
One way to verify this calculation is to take the GATT’s calculated average tariffs for
1952, presented in Table 5, and see if it matches that which emerges from the backcast. The
Table 3 average is 18.4 percent for 1952; the average is about 15.3 after the Torquay Round (not
weighted across countries). According to our backcasting exercise, the average tariff should have
been 15.0 after the Torquay Round, suggesting that this approach is reasonably accurate.
This exercise was based on a 26 percent tariff cut in the first round, but as noted earlier,
that excluded agriculture; the average reduction for all products including agriculture was 21
percent. If that figure is taken to represent the cuts, then the backcast suggests the average tariff
in 1947 was 20.5 percent.
15 As the WTO (2007, 181) notes: “We lack appropriate data to gauge the precise extent of the tariff cuts. Only for the United States is a detailed analysis available. However, it is generally recognized that the United States made the most generous tariff concessions reflecting its strong economic situation and relatively high level of tariff protection.” The WTO (2007, 206) also states: “For France and the United Kingdom, no average rate of reduction has been provided in the various government reports dealing with the results of these negotiations. The tariffs of the Benelux countries at the time had been recognized to be well below the average prevailing in the other industrial countries and therefore these countries made concessions principally by binding most of their tariffs at the already low levels. It is therefore plausible to assume that the average tariff reduction on industrial products of all industrial countries achieved in 1947 was somewhat less than the reduction observed for the United States.”

14
We can also back out the average tariffs for the United States, EEC, and Japan for 1947.
Using the 26 percent cut for the first round, the backcast 1947 tariff would be 21 percent for the
U.S., 20 percent for the EEC, and 23 percent for Japan. (The figures would be slightly lower
taking the first round cut as 21 percent; in this case, the results would be 20 percent for the U.S.,
19 percent for the EEC, and 21 percent for Japan.) The one check that we can do on this result is
for the United States: in 1947, the average (import-weighted) tariff on dutiable imports was 20
percent, essentially the same as our backcast result for that year.
6. Assessing the average tariff data: is the time path meaningful?
Having established the average unweighted level of the tariff in 1947 at about 22 percent, we
next return to our data on the import-weighted tariff average in order to examine empirically
whether there are discernable reductions to this particular measure of tariffs following the initial
GATT negotiating rounds. One way to assess whether the data on trade-weighted average tariffs
presented in Table 1 is at all informative, for example, is to examine whether it is at least
consistent with other accounts of the results of the GATT tariff negotiations taking place at the
time. It is worth recalling our discussion in Section 2, however, that these particular tariff
measures are probably inferior to the unweighted tariff averages: they are downward biased,
changes in these particular tariff measures may reflect factors other than changes in official tariff
rates, and these other factors include import prices and the composition of imports, both of which
were changing rapidly in the immediate postwar period. Nevertheless, the advantage of these
measures is that they are available on an annual basis; thus we examine whether they reveal
evidence on the tariff reductions undertaken during this period.
We perform a set of difference-in-difference regressions to help assess whether the inter-
temporal patterns in the import-weighted average tariff data over the 1944-1959 period of the
first few GATT Rounds provide useful information. In particular, we examine whether the
average tariffs for the active GATT participants at the 1947 inception – what we refer to as the
“core” GATT Contracting Parties of Australia, Canada, United Kingdom, and United States –
had larger subsequent reductions in their average tariffs during the initial rounds than “other”
(comparison group) countries. We consider two definitions for the set of other comparison group
countries: the first definition includes all other countries listed in Table 1, a mix of initial GATT

15
1947 Contracting Parties and countries that only joined later; the second definition is only the
eight other initial GATT 1947 Contracting Parties listed in Table 1 (Belgium, Brazil, Chile,
France, India, Netherlands, New Zealand, and Norway).
Table 10 presents our regression estimates on average tariff data covering the years 1944-
1959. The data are in “long-differences” in which the dependent variable is defined as the three-
year difference in trade-weighted average tariffs.16 The two main sets of regressors are dummy
variables for the years (1947, 1950, 1953, 1956, and 1959) and year dummies interacted with an
indicator for the importer being one of the four “core” GATT Contracting Parties. In columns (1)
and (2), the comparison group of countries includes all of the other countries listed in Table 1 for
which there is available data, and in columns (3) and (4) the comparison set of countries is only
the other initial (non-core) GATT 1947 Contracting Parties. In columns (1) and (3), the annual
percent change in average tariffs is constructed using conventional methods, whereas the
robustness checks provided in columns (2) and (4) use log differences in trade-weighted average
tariffs.
Columns (1) and (2) of Table 10 suggest that, when looking at three-year differences in
tariffs, there is no (robust) statistically significant change in average tariffs across the full sample
of countries arising in 1947, 1950, 1953, 1956, or 1959. For the smaller sample of just GATT
1947 Contracting Parties (columns 3 and 4), there is evidence of a statistically significant
increase in average tariffs across those countries arising in 1953 relative to their levels in 1950.
The main result of interest in Table 10 is found in the bottom set of rows, which presents
estimates of the interaction of the year dummies with an indicator for whether the country was
one of the core GATT 1947 Contracting Parties of Australia, Canada, UK, and United States.
Indeed, relative to the full sample of countries (columns 1 and 2), there is a negative and
statistically significant differential estimate (-0.55 and -0.48, respectively) for the changes in the
average tariffs for those four countries in 1950 relative to their average tariff levels in 1947. In
particular, whereas the average tariff across the entire sample of countries was 29 percent higher
in 1950 than 1947, the statistically significant differential estimate in column (1) implies that the
16 This is opposed to a regression framework analyzing annual changes in tariffs, which yields qualitatively similar results. Focusing on three year changes may better reflect the cumulative effective of a given tariff cut over a couple of years. Finally, while the utilized data cover 1944-1959, because the regressions examine three year changes in average tariffs, the regressions ultimately cover changes in tariffs over the 1947-1959 period.

16
average tariff was 26 percent lower (=0.29-0.55) for the four core GATT Contracting Parties in
1950 relative to 1947. This statistically significant differential for these four countries is robust
across model specifications of Table 10, and the estimates are of a cumulative average tariff
reduction from 1947 to 1950 for the four countries ranging between 26 and 31 percent.
Furthermore, for the regressions on the subsample of only GATT 1947 Contracting
Parties (columns 3 and 4), a second result is that average tariffs increased across the sample by
an average of 16-20 percent between 1950 and 1953. However, relative to only these other
GATT 1947 Contracting Parties, average tariff changes for the four core GATT Contracting
Parties were statistically different from the sample average in columns (3) and (4), with
differential estimates of -0.65 and -0.49, respectively. Overall, despite tariffs for the GATT
Contracting Parties increasing on average between 1950 and 1953, average tariffs for Australia,
Canada, UK, and United States managed to remain flat between 1950 and 1953.
Combined, the estimates for the changes in 1950 and 1953 reflect the cumulative effect of
tariff liberalization differentials arising for these four countries (relative to the other GATT 1947
Contracting Parties) after the Geneva (1947), Annecy (1949), and Torquay (1951) Rounds of
GATT negotiations. Thus we conclude that, relative to other 1947 GATT Contracting Parties as
well as a wider sample of countries, average tariffs for the four core GATT Contracting Parties
were significantly lower by 1953 than their 1947 levels.
Finally, it is also worth noting for the core countries that, relative to the average across
both the full sample of countries (columns 1 and 2) and the smaller sample of GATT 1947
Contracting Parties (columns 3 and 4), their pre-GATT “starting point” trade-weighted tariffs
were significantly higher in 1947 than they had been three years earlier (in 1944). In particular,
the column (1) estimate indicates that average tariffs for Australia, Canada, UK, and United
States were 129 percent higher in 1947 than in 1944.17 Nevertheless, it is extremely doubtful
that these tariff increases reflected changes in applied tariff rates as opposed to changes in the
composition of trade as a result of the end of World War II. For example, Canada did not change
the rates in its tariff code during this period (Hart 2003). 17 Between 1944 and 1947, trade-weighted average tariffs in Australia increased from 8.6 to 27.9 percent, in Canada from 6.5 to 11.4 percent, and in the UK from 24.5 to 44.0 percent. Among the Core countries, only in the US did the tariffs fall between 1944 and 1947, from 10.6 to 8.2 percent. Lloyd (2008) offers strong caution in interpreting the tariff figures for Australia during this period.

17
7. Conclusion
This paper has attempted to shed light on the height of tariff barriers on the eve of the 1947
Geneva conference that established the GATT and negotiated the first postwar tariff reductions.
We find that the average tariff among the key GATT participants – the United States, Western
Europe, and Japan – was about 22 percent at the time of the first Geneva conference,
significantly lower than the oft-reported 40 percent figure (World Bank, 1987). This figure refers
to the unweighted tariff average; the import-weighted tariff average would be much lower than
this. In addition, we report limited econometric evidence of significant tariff reductions by the
key early GATT participants – the core of the United States, United Kingdom, Canada, and
Australia – but not for others in the late 1940s and early 1950s.
While it is beyond the scope of this paper to determine the economic effect of these tariff
reductions, we should point out that the early tariff reductions were thought to have a muted
impact on world trade flows, largely due to the presence of other nontariff barriers in place at the
time. In particular, the co-existence of import quotas and foreign exchange controls (European
currencies were not fully convertible into dollars until 1958) meant that tariff reductions by
themselves may have had little impact on trade.18 Nevertheless, Goldstein, Rivers, and Tomz
(2007) use a gravity equation and provide some evidence that the early GATT had a positive and
significant effect on world trade. Pinning down exactly how the GATT boosted early postwar
trade is thus an important topic for further research.
18 As Curzon (1965, 80-81) notes: “It must also be remembered that principally only in the United States (and Canada) were tariff cuts effective during the 1950s. In other countries quotas and exchange controls interfered sufficiently with the trade flow to make any measurement meaningless.” And Brusse (1997) adds: “While the average depth of the tariff cuts negotiated in 1947 stands out quite favorably compared to those of the subsequent rounds, the reductions themselves hardly affected levels of protection. Many rates contained ‘extra margins’ that could easily be cut without changing effective protection levels.”

18
References
Anderson, J.E. and J. P. Neary. 2005. Measuring the Restrictiveness of Trade Policy. Cambridge, MA: The MIT Press.
Anderson, K. Forthcoming. ‘Contributions of the GATT/WTO to Global Economic Welfare: Empirical Evidence’, Journal of Economic Surveys.
Bagwell, K., C. P. Bown, and R. W. Staiger. Forthcoming. ‘Is the WTO Passé?’ Journal of Economic Literature.
Bagwell, K, R. W. Staiger and A. Yurukoglu. 2015. ‘Multilateral Trade Bargaining: A First Look at the GATT Bargaining Records’, NBER Working Paper, No. 21488, August.
Balassa, B. 1961. The Theory of Economic Integration. Homewood, Ill.: Irwin.
Brusse, W. A. 1997. Tariffs, Trade, and European Integration, 1947-1957. New York: St. Martin’s Press.
Clemens, M. A., and J. G. Williamson. 2004. ‘Why Did the Tariff-Growth Correlation Change after 1950?’ Journal of Economic Growth 9(1): 5-46.
Crucini, M. J. 1994. ‘Sources of Variation in Real Tariff Rates: The United States, 1900-1940’, American Economic Review 84 (3): 732-743.
Committee for Economic Development. 1964. Trade Negotiations for a Better Free World Economy. New York: CED.
Curzon, G. 1965. Multilateral Commercial Diplomacy: The General Agreement on Tariffs and Trade and its Impact on National Commercial Policies and Techniques. London: Michael Joseph.
Finger, J. M. 1979. ‘Trade Liberalization: A Public Choice Perspective’, In: R. C. Amacher, G. Haberler, and T. Willett (Eds.) Challenges to a Liberal International Economic Order. Washington, D.C.: American Enterprise Institute.
General Agreement on Tariffs and Trade. 1953a. International Trade, 1952. Geneva: GATT.
General Agreement on Tariffs and Trade. 1953b. Report of the Intersessional Working Party on the Reduction of Tariff Levels. G/53, October 9. Available at: https://gatt.stanford.edu/bin/detail?fileID=17024479
Goldstein, J., D. Rivers, and M. Tomz. 2007. ‘Institutions in International Relations: Understanding the Effects of the GATT and the WTO on World Trade’, International Organization 61(1): 37-67.
Hart, M. 2003. A Trading Nation: Canadian Trade Policy from Colonialism to Globalization. Toronto: UBC Press.

19
Irwin, D. A. 1998. ‘Changes in U.S. Tariffs: The Role of Import Prices and Commercial Policies’, American Economic Review 88(4): 1015-1026.
Irwin, D. A. 2010. ‘Trade Restrictiveness and Deadweight Losses from US Tariffs’, American Economic Journal: Economic Policy 2(3): 111–133.
Irwin, D. A. 2012. Trade Policy Disaster: Lessons from the 1930s. Cambridge, MA: The MIT Press.
Kee, H., C. Neagu, and A. Nicita. 2013. ‘Is Protectionism on the Rise? Assessing National Trade Policies during the Crisis of 2008’, Review of Economics and Statistics 95(1): 342-346
Kee, H., A. Nicita and M. Olarreaga. 2008. ‘Import Demand Elasticities and Trade Distortions’, Review of Economics and Statistics 90(4): 666-682.
Kee, H., A. Nicita and M. Olarreaga. 2009. ‘Estimating Trade Restrictiveness Indices’, Economic Journal 119(1): 172-199.
League of Nations. 1927. Tariff Level Indices. Geneva: League of Nations.
Lloyd, P. 2008. ‘100 Years of Tariff Protection in Australia’, Australian Economic History Review 48(2): 99-145.
Ossa, R. 2014. ‘Trade Wars and Trade Talks with Data’, American Economic Review 104(12): 4104-46.
Palgrave Macmillan, Ed. 2013. International Historical Statistics. Available at: http://www.palgraveconnect.com/pc/doifinder/10.1057/9781137305688.0216 , last accessed: 17 September 2015).
Political and Economic Planning. 1959. Tariffs and Trade in Western Europe. London: George Allen & Unwin.
Preeg, E. H. 1970. Traders and Diplomats: An Analysis of the Kennedy Round of Negotiations under the General Agreement on Tariffs and Trade. Washington, D.C.: Brookings Institution.
United Nations Conference on Trade and Development. 1968. The Kennedy Round: Estimated Effects on Tariff Barriers. New York.
United States International Trade Commission. 2014. U.S. imports for consumption, duties collected, and ratio of duties to value, 1891-2013. Office of Analysis and Research Services, Office of Operations. Available at https://dataweb.usitc.gov/scripts/AVE_table_1891-2013.pdf, August.
U.S. Tariff Commission. 1948. Operation of the Trade Agreements Program, June 1934-April 1948, Part III. Trade-Agreement Concessions Granted by the United States, Report No. 160. Washington, D.C.: GPO.
World Bank. 1987. World Development Report, 1987. Washington, D.C.: World Bank.
20
World Trade Organization. 2007. World Trade Report: Six Decades of Multilateral Cooperation, What Have we Learnt? Geneva: WTO.
Woytinsky, W. S. and E. S. Woytinsky. 1955. World Commerce and Governments. New York: Twentieth Century Fund.

21
Table 1: Weighted-Average Tariff Levels 1929-1964, Selected Years
Customs revenue /
Total value of imports
GATT CP
year
Peak year, 1929-1947
Peak level, 1929-1947 1939
1947 (Geneva)
1949 (Annecy)
1951 (Torquay)
1956 (Geneva)
1960 (Dillon)
1964 (Kennedy)
GATT 1947 Contracting Parties (CPs) Australia 1947 1932 41.2 31.0 27.9 18.8 15.4 8.4 10.6* 9.5*
Belgium 1947 1934 10.7 7.3 4.3 4.1 3.1 -- -- -- Brazil 1947 1933 35.0 20.6 8.2 -- -- -- -- -- Canada 1947 1931 16.6 13.8 11.4 8.2 8.5 9.6 9.1 8.3 Chile 1947 1933 6.2 5.7 4.7 7.5 9.4 -- -- -- France 1947 1935 29.4 23.3 9.3 10.9 12.6 20.0 22.6 22.1 India 1947 1933 40.0 25.8 11.7 19.1 23.9 21.1 18.0 29.8 Netherlands 1947 1935 9.1 7.9 1.6 4.8 4.2 5.1 5.6 6.1 New Zealand 1947 1946 46.1 20.2 20.9 23.3 14.1 10.8 -- 11.8* Norway 1947 1940 15.8 11.3 5.7 3.6 2.8 3.8 4.2 3.7 UK 1947 1946 47.7 29.6 44.0 35.7 25.6 30.7 32.4 36.5 US 1947 1932 24.4 13.3 8.2 5.5 5.5 5.3 6.6 5.3
Other countries Argentina 1967 1932 28.8 22.5* 9.7 -- -- -- -- --
Austria 1951 1963 -- -- -- --
4.3* 8.2 8.3 Denmark 1950 1935 8.2 7.1 3.3 3.0 -- -- -- -- Finland 1950 1931 32.7 20.6 9.7 18.8 10.0 20.5 13.5 -- Italy 1950 1933 25.2 11.2 -- -- 4.2 6.7 6.3 6.0 Japan 1955 1931 6.8 3.6 0.0 0.4 1.6 4.0 6.8 7.7 Mexico 1986 1943 34.5 29.7 14.9 25.0 19.6 19.1 20.8 17.6 Peru 1951 1933 28.0 19.5 26.1 12.6 26.8 -- -- -- Portugal 1962 1935 50.7 37.1 16.1 17.3 20.5 19.2 20.1 17.0 Spain 1963 1946 26.9 10.0* 18.5 14.4 23.8 23.8 13.9 10.4 Sweden 1950 1932 11.9 8.3 5.7 5.6 4.0 4.9 5.4 4.8 Switzerland 1966 1935 23.3 17.5 9.1 10.2 8.4 9.7 11.1 10.9 Turkey 1951 1945 24.6 -- 16.6 14.8 17.1 30.1 -- -- (W.) Germany 1951 1938 33.4 32.6 -- -- 6.8 7.1 7.0 5.1
Source: Compiled by the authors with data from Palgrave Macmillan (2013). Data not available for 1947 GATT Contracting Parties Burma (Myanmar), Ceylon (Sri Lanka), China, Cuba, Czechoslovakia, Lebanon, Luxembourg, Pakistan, South Africa, Southern Rhodesia (Zimbabwe), and Syria. *Indicates data replaced with that from a nearby year, i.e., Argentina: 1939 is 1938; Australia: 1960 is 1959 and 1964 is 1965; Austria 1956 is 1955; New Zealand: 1964 is 1965; and Spain: 1939 is 1940.
22
Table 2: European Tariff Levels in 1949
Unweighted Average
Agricultural Products
Industrial Products
Denmark 2 0.7 3.4 Sweden 7 4.6 8.5 Benelux 9 7.1 11.2 Norway 9 7.8 10.8 United Kingdom 16 9.3 23.3 France 22 26.5 17.9 Italy 23 21.6 25.3 Germany 27 26.7 26.4 Austria 27 36.3 18.0 Portugal 30 41.5 18.0 Greece 42 44.8 39.0 Source: Woytinsky and Woytinsky (1955, 284-85).
Table 3: Tariff Levels in 1952 and 1955
1952 1955
Unweighted Average
Weighted Average
France 19 18.1 5.1 Germany 16 15.5 5.6 Italy 24 17.3 7.1 Belgium-Luxembourg
- 9.5 4.3
Netherlands - 9.5 5.5 United Kingdom 17 - - United States 16 - - Source: 1952 data from GATT (1953a, 62). 1955 data from Balassa (1961, 46).
23
Table 4: Weighted Average Tariffs by Country and Sector, 1953
Austria Benelux Canada Denmark France Germany Italy Norway Sweden
United States
Primary Products, Food 30 1 4 1 11 11 27 2 5 2
Manufactured Food 21 5 7 1 9 21 23 3 3 10
Fish and Fish Products 1 14 9 0 9 15 19 1 2 6 Raw Materials, including Petroleum 1 0 2 0 2 2 2 1 0 4 Products of Chemical and allied industries 9 4 7 1 17 15 20 6 3 6 Leather and Products of Leather, Fur Skins, Rubber, Wood, Cork, Paper, and Printed Matter 10 10 11 4 15 14 21 8 5 2 Textile Products and Clothing 21 13 14 4 18 18 22 13 6 18 Base Metals and Manufactures 11 4 10 1 6 10 22 3 3 6 Machinery, Electric and Transport Equipment 23 10 9 4 16 12 23 6 10 6 Miscellaneous Manufactures 11 9 11 5 14 8 20 13 6 16
Average of Above (Unweighted) 14 7 8 2 12 13 20 6 4 8
Source: GATT (1953b, 22).
Table 5: Pre-Dillion Round (pre-1960) Tariff Levels
Unweighted Weighted By own
imports By combined
imports United States 14.0 7.6 8.1 EEC 14.8 8.3 10.2
Source: Committee for Economic Development (1964, 70-1).

24
Table 6: Tariff Averages, Pre- and Post-Kennedy Round, dutiable nonagricultural imports
Total Manufactures Before After Before After United States 13.5 9.6 14.3 9.9 EEC 12.8 8.1 13.5 8.6 United Kingdom 16.6 10.6 17.8 10.8 Japan 15.5 9.5 17.6 10.7
Source: Preeg (1970, 208-11)
Table 7: Pre-Kennedy Round Average Tariff, by weighting scheme, dutiable nonagricultural products (other than mineral fuels)
Unweighted Tariff Weighted by Own
imports World
imports United States 16.5 13.5 14.5 EEC 13.1 12.8 13.4 United Kingdom 18.2 16.7 17.0 Japan 18.0 15.5 19.0 Source: Preeg (1970, 277-78).
25
Table 8: Imports of Commodities subject to Rates of Duty reduced by Trade Agreements, by tariff schedule Based on reductions in effect Jan. 1, 1948.
Value of dutiable imports,
1939 (millions of US dollars)
Proportion Subject to reduced rates Equivalent ad valorem on imports subject to reduced rates (percent)
Average reduction in rates (percent)
Tariff Schedule
Pre-Agreement
rates
As of 1947
(pre-Geneva)
As of Jan. 1,
1948 (Post-Geneva)
Pre-
Agreement to Pre-Geneva
Pre-
Agreement to Post Geneva
Pre-Geneva
to Post-Geneva
1. Chemicals, oils, and paints 56.6 37.2 31.5 30.4 15 18 3 2. Earths, earthenwares, and glassware 25.4 43.0 40.3 34.9 6 19 13 3. Metals and manufactures of 89.7 40.3 27.7 21.4 31 47 23 4. Wood and manufactures of 17.0 16.8 10.6 7.0 37 58 34 5. Sugar, molasses, and manufactures of 90.5 69.4 35.2 24.4 49 65 31 6. Tobacco and manufactures of 36.0 77.5 58.6 55.2 24 29 6 7. Agricultural products and provisions 173.8 36.8 23.1 21.3 37 42 8 8. Spirits, wines, and other beverages 59.1 109.8 56.0 34.7 49 68 38 9. Cotton manufactures 27.3 38.3 33.8 28.9 12 25 14 10. Flax, hemp, jute, and manufactures of 54.8 24.7 18.5 9.8 25 60 47 11. Wool manufactures 49.3 76.3 60.8 47.7 20 37 22 12 & 13. Silk manufactures and rayon and synthetics 15.5 37.6 35.2 28.5 6 24 19 14. Paper and books 11.5 21.8 17.3 14.3 21 34 17 15. Sundries 133.3 28.8 24.3 19.2 16 33 21 Free list subject to excise tax on importation 38.1 31.3 21.1 16.7 33 47 21 Total 877.7 48.2 32.2 25.4 33 47 21
Source: U.S. Tariff Commission, Operation of the Trade Agreements Program, June 1934-April 1948, Part III. Trade-Agreement Concessions Granted by the United States, Report No. 160 (Washington, D.C.: GPO, 1948), p. 37.

26
Table 9: GATT Tariff Reductions
Implementation Period Round Covered Weighted Tariff Reduction
Weights based on MFN imports (year)
1948
Geneva (1947) -26 1939
1950
Annecy (1949) -3 1947
1952
Torquay (1950-51) -4 1949
1956-58
Geneva (1955-56) -3 1954
1962-64
Dillon Round (1961-62) -4 1960
1968-72
Kennedy Round (1964-67) -38 1964
1980-87
Tokyo Round (1973-79) -33 1976/77
1995-99
Uruguay Round (1986-94) -38 1988/1989
Source: WTO (2007), p. 207.

27
Table 10. Three Year Tariff Differences across Countries, 1947-1959
Dependent variable:
long difference (3yr change) in customs revenue / imports
Explanatory variables Baseline
(1)
Use log differences
(2)
GATT CPs only (3)
GATT CPs and log differences
(4)
Year = 1947 -0.04 -0.07 -0.03 -0.06 (0.06) (0.06) (0.11) (0.10)
1950 0.29** 0.17 0.39 0.19
(0.15) (0.11) (0.29) (0.21)
1953 0.33 0.11 0.20* 0.16*
(0.31) (0.13) (0.10) (0.08)
1956 0.12 0.06 -0.12 -0.17
(0.10) (0.08) (0.10) (0.12)
1959 0.10 0.03 0.20 0.15
(0.09) (0.11) (0.13) (0.11)
GATT core x 1947 1.29*** 0.84*** 1.28*** 0.83***
(0.42) (0.18) (0.46) (0.21)
GATT core x 1950 -0.55*** -0.48*** -0.65** -0.49**
(0.16) (0.13) (0.30) (0.23)
GATT core x 1953 -0.33 -0.11 -0.20* -0.17*
(0.31) (0.13) (0.11) (0.09)
GATT core x 1956 -0.30 -0.32 -0.05 -0.09
(0.19) (0.24) (0.20) (0.27)
GATT core x 1959 0.02 0.08 -0.09 -0.05
(0.11) (0.13) (0.15) (0.13)
Observations 96 96 51 51
R-squared 0.19 0.20 0.46 0.40 Notes: Model estimated without a constant term. Robust standard errors in parentheses, with ***, **, and * indicating estimates statistically different from zero at the 1, 5, and 10 percent level, respectively. Definition of dependent variable in (1) and (3) is (X_t-X_t-3)/X_t-3 and in (2) and (4) it is ln(X_t)-ln(X_t-3), where X is the ratio of customs revenue to imports. Years are 1947-1959, and full sample of 25 countries includes 12 of the original GATT Contracting Parties (“GATT CPs”) of Australia, Belgium, Brazil, Canada, Chile, France, India, Netherlands, New Zealand, Norway, United Kingdom, United States and 13 of the non-original GATT Contracting Parties of Argentina, Denmark, Finland, Italy, Japan, Mexico, Peru, Portugal, Spain, Sweden, Switzerland, Turkey, and West Germany. The core GATT countries defined as Australia, Canada, United Kingdom and United States. Columns (3) and (4) drop all countries that were not original 1947 GATT Contracting Parties.
28
Figure 1: Path of Average Tariffs: Pre-Geneva to Post-Uruguay Round
Source: constructed by the authors, based on average tariff levels for United States, European Community/Union and Japan. See text for discussion. Backcast estimate of pre-GATT 1947 average tariff level of 21.8 percent based on upper bound assumption of 26 percent tariff cut in the first (Geneva) Round. Assuming a 21 percent tariff cut in the first (Geneva) Round would imply a backcast estimate of pre-GATT 1947 average tariff level of 20.5 percent.
0
5
10
15
20
25
30
35
40
45
Pre-Geneva(1947)
Post-Geneva(1948)
Pre-KennedyRound (1964)
Post-KennedyRound (1972)
Post-TokyoRound (1987)
Post-UruguayRound (1999)
percent
path based on 40 percent starting point
our backcast path