the gap in management accounting skills required by venture
TRANSCRIPT

i
THE GAP IN MANAGEMENT ACCOUNTING SKILLS REQUIRED BY VENTURE
CAPITAL PROVIDERS AND THOSE POSSESSED BY SMALL AND MEDIUM
ENTERPRISES IN THE CRAFT INDUSTRY
by
MMUDI DAVID SHAKU
Submitted in accordance with the requirements
for the degree of
MASTER OF COMMERCE
in the subject
Accounting
at the
UNIVERSITY OF SOUTH AFRICA
Supervisor: Prof: PC Du Plessis
Co-supervisor: Prof: CC Shuttleworth
FEBRUARY 2011

ii
Declaration
I declare that “The gap in management accounting skills required by venture capital
providers and those possessed by small and medium enterprises in the craft industry” is
my own work and that it has not been submitted for any degree at any university. All the
sources that I have used or quoted have been indicated and acknowledged by means of
complete references.
Full Names: Mr. MMUDI DAVID SHAKU
DATE: February 2011

iii
Acknowledgements
I would to thank and acknowledge the contribution of each of the following persons:
God Almighty for the strength, courage and perseverance in completing this
dissertation
My supervisor Prof. PC Du Plessis for the professional advice, support and
interest in my study
My Co-supervisor Prof. CC Shuttleworth for the assistance, constructive
suggestions and insightful guidance
My language editor Ms. Glenda Buncombe
Mr. P Kobue for helping me with the statistical analysis of the data
Dr. Mundalamo FJ from Tshwane University of Technology
My beautiful, loving and caring wife Ramadimetje Lydia Shaku for support during
my study
My beloved daughter Kutlwano Shaku
My beloved parents Mr and Mrs Shaku for always encouraging and supporting
me in whatever I do

iv
Abstract
SMEs are considered as the best possible vehicle to reduce the unemployment rate and
increase economic participation in the country, specifically for historically disadvantaged
people. Due to, among other things, the lack of small business management skills, the
potential of SMEs cannot be fully realised.
From the study it was found that one of the major reasons why SMEs fail to secure
loans is a lack of management accounting skills. This lack of management accounting
skills is due to a lack of mentors, training and business education. The study has
identified a number of management accounting skills which most of the venture capital
providers consider when they evaluate applications for loans. From empirical survey it
was considered that budgeting, cash flow management and product costing were
considered as imperative by most venture capital providers.
Keywords: Venture capital, venture capitalists, venture capital providers, management
accounting skills and SMEs
v
TABLE OF CONTENTS
PAGE
CHAPTER 1: INTRODUCTION AND RESEARCH PROBLEM 1
1.1 INTRODUCTION 1
1.2 BACKGROUND OF THE STUDY 2
1.3 PROBLEM STATEMENT 5
1.4 PURPOSE OF THE STUDY 7
1.5 OBJECTIVES OF THE STUDY 7
1.6 IMPORTANCE OF THE STUDY 9
1.7 EMPIRICAL RESEARCH 9
1.7.1 Informal discussions 9
1.7.2 Questionnaires 10
1.8 DATA ANALYSIS 10
1.9 ORGANISATION OF THE STUDY 10
CHAPTER 2: THE CURRENT SITUATION WITH REGARD TO THE VENTURE
CAPITAL MARKETS AND SMES 13
2.1 INTRODUCTION 13
2.2 THE ORIGIN OF VENTURE CAPITAL 14
2.3 VENTURE CAPITAL 17
2.4 VENTURE CAPITAL PROVIDERS 18
2.4.1 Independent private capital providers 19
2.4.1.1 Venture capital firms 19
2.4.1.2 Venture capital trusts 20
2.4.1.3 Angel networks 20
2.4.2 Public-backed organisations 20

vi
2.4.3 Other sources of funds 21
2.5 TYPES OF FUNDS 21
2.5.1 Seed capital 21
2.5.2 Start-up and early stage capital 21
2.5.3 Expansion and development capital 22
2.5.4 Leverage buy-in or buy-out capital 22
2.5.5 Replacement capital 22
2.6 MINIMUM REQUIREMENTS FOR SMEs TO SECURE FUNDS FROM
VENTURE CAPITAL CAPITALISTS 23
2.6.1 Factors considered important by venture capital providers 23
2.6.2 Factors considered important by SMEs 24
2.6.2.1 Contribution of management skills by the venture capital
providers 25
2.6.2.2 Style of management or funding 25
2.6.2.3 Financial intermediaries 26
2.6.2.4 Exit strategy or route 26
2.7 DIFFICULTIES EXPERIENCED BY SMEs IN ACCESSING VENTURE
CAPITAL FUNDING 27
2.8 FINANCIAL INSTITUTIONS: BANKS 29
2.8.1 Reasons for low investment in SMEs 30
2.8.1.1 Perception as an obstacle to finance 30
2.8.1.2 The need for collateral by banks 31
2.8.1.3 Gap in interest rates 32
2.8.1.4 Lack of skills to manage bank account and to supply
information 32
2.8.1.5 Gender as an obstacle to finance 33

vii
2.8.2 Minimum requirements for securing funds with the banks 34
2.8.2.1 Management 35
2.8.2.2 Financial 35
2.8.2.3 Security 36
2.8.2.4 Business environment 36
2.9 ALTERNATIVE SOURCES OF CAPITAL APPLICABLE TO SMEs IN
THE PAST 39
2.10 STATUS OF THE SMALL BUSINESS SECTOR 40
2.10.1 Current developments 42
2.10.2 Khula-guarantee loans 43
2.10.3 Incentives 43
2.10.4 Initiatives by banks 44
2.10.5 Skills development 45
2.10.6 Competition 45
2.11 SUMMARY 45
CHAPTER 3: MANAGEMENT ACCOUNTING SKILLS AND OTHER
INFORMATION REQUIRED BY VENTURE CAPITAL
PROVIDERS 48
3.1 INTRODUCTION 48
3.2 MANAGERIAL SHORTCOMINGS 49
3.3 MANAGEMENT ACCOUNTING SKILLS 50
3.3.1 Preparation of budgets 51
3.3.1.1 Operating budget 51
3.3.1.2 Cash budget 52
3.3.1.3 Capital budget 52

viii
3.3.2 Product costing and pricing 53
3.3.3 Understanding cost behaviour and cost allocation 54
3.3.4 Activity based costing 56
3.3.5 Calculation of profit and loss 56
3.3.6 Cost-volume profit analysis 56
3.3.7 Product life cycle 57
3.3.8 Standard costing and job order costing 58
3.3.9 Just-in-time 59
3.4 FINANCIAL INFORMATION REQUIRED BY MOST VENTURE
CAPITALISTS 60
3.5 MANAGEMENT ACCOUNTING SKILLS REQUIRED TO SECURE A
LOAN 61
3.5.1 Cash flow management 62
3.5.2 Pricing and cost measurement 63
3.5.3 Market analysis and forecasting 64
3.5.4 Inventory management 64
3.6 OTHER FACTORS CONSIDERED IMPORTANT FOR SECURING A
LOAN 65
3.6.1 Investment at an early stage 65
3.6.2 Management team 65
3.6.3 Investment at a later stage 66
3.6.4 Sensitivity analysis and downside assessment 67
3.7 REASONS WHY LOAN APPLICATIONS ARE TURNED DOWN BY
VENTURE CAPITAL PROVIDERS 67
3.7.1 Assessment of entrepreneurs 70
3.7.2 Assessing the venture 72

ix
3.8 PAST SUCCESS RATE OF APPLICANTS IN MANUFACTURING
SECTOR 75
3.9 SUMMARY 77
CHAPTER 4: RESEARCH METHODOLOGY 79
4.1 INTRODUCTION 79
4.2 DATA COLLECTION AND ANALYSIS METHOD 80
4.2.1 Quantitative and qualitative research 81
4.2.2 Statistical analysis method 82
4.3 POPULATION, SAMPLE SIZE AND GEOGRAPHICAL RESEARCH
AREA 82
4.3.1 SMEs 82
4.3.2 Venture capital providers 83
4.3.3 Sampling techniques 84
4.4 RESPONSE RATES 84
4.5 DESIGN OF QUESTIONNAIRE 85
4.5.1 The questionnaire for SMEs 86
4.5.1.1 Section 1 of the questionnaire 87
4.5.1.2 Section 2 of the questionnaire 88
4.5.1.3 Section 3 of the questionnaire 90
4.5.1.4 Section 4 of the questionnaire 91
4.5.1.5 Section 5 of the questionnaire 93
4.5.2 Questionnaire for venture capital providers 94
4.5.2.1 Section 1 of the questionnaire 94
4.5.2.2 Section 2 of the questionnaire 98
4.6 LIMITATIONS OF THE EMPIRICAL SURVEY 98

x
4.7 SUMMARY 99
CHAPTER 5: RESULTS OF THE RESEARCH 100
5.1 INTRODUCTION 100
5.2 RESEACH FINDINGS - SMEs 100
5.2.1 Age and development stage of the business 100
5.2.2 Reasons for starting the business 103
5.2.3 Business types 104
5.2.4 Involvement in similar business, roles performed and educational
background 106
5.2.5 Management accounting skills and experience obtained prior to operating
a similar business 112
5.2.6 Sources of funds 113
5.2.7 Relationship with financial institutions 116
5.2.8 Problems experienced in acquiring a loan 116
5.3 RESEARCH FINDINGS - VENTURE CAPITALISTS 118
5.3.1 Years of experience of funding SMEs 118
5.3.2 Form and development stage of business 119
5.3.3 Awareness of the applicants about sources of funds available 122
5.3.4 Reasons for and against granting loans to applicants 123
5.3.5 Sectors of industry most preferred 125
5.3.6 Major aspects that financial institutions consider before allocating funds 126
5.3.7 Analysis of independent questions 128
5.3.8 Management accounting skills likely to influence the decision 132
5.3.9 Other aspects that influence a decision 133
5.3.10 Forms of security 135

xi
5.4 COMPARISON OF MANAGEMENT ACCOUNTING SKILLS 136
5.5 ANALYSIS OF THE GAPS IN MANAGEMENT ACCOUNTING SKILLS 137
5.5.1 Bookkeeping 137
5.5.2 Product costing 137
5.5.3 Budgeting 138
5.5.4 Preparing sales and financial projections 138
5.5.5 Inventory management 139
5.5.6 Break-even analysis 139
5.5.7 Cash flow management 139
5.5.8 Identification, classification and measurement of overheads 140
5.6 OTHER MANAGEMENT ACCOUNTING SKILLS ASSESSED 140
5.6.1 Cost control 141
5.6.2 Raising capital 141
5.6.3 Standard costing 141
5.6.4 Activity based costing 142
5.6.5 Life cycle costing 142
5.6.6 Variance analysis 142
5.6.7 Ability to calculate profits 143
5.7 SUMMARY 143
CHAPTER 6: CONCLUSION AND RECOMMENDATIONS 145
6.1 INTRODUCTION 145
6.2 SUMMARY OF LITERATURE REVIEW AND EMPIRICAL STUDY 146
6.2.1 Literature review 146
6.2.2 Empirical study 147
6.2.1.1 Bookkeeping 148
xii
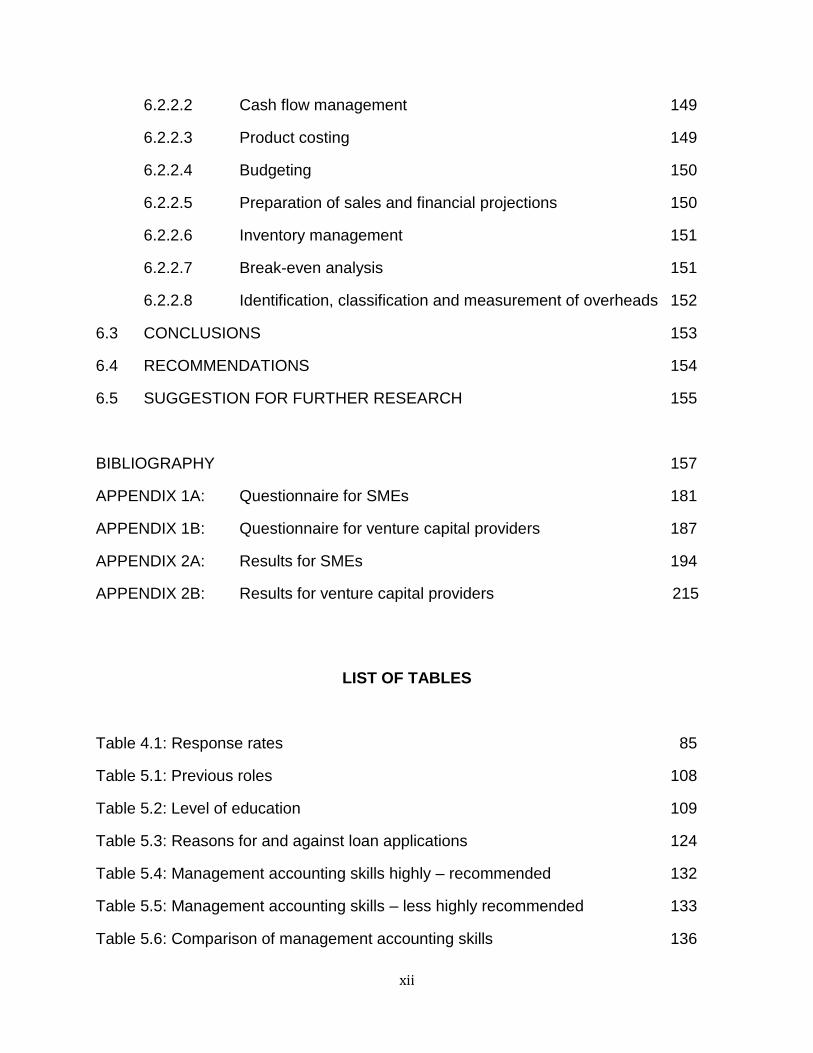
6.2.2.2 Cash flow management 149
6.2.2.3 Product costing 149
6.2.2.4 Budgeting 150
6.2.2.5 Preparation of sales and financial projections 150
6.2.2.6 Inventory management 151
6.2.2.7 Break-even analysis 151
6.2.2.8 Identification, classification and measurement of overheads 152
6.3 CONCLUSIONS 153
6.4 RECOMMENDATIONS 154
6.5 SUGGESTION FOR FURTHER RESEARCH 155
BIBLIOGRAPHY 157
APPENDIX 1A: Questionnaire for SMEs 181
APPENDIX 1B: Questionnaire for venture capital providers 187
APPENDIX 2A: Results for SMEs 194
APPENDIX 2B: Results for venture capital providers 215
LIST OF TABLES
Table 4.1: Response rates 85
Table 5.1: Previous roles 108
Table 5.2: Level of education 109
Table 5.3: Reasons for and against loan applications 124
Table 5.4: Management accounting skills highly – recommended 132
Table 5.5: Management accounting skills – less highly recommended 133
Table 5.6: Comparison of management accounting skills 136

xiii
LIST OF FIGURES
Figure 5.1: Period of operating the business 101
Figure 5.2: Development stage of business 102
Figure 5.3: Reasons for starting business 104
Figure 5.4: Types of business 105
Figure 5.5: Existing experience and skills 113
Figure 5.6: Sources of finance 114
Figure 5.7: Problems experienced in acquiring a loan 117
Figure 5.8: Years of experience of funding SMEs 119
Figure 5.9: Forms of business likely to receive funding 121
Figure 5.10: Sectors of economy 126
Figure 5.11: Aspects considered before granting a loan 128

1
CHAPTER 1
INTRODUCTION AND RESE ARCH PROBLEM
1 .1 INTRODUCTION S ince 1994 the Sou th A f r ican gove rnment has embarked on
va r ious in i t ia t i ves a imed a t j ob c r ea t ion , pover t y a l lev ia t ion and
wea l th c rea t ion . Two o f these in i t ia t i ves a re the b lack economic
empowerment (BEE) ac t ion and the c rea t ion o f sma l l and
med ium en te rp r ises (SMEs) , wh ich fo rm pa r t o f gove rnme nt ’s
macro -economic p rogramme. Acco rd ing to the G loba l
En t repreneu rsh ip Mon i to r (GEM) the gove rnmen t ’ s i n ten t ion
has been to inc rease economic pa r t ic ipa t ion fo r h i s to r i ca l l y
d isadvan taged peop le (HDP) (GEM 2004 :20 ) . These in i t ia t i ves
were iden t i f ied by the gove rnmen t as the most poss ib le
veh ic les to c rea te wea l th and he lp HDP to pa r t ic ipa te in the
ma ins t ream economy.
Excep t f o r wea l th d i s t r ibu t ion and the c rea t ion o f emp loyment ,
the idea o f encourag ing the es tab l ishment o f SMEs was a imed
a t mak ing a l l n ine p rov inces economica l l y ac t i ve by inc reas ing
pa r t i c ipa t ion by women , you th and ru ra l commun i t ie s in
economic ac t i v i t ies (SBP 2009:7 ) . SMEs acco rd ing to the
Nat iona l Smal l Bus iness Amendment Ac t 26 o f 2003 a re en t i t ies
wh ich have more than 5 0 bu t l ess than 200 emp loyees
(Gove rnment Gazet te 2003:8 ) . The impor tance o f these en t i t ies
i s tha t they employ more than ha l f o f the coun t ry ’ s wo rk ing
popu la t ion (Be r ry 2002 :104 ) . The gove rnmen t ’ s e f fo r t to
i nc rease economic pa r t i c ipa t ion and emp loyment in ru ra l a reas
has come under f i re f rom en t rep reneu rs who say tha t

2
gove rnment is no t do ing enough to boost the SME s ’
con t r ibu t ion to economic g rowth and reduct ion o f
unemp loyment .
In the 2003 sec to r rev iew by the Depar tmen t o f T rade and
Indus t ry (DT I ) i t was revea led tha t t he re is l i t t le p rogress f rom
surv i va l is t en te rp r ises to more fo rma l en te rp r i ses (DTI
2002 /3 :11 ) . W hen the democra t i ca l l y e lec ted gove rnment came
to power in 1994, i t had a c lear v i s ion o f red i rec t ing the
count ry ’ s resou rces to benef i t t hose who had been p rev ious ly
exc luded f rom the ma ins t ream economy ( Bus iness Day 2005 :1 ) .
Access to ven tu re cap i ta l has been iden t i f ied as the most
poss ib le sou rce to fas t - t rack the c rea t ion o f SMEs in the
coun t ry (Be r ry 2002 :109 ) . Ven tu re cap i ta l i s de f ined as a
sou rce o f cap i ta l t ha t i s su i tab le to SMEs ope ra t ing a t en t ry
l eve l o f the bus iness o r marke t (Freea r , Soh l & W etze l 1996 :4 ) .
The p rov ide rs o f th is sou rce o f cap i ta l a re ca l led ven tu re
cap i ta l i s t s o r ven tu re cap i ta l p rov ide rs . They can be e i the r
p r i va te o r pub l ic funded ins t i tu t ions .
1.2 BACKGROUND OF THE STUDY
In the 2004 s ta te o f the na t ion add ress , the then P res iden t
Mbek i h igh l igh ted tha t f o r Sou th A f r i ca to become a deve loped
count ry , the number o f sma l l en te rp r i ses need ed to be
inc reased and suppo r ted (Mbek i 2004 :5 ) . Access to f i nance has
been s ing led ou t as one o f t he ma jo r reasons why the c rea t ion
o f SMEs i s g rowing a t a low ra te i f no t s tagna t ing . The
gove rnment ’s e f fo r t to make f inance more access ib le to sma l l
bus inesses led to the es tab l i shmen t o f agenc ies l i ke Khu la
En te rp r i se F inance , Nts i ka En te rp r ise and the Umsobomvu

3
You th Fund . The p r imary a im o f these agenc ies i s t o p rov ide
f inance to sma l l and med ium en te rp r i ses ( SBP 2009:2 ) .
S ta t is t i cs pub l i shed in 2005 by the Sou th A f r i can Ventu re
Cap i ta l Assoc ia t ion (SAVCA) ind ica te tha t much o f the i r
assoc ia te members ’ inves tments a re in se rv i ce and non -
manufac tu r ing bus inesses such as res tauran ts , com mun ica t ion
compan ies , ho te l and le i su re , agr i cu l tu re and f inanc ing o f
managemen t buy -ou t and manageme nt buy- in (Au reos Cap i ta l
L im i ted 2005:1 ) . Ven tu re cap i ta l p rov ide rs c i te a number o f
reasons fo r low inves tmen t i n the c ra f t indus t ry and o ther sma l l
manu fac tu r ing bus inesses . Lack o f management accoun t ing
sk i l l s and techn ica l expe r ience a re two o f the ma jo r reasons
why there is low inves tment i n c ra f t and o the r sma l l
manufac tu r ing bus iness es (Le Roux 2004 :1 ; Nt ing i 2007 :1 ) .
S ince the 1994 e lec t ions , the re has been some inc rease in the
unemp loyment ra te . Th is inc rease was caused p robab ly by
compan ies mov ing f rom be ing labou r in tens ive to be ing cap i ta l
i n tens ive (Louw & Nt ing i 2007 :3 ) . Many po l i t i c ians b lamed th is
move as the ma jo r re ason why peop le we re re t renched. Most
po l i t i c ians and t rade un ions there fo re suggested tha t the
gove rnment shou ld encou rage the es tab l ishmen t o f SMEs tha t
use labou r - in tens ive p roduc t ion methods as the veh ic le fo r job
c rea t ion fo r unsk i l led labou re rs . The manufac tu r ing indus t ry ,
whe re labou r - in tens ive p roduc t ion methods a re used , was
iden t i f ied by the Economi c Po l icy Resea rch Ins t i tu te (E PRI
1999 :9 ) as the most su i tab le sec to r f o r i nc reas ing emp loyment
o f unsk i l l ed labou r and fo r s t rengthen ing economic
pa r t i c ipa t ion o f HDP.

4
Acco rd ing to Mond i (2006 :3 ) , manufac tu r ing s t imu la tes
indus t r ia l i sa t ion , wh ich in t u rn reduces pover t y , c rea tes
emp loymen t and increases the wea l th o f the coun t ry . The c ra f t
i ndus t ry i s an economic sec to r in wh ich most p roducts a re
handmade and p roduced acco r d ing to cus tomer spec i f i ca t ions .
The deve lopment o f th is sec to r w i l l in tu rn ass is t the
gove rnment to rea l i se i t s macro -economic goa ls th rough
expo r ta t ion .
T immons and Sp ine l l i (2007 :388 ) and GEM (2003:13) a rgue
tha t some o f the most p rominen t reasons why bus inesses fa i l
a re the lack o f cash a f te r a bus iness is s ta r ted and the lack o f
the necessa ry management account ing knowledge to run the
bus iness . An en t rep reneu r requ i res adequate sk i l l s and
expe r ience in o rgan is ing a team o f exper ts who a re
expe r ienced in f inanc ia l managemen t , lega l i ssues and
espec ia l l y human resou rces management . Acco rd ing to
S izanan i Adv iso ry (2004 :1 ) , most i nves to rs need to see the
po ten t ia l o f a managemen t team be fo re they show the i r
w i l l i ngness to g ran t a loan to the app l ican t to s ta r t a bus iness ,
espec ia l l y a t the deve lop ing s tage o f a bus iness . The loan
app l ican t ’s chances o f ob ta in ing a loan more qu ick l y w i l l be
enhanced b y o rgan is ing a team o f competen t peop le to manage
the bus iness .
En t repreneu rs s t i l l rega rd the usua l commerc ia l banks as the
on ly o r ma jo r ins t i tu t ion s f rom wh ich to access cap i ta l .
Howeve r , the re a re o the r o rgan isa t ions l i ke ven tu re cap i ta l i s ts
wh ich o f fe r f inance to SMEs. One ma jo r obs tac le tha t s tands
be tween en t repreneu rs and ven tu re cap i ta l i s t s is access to
in fo rmat ion . Ventu re cap i ta l i s ts p re fe r to assess the bus iness

5
owners tha t run the i r bus inesses be fo re they can g ran t them
f inance . There fo re , the lack o f in fo rmat ion on the competence
o f SMEs ’ management i s the ma jo r reason why SMEs s t i l l f ind
i t d i f f i cu l t to secure loans f rom ven tu re cap i ta l i s ts and a lso why
SMEs a re perce ived to be r i sky bus inesses .
Ma lho ta , Chen, Cruscu lo , Fan , Hame l & Savchenko (2006:13 )
a rgues tha t sma l l bus iness en te rp r ises a re r i sky and the i r
f u tu re success is unce r ta in . A f i rm in the in i t ia l s tage o f i t s l i f e
cyc le i s even more r i sky because i t i s invo lved in f undamen ta l
ac t i v i t ies , such as deve lop ing the p ro to t ype p roduct ,
s t ruc tu r ing the o rgan isa t ion and c rea t ing channe ls o f
d is t r ibu t ion . Goosen, Pampa l l i s , Van der Merwe and Md lu l i
(1999 :252 ) i nd ica te tha t banks usua l l y do no t inves t i n SMEs in
the in i t ia l s tage o f i t s l i f e cyc le . Th is may be due to the fac t
tha t success fu l ven tu re cap i ta l inves tments o f ten take f i ve to
seven years to come to f ru i t ion (SAVCA 2005:2 ) . Ven tu re
cap i ta l i s t s w i l l be more l i ke l y to supp ly s ta r t -up cap i ta l where
the en t repreneu r i s a success fu l inves to r and /o r execu t i ve w i th
a p roven t rack reco rd (Ho r i zon Equ i t y 2005b :1 ) . Hence th is
p rac t ice w i l l no t bene f i t SMEs and espec ia l l y w i l l no t change
the pos i t ion o f HDPs in the c ra f t indus t ry .
1.3 PROBLEM STATEMENT
The p rob lem addressed in th i s s tudy re la te s to the fac t tha t
many SMEs canno t access ven tu re cap i ta l i n Sou th A f r ica .
Research shows tha t ve ry few p rospec t i ve sma l l bus iness
owners a re success fu l in ra is ing and acqu i r ing ven tu re cap i ta l
i n o rde r to s ta r t a bus iness (S izan an i Adv iso ry 2004 :2 ;
Bus inessOwner 2004 :2 ) .

6
Amongst the reasons fo r low inves tment in SMEs a re :
Poo r management account ing sk i l l s and lack o f
expe r ience . For a bus iness to ope ra t e smooth ly i t needs a
combina t ion o f ind iv idua ls who have hands -on expe r ience
rega rd ing bus iness managemen t and f inanc ia l
managemen t . Be fo re ven tu re cap i ta l i s t s make an
inves tmen t in a bus iness , they need the owner to
conv ince them tha t he /she has the nece ssa ry sk i l l s to run
a bus iness . Acco rd ing to S izanan i Adv iso ry (2004:3 ) , 60%
o f bus iness p lans tha t we re subm i t ted annua l l y we re no t
accep ted by the banks , because they d id no t meet the
bas ic lend ing c r i te r ia and the owner lacked expe r ience .
P rev ious ly , t he pe rcep t ion among the banks was tha t
l end ing money to a less es tab l ished bus iness o r one wi th
no bo r rowing reco rd was a r isky t ransac t ion ( Bus iness
Repor t s 2006 :2 ) . Managemen t accoun t ing sk i l l s , jus t l i ke
bus iness management sk i l l s , a re impor tan t f o r t he
success fu l ope ra t ion o f any bus iness conce rn . The re fo re
mos t ven tu re cap i ta l i s ts w i l l ass ess the ab i l i t y o f the loan
app l ican t in te rms o f whethe r he /she can app ly any o f the
managemen t accoun t ing aspec ts l i ke : ca lcu la t ion o f
p ro f i t / loss , recogn i t ion o f d i rec t mater ia ls , d i rec t labou r ,
manufac tu r ing ove rheads , gene ra l expenses and
p repa ra t ion o f budge ts .
Fa i lu re to per fo rm any o f the above aspects o f
managemen t accoun t ing may resu l t i n a loan app l i can t no t
be ing ab le to ob ta in a loan .
In add i t ion , l ack o f techn ica l sk i l l s in a spec i f i c indus t ry i s
a lso c i ted as a requ i rement . Techn ica l sk i l l s in a spec i f i c
i ndus t ry t ha t sma l l bus iness owners want to jo in a re

7
impo r tan t . I f the gove rnment wan ts to inc rease the
number o f sus ta inab le sma l l bus iness owners , tech n ica l
t ra in ing mus t be in t roduced to the var ious indus t r ies in
wh ich they want to par t i c ipa te (S izanan i Adv isory 2004 :2 ) .
1.4 PURPOSE OF THE STUDY
The s tudy a ims to iden t i f y the gap in management account ing
sk i l l s requ i red by ven tu re cap i ta l i s t s and those possessed by
SME owners in the c ra f t indus t ry , spec i f i ca l l y i n the Tshwane
Met ropo l i tan A rea . Due to esca la t ing in te res t i n sma l l
en te rp r i ses in South A f r ica as a resu l t o f job losses , ven tu re
cap i ta l i s t s have in t roduced more comp l i ca ted and s t r i c t c r i te r ia
f o r se lec t ing en te rp r ises to wh ich they a re w i l l i ng to p rov ide
cap i ta l ( Jeppesen 2009 :2 ) . Accord ing to Bus iness Pa r tne rs
(2004 :3 ) , a bus iness p lan i s no longe r the on ly requ i rement as
fa r as secu r ing f inance is conce rned . The more recen t c r i te r ia
i nc lude managemen t accoun t ing sk i l l s , wh ich the ma jo r i t y o f
the en t rep reneurs do no t have .
Th is s tudy a t tempts to b r ing to the a t ten t ion o f po ten t ia l sma l l
en te rp r i ses in the c ra f t indus t ry t he t ype o f management
accoun t ing sk i l l s wh ich ven tu re cap i ta l i s ts requ i re f rom them
be fo re inves tments w i l l be made in the i r bus inesses .
1 .5 OBJECTIVES OF THE STUDY
The s tudy a t tempts to ach ieve the fo l lowing ob jec t i ves :
To iden t i f y managemen t accoun t ing sk i l l s wh ich ven tu re
cap i ta l i s t s requ i re f rom sma l l bus iness own ers be fo re

8
i nves tmen t is made . Acco rd ing to S izanan i Adviso ry
(2004 :2 ) , 60% o f app l i ca t ions fo r f und ing a re re jec ted
annua l l y by banks . Th is i s an ind ica t ion tha t the re i s s t i l l
some m isunde rs tand ing be tween ven tu re cap i ta l i s t s and
sma l l bus iness owners as fa r as the requ i rements fo r
secu r ing fund ing a re conce rned . I f th is gap in
managemen t accoun t ing sk i l l s can be f i l led o r na r rowed,
the gove rnment wou ld be more ab le to ach ieve i t s goa l o f
i nc reas ing sma l l bus iness en te rp r ises .
To asce r ta in the leve l o f s u f f i c ien t management
accoun t ing sk i l l s wh ich en t rep reneu rs must have be fo re
they app roach ven tu re cap i ta l i s ts f o r cap i ta l f und ing.
N t ing i (2007 :1 ) and Fu tuse (2007 :5 ) a rgue tha t
managemen t accoun t ing sk i l l s and bus iness management
sk i l l s f o rm pa r t o f the assessment c r i te r ia f o r most
ven tu re cap i ta l i s t s . P r i va te ven tu re cap i ta l i s ts use
d i f f e ren t assessment c r i te r ia ; the re fo re th i s s tudy
a t tempts to iden t i f y those sk i l l s tha t a re va lued by most
ven tu re cap i ta l i s ts . Th is w i l l he lp SMEs by iden t i f y ing
these sk i l l s w i th in the bus iness wheneve r they want to
make an app l ica t ion fo r a loan . Th is m igh t con t r ibu te
towards inc reas ing the i r success ra te to acqu i re funds .
To compare the requ i rements o f ven tu re cap i ta l i s t s and
the knowledge tha t the owners /managers possess w i th
rega rd to management account ing .

9
1.6 IMPORTANCE OF THE ST UDY
Th rough the f ind ings and recommenda t ion s o f th is s tudy the
fo l lowing benef i t s shou ld be ach ieved :
Ven tu re cap i ta l i s t s , commerc ia l banks , non -gove rnment
agenc ies and gove rnment age nc ies w i l l become aware o f
the gap in management accoun t ing sk i l l s o f app l ican ts .
Sma l l bus iness owners w i l l know wha t the ven tu re
cap i ta l i s t s requ i re f rom them as fa r as management
accoun t ing sk i l l s a re conce rned .
The s tudy w i l l i nd ica te to ven tu re cap i t a l i s ts and
gove rnment agenc ies poss ib le ways to f i l l the gap in
managemen t accoun t ing sk i l l s when such a gap ex is ts .
1.7 EMPIRICAL RESEARCH
The f i rs t s tage o f the s tudy compr ises a l i te ra tu re rev iew wh ich
w i l l be cove red in chap te r 2 and chapte r 3 . The second phase
o f the s tudy cons is ts o f emp i r i ca l research . The f ind ings f rom
the emp i r i ca l resea rch a re used fo r bo th recommenda t ions and
conc lus ions o f the s tudy . The empi r ica l resea rch was
conduc ted on the f inanc ia l ins t i tu t i ons and SMEs in the c ra f t
i ndus t ry in the Tshwane area .
A comb ina t ion o f bo th in fo rma l d iscuss ions and ques t ionna i res
we re used in the emp i r i ca l s tudy .
1.7 .1 In formal d iscussions
In fo rma l d i scuss ions were he ld among bo th the SME owners in
the c ra f t indus t ry and ven tu re cap i ta l p rov iders . A s t ra t i f ied

10
random samp l ing p rocedu re was used to se lec t pa r t ic ipan ts
w i th a g i ven c r i te r ion . The responden ts cons is ted o f va r ious
g roups invo lved in the c ra f t indus t ry ( f o rma l and in fo rma l ) ,
ven tu re cap i ta l i s ts and f inanc ia l ins t i tu t ions (commerc ia l and
m ic ro - lende rs ) .
1.7 .2 Quest ionnai res
Quant i ta t i ve and qua l i t a t i ve su rvey s in the form o f a
quest ionna i re we re conducted among SME bus iness owners in
the c ra f t indus t ry ( f o rma l and in fo rma l ) on the one hand , and
ven tu re cap i ta l i s ts and f i nanc ia l ins t i tu t ions (m ic ro - lende rs and
commerc ia l lenders ) on the o the r . S t ra t i f ied random samp l ing
was used to enab le en t rep reneu rs and f inanc ia l p rov iders to
have an equa l oppo r tun i t y o f be ing se lec ted to pa r t ic ipa te in
the s tudy .
1.8 DAT A AN ALYSIS
The da ta co l lec ted was coded and samp l ing techn iques as
d iscussed in chap te r 4 we re used to de te rm ine the l i ke l y
reasons fo r some fa i lu res and successes in f und ing
app l ica t ions . S ta t i s t i ca l Package for the Soc ia l Sc ience (SPSS)
ve rs ion 11 .1 was used to ana lyse the da ta co l lec ted .
1.9 ORG ANIS ATION OF THE STUDY
In chap te r 1 the background o f the s tudy , p rob lem s ta tement ,
ob jec t i ves o f the s tudy and da ta ana lys is method a re exp la ined
and d iscussed.

11
An ove rv iew o f the cu r ren t s i tua t ion w i th rega rd to th e ven tu re
cap i ta l marke t and SMEs is p rov ided in chap te r 2 . A de f in i t ion
o f s ta r t -up cap i ta l i s d i scussed and the sou rces o f cap i ta l
app l icab le to SMEs a re a lso men t ioned . The background to the
top ic o f ven tu re cap i ta l a nd ven tu re cap i ta l i s ts i s a lso
p rov ided . Gove rnment ’ s ro le and tha t o f the f i nanc ia l
i ns t i tu t ions invo lved in f und ing SMEs a re exam ined. Cr i t i ca l
success fac to rs tha t have been impor tan t to secure loans in
the pas t and the s ta tus o f sma l l manufac tu r ing con ce rns a re
h igh l igh ted .
In chap te r 3 management accoun t ing sk i l l s and f inanc ia l
i n fo rmat ion as we l l as o the r requ i rements o f ven tu re cap i ta l
p rov iders a re iden t i f ied . The p rocedu res and p rocesses
invo lved in t he p rocu rement o f ven tu re cap i ta l a re a lso
exp la ined . Pas t success ra te s o f app l ican ts a re d iscussed in
th i s chap te r .
The research methodo logy and the des ign o f the quest ionna i re
a re d iscussed in chap te r 4 . Two methods used to co l lec t da ta
a re exp la ined and the sys tem used to ana lyse the da ta is a lso
exp la ined .
Chapte r 5 focuses on the p resen ta t ion and ana lys i s o f the
research f ind ings and the reasons fo r f a i lu re . The requ i rements
fo r success a re a lso p resen ted . The gap in management
accoun t ing sk i l l s be tween what ven tu re cap i ta l i s t s requ i re and
what SME ope ra to r s have i s h igh l igh ted .

12
In chap te r 6 , the conc lus ions and recommendat ions fo r the
s tudy a re g i ven . Recommenda t ion s fo r f u r the r resea rch a re
a lso made .

13
CHAPTER 2
THE CURRENT SITUATIO N WITH REG ARD TO THE VENTURE
CAPITAL MARKET AND S MES
2.1 INTRODUCTION
Sma l l bus iness owners face many cha l lenges when es tab l ish ing a
bus iness in Sou th A f r i ca . Two o f the ma jo r cha l lenges o r obs tac les
they face a re lack o f f i nanc ia l suppo r t and management gu idance .
Inadequate f inanc ia l resou rces a re rega rded as a p r imary cause o f
SME fa i lu re and the lower ra te o f s ta r t -ups (Grego ry , Ru the r fo rd ,
Oswa ld & Gard ine r 2005:383 ) . The success o f any new bus iness
depends on the en t repr eneur ‟ s ab i l i t y t o ob ta in suppo r t and
ass is tance f rom banke rs and ven tu re cap i t a l i s ts (Agreb i 2009 :1 ) .
The low ra te a t wh ich sma l l bus inesses a re c rea ted and low ra tes
o f success ind ica te tha t new en t rep reneu rs s t i l l have a p rob lem in
acqu i r ing ven tu re cap i ta l and su f f ic ien t bus iness and management
accoun t ing sk i l l s be fo re they s ta r t b us inesses (GEM 2003:5 ;
Kasekende & Opondo 2003:3 ) .
The pu rpose o f th is chap te r is to d iscuss the o r ig in o f ven tu re
cap i ta l , f o l lowed by a de f in i t i on o f ven tu re cap i ta l and v en tu re
cap i ta l i s t s . In th is chap te r t he t ypes o f ven tu re cap i ta l p rov ide rs
ava i lab le in South A f r i ca and the t ypes o f f unds ava i lab le to SMEs
a re a l so iden t i f ied and d iscussed . In add i t ion , the assessment
c r i te r ia o f most cap i ta l p rov iders a re cons ide red a s ve ry impor tan t .
The s ta tus quo o f SMEs as fa r as access to f i nance and SMEs‟
c r i t i ca l success fac to rs fo rms an in tegra l pa r t o f th is chap te r .
In the f i rs t pa r t o f th i s chap te r the o r ig in o f ven tu re cap i ta l i s
d iscussed fo l lowed by the de f in i t ion o f t he concept ven tu re cap i ta l
and ven tu re cap i ta l i s t s . In t he second pa r t o f t he chap te r d i f f e ren t

14
organ isa t ions o f fe r ing ven tu re cap i ta l in Sou th A f r ica a re
iden t i f ied . Va r ious ways wh ich cap i ta l p rov ide rs p re fe r to be
con tac ted o r app roached by the loan app l ic an ts a re a lso
h igh l igh ted . The c r i t i ca l success fac to rs and the s ta te o f SMEs in
as fa r as access to cap i ta l i s concerned a re the n d iscussed.
2.2 THE ORIGIN OF VENTUR E CAPITAL
Ven tu re cap i ta l i s one o f the o ldes t sou rces o f f inance fo r new
en te rp r i ses . I t i s gene ra l l y de f ined as a f i nanc ia l ins t rument tha t
ven tu re cap i ta l p rov iders use to suppo r t en t repreneur ia l ven tu res ,
to exp lo i t marke t oppo r tun i t ies and thus ob ta in long - te rm cap i ta l
ga in (Sh i l son 1984 : 207 ; Dagogo & O l lo r 2009 :41 ) . Acco rd ing to
L i les (1974:461 ) , ven tu re cap i ta l inves tmen t inc ludes :
F inanc ia l suppo r t i n new ven tu res ,
F inanc ia l suppo r t to any new ven tu re w i th a p ro to t ype p roduct ,
Inves tments in es tab l ished bus inesses
Inves tment in bus inesses wi th low ra te o f r i sk and
unce r ta in t ies .
P r i va te inves to rs , f am i l y and f r iends have fo r cen tu r ies been the
f i rs t po r t o f ca l l fo r en t repreneu rs in need o f cap i ta l . Inc reas ing ly ,
i n the pos t -1945 pe r iod , sma l l en te rp r ises ac ross the wor ld have
been seen as an impor tan t pa r t o f the compet i t i ve mechan is m o f
the f ree marke t economy. The re fo re , gove rnment i n te rven t ion to
suppo r t the deve lopment o f the sma l l bus iness sec to r has been
recogn ised as des i rab le and necessa ry . “S ince 1945 success ive
gove rnments and some f inanc ia l p rov ide rs in the wor ld have
in t roduced a w ide va r ie t y o f measures des igned to p romote new
en te rp r i se fo rmat ion and sma l l en te rp r ise g rowth ” (S tanwor th &
Gray 1991 :16 ) . S tokve l , an in fo rma l t rad i t iona l poo l ing o f f unds , i s
a popu la r examp le o f such , and i s commonly used in townsh ips as
a sou rce o f f inance fo r SMEs.

15
Banks used to be the p r imary sou rce o f opera t ing cap i ta l f o r sma l l
en te rp r i ses and the usua l f o rm tha t such cap i ta l t ook was a l i ne o f
c red i t . “ In the cur ren t bus iness env i ronmen t mos t en t repreneu rs
a re f ind ing i t necessa ry to somet imes use ve ry c rea t i ve techn iques
to ge t the i r bus inesses o f f the g round ” (Meye r & A l len 1994: 258) .
Crea t i ve techn iques s imp ly mean tha t a combina t ion o f va r ious
sou rces o f f inance a re used to f inance the ope ra t ing ac t i v i t ies o f a
bus iness .
H is to r ica l f und ing p rob lems have l im i ted the ab i l i t y o f secu r i t y
f i rms, b roke rage f i rms, leas ing ins t i tu t i ons and commerc ia l f inance
compan ies to aggress ive ly pu rsue the sma l l bus iness marke t . Th is
has led to f inance ins t i tu t ions in t roduc ing a number o f new
sou rces o f equ i t y cap i ta l to su i t t he sma l l bus iness marke t sec to r .
One o f those is ven tu re c ap i ta l (Hann ing & Joube r t 2003 : 12 ) .
Acco rd in g to the Eu ropean Commiss ion (2008: 2 ) , ven tu re cap i ta l
does no t seem to be a l l tha t ava i lab le to bus inesses opera t ing in
l oca l o r a t en t ry - leve l marke ts . The inves tmen t cu l tu re in South
A f r i ca is such tha t ven tu re and seed fund ing i s no t dep loyed in the
c r i t i ca l ea r l y s tages o f bus iness deve lopment because o f the h igh
r i sk assoc ia ted w i th s ta r t -up bus inesses (GEM 2004 :52 ) . Seed
cap i ta l i s f und ing used fo r research , eva lua t ion and deve lopment
o f a cos t ob jec t o r to k ick -s ta r t ope ra t ing ac t i v i t ies (SAVCA
2003 /2004 :8 )
Acco rd ing to Kasekende and Opondo (2003:3 ) , some new
bus inesses , by the na tu re o f the i r ob jec t i ves and the
c i r cumstances o f the i r launch ing, a re espec ia l l y r i sky . The cap i ta l
supp l ied to such f i rms i s o f ten des igna ted ven tu re cap i ta l ,
a l though i t s purpose and requ i remen ts a re much the same as in
any o the r sec to rs o f the economy. Howeve r , the degree o f r i sk
assoc ia ted w i th SMEs jus t i f ies such a des igna ted sou rce o f

16
f inance . Des igna ted ven tu re cap i ta l i s a sou rce o f f inance tha t i s
g ran ted to SME ‟s owners to s ta r t a new bus iness .
Some South A f r i can ven tu re cap i ta l p rov iders recen t l y have
s ta r ted to inves t i n sma l l en te r p r i ses . Resea rch shows tha t the
ma jo r i t y o f SME owners have neve r accessed e i the r p r i va te o r
pub l ic equ i t y f inance (Nts ika En te rp r i se Promot ion Agency
2002 :111 -121 ) . Ma lgas (2002 :121 ) , a rgued tha t Sou th A f r i ca ‟s
ventu re cap i ta l marke t i s a t a deve lop ing s tage and less
soph is t i ca ted as compared to the USA, Europe and Aust ra l ia
marke ts . In South A f r ica , p r i va te equ i t y f und managers a re
pe rce ived to be no t accommodat ing SMEs (DTI 2005 ) . “The
success ach ieved by p r i va te equ i t y f unds in t he Un i ted S ta tes , and
to a lesse r ex ten t i n Eu rope , has resu l ted in the deve lopment o f
p ro fess iona l p r i va te equ i t y f i rms in o the r pa r ts o f t he wor ld ,
i nc lud ing South A f r ica ” (SAVCA 2003 :7 ) .
Some p rogress in f inanc ing SMEs has been made ove r t he pas t
f ew yea rs , in pa r t i cu la r in convent iona l deve loped sec to rs . More
recen t l y t he ma jo r i t y o f p r i va te equ i t y has been used increas ing ly
to fund BEE dea ls (DT I 2005 ) . Acco rd ing to SAVCA (2006 :1 ) , there
were 71 ac t i ve ven tu re cap i ta l o rgan isa t ions in 2000 , wh i le an
add i t iona l 58 were reg is t e red in 2001 and these new members a re
focused on he lp ing SMEs. Khu la En te rp r ise repor ted in 2004 tha t
i t wou ld inc rease i t s cap i ta l by 40% and tha t the number o f
bene f i c ia r ies wou ld a l so be inc reased (Khu la En te rp r ise 2004 ) .
Th is move by Khu la is an ind ica t ion tha t w i th t ime the num ber o f
oppo r tun i t ies fo r SMEs wi l l inc rease . Howeve r , sma l l bus iness
owners ‟ awareness s t i l l needs to be inc reased in te rms o f
requ i rements fo r f und ing and the fo rms o f cap i ta l ava i lab le to
them.
In South A f r ica , t he four ma jo r commerc ia l banks and the i r
p redecesso rs p ionee red leve raged buy -ou ts . These were la rge ly

17
dr i ven by d i s inves tments f rom Sou th A f r ica in the ear l y 1980s
(S tanwor th & Gray 1991 : 122 ) .
SMEs and f i rms tha t have g rowth po ten t ia l f ace the same
cha l lenges tha t a lmos t any o ther t ype o f bus iness faces when
app ly ing fo r f inance . Howeve r , t he degree o f r i sks faced by SME
owners requ i res a spec ia l t ype o f f inanc ing. Th is has led to the
deve lopment o f spec ia l i sed ven tu re cap i ta l f inanc ing sou rces .
2.3 VENTURE CAPITAL
The concept ventu re cap i ta l has var ious de f in i t ions . Some o f t hese
de f in i t ions have the same mean ing, namely tha t ven tu re cap i ta l i s
f und ing c rea ted fo r emerg ing and r i sky bus inesses ( in pa r t icu la r
SMEs) . SMEs a re pe rce ived to be r i sky, because the ma j o r i t y o f
them a re based on an idea tha t i s s t i l l to be p roven ( Knot t
2004 :156 ) .
D i f f e ren t au thors de f ine ven tu re cap i ta l as fo l lows :
Ven tu re cap i ta l i s a p r imary and un ique sou rce o f f und ing fo r
sma l l f i rms, because these f i rms have very l im i ted access t o
t rad i t iona l cap i ta l marke ts (Tech Mon i to r 2007 ) .
Ven tu re cap i ta l i s cap i ta l inves tment tha t i s p rov ided bo th
s ta r t -ups and go ing conce rns (Ross , W este r f ie ld & Jordan
1996 :449 ) .
Ven tu re cap i ta l i s the equ i t y p rov ided to emerg ing and
es tab l ished bus inesses (McLaney 2003 :430 ) .
Ven tu re cap i ta l i s a fo rm o f f und ing p rov ided to p r iva te
bus inesses in re tu rn fo r a s take in a bus iness (DTI 2005 ) .
Acco rd ing to Cha r te red Ins t i tu te o f Management Accountan ts
(C IMA) (2002:26) , ven tu re cap i ta l i s a sou rce o f f und ing
app l icab le to bo th s ta r t -ups and es tab l i shed bus inesses wh ich
a re rega rded to be r isky .

18
Ven tu re cap i ta l i s inves tment made in to a bus iness w i th the
idea o f mak ing a huge cap i ta l ga in (G locap i ta l 2006 ) .
In summary , ven tu re cap i ta l can be de f ined as fund ing ava i lab le to
emerg ing sma l l bus inesses wh ich s t i l l need to p rove a bus iness
idea . Ventu re cap i ta l i s t s make the se inves tment s in these r i sky
bus inesses because they hope to make a good re tu rn on
inves tmen t .
As fa r back as 1987 Ma ie r and W alke r (1987:209 ) iden t i f ied
impor tan t cha rac te r is t i cs o f ven tu re cap i ta l as fo l lows :
Acqu is i t ion th rough d i rec t pu rchase o f shares o r jo in t
managemen t o f the bus iness .
I s a long - te rm inves tment commi tmen t wh ich takes a long
pe r iod be fo re pos i t i ve re tu rn s a re rea l ised .
The ven tu re cap i ta l p rov ider usua l ly has an ac t i ve pa r t ic ipa t ion
in t he company in wh ich they have inves ted .
In summar is ing these cha rac te r i s t i cs , i t can be s ta ted tha t some
ven tu re cap i ta l i s t s a re ab le to ass is t SME owners w i th the
ope ra t ion o f the i r bus iness , p rov ided tha t the owners posse ss a t
l eas t the m in imum expe r ience tha t the f inanc ie rs requ i re . Some
a re p repa red to be pa r t o f the new bus iness managemen t team
un t i l such t ime tha t the ven tu re cap i ta l i s t ‟ s inves tment matu res .
2.4 VENTURE CAPITAL PROVIDERS
Ven tu re cap i ta l p rov iders can be de f ined as o rgan isa t ions and
cap i ta l - r i ch i nd iv idua ls tha t p rov ide ea r l y s tage deve lopment
f und ing , expans ion fund ing fo r f i rms wi th demonst ra ted f inanc ia l
v iab i l i t y , and funds fo r leve raged buy -ou ts to re -es tab l ish d i v i s ions
o f la rge bus inesses (E l i t zu r & Gav ious 2003 :709 ) . Organ isa t ions
p rov id ing ven tu re cap i ta l a re d i v ided in to two ca tego r ies , name ly

19
the spec ia l is ts ( independen t p r i va te cap i ta l i s t s ) and the
gene ra l is ts (pub l ic -backed cap i ta l i s t s ) .
2 .4 .1 Independent pr ivate capi ta l prov iders
“The dom inan t cha rac te r is t i c o f an independen t p r i va te ven tu re
cap i ta l f i rm is t ha t i t i s e i t he r a p r i va te pa r tne rsh ip o r a c lose ly
he ld co rpo ra t ion funded by insu rance compan ies , endowment
funds , pens ion funds , bank t rus ts , co rpora t ions , cap i ta l r i ch
ind iv idua ls and fo re ign inves tments , o r a fami l y f i rm begun by
cap i ta l - r i ch members ” (Ma ie r & W alker 1987 :209 ) . Accord ing to
Langdon & Bonham (2000 :87 ) the above f i nanc ing ins t i tu t ions
spread the i r deb ts a round a lo t o f s ta r t -up bus inesses o r those
tha t have h igh success p rospec ts . W i thou t the mento r ing and
mon i to r ing o f independent p r i va te cap i ta l p rov ide rs , some o f the
SMEs may never have made i t t o the d iv idend payou t s tage
(Agreb i 2009 :1 ) .
Howeve r , there a re a l so o the r p r i va te en t i t i es , wh ich SME owners
can access cap i ta l f und ing f rom (Ba ty 1981:73 ; Kur i lo f f , Hemph i l l
& C loud 1993:357 -487 ; DT I 2005 ) . Examples o f these a re se t ou t
be low.
2.4 .1 .1 Venture capi ta l f i rms
Ven tu re cap i ta l f i rms a re independent o rgan isa t ions whose p r imary
ac t i v i t y i s inves t ing in p r i va te bus inesses . The i r cap i ta l supp ly is
gene ra l l y s t ruc tu red as a l im i ted pa r tne rsh ip w i th a th ree - to f i ve -
yea r l i f e and is composed o f a number o f p r i va te sec to r
i ns t i tu t ions and occas iona l l y h igh ne t wo r th ind iv idua ls . Ven t u re
cap i ta l p rov ide rs a re manag ing po r t f o l io s o f bus inesses wh ich a re
funded f rom inves tmen t f und s (Gumming 2006:1083 ) .

20
2.4 .1 .2 Venture capi ta l t rus ts
Ven tu re cap i ta l t rus ts a re l i s ted o rgan isa t ions tha t inves t
acco rd ing to a se t o f c r i te r ia to qua l i f y f o r p r i v i leged tax
t rea tment . The sou rce o f the i r cap i ta l i s t yp ica l l y h igh ne t wo r th
ind iv idua ls o r re ta i l inves to rs . The ru les a t tached to ven tu re
cap i ta l t rus t qua l i f i ca t ion requ i re a la rge p ropo r t ion o f t he funds to
be inves ted wi th in a g i ven pe r iod .
2 .4 .1 .3 Angel ne tworks
Cap i ta l - r i ch ind iv idua ls a re p robab ly the s ing le most impor tan t
sou rce o f ca p i ta l f o r s ta r t -up and emerg ing bus inesses today
(T immons 1999:438 ) . Ange l ne tworks a re essen t ia l l y a group o f
wea l thy ind iv idua ls benef i t ing SMEs th rough means o f the i r dea l
sou rc ing and dea l sc reen ing capab i l i t ies . “The ne twork a lso
enab les them to poo l the i r cap i ta l i n to la rge r chunks . Th is means
they can par t i c ipa te on a much g rea te r sca le and sp read the
assoc ia ted r isks by d i ve rs i f y ing across a number o f oppor tun i t ies
than wou ld be the case i f they were inves t ing a lone ” (E l i t zu r &
Gav ious 2003:710 ) .
2.4 .2 Publ ic -backed organisa t ions
Pub l ic -backed o rgan isa t ions a re ven tu re cap i ta l p rov iders tha t
p rov ide cap i ta l wh ich they rece ive f rom the gove rnment , r ang ing
f rom cen t ra l gove rnment depa r tmen ts to reg iona l o r p rov inc ia l
deve lopment agenc ies (MacLeod 1 995 :202 ) . Examp les o f such
fund p rov ide rs a re you th deve lopmen t f unds such as Umsobumvu
You th Fund and p rov inc ia l deve lopment f unds such as the L impopo
Deve lopmen t Co rpo ra t ion , wh ich was es tab l ished spec i f i ca l l y f o r
res iden ts o f the L impopo p rov ince .

21
2.4 .3 Other sources o f funds
O the r sou rces o f f unds inc lude compan ies tha t inves t by i ssu ing
debentu res and new sha res , l i s ted inves tment compan ies ,
i nves tmen t t rus ts and co rpo ra te ven tu r ing un i ts t ha t do no t have a
supp ly o f cap i ta l con t ro l l ed by the ho ld ing compan ies o r p rov ided
in pa r t by th i rd -par t y inves to rs (Ku r i l o f f et a l . 1993 :357 ) .
2.5 TYPES OF FUNDS
Independen t p r i va te o rgan isa t ions tend to ca tego r ise the t ypes o f
f unds ava i lab le to SMEs. The t ypes o f f unds ava i lab le a re d i v ided
in to f i ve ca tego r ies wh ich a re d i scussed be low (SAVCA
2003 /2004 :8 ) . Some o f these t ypes o f f unds a re app l i cab le to SME
ope ra to rs .
2 .5 .1 Seed cap i ta l
Seed cap i ta l i s a sou rce o f f und used fo r resea rch , eva lua t ion and
deve lopment o f a cos t ob jec t o r to s ta r t opera t ing ac t i v i t ies
(SAVCA 2004:8 ) . Typ ica l l y , the seed cap i ta l i s a re la t i ve ly sma l l
amoun t p rov ided to p rove a concept o r deve lop a p roduct (Knot t
2004 :156 ) . Th is typ e o f f und ing is used by mos t bus iness owners
to k i ck -s ta r t the i r opera t ions . The funds can a lso be used by
SMEs.
2 .5 .2 S ta r t -up and ear ly s tage cap i ta l
Th is is a sou rce o f cap i ta l f o r new SMEs tha t we re es tab l ished fo r
a sho r t per iod o f t ime no rma l l y le ss than th ree yea rs (SAVCA
2004 :8 ) . S ta r t -up cap i ta l inc ludes p roduct deve lopmen t cos ts and
i s usua l l y made ava i lab le to bus inesses tha t have been in
bus iness fo r a sho r t - te rm whose p roduct has no t ye t been
in t roduced to the marke t (Kno t t 2004 :156 ) . Th is i s the t ype o f

22
f und ing app l i cab le to SMEs as mos t o f them a re s ta r ted f rom
sc ra tch .
2 .5 .3 Expansion and development capi ta l
“Th is i s f und ing p rov ided fo r g rowth and expans ion o f a company
tha t i s b reak ing even o r a l ready in t rade ” (SAVCA 2004:8 ) . Th is
t ype o f f und ing is app l icab le to a l l t ypes o f bus iness es , SMEs
inc luded.
2.5 .4 Leveraged buy - in or buy -out capi ta l
“Th is t ype o f f und ing i s p rov ided to enab le the top management o r
empowerment pa r tner to buy e i ther an ex is t ing o r a new bus iness ,
and the i r backe rs to acqu i re a bus iness f rom ex is t ing owners ,
whethe r a fami ly , cong lomera te o r o the r . Un l i ke ven tu re and
deve lopment cap i ta l , the p roceeds o f buy -ou ts gene ra l l y go to the
p rev ious owner(s ) o f the en t i t y ” (SAVCA 2004 :8 ) . S ince most SMEs
in the c ra f t i ndus t ry a re es tab l ished to p rov ide a sou rce o f i ncome,
these t ypes o f o rgan isa t ion s w i l l no t se l l sha res to an ou ts ide r .
W hen a pe rson leaves the bus iness he /she wi l l ra the r jo i n a
compet i to r o r s ta r t h i s /he r own bus iness . Th is t ype o f f und ing is
no t app l i cab le to SMEs .
2.5 .5 Replacement capi ta l
“Rep lacemen t cap i ta l i s f und ing p rov ided fo r the pu rchase o f
ex i s t ing shares in a company f rom o the r sha reho lde rs , whe the r
i nd iv idua ls , o ther ven tu re backe rs o r the pub l ic th rough the s tock
marke t . Un l i ke ven tu re and deve lopment cap i ta l , the p roceeds o f
rep lacement cap i ta l t ransac t ions a re gene ra l l y pa id to the p rev ious
owner (s ) o f the en t i t y ” (SAVCA 2004 :8 ) . Jus t l i ke the leve rage
buy- in /buy-ou t d i scussed above , rep lacemen t cap i ta l i s no t
app l icab le to SMEs . In most cases SMEs can on ly access seed

23
cap i ta l f rom gove rnment agenc ies , bu t the remain ing t ypes o f
cap i ta l a re ava i lab le th rough p r i va te ven tu re cap i ta l i s t s (SAVCA
2003 /2004 :10 ) .
In o rde r to secu re a loan e i ther t h rough a pub l i c o r p r i va te
f inanc ia l p rov ider SMEs mus t f i r s t meet the m in imum requ i remen ts
o f tha t f under .
2.6 MINIMUM REQUIREMENTS FOR SMEs TO SECURE FUNDS
FROM VENTURE CAPITALISTS
In a compet i t i ve ven tu re cap i ta l marke t po ten t ia l app l ican ts must
meet va r ious requ i rements . Sma l l and med iu m-s ized en te rp r ises ,
i n par t i cu la r , comp la in tha t the i r lack o f access to adequate
in fo rmat ion and sou rces o f f inanc ing i s an obs tac le to the i r g rowth
(Bus iness Day 2005 :1 ; S i r t a ine 2006 :1 ) . S ta r t -up compan ies and
those compan ies wh ich need to expand the i r ex i s t ing ope ra t ions
need ven tu re cap i ta l f und ing in o rde r f o r them to ca r ry ou t the i r
p lans success fu l ly . The re a re var ious aspec ts wh ich ven tu re
cap i ta l i s t s cons ide r be fo re g ran t ing funds . SMEs on the o ther hand
a lso have ce r ta in aspec ts they cons ider im por tan t wheneve r they
app ly fo r f inance . Fo r SMEs to ge t f inance they must meet spec i f i c
m in imum requ i rements o r must f i t w i th in the inves tment po r t f o l ios
o f ven tu re cap i ta l i s ts (Ho r i zon Equ i ty 2005 b ) .
2.6 .1 Fac tors considered impor tant by venture capi ta l
prov iders
The re a re va r ious fac to rs tha t ven tu re cap i ta l i s t s cons ider be fo re
g ran t ing an app l i can t a loan . Acco rd ing to Cohan (2006 :50 ) ,
ven tu re cap i ta l i s ts when p rov id ing cap i ta l tend to be a t t rac ted to
fas t expand ing , o f ten h igh r i sk bus inesses , wh ich have s ign i f i can t
expo r t po ten t ia l . They look fo r a new ven tu re , wh ich has above
ave rage r i sk fo r p r i va te cap i ta l p rov iders and banks . Ventu re

24
cap i ta l p rov iders buy a cer ta in po r t i on o f the bus iness in the fo rm
o f sha res (Langdon & Bonham 2000:219) .
Ven tu re cap i ta l p rov ide rs cons ide r i nves t ing in SMEs to be r i sky,
there fo re ven tu re cap i ta l becomes expens ive . In o rde r to secure
fund ing the owners o f t he bus iness have to o f fe r a pos i t i on in the
bus iness to ven tu re cap i ta l i s t s (Langdon & Bonham 2000: 220 ) .
Ven tu re cap i ta l i s t s p re fe r t o make an inves tment in a sma l l
bus iness i f the owners have made a con t r ibu t ion to the company,
because they be l ieve a con t r ibu t ion by the owners shows tha t the
owners a re commi t ted to a bus iness ( Cava l luzzo & W olken
2005 :2154 ) .
Inves tment by ven tu re cap i ta l p rov ide rs is no rma l ly f o r a l im i ted
pe r iod , in most cases th ree to f i ve yea rs espec ia l l y f o r SMEs ;
there fo re ven tu re cap i ta l p rov ider s usua l l y w i l l look fo r an “ex i t
rou te ” when the inves tment i s about to matu re (Langdon & Bo nham
2000 :221 ) . An ex i t can be descr ibed as mutua l te rm ina t ion o f the
re la t ionsh ip be tween the pa r t ies . The most p re fe r red ex i t rou te fo r
mos t ven tu re cap i ta l i s t s w i l l be sa le o f the s take /sha res he ld in
the company. The inves tment ta rge ts o f A f r ican Merch ant Bank,
f o r examp le , a re compan ies o r en t rep reneu rs who a re in a h igh ly
compet i t i ve marke t . They be l ieve co rpo ra te f inance teams f rom
en t repreneu r ia l banks a re ga in ing marke t sha re because o f the i r
va lue -added ideas , p roducts , respons iveness and en t rep re neu r ia l
f la i r . In tha t case the company wi l l be p ro f i tab le w i th in the
inves tmen t per iod , and the re fo re w i l l enab le the inves to r to ex i t
the marke t when the t ime a r r i ves (A f r ican Merchan t Bank n .d . ) .
2.6 .2 Fac tors considered impor tant by SMEs
Some s ta r t -up bus inesses a re in f luenced by the h is to ry o r the
t rack reco rd o f t he inves tmen t company when choos ing a ven tu re
cap i ta l company. Such s ta r t -ups w i l l be more se lec t i ve when

25
choos ing a wo rk ing pa r tner , more espec ia l l y those managed by
en t repreneu rs w i th good t rack reco rd and sma l l bus iness
expe r ience (Ross et a l . 1996:332 ) .
The re a re some key cons ide ra t ions , wh ich a re impor tan t to SMEs
in such ins tances , some o f wh ich can be summar ised as fo l lows
(Ross et a l . 1996:333 ) :
2.6 .2 .1 Contr ibut ion o f management sk i l ls by the venture
capi ta l prov iders
S ince mos t s ta r t -ups do no t las t long due to l im i ted resou rces in
the fo rm o f management sk i l l s and ven tu re cap i ta l , S i r ta ine
(2006 :16 ) a rgues tha t the con t r ibu t ion o f the above ment ioned
resources cou ld make SMEs to las t l onge r . Even be fo re secur ing
f inanc ing, i t i s impor tan t f o r en t repreneu rs to unde rs tand the cos t
s t ruc tu res o f bus iness , wh ich many f i rms , do no t . Rea l i s t ica l l y
es t imat ing the requ i red s ta r t -up cos ts can be cha l leng ing ; i t
requ i res an en t rep reneur to es t imate bo th recu r r ing and non -
recur r ing cos ts .
Mos t p rospect i ve en t rep reneurs have no managemen t account ing
sk i l l s , such as budget ing (Jones & Tu l los 2002:234 ) . Ven tu re
cap i ta l p rov iders d ea l ing w i th th is t ype o f en t repreneu r f ind i t
cha l leng ing because the f inanc ia l es t ima t ions p rov ided a re no t
a lways re l iab le , as inexpe r ienced peop le have p repa red them .
The re fo re , en t rep reneu rs w i l l need the suppo r t o f a ven tu re
cap i ta l i s t tha t can p rov ide bo th cap i ta l , f inanc ia l and management
accoun t i ng sk i l l s .
2.6 .2 .2 Sty le o f management or funding
Managemen t s t y les a re d i f f e ren t among ven tu re cap i ta l i s ts . The
way in wh ich ven tu re cap i ta l i s t s p re fe r to mon i to r the i r i nves tment

26
i n a new bus iness w i l l in f luence the SMEs ‟ dec is ions when
se lec t ing an i nves to r . Some ven tu re cap i ta l i s t s p re fe r to be
invo lved in the da i l y runn ing o f a bus iness , wh i le o the rs leave the
runn ing o f the bus iness to en t repreneu rs a lone . The re fo re , be ing
assoc ia ted w i th a ven tu re cap i ta l i s t t ha t p re fe rs da i ly i nvo lvement
i n bus in ess a f fa i rs w i l l be a boost to t hose en t rep reneu rs who lack
su f f i c ien t expe r ience .
2.6 .2 .3 F inancia l in termediar ies
Ven tu re cap i ta l i s ts rece ive many app l ica t ions fo r cap i ta l f und ing.
Many o f these app l ica t ions spend mos t o f the t ime una t tended to
by ven tu re cap i ta l p rov ide rs . Howeve r , app l i ca t ions fo r f und ing
tha t have been re fe r red by accountan ts and lawye rs a re a t tended
to because these in te rmed ia r ies a re the ven tu re cap i ta l i s t s ‟ most
re l iab le sou rces o f in fo rma t ion . Th is means tha t to inc rease the
chances o f ge t t ing f inance , i t i s impor tan t to go th rough the
in te rmed ia r ies o f the ven tu re cap i ta l i s t s . En t repreneu rs who have
been re fe r red by in te rmed ia r ies have a be t te r chance o f success
in secu r ing funds than those who were no t re fe r red (L i les
1974 :468 ; Cohan 2006 :52 ) . SME owners w i l l have to cons ide r the
cos t imp l ica t ions o f us ing f inanc ia l in te rmed ia r ies when dec id ing
on a ven tu re cap i ta l i s t .
2.6 .2 .4 Ex i t s t ra tegy or route
Ven tu re cap i ta l inves tmen t f o r SMEs i s usua l l y f o r a l im i ted per iod
o f th ree to f i ve yea rs . A f te r th is pe r iod ven tu re cap i ta l i s t s expect
the company to be opera t ing e f fec t i ve ly , tha t i s , mak ing su f f i c ien t
p ro f i t t o cover expenses and repay the loan . A f te r tha t the
ven tu re cap i ta l i s ts w i l l ex i t the company by se l l i ng the i r s take ,
e i the r in te rna l l y o r exte rna l l y (Pa rhankangas & Landst r Öm
2006 :775 ) . Genera l l y ven tu re cap i ta l i s t s requ i re tha t there be
some way o f l i qu ida t ing the i r i nves tmen t be fo re they a re p repared

27
to commi t f unds to the company. Th is means tha t the owners must
have a p lan o f th ree to f i ve yea rs on how they w i l l ra i se su f f i c ien t
f unds to enab le the ven tu re cap i ta l i s ts to end the re la t ionsh ip w i th
the bus iness .
W i th bus inesses l i s ted on the s tock exchange , th i s no rma l l y poses
no g rea t p rob lem. Howeve r , sma l l bus iness es f ind th i s a
s ign i f i can t p rob lem as the ma jo r i t y o f them are no t l i s ted on the
s tock exchange and the ven tu re cap i ta l i s ts f ind i t d i f f i cu l t to
l i qu ida te the i r s takes when they a re ready to ex i t the marke t
(McLaney 200 3 :429 ) . Many sma l l bus inesses wi l l p r e fe r a ven tu re
cap i ta l i s t who wi l l se l l the sha res to the found ing members o f the
bus iness and no t to the pub l i c .
2 .7 DIFFICULTIES EXPERIENCED BY SME s IN ACCESSING
VENTURE CAPITAL FUNDING
The re a re a number o f d i f f i cu l t i es expe r ienced by SMEs in
access ing ven tu re cap i ta l . Some ven tu re cap i ta l i s ts p re fe r to
f inance s ta r t -up compan ies in s tages , as they a re pe rce ived as
be ing very r i sky . The max imum number o f s tages app l icab le to
SMEs a re th ree . These s tages have been c rea ted to reduce r i sks
and fu r the r f inanc ing i s cond i t iona l based on the resu l ts o f the
f i rs t s tage .
S tage one f inanc ing m igh t be enough to ge t a p ro to type bu i l t and a
manufac tu r ing p lan comp le ted . Based on the resu l t s o f t he f i rs t
s tage , the second -s tage f inanc ing m igh t be a ma jo r inves tmen t
needed to ac tua l l y beg in manufac tu r ing , marke t ing and
d is t r ibu t ion . The second s tage f inance i s cond i t iona l and i s most
i n f luenced by the ou tcomes o f f i r s t s tage (Ross et a l . 1996 :332 ) .
Even i f f unds a re ava i lab le in s tages , the re a re o ther p rob lems
wh ich s ta r t -up compan ies encounte r .

28
Stage o f inves tment i s a l so found to be among the ma jo r
i n f luen ces in the inves tment dec is ion . F i rs t -s tage app l ican ts w i l l
f ind i t d i f f i cu l t to ge t f unds compared to those compan ies tha t
have reached acce le ra ted g rowth o r la te r g rowth s tages (DTI
2005 ) . S ince 1992 , the re has been a t rend towards heav ie r
i nves t ing and re inves t ing in ven tu res reach ing the la te r s tage as
the r i sk is lower , re tu rns a re qu icke r and less manager ia l a t ten t ion
i s requ i red by the ven tu re cap i ta l f i rm (Sca rbo rough , W i lson &
Z immere r 2009:503 ) .
Research on the reasons fo r den ia l and low inves tment in SMEs
has been unde r taken and some o f the reasons fo r low inves tment
a re in f luenced by a number o f aspec ts wh ich a re ou ts ide the
SMEs‟ con t ro l . Some re sea rche rs have found tha t success in
ob ta in ing ven tu re cap i ta l o f ten depends on the indus t ry sec to r
(Hustedde & Pu lve r 1992:363 ) . Ven tu re cap i ta l p rov ide rs seek to
avo id r isk wh i le max im is ing re tu rns , and a re l i ke l y to avo id loss o f
f unds and t ime invo lved in d i sp ropo r t iona te mon i to r ing and due
d i l i gence assoc ia ted w i th cer ta in popu la t ions o f en t repreneu rs
(Jones & Tu l los 2002 :235 ) .
S tud ies have shown tha t p rox im i t y to an u rban ised se t t ing is
c r i t i ca l in acqu i r ing cap i ta l (Hustedde & Pu lve r 1992 :3 ) .
Geograph ica l loca t ion has been found to be a no the r f ac to r tha t
d is t ingu ishes more success fu l and less success fu l f i rms in
ob ta in ing ven tu re cap i ta l . I t i s w ide ly recogn ised tha t ven tu re
cap i ta l f i rms a re geograph ica l l y concent ra ted in ce r ta in a reas .
Inves t iga t ions by Kasekende and Opondo (2003 :3 ) and W r igh t
(1995 :48 -63 ) revea led the fo l lowing reasons fo r den ia l o f f und ing :
Reasons fo r tu rn ing down loan app l ica t ions by ven tu re cap i ta l
p rov iders re la te to ven tu re su i tab i l i t y , f o r examp le no t
i n te res ted in the sec to r o r indus t ry .

29
Marke t po ten t ia l , management competence and p roduct
f eas ib i l i t y accounted fo r 50% o f the reason s fo r den ia l .
De f ic ienc ies in the ven tu re management team.
2 .8 F INANCI AL INSTITUTIONS: BANKS
Access to f inance has become an impor tan t i ssue f o r po l i cy
makers ac ross Sou th A f r ica when cons ide r ing the esca la t ing
unemp loyment ra te among the you th leav ing va r ious educa t io na l
i ns t i tu t ions (Nafukho 1998: 100 ) . H is to r i ca l l y commerc ia l banks a re
known to be the ma jo r sou r ce o f c red i t f inanc ing fo r b ig
bus inesses . Howeve r , the re is less in fo rmat ion to suppo r t tha t
banks a re indeed f und ing new and smal l bus inesses (Chu rch i l l &
Lewis 1985 :194 ; Sca rbo rough et a l . 2009 :487 ) . Fo r an SME to
ob ta in f inance f rom a bank , i t must f i rs t meet the c r i te r ia o f tha t
pa r t i cu la r bank (Sma l l bus ines s lend ing su rvey resu l ts 1995 :57 ) .
In te rms o f the bank loan appra isa l p rocess , the s ta t is t i cs ind ica te
a g rea te r emphas is on the „go ing conce rn ‟ app roach (SAVCA
2005 ) . In seek ing bank f inance mos t f i rms a re requ i red to p roduce
th ree yea rs o f p ro jec ted f i gu res and a bus iness p lan and th i s does
no t f avou r those SMEs who a re s t i l l a t an ea r l y s tage o f bus iness
(Goosen , Pampa l l i s , Van de r Merwe & Md lu l i 1999 :259 ) .
S ince the 1994 e lec t ions , a l l the p r i va te bank ing ins t i tu t ions and
gove rnment backed ins t i tu t ion s in the coun t ry have rev ised the
assessmen t c r i te r ia to f i t the spec ia l requ i rements o f sma l l
bus iness owners and to endeavou r to be BEE compl ian t (Goosen
et a l . 1999 :231 ) . Acco rd ing to S to rey (1994: 204 ) , sma l le r f i rms
s t i l l f ind i t d i f f i cu l t to ob ta in sma l l amounts o f cap i ta l th rough
banks and fee l pena l ised because they can on ly ob ta in h igh
in te res t loan cap i ta l .

30
2.8 .1 Reasons for low inves tment in SMEs
Research shows tha t banks s t i l l f und very few SMEs, espec ia l l y
those a t s ta r t -up leve l . Some o f the reasons fo r low inves tmen t by
banks in SMEs a re d i scussed be low:
2.8 .1 .1 Percept ions as an obstac le to f inance
The re a re a number o f pe rcep t ions assoc ia ted w i th SMEs. A ma jo r
pe rcep t ion fo r banks is tha t assess ing the r isk as soc ia ted w i th
SMEs i s bo th d i f f i cu l t and cos t l y (Cohan 2006 :52 ) . Inab i l i t y o f
commerc ia l banks to suppo r t SMEs i s due to the h igh degree o f
r i sk invo lved , h igh loss and p ro f i t s assoc ia ted w i th SMEs
(Schoombee 2000:2 ) . Lend ing to SMEs is more cos t ly than le nd ing
to la rge compan ies as the re tu rns ea rned on smal l bus iness es a re
low.
Ove ra l l , sma l l bus iness loans a re less p ro f i tab le fo r p rov ide rs than
la rge bus iness loans due to adm in is t ra t ion cos ts (Church i l l &
Lewis 1985:193 , Kno t t 2004 :156 ; Cohan 2006:53 ) . “Two ma jo r
imped iments to ra i s ing cap i ta l f o r sma l l bus inesses a re tha t these
bus inesses have v i r tua l l y no ab i l i t y t o gua ran tee deb ts and the i r
po ten t ia l equ i t y marke ts cons is t p r imar i l y o f the fam i l y and c lose
f r iends o f the p rop r ie to r o r pa r tne rs ” (Ma ie r & W alke r 1987: 208) .
The amoun t o f cap i ta l t ha t can be bo r rowed by SMEs as compared
to compan ies a l so makes the pe rcep t ion aga ins t se rv ing SMEs to
g row (Grego ry et a l . 2005 :385 ) .
These r i sks inc lude the d i f f i cu l t y o f assess ing managemen t teams,
the lack o f t rack reco rds o f en t rep reneu rs and lower re tu rns on
inves tmen ts in t hese bus inesses . The expecta t ion o f exc lus ive ly
h igh t ransac t ion cos ts fo r f inanc ia l ins t i tu t ions and the knowledge
tha t inves t ing in loca l SMEs o f ten invo lves work ing w i th

31
en t repreneu rs un fam i l ia r w i th conven t iona l f i nanc ing re la t ionsh ips
a lso does no t f avou r SMEs when they a t tempt to ra is e f i nance .
As the ma jo r i t y o f the ta rge ted sma l l bus iness owners a re
unemp loyed and HDP, these owners do no t have secu r i t y
(Schoombee 2000: 3 ) . The o the r reason i s tha t sma l le r f i rms a re
t yp ica l l y no t pub l i c l y he ld and the re fo re no t sub jec t to pub l i c
d isc losu re regu la t ions and thus have no fo rma l l y p repared
f inanc ia l s ta tements (Grego ry et a l . 2005 :386 ) .
2 .8 .1 .2 The need for col la tera l by banks
A l t hough the gove rnment p rov ides secu r i t y mechan isms th rough
Khu la Cred i t Guaran tee , mor tgage ove r immovab le asse ts is what
f inanc ia l ins t i tu t ions p re fe r as secur i t y whenever lend i ng money
(S to rey 1994 :204) . F inanc ia l i ns t i tu t ions a lso accep t p ledges on
movab le asse ts , bu t these asse ts a re cons ide red less secure
gua ran tees , so the bo r rower must pay h ighe r i n te res t ra tes than
those app l ied to c red i t secu red wi th mor tgages (DTI 2005 ) . Th is i s
a mat te r o f spec ia l conce rn to SMEs, because most sma l l bus iness
owners lack immovab le asse ts , and the re fo re a re no t ab le to
secu re low-cos t mor tgaged c red i t .
I n p rac t ice , on ly sha res and negot iab le o r c red i t i ns t ruments a re
used as co l la te ra l f o r possesso ry p ledges. Banks on ave rage
p re fe r equ i t y f inanc ing . “Equ i t y f inance i s the cap i ta l g ran ted by a
pe rson o r ins t i tu t ion tha t takes a sha re in a company in re tu rn fo r
money . Th is i s norma l l y used fo r sma l l bus inesses tha t have good
p rospec ts fo r f as t g rowth and above -average re tu rns ” (Smal l
cap i ta l… 2005 :8 ) .

32
2.8 .1 .3 Gap in in te res t ra tes
“Some o f the newly es tab l ished sma l l f i rms, o r those tha t a re
expand ing rap id l y , f a i l to ob ta in su f f i c ien t f i nanc ing , because the
ex is tence o f a gap in in te res t ra tes p reven ts the banks f rom
cha rg ing equa l in te res t ra tes to cove r th e ex t ra r isks invo lved o r
pe rce ived to be invo lved in f und ing SMEs ” . The ce i l i ng in in te res t
ra tes does no t inc rease the to ta l supp ly o f bank advances to the
sma l l bus iness sec to r (Johns e t a l . 1983 :134 ) . Th is may
d iscou rage new SMEs o r recen t l y es tab l i she d smal l f i rms, when
the above phenomenon i s no t j us t i f ied in t he l i gh t o f t he i r
p rospec t i ve p ro f i tab i l i t y . The h igh ra tes o f in te res t have the e f fec t
o f w iden ing the gap be tween the in te res t ra tes charged by banks
and those cha rged by f i nance compan ies . As a resu l t , sma l l f i rms
become fa r less w i l l i ng to seek a loan f rom a f inance company,
p re fe r r ing to wa i t f o r the cheape r f inance tha t may become
ava i lab le f rom pub l ic l y backed ins t i tu t i ons (Johns et a l . 1983 :134 ) .
2.8 .1 .4 Lack o f sk i l ls to manage bank acc ount and to supply
in format ion
The d i f f i cu l t ies tha t sma l l f i rms encounte r i n ob ta in ing long - te rm
f inance canno t be a t t r ibu ted en t i re l y to sho r tcom ings in the
a r rangemen ts fo r the supp ly o f f inance (Mc In ty re & Da l lago
2003 :187 ) . Sma l l f i rms lack the manag ement account ing sk i l l s and
expe r ience to p repa re p roper app l ica t ions fo r f inance , o r may fa i l
to pe rseve re when a f i r s t app l ica t ion is re jec ted (Knot t 2004 :15 4) .
The re i s c lea r ev idence tha t some sma l l f i rms fa i l to ob ta in needed
long- te rm f inance because o f f ac to rs in te rna l to the en te rp r i se o r
because o f a lack o f adequate in fo rmat ion a nd advice (W atson &
W i lson 2002:557 -8 ) . In many cases , f a i lu re can be a t t r ibu ted pa r t l y
to the a t t i tude o f the sma l l bus iness p rop r ie to rs and to the i r
l im i ted management a ccount ing sk i l l s and expe r ience .

33
Banks in South A f r ica use the behav ioura l sco reca rd in assess ing
c red i two r th iness . They cons ide r the way the accoun tho lde r uses
h is /he r account when they g ran t a loan . I f much o f the
accoun tho lde r ‟s money does no t spend mu ch t ime in an account
and the accoun tho lde r has a number o f unpa id deb ts , i t w i l l wo rk
aga ins t the accoun tho lde r when app ly ing fo r a loan . The banks
ca lcu la te a pe rson ‟s c red i t ra t ing by ana lys ing how tha t pe rson
has used the i r accoun t . Fo r examp le , i f a sma l l bus iness owner
i ssues a cheque wi thou t the funds to cove r i t , t h i s wo rks aga ins t
the sma l l bus iness owner . I f , howeve r , the sma l l bus iness owner
in fo rmed the bank tha t th is m igh t happen, i t cou ld wo rk in h i s /he r
f avou r . These a re some o f the aspects w h ich , f o r ins tance , HDPs
a re no t aware o f , and the behav iou ra l sco recard c rea tes p rob lems
when sma l l bus iness owners have to app ly fo r f unds th rough banks
(Sma l l cap i ta l… 2005 :24 ) .
2.8 .1 .5 Gender as an obstac le to f inance
Va r ious s tud ies have examined d i f f e ren t ba r r ie rs faced by
en t repreneu rs in s ta r t ing the i r f i rms. Inves t iga t ions in t he pas t
have revea led tha t f ema le en t repreneu rs face add i t i ona l ba r r ie rs
s temming f rom a lack o f knowledge , sk i l l s and expe r ience wh ich
a re deemed c r i t i ca l to ven tu re c re a t ion and g rowth (Knot t
2004 :156 ) . Jones and Tu l los (2002 :233 ) repor t tha t f inanc ia l
i ns t i tu t ions c i te women ‟s lack o f con f idence in p resen t ing the i r
bus iness p lans and the i r lack o f expe r ience in t he f i nanc ia l rea lm
as fac to rs con t r ibu t ing to d i f f i cu l t ie s in ob ta in ing c red i t . A f te r the
imp lementa t ion o f BEE in South A f r ica the ra te o f f ema le
en t repreneu rs has inc reased. Th is i s due to the fac t t ha t mos t
f inanc ia l p rov ide rs a re requ i red to be BEE compl ian t when lend ing
funds .

34
2.8 .2 Minimum requirements for secur ing funds wi th the
banks
Bes ides the sk i l l s possessed by SMEs ‟ managemen t , the re a re
o ther aspec ts tha t banks cons ider impor tan t be fo re they make
cap i ta l ava i lab le . Some o f these aspects a re ( Sma l l cap i ta l…
2005 :10 ) :
The owner ‟s con t r ibu t ion (o r cap i ta l i n jec t ion ) i n to the bus iness
i s an impor tan t ind ica to r tha t banks use . I f the SME owner has
con t r ibu ted l i t t le o r no equ i t y to the bus iness , the banks w i l l be
hes i tan t in g ran t ing a loan . Banks do no t f inance the bus iness
owner , t hey f inance ope ra t ing asse ts and work ing cap i ta l
because these a re wha t gene ra te revenue fo r t he company.
The re fo re mak ing a sma l l cap i ta l con t r ibu t ion to the bus iness is
a good s ta r t , as i t shows tha t the owners have a l ready cove red
some o f the p re l im ina ry expenses, f u r th er ind ica t ing tha t the
en t repreneu r on ly needs cap i ta l to k i ck -s ta r t bus iness
ope ra t ions .
Sma l l bus inesses may no t have re l iab le ba lance sheets , as
many SMEs t yp ica l l y do no t keep p rope r books . Th is is a
d isadvan tage , because banks use f i xed asse ts as co l l a te ra l .
SMEs t yp ica l l y do no t have s t rong cash f lows . Banks must be
sa t is f ied tha t bus inesses wi l l be ab le to repay loans , bu t th is
can p rove d i f f i cu l t i f they a re expe r ienc ing cash cons t ra in t s .
A ven tu re cap i ta l p rov ide r cons ide rs va r ious aspec ts when
assess ing a bus iness p roposa l o r p lan . Some o f these fac to rs
re la te to bus iness wh i le o the r concerns the management t eam. A t
the end o f the sc reen ing p rocess va r ious fac to rs as d i scussed
be low, de te rmine whethe r the app l ica t ion is success fu l o r no t .
The owner may lack the necessa ry bus iness management sk i l l s t o
run a sma l l bus iness . The owner i s a l so requ i red to have the

35
expe r ience and ab i l i t y to run the bus iness . Inves to rs w i l l a l so want
to see g rowth po ten t ia l and have a good idea o f what t he re tu rn on
the i r inves tmen t w i l l be (B runo & Tyebee 1985 :62 ; Cohan
2006 :52 ) .
I f they a re no t conv inced o r sa t i s f ied w i th some o f the above
aspec ts o f the i r assessment p rocedu re , f inance wi l l no t be g ran ted
to SMEs. To secu re f inance wi th banks the SME ‟s owner / s must
d isp lay the ab i l i t y t o run the bus iness smooth ly . Acco rd ing to
Sma l l cap i ta l (2005 :10 ) most o f the commerc ia l banks use the
fo l lowing c r i te r ia when assess ing a bus iness p lan :
2 .8 .2 .1 Management
Be fo re g ran t ing a loan banks w i l l take the fo l l owing in to
cons ide ra t ion :
“Pro f i le o f en t rep reneu r ” : Check work re la ted expe r ience in
re la t ion to SMEs managemen t .
“Managemen t , f inanc ia l and marke t ing sk i l l s ” : assessment o f
the ab i l i t ies demonst ra ted in the pas t in re la t ion to marke t ing
func t ions .
“Techn ica l expe r ienc e ” .
2 .8 .2 .2 F inanc ia l
Banks cons ide r the fo l lowing f inanc ia l f ac to rs be fo re g ran t ing a
loan :
“Owner ‟s con t r ibu t ion : The more in i t ia l cap i ta l the owner pu ts
i n to the bus iness , the be t te r h i s /her chances o f ge t t ing t he
l oan ” .
“Rea l i s t ic p ro jec t io ns : These ind ica te the l i ke l ihood o f bus iness
success . F inanc ia l p ro jec t ions p ro jec t how much cos ts and
p ro f i t the bus iness is l i ke l y to incu r and gene ra te ” .

36
“Debt car ry ing capac i t y : Th is re fe rs to h ow much the owner can
rea l i s t i ca l l y bo r row and pay back ” .
“Assets : These can be used as co l la te ra l ” .
2 .8 .2 .3 Secur i ty
Secu r i t y in the fo rm o f co l l a te ra l i s wha t banks look fo r be fo re
g ran t ing a loan . The fo l lowing fo rms o f secur i t ies w i l l be
cons ide red :
“Tangib le co l la te ra l : Prope r t y o r inves tments ” .
“ In tang ib le co l la te ra l : Su re tysh ips , f o r example , by the
owners ” .
“Persona l asse ts : The owner can use these as secu r i t y f o r a
loan ” .
“Cash f low: The s t ronge r the cash f low, the less r i sky the
bus iness ” .
2.8 .2 .4 Business envi ronment
The env i ronment in te rms o f whe re the bus iness w i l l be conducted
i s one o f the fac to rs cons ide red impor tan t . The fo l l owing fac to rs
w i l l be taken in to cons ide ra t ion :
“ Indus t ry r i sks : I s the re a r i sk o f po l lu t ion in the a rea where the
bus iness is based? ”
“Locat ion : I s i t conven ien t f o r cus tomers ? ”
“Compet i t ion : W here a re the compet i t o rs and how sa tu ra ted is
the marke t? ”
“Ent ry bar r ie rs : These inc lude leg is la t ion on f ranch is ing , i ssues
re la t ing to how long i t w i l l take to se t up , repu ta t ion and the
cos ts o f en te r ing the marke t ” .
On ave rage most s ta r t -up app l ica t ions a re sa id to be poor l y
p repa red due to a lack o f managemen t account ing sk i l l s , more

37
espec ia l l y among young en t repreneu rs (Tus t in 2003:4 ) . In
add i t ion , the re i s a lack o f in te res t i n en t repreneu rsh ip among new
gradua tes . Th is lack o f in t e res t i s f ue l led by the idea tha t banks
a re conserva t i ve towards sma l l en te rp r i ses and there fo re the i r
cu r ren t lend ing po l ic ies a re qu i te res t r ic t i ve . Prev ious ly the
pe rcep t ion w i th in the banks was tha t lend ing money to a less
es tab l ished bus iness o r one w i th no bo r rowing t rack reco rd was a
r i sky t ransac t ion (Bus iness Repor t s 2006:1 ) .
Inc reas ing the chances o f ob ta in ing a loan f rom a bank requ i res a
lo t o f wo rk and in mos t cases en t rep reneu rs a re no t w i l l ing to go
th rough the se t c r i te r ia , because th is p r ocess invo lve s a lo t o f
t ime. The n ine requ i rements o f app l ica t ion fo r f inance tha t have
been iden t i f ied by Sma l l Bus iness Admin is t ra t ion (1997 ) , F reea r ,
Soh l and W etze r (1996 ) and Goosen et a l . (1999:255 ) a re as
fo l lows:
(1 ) S ta te the pu rpose o r reason fo r t he loan : The lende r w i l l be
l ook ing fo r someth ing tha t f i t s w i th in the no rma l range and
expe r t ise o f the bus iness . The amoun t may cove r a number
o f i tems , so the bus iness must be ab le to cove r a l l o f these
toge the r . As most HDPs a re f rom poo r fami l y backg rounds,
they fa i l t o acqu i re the re levan t sk i l l s tha t w i l l he lp them to
p repa re and p resen t in de ta i l the amounts they need to cover
and to mot i va te why they need such an amount (Newton
2001 :19 ) .
(2 ) Request the amount and the repaymen t te rm o f the sma l l
bus iness (e .g . R100 000 ove r 5 years , payab le qua r te r l y ) .
(3 ) Exp la in how the amount bo r rowed wi l l be repa id .
(4 ) D iscuss the de ta i ls o f the secur i t y tha t can be o f fe red to the
lende r .

38
(5 ) P repa re a bus iness p lan , wh ich w i l l se rve to answer essen t ia l
ques t ions re la t ing to management capab i l i t ies , in fo rmat ion
abou t the marke t i n wh ich the bus iness op e ra tes and the k ind
o f bus iness .
(6 ) P resen t them wi l l f inanc ia l s ta tements fo r th ree yea rs .
(7 ) P rov ide the bank wi th the la tes t se t o f managemen t
accoun ts .
(8 ) P resen t the a ccounts rece ivab le and payab le reco rds .
(9 ) P rov ide the cu r ren t p ro jec ted f inanc ia l s ta tements .
Sma l l bus iness owners in South A f r ica make g rea te r use o f the i r
re ta ined p ro f i t s and bor rowings f rom f r iends to f inance the
expans ion p lans (Johns, Dun lop & Sheehan 1983:126 ; Ku r i l o f f et
a l . 1993 :357 ) . The obv ious answer i s t ha t long - te rm f inance f rom
ex te rna l sou rces i s no t read i l y ava i lab le o r i s more cos t l y than
us ing in te rna l f unds . F i rms tha t expe r ience fas t g rowth f ind the i r
ava i lab le funds to be inadequate , and they cannot cove r exac t l y
what they need to do .
In summary , when lend ing to a sma l l f i rm , a t rad ing bank is
conce rned wi th the secur i t y l i nked to the loan , l i qu id i t y o f asse ts ,
f i rms ‟ pas t record and , to some ex ten t , i t s f u tu re p rospec ts . Bank
lend ing wou ld become even more cos t l y to p rospect i ve sma l l
bus iness owners i f the banks assessed in de ta i l t he fu t u re
p rospec ts o f each sma l l bus iness tha t app l ied fo r a loan . Sma l l
bus inesses tha t have good g rowth p rospects , bu t have l i t t le
secu r i t y , a re bes t hand led on an ind iv idua l bas is by spec ia l i s t
f inanc ia l i ns t i t u t ions capab le o f assess ing the r isks invo lved , and
a re capab le o f p rov id ing techn ica l and manager ia l adv ice where

39
approp r ia te and supp ly ing a su i tab le m ix o f equ i t y and loan cap i ta l
(Dushn i t sky & Lenox 20 06:754 ) .
2.9 ALTERNATIVE SOURCES OF CAPITAL APPLICABL E TO
SMEs IN THE P AST
Mos t new s ta r t -ups beg in w i th cap i ta l i n fus ion f rom in fo rma l
sou rces such as the fami l y o r f r iends o f the founde r ( E l i t zu r &
Gav ious 2003:709 ) . Many success fu l and p ro f i t ab le sma l l and
med ium -s ized manufac tu r ing f i rms in an economy were o r ig ina l l y
f ounded by ind iv idua ls w i th a techn ica l background and a f l a i r f o r
eng inee r ing des ign , bu t w i th l i t t le cap i ta l (Johns et a l . 1988:145 ) .
E l i t zu r and Gav ious (2003:709) and Kur i lo f f et a l . (1993 :357 )
con tend tha t sma l l bus iness is f o remos t a g roup leve l phenomenon
tha t i s h igh ly dependent upon soc ia l g roup resou rces fo r i t s
deve lopment . Accord ing to Hann ig and Joube r t (2003 :33 ) , sma l l
bus inesses in i t ia l l y ob ta in funds fo r the i r sus tenance and
expans ion wi thou t gove rnment ass is t ance . In gene ra l , the re a re
th ree sou rces fo r such funds :
Own f i nance
Fami l ies and f r iends
Ange l
E l i t zu r and Gav ious (2003:710) ind ica te tha t many gove rnmen ts
s ta r ted recen t l y to deve lop an in te res t i n SMEs and even c rea t ing
pub l ic backed f inanc ia l ins t i tu t ion s . The smal l bus iness owner is
pe rce ived in the commun i t ies as a pe rson who faced many
cha l lenges to es tab l ish the bus iness o r has used o ther sou rces
l i ke c lose f r iends and re la t i ves ‟ suppo r t ( Kur i lo f f e t a l . 1993 :357 ) .
In most cases the sou rces o f f inance app l icab le to a HDPs in
Sou th A f r i ca in the pas t was f rom re la t i ves , f am i l y members and
soc ia l c lubs (Mann 1990 :60 ) . Many HDPs a rgues tha t the

40
par tnersh ips we re used as the ma in in i t i a t i ve they can use to
es tab l ish the i r bus inesses , no t as ind iv idua ls (Mann 1990 :30 ) .
H igh ra tes o f persona l and company income tax make i t more
d i f f i cu l t f o r sma l l bus inesses to f inance g rowth f rom in te rna l
sou rces , and in many cases the cap i ta l requ i rements fo r the
deve lopment o f innova t ions have p robab ly inc reased as t ime goes
by . Even today the re i s s t i l l s t rong ev idence to suggest tha t the re
a re se r ious p rob lems fo r sma l l bus inesses in ob ta in ing long - te rm
f inance fo r i nnova t ion .
“ In the cu r ren t bus iness en v i ronmen t mos t en t re p reneu rs f ind i t
necessa ry to use some very c rea t i ve techn iques to ge t the i r
bus inesses o f f the g round ” . Co l lec t i ve ly , these techn iques a re
ca l led “boots t rapp ing ” (Meye r & A l len 1994 : 258 ) . The re appea rs to
be a case fo r es tab l i sh ing a spec ia l f inanc ia l ins t i tu t ion w i th
gove rnment suppo r t , wh ich wou ld be conce rned p r imar i l y w i th
p rov id ing deve lopment f inance to sma l l innova t i ve f i rms .
A sec to ra l rev iew o f the s ta te o f sma l l bus iness deve lopment in
Sou th A f r ica by N ts i ka fo r 2002 ind ica ted tha t the manufac tu r ing
sec to r was g rowing a t a ra te o f 7 .5% in sma l l bus inesses and
21 .2% in med ium -s ized bus inesses , wh i le the agr icu l tu ra l sec to r
was g rowing a t 9 .2% in sma l l and 43 .8% in med ium -s ized
bus inesses (Nts ika En te rp r ise P romot ion Agency 2002 ) .
2.10 STATUS OF THE SMALL BUSINESS SECTOR
Du r ing the pas t few yea rs d i f f e ren t agenc ies have become more
in te res ted in f i nd ing ou t how to s t imu la te the deve lopment o f
SMEs (Mann 1990 :64) . Much o f the a t ten t ion w i th rega rd to g rowth
in sma l le r f i rms has focused on cap i ta l s t ruc tu re dec is ions ,
because p rob lems re la ted to f inanc ing dom ina te in sma l l and
f ledg l ing f i rms (Te rps t ra & O lson 1993 :5 ) .

41
In recen t yea rs , ven tu re cap i ta l i s ts have p layed an expand ing
f inanc ia l ro le suppo r t ing a b road spec t rum o f bus iness ac t i v i t ies
(Gumming 2006:1085 ) . Howeve r , many banks a re a lso adopt ing a
c l ien t -based approach fo r mana g ing smal l bus iness and o f fe rs
s tanda rd ised p roducts , such as c red i t scor ing fo r sma l le r c red i ts .
In a s tudy repo r ted on in t he Jou rna l o f Commerc ia l Lend ing
(Sma l l bus iness lend ing… 1995 :57) , 84% o f the responden t
i ns t i tu t ions p rocessed smal l bus iness l oans on ly , ind ica t ing tha t
the commerc ia l banks a re no longe r perce iv ing SMEs as too r isky
s ince they a re now serv ing them.
Cu r ren t leve ls o f i nves tmen t in SMEs a re inad equa te fo r ach iev ing
the g rowth leve ls an t ic ipa ted in the Governmen t ‟ s Growth
Emp loyment and Red is t r ibu t ion (GEAR) p rogramme. To ove rcome
the lack o f i nves tment in SMEs , gove rnment has es tab l i shed
f inanc ia l i ns t i tu t i ons fo r empower ing HDP.
Some o f the fac to rs con t r ibu t ing to low inves tmen t by banks in
SMEs a re due to the h is to r ica l s t ruc tu re o f the f i nanc ia l sec to r .
The f i nanc ia l sec to r is made up o f a more conserva t i ve bank ing
sec to r tha t i s more focused on serv ing on ly b ig compan ies (DTI
1998 :2 ) . Due to chang ing economic cond i t ion s and the ro le o f
SMEs in the economy , banks a re now exp lo i t ing th i s new marke t
a rea (Scarborough et a l . 2009 :525 ) . Acco rd ing to Knot t
(2004 :156 ) , access to cap i ta l can be inc reased i f :
SMEs and p r i va te funde rs deve lop new bus in ess unde rs tand ing ,
Change o f percep t ion by banks and SMEs owners ,
Banks becoming more c l ien t o r ien ted , no t t ransac t ion o r ien ted .
Pub l ic and p r i va te sec to r par tne rsh ip wh ich is the in i t ia t i ve o f bo th
the gove rnment and banks has been fo rmed to inc rease the ra te o f
SMEs wh ich can access cap i ta l . The fo l lowing in i t ia t i ves have
been c rea ted .

42
2.10 .1 Current developments
In recogn i t ion o f the fac t tha t access to cap i ta l i s a key cons t ra in t
to the deve lopmen t o f SMEs, the gove rnment and the p r i va te
sec to r have pu t i n to p lace a number o f in i t i a t i ves des igned to
leve rage g rea te r p r i va te and non -gove rnmenta l sec to r inves tment
i n SMEs. Notab ly , two new ins t i tu t ions , Khu la and N ts i ka , we re
fo rmed in 1996 to c rea te inc reased cap i ta l de l i ve ry capac i t y to
SMEs. These ins t i tu t ions p rov ide suppo r t in f ras t ruc tu re and
abso rb a po r t ion o f the r i sks and cos ts o f p r i va te inves tment in
SMEs (Goosen e t a l . 1999:231) .
W i th the fo rmat ion o f the Nat iona l Co -o rd ina t ion Of f ice o f
Manufac tu r ing Adv iso ry Cent re (NAMAC), wh ich merged i n 2004
wi th Nts i ka and the Commun i t y Pub l ic P r i va te Pa r tne rsh ip (CPPP)
to fo rm the Sma l l En te rp r ise Deve lopment Agency (SEDA), i t
became c lear tha t t he gove rnmen t wanted to speed up the c rea t ion
o f SMEs in the manufac tu r ing sec to r . F inance agenc ies w i l l now
be ab le to o f fe r SMEs re levan t in fo rmat ion and adv ice and re fe r
them to the co r rec t o rgan isa t ions when seek ing f inance .
Government ‟ s f ocus on empowermen t has resu l ted in the c rea t ion
of o the r p rov ide rs o f equ i t y f inance to SMEs. Gove rnment
cur ren t l y p rov ides fund ing th rough a number o f o rgan isa t ions :
The Indus t r ia l Deve lopment Co rpo ra t ion ( IDC) , s ince 2001, has
been mandated to a id empowerment and p rov ide deve lopment
f inance to SMEs so tha t en t rep reneu rsh ip is encou raged in
b lack communi t i es .
The Nat iona l Empowerment Fund (NEF) was fo rmed to f inance
and suppor t b lack -managed and b lack -owned bus inesses .
Khu la En te rp r ise F inance was formed to fac i l i ta te access to
c red i t f o r SMEs, bu t has a lso moved in to equ i t y f inanc ing .

43
The Umsobomvu Youth Fund (UYF) was fo rmed to f i nance
deve lopment oppo r tun i t ies fo r b lack you th (aged be tween 18
and 35 yea rs ) , inc lud ing equ i t y f inanc ing fo r SME deve lopment .
S ince 2000 these o rgan isa t ions have c rea ted a number o f equ i t y
f unds ta rge t ing empowermen t , i nc lud ing NEF Ventu res , the
W omen‟s P r i va te Equ i t y Fund, the Umsobomvu Genera l Fund, the
F ranch ise Fund, the P rogress Fund and Khu la ‟s Equ i t y Funds.
Excep t f o r t he above ment ioned deve lopments , gove rnment and
banks a lso have o ther in i t ia t i ves in p l ace to inc rease inves tmen t in
SMEs. Some o f these a re d i scussed in the fo l lowing sub -sec t ions .
2.10 .2 Khula -guaranteed loans
The Khu la -gua ran teed loan scheme i s spec i f i ca l l y d i rec ted towards
the sma l l bus iness sec to r and i s a recen t innova t ion by
gove rnment a imed a t i nc reas ing inves t men t in sma l l compan ies by
banks . Th is ins t i tu t i on has been c rea ted to ease the access to
f inance and lack o f co l la te ra l gua ran tees fo r SMEs, as Khu la
gua ran tees loans up to a ce r ta in amount (N ts ika En te rp r ise
P romot ion Agency 1999:26 ) .
2.10 .3 Incent ives
Incen t i ve schemes deve loped by the IDC, DTI , loca l o r p rov inc ia l
au tho r i t ies and co -ope ra t i ve in i t ia t i ves have the ind i rec t e f fec t o f
s t rengthen ing the p ro f i tab i l i t y o f sma l l bus iness en te rp r ises . These
incen t i ves improve the chances o f f i rms a t t rac t ing p r i va te ven tu re
cap i ta l p rov ide rs (Ma lgas 2002:119) .
44
2.10 .4 In i t ia t ives by banks
In recen t yea rs , a number o f a l te rna t i ve p roposa ls have been pu t
f o rward fo r inc reas ing the ava i lab i l i t y o f f inance by banks to sma l l
bus inesses in South A f r ica . I t has be en suggested , f o r example ,
tha t the supp ly o f cap i ta l wou ld be improved i f (E l i t zu r & Gav ious
2003 :710 ) :
Sma l l bus iness owners a re the one app ly ing fo r f unds ,
Gove rnment shou ld be he lp ing sma l l bus iness by p rov id ing
them wi th secu r i t ies ,
I f sources o f f unds ava i lab le to SMEs a re increased .
The re is s t rong ev idence tha t s ta f f a t convent iona l banks
ope ra t ing in o r nea r townsh ips , ru ra l a reas and low income
subu rbs i s poo r l y equ ipped fo r t he t ype o f sma l l bus iness c l ien ts
tha t m igh t need f i nance (Un i ted Nat ions 2001 :18 ) . A t the momen t
there a re va r ious in i t ia t i ves by banks and gove rnmen t a im ing a t
i nc reas ing access ib i l i t y o f ven tu re cap i ta l by SMEs (Schoombee
2000 :4 ) :
Change o f assessment c r i te r ia and deve lopment o f s ta f f ,
C rea t ing bank accoun ts su i tab le to S MEs owners ,
Loans and repayment packages spec i f i ca l l y t o SMEs owners ,
Amendmen ts o f app l ica t ion p rocedu re .
The emphas is o f soc ia l i nves tment has changed p ro found ly ove r
the pas t coup le o f decades . The re have been s ign i f i can t sh i f t s in
the focus o f co rpo ra te soc ia l inves tmen t (CSI ) p rogrammes . The re
has been fa r more s t ra tegy p lann ing, w i th CSI p rogrammes
in f luenced by leg is la t ion such as the Broad -based B lack Economic
Empowerment Ac t no .53 o f 2003 and the new phenomenon on the
loca l bus iness scene - the deve lopment o f indus t ry sec to r cha r te rs
and the DTI ‟s Code o f Good P rac t ice . W i th the pub l i c -p r i va te
pa r tnersh ip , some p r i va te compan ies have in i t ia ted p rogrammes

45
tha t w i l l he lp the gove rnment , because they t ra in peop le in
acqu i r ing sk i l l s . Th is is a pos i t i v e deve lopment f o r SMEs in South
A f r i ca .
2.10 .5 Sk i l ls development
S ince the c rea t ion o f the Depar tment o f Labou r ‟ s Sec to r Educa t ion
and T ra in ing Autho r i t ies (SETAs) , i t became much c lea re r tha t the
gove rnment i s tak ing the c rea t ion o f SMEs in South A f r ic a ve ry
ser ious ly . The purpose o f SETAs is to p rov ide re levan t sk i l l s in
spec i f i c sec to rs . The reason g iven by p r i va te inves to rs fo r no t
i nves t ing in sma l l bus inesses i s o f ten a lack o f sk i l l s (B runo &
Tyebee 1985:61) . By t ra in ing you th in en t repreneu r ia l s k i l l s , the
gove rnment hopes tha t banks w i l l change the i r pe rcep t ions about
SMEs.
2.10 .6 Compet i t ion
The impor ta t ion o f f o re ign goods was and i s rega rded by t rade
un ions as one o f the reasons why the sma l l bus iness sec to r in
Sou th A f r ica canno t deve lop . W i th the in t roduc t ion o f the
Compet i t ion Ac t no .89 o f 1998 and the c rea t ion o f the Compet i t ion
Boa rd , the un ion is ts be l ieved tha t sma l l bus inesses cou ld compete
fa i r l y w i th b ig compan ies w i thou t b ig compan ies us ing the i r
advan tage un fa i r l y (Po l i cy Co -ord ina t ion and Adv iso ry Se rv i ce
2003 :40 ) .
2.11 SUMMARY
Lack o f access to cap i ta l canno t be rega rded as the so le ma jo r
obs tac le to the low ra te o f SME es tab l ishmen t . F inanc ia l p rov ide rs
cons ide r lack o f en t rep reneu r ia l sk i l l and o the r sk i l l s such as
f inanc ia l management and marke t ing as impor tan t sk i l l s f o r the

46
prope r managemen t o f SMEs. Due to lack o f management
accoun t ing sk i l l s , i n te rna l bus iness fa i lu re is seen as one o f the
ma jo r p rob lems in speed ing up the c rea t ion o f the SMEs in South
A f r i ca (Bus iness R epor t s 2006) . Most o f the SMEs a t s ta r t -up
phase do no t ge t to the matu re phase due to management ‟ s f a i lu re
to take re levan t dec is ions on how to re inves t the p ro f i t s .
Add ress ing the lack o f access to cap i ta l w i l l need bo th gove rnment
agenc ies and p r iva te f inanc ie rs . Th is lack is caused by lack o f
i n fo rmat ion as fa r as app l i ca t ion fo r and g ran t ing o f loans is
conce rned (Mc In ty re & Da l lago 2003:187 -190 ) . F inanc ia l
i ns t i tu t ions in South A f r ica a re us ing s im i la r ru les as o the r banks
in deve loped count r ies . The se ins t i tu t i ons need co l la te ra l and the i r
f unds a re issued a f te r ca re fu l ana lys i s o f the fu tu re p rospec ts and
the h is to ry o f the bus iness ( Sma l l cap i ta l… 2005 :5 ) .
Ven tu re cap i ta l i s ts and gove rnment agenc ies a re the a l te rna t i ve
sou rces o f cap i ta l f o r SMEs in Sou th A f r i ca . Howeve r , these
f inanc ie rs have min imum requ i rements tha t must be met by SMEs
when app ly ing fo r f und ing . Most HDPs do no t have the necessa ry
expe r ience , managemen t and accoun t ing sk i l l s and th i s m in im ises
the chances o f these peop le ge t t in g fund ing (Mc In ty re & Da l lago
2003 :188 ) .
Encou ragemen t o f t he fo rmat ion o f SMEs i s a ve ry good in i t ia t i ve
by the pub l i c sec to r , bu t as long as a cu l tu re o f en t rep reneu rsh ip
has no t been c rea ted among HDPs , e rad ica t ion o f pas t p rob lems
wi l l no t be ach ieve d ove rn igh t . The gove rnments a t bo th na t iona l
and p rov inc ia l l eve l have a number o f suppo r t in i t ia t i ves , l i ke
p rov inc ia l deve lopmen t corpora t ions , bu t t he peop le these
in i t ia t i ves a re a imed a t do no t a lways make use o f them. Th is
s imp ly means tha t po ten t ia l en t repreneu rs a re no t aware o f these
ins t i tu t ions as p rov ide rs o f cap i ta l (Bus iness Repor t s 2006 ) .

47
The pub l i c and p r i va te sec to rs have inc reased the i r i n te res t in the
sma l l bus iness sec to r , wh ich p laces the s ta tus o f SMEs in South
A f r i ca in a more p rom is ing pos i t ion . Howeve r , as long as the
iden t i f ied g roup does no t take advan tage o f these resou rces , the
s ta tus o f sma l l f i rms wi l l no t change cons iderab ly .

48
CHAPTER 3
MAN AGEMENT ACCOUNTIN G SKILLS AND OTHER
INFORMATION REQUIRED BY VENTURE CAPITAL
PROVIDERS
3.1 INTRODUCTION
Po ten t ia l sma l l bus iness owners in South A f r ica expe r ience
many cha l lenges when they es tab l ish the i r bus inesses . Lack o f
money is a cons t ra in t f o r SME deve lopment , as h igh l igh t ed in
the p rev ious chapte r . In the p rocess o f SMEs expans ion and
g rowth , management account ing sk i l l s a re p robab ly as
impor tan t as money (McIn ty re & Da l lago 2003 :185 ) . Some o f
the cha l lenges faced by sma l l bus iness owners a re the ab i l i t y
to ra i se su f f i c ien t cap i ta l and acqu i re the necessary sma l l
bus iness management sk i l l s (Grego ry et a l . 2005 :383 ) .
Acco rd ing to Ma lgas (2002 :119 ) , HDP s a rgue tha t p rov iders o f
p r i va te cap i ta l do no t unders tand the sma l l bus iness sec to r as
fa r as assessment o f the i r c red i two r th iness is conce rned .
En t repreneu rs b lame p r i va te equ i t y p rov ide rs fo r no t p rov id ing
them wi th su f f i c ien t cap i ta l wheneve r they app l y . The p rov ide rs
o f p r i va te cap i ta l , on the o ther hand, c i te lack o f sma l l
bus iness management sk i l l s and techn ica l sk i l l s as some o f the
ma jo r reasons why they canno t p rov ide su f f i c ien t cap i ta l to
p rospec t i ve en t rep reneu rs (McIn ty re & Da l lago 2003 :187 ) .
The pu rpose o f th i s chap te r i s to exp la in the manager ia l
sho r tcom ings o f SMEs. Managemen t accoun t ing sk i l l s , wh ich
a re the p r imary focus in th is chap te r , a re a lso h igh l igh ted . The
secondary purpose o f th i s chap te r i s to d iscuss management
accoun t ing re la t ed in fo rma t ion requ i red by ven tu re cap i ta l

49
prov iders wheneve r SME owners app ly fo r loans . Pas t success
ra tes o f SMEs a re a l so ment ioned .
In the f i rs t pa r t o f the chap te r manager ia l sho r tcom ings and
managemen t accoun t ing sk i l l s a re iden t i f ied and d iscussed .
Managemen t accoun t ing re la ted in fo rmat ion tha t i s requ i red by
ven tu re cap i ta l p rov iders is d iscussed in the second sec t ion o f
the chap te r . Pas t success ra te o f SMEs when app ly ing fo r
f unds i s las t l y d iscussed.
3.2 MAN AGERI AL SHORTCOMI NGS
The inab i l i t y to take good bus iness dec is ions has been c i ted as
one o f the ma jo r reasons fo r the h igh fa i lu re r a te o f SMEs.
Z immere r & Scarbo rough (1994 :265 ) s ta tes tha t apa r t f rom
f inance as a ma jo r obs tac le to the es tab l i shment o f SMEs in
the South A f r ican env i ronment , en t rep reneu rs lack the
necessa ry bus iness sk i l l s to commerc ia l ise the i r v iab le
bus iness ideas e f fec t i ve ly . One o f the reasons for the h igh
fa i lu re ra te o f sma l l bus inesses i s manager ia l sho r t comings ,
examples o f wh ich a re c i ted by Hansohm (1992 :141 ) as :
In ab i l i t y to lead and l im i ted sma l l bus iness management
sk i l l s ,
A lack o f knowledge o f bus iness p rob lems and non -
a t ten t i veness o f managemen t sho r t comings ,
Lack o f sk i l l s in management accoun t ing and cos t ing
knowledge, poor inven to ry management ,
Lack o f separa t ing pe rsona l and bus iness f inance
accoun ts ,
P rematu re expans ion o f ope ra t ing ac t i v i t ies ,
Lack o f e f fec t i ve mon i to r ing and d i rec t ion o f manpower ,

50
Poo r dec is ion mak ing due to lack o f p rope r f inanc ia l
p lann ing .
Sma l l bus iness owners do no t unde rs tand the t ypes o f sk i l l s
they shou ld acqu i re in o rde r to manage the i r bus iness
e f fec t i ve ly . Managemen t sk i l l s wh ich management teams shou ld
possess be fo re they lodge an app l ica t ion fo r f inance wi th
va r ious f inanc ia l p rov i ders a re a l so no t known. Iden t i f i ca t ion o f
these management sk i l l s cou ld reduce the chances o f f a i lu re
and the re fo re inc rease the s ta r t -up ra te . However , f inanc ia l
p rov iders and sma l l bus iness owners in South A f r i ca f ind i t
d i f f i cu l t t o access in fo rma t ion f rom each o the r on the requ i red
managemen t sk i l l s (McIn ty re & Da l lago 2003:190 ) .
Acco rd in g to E r ikson (2002:276 ) , s ta r t -up c rea t ion no t on ly
requ i res asse ts , bu t a l so knowledge . E r ikson de f ines these
phys ica l resou rces as f inanc ia l p ro jec t ions wh ich the owner
mus t p repare . Bu t f o r s ta r t -up owners the most d i f f i cu l t pa r t i s
to ind ica te how much knowledge they possess . Ventu re
cap i ta l i s t s a re o f the op in ion tha t i t i s the qua l i t y o f
en t repreneu r ia l capab i l i t y wh ich de te rmines whe the r the
bus iness w i l l be ab le to gene ra te fu tu re income.
3.3 MAN AGEMENT ACCOUNTING SKILLS
In an SME managemen t accoun t ing i s an impor tan t f unc t ion
conce rned wi th cos t measurement , p roduct o r se rv ice cos t ing
and p rov is ion o f i n fo rmat ion fo r dec is ion -mak ing. Bus iness
en t i t ies requ i re a t leas t some emp loyees who a re sk i l l ed in
managemen t accoun t ing in o rde r t o ope ra te e f f ic ien t l y and
e f fec t i ve ly . Managemen t accoun t ing sk i l l s a re use fu l i n mak ing

51
any bus iness en t i t y compet i t i ve and success fu l (Gowthorpe
2008 :34 ) . Any SME owner o r manager possess ing some
f inanc ia l management sk i l l s w i l l be in a be t te r pos i t i on to
manage a bus iness and the re fo re inc rease h is /he r chances o f
ob ta in ing a loan (Kasekende & Opondo 2003:11 ) . The fo l lowing
managemen t account ing sk i l l s have been iden t i f ied by
ins t i tu t ions such as the Char te red Ins t i tu te o f Management
Accountan ts (CIMA) and va r ious resea rche rs and au tho rs as
be ing use fu l f o r the e f fec t i ve managemen t o f SMEs (N iemand
2006 :103 -118 ; Kasekende & Opondo 2003:4 ; Dami t io &
Schmidga l l 2007 :1 -2 ; C IMA n .d . :13 -19 ) :
3.3 .1 Prepara t ion o f budgets
Acco rd ing to Gowtho rpe (2008:177 ) , a budget i s a s t ra teg ic
p lan wh ich shou ld ind ica te the sho r t - , med ium - and long - te rm
ope ra t iona l p lan o f the bus iness . Th is p lan shou ld show how
the bus iness w i l l make use o f i t s resou rces e f fec t i ve ly . The
budget shou ld be ab le to i nd ica te the fo recas t o f f u tu re
commerc ia l t ransac t ions tha t w i l l make a sma l l bus iness
success fu l . Acco rd ing to N iemand (2006 :103 -118 ) , the
ope ra t iona l budget o f the company shou ld be d iv ided in to th ree
sec t ions :
3.3 .1 .1 Operat ing budget
The f i r s t s tage o f p repa r ing an ope ra t ing budget o f a bus iness
i s to ind ica te the number o f un i ts the bus iness i s ab le to se l l .
Th is is t he sa les budget . I n a manufac tu r ing bus iness t h i s is
f o l lowed by de te rm in ing the number o f un i t s t o be p roduced and
the quant i t y o f mater ia ls t o be used (p roduct ion and mate r ia ls

52
budget ) . The d i rec t labou r and the ove rheads budge ts a re
p repa red nex t . The mate r ia l s , labou r and ove rheads budgets
ind ica te the cos ts to be incu r red by the bus iness in o rde r to
meet i t s ta rge ts . The accu racy o f these budgets w i l l depend on
who p repa red them. W i th the he lp o f competen t accoun tan ts
most o f the SMEs ‟ managers may have the r igh t p ro jec t ions .
Accu ra te ly p ro jec ted budgets may be used to conv ince the
p rov iders o f cap i ta l tha t SMEs a re ready fo r f und ing and a re
aware o f what they a re do ing (Kasekende & Opondo 2003 :4 ) .
3.3 .1 .2 Cash budget
A cash budget i s a quant i ta t i ve s ta temen t i nd ica t ing the
p ro jec ted cash rece ip ts and payments o f the bus iness . The
budget shou ld ind ica te how the sma l l bus iness owner w i l l
co l lec t h i s /he r money f rom the deb to rs and how he /she wi l l
se t t le the accounts when they f a l l due . The budget shou ld a lso
ind ica te how the su rp lus gene ra ted o r de f i c i t incur red dur ing
the pe r iod shou ld be used and se t t led (Ho rngren , Da ta r &
Fos te r 2006:204 ) . Th is i s one o f the most impor tan t budgets
because i t he lps to p inpo in t rece ip ts and paymen ts p rob lems.
3.3 .1 .3 Cap i ta l budget
A cap i ta l budge t is a budget tha t shows h ow the sma l l bus iness
owner w i l l spend the funds on the acqu is i t ion o f asse ts . The
owner i s the on ly pe rson who i s aware o f t he t ypes o f asse ts to
be used a t the in i t ia l phase o f the bus iness . W i th the he lp o f a
competen t f inanc ia l adv iso r the sma l l bus ine ss owner can
es t imate the cos ts o f inves tmen t i n asse ts . Due to l im i ted
managemen t accoun t ing sk i l l s some smal l bus iness owners , in

53
f o r ins tance the c ra f t indus t ry , may no t app ly va lua t ion
techn iques such as (Kasekende & Opondo 2003 :11 ) :
Ne t p resen t va lue ,
Payback me thod , and
In te rna l ra te o f re tu rn
The re fo re mos t sma l l bus iness owner s w i l l be compe l led to ask
fo r p ro fess iona l he lp to es t imate the cos t s o f inves tments in
asse ts . Th is w i l l a lso enhance the i r chances o f conv inc ing the
p rov iders o f cap i ta l wh en the i r app l ica t ion fo r a loan i s
assessed.
S ta r t -ups and es tab l ished bus inesses p rov ide p ro jec ted
f inanc ia l s ta tements when mak ing an app l ica t ion fo r a loan
(Kasekende & Opondo 2003:4 ) . Pro jec ted f inanc ia l s ta temen ts
a re the ma jo r sec t ion o f a bus iness p lan wh ich is used by loan
app l ican ts to secu re a loan . Accura te and rea l i s t i c p ro jec ted
f inanc ia l s ta tements a re what the p rov ide rs o f cap i ta l expect
when loan app l i ca t ions a re submi t ted . Bu t due to the fac t tha t
some SMEs in the c ra f t i ndus t ry a re opera ted by HDPs who
may no t have fo rma l bus iness educa t ion , the i r p ro jec t ions tend
to be inaccura te and unrea l i s t ic . The lack o f f inanc ia l l i te racy
u l t imate ly decreases the i r chances o f ob ta in ing a loan .
Acco rd ing to Kasekende and Opo ndo (2003:3 ) , some SMEs h i re
emp loyees wi thou t p rope r educa t ion who lacks f inanc ia l and
sma l l bus iness management sk i l l s .
3.3 .2 Product cos t ing and pr ic ing
P roduct cos t ing and p r i c ing i s a p rocess o f ass ign ing a va lue to
a p roduc t . Th is i s the va lue tha t the se l le r i s w i l l i ng to

54
exchange fo r a p roduct (Longenecke r , Moore & Pe t t y
1994 :327 ) . The p rocess o f de te rmin ing the cos t and p r i ce i s
qu i te comp l ica ted fo r a se l le r who i s no t f am i l ia r w i th the
va r ious managemen t account ing techn iques . Th is p rocess is
abou t recogn is ing the th ree e lements o f cos ts tha t the p roducer
i ncu rs in the p rocess o f p rov id ing a p roduct to t he cus tomer .
Acco rd ing to Ryan and Hiduke (2005 :178 ) , sma l l bus iness
owners f ind tha t the mos t d i f f i cu l t par t o f p r i c ing a p roduct i s
mak ing su re tha t a l l the re levan t co s ts a re inc luded in the f ina l
p roduct p r i ce .
The sma l l bus iness owner must be ab le to de te rm ine the d i rec t
mate r ia l cos ts , d i rec t labou r cos ts and the manufac tu r ing
ove rheads incu r red in t he manufac tu r ing p rocess . Fa i lu re to
iden t i f y these cos ts p rope r l y w i l l resu l t in the se l le r e i the r
ove r -cos t ing o r unde r -cos t ing the p roducts . The resu l t o f
unde r -cos t ing o r ove r -cos t ing the p roducts s imp ly means tha t
the se l le r w i l l l ose e i the r cus tomers due to h igh cos ts /p r ices o r
the bus iness due to loss o f income (H orngren et a l . 2006 :140 ) .
3.3 .3 Understanding cos t behav iour and cos t a l loca t ion
Cos ts behave d i f f e ren t l y . There a re cos ts wh ich change wi th
p roduct ion and those tha t rema in cons tan t i r respec t i ve o f a
change in p roduc t ion vo lume . The fo rmer a re c lass i f ied as
va r iab le and the la t te r as f i xed cos ts (Dru ry 2008 :31 ) .
A l loca t ing manufac tu r ing ove rheads i s ve ry cha l leng ing fo r
mos t sma l l bus iness owners spec i f i ca l l y to iden t i f y , ass ign and
inco rpora te them in to the f i na l cos t p r i ce o f t he p roduct (Ryan
& H iduke 2005:178 ) . Manufac tu r ing overheads a re ind i rec t

55
cos ts wh ich a re app l ied o r used dur ing the p roduct ion p rocess
in suppo r t o f the p r imary cos ts , wh ich a re d i rec t ma te r ia l s and
labou r cos ts .
Mos t sma l l bus iness owners fa i l t o recogn ise the ro le o f
i nd i rec t man ufac tu r ing cos ts du r ing the p roduct ion p rocess .
They fa i l to inc lude these cos ts in the f ina l cos t o f the p roduct .
They the re fo re unde r -cos t the i r p roducts , wh ich may lead to
loss o f marke t sha re and u l t imate ly the bus iness w i l l f a i l
(Re ider 2008:159 ) .
Cos t c lass i f i ca t ion o f overheads i s ano the r d i f f i cu l t task to
pe r fo rm fo r mos t sma l l bus iness owners . Manufac tu r ing
ove rheads a re c lass i f ied in to th ree ca tego r ies (Re ider
2008 :154 ; Horngren et a l . 2006 :334 ) :
Fixed overheads
F ixed ove rheads a re ind i rec t co s ts tha t a re incu r red du r ing
p roduct ion . The cos ts do no t vary w i th vo lume o r the number o f
un i t s p roduced.
Var iable overheads
Var iab le ove rheads a re ind i rec t cos ts tha t change in the same
p ropo r t ion to vo lume.
Mixed overheads
These a re ind i rec t cos ts th a t have the cha rac te r i s t ics o f bo th
f i xed and va r iab le ove rheads. The smal l bus iness owner must
be ab le to sepa ra te them in to bo th f i xed and va r iab le por t ions .

56
3.3 .4 Ac t iv i ty -based cost ing
Ac t i v i t y -based cos t ing is a cos t ing sys tem tha t a l loca tes the
cos ts to cos t ob jec ts . The cos t ob jec ts can be e i t he r a p roduct ,
se rv i ce o r cus tomer . The sys tem a l lows the sma l l bus iness
owner to be ab le to unde rs tand the behav iou r o f t he cos ts
s ince the cos t a l l oca t ion i s based on the number o f tasks o r
f unc t ions per fo rmed . Re ide r (2008:153 ) i nd ica tes tha t the most
use fu l cos t accoun t ing sys tem fo r sma l l bus iness owners is
ac t i v i t y -based cos t ing. W i th the app l ica t ion o f ac t i v i t y -based
cos t ing the bus iness owners can a lso increase the i r
compet i t i veness in the marke t by s imp ly mak ing su re tha t on ly
tasks tha t add va lue a re pe r fo rmed.
3.3 .5 Ca lcula t ion of prof i t and loss
Ca lcu la t ion o f p ro f i t i s ano the r d i f f i cu l t f unc t ion tha t mos t sma l l
bus iness owners mus t dea l w i th on a regu la r bas is . Acco rd ing
to Gray (1991:87) , the most d i f f i cu l t task fo r sma l l bus iness
owners i s co l lec t ing and inc lud ing the re levan t in fo rma t ion
when de te rmin ing the p ro f i t f o r the bus iness . Gray ind ica tes
fu r the r tha t the sma l l bus iness owner mus t regu la r l y mon i to r
the cos ts o f t he bus iness and shou ld lea rn to scan and make
use o f the re levan t in fo rmat ion to ca lcu la te the p ro f i t . W i th the
he lp o f a competen t accountan t the task o f ca lcu la t ing p ro f i t
and loss becomes eas ie r to pe r fo rm.
3.3 .6 Cost -volume -prof i t ana lys is
Cos t -vo lume -p ro f i t ana lys is is one o f t he mo st use fu l too ls tha t
can be app l ied by sma l l bus iness owners to unders tand the

57
behav iou r o f se l l i ng p r i ce , va r iab le cos ts , f i xed cos ts and
vo lume in re la t ion to p ro f i t . Accord ing to Ryan and H iduke
(2005 :194 ) , b reakeven ana lys i s i s one o f the most use fu l and
he lp fu l too ls f o r bus inesses a t the s ta r t -up phase . Th is sys tem
gu ides the bus iness owner in t e rms o f the number o f un i ts tha t
they must se l l to b reak even , tha t i s , to se l l the un i ts , pay the
cos ts and remain in bus iness w i th no p ro f i t o r loss .
3.3 .7 Product l i fe cyc le
A p roduct , jus t l i ke a bus iness , goes th rough a l i fe cyc le . Fo r
sma l l bus iness owne rs no t to lose marke t sha re , the t ype o f
p roduct they se l l shou ld be upgraded and improved so tha t the
bus iness cou ld be in ope ra t ion fo r a longe r per iod .
Unde rs tand ing the p roduct l i f e cyc le makes i t eas ie r f o r sma l l
bus iness owners to unders tand the pos i t ion o f t he bus iness a t
a l l s tages o f the bus iness o r p roduct . I t a lso he lps sma l l
bus iness owners no t to l ose hope , t h ink ing tha t the bus iness
w i l l no t make a p ro f i t o r su rv i ve fo r a longe r pe r iod . A p roduct
and a bus iness usua l l y go th rough f our l i f e cyc le s tages . The
four l i f e s tages a re the in t roduc t ion , g rowth , matur i t y and
dec l ine (Gray 1991:113 ; S ims & Smi th 2002:191) .
A t the in t roduc t ion s tage the bus iness is s t i l l t r y ing to es tab l ish
a marke t . The p roduct o f fe red to the marke t i s new and
unknown to the cus tomers . The t ype o f p r i c ing s t ra tegy tha t the
sma l l bus iness owne r can imp lemen t i s a marke t and p roduct
deve lopment p r ic ing s t ra tegy (S ims & Smi th 2000:260 ) . W i th
th i s s t ra tegy the bus iness owner shou ld cove r a l l the re levan t
cos ts and shou ld a im to a t leas t b reak even .

58
At the g rowth and matu r i t y s tage s the sma l l bus iness has
es tab l ished i t s marke t . The marke t ing cos ts a re decreas ing as
compared to the in t roduc t ion phase . The bus iness beg ins to
rea l i se some p ro f i t s bu t a t low marg ins .
The las t s tage o f the p roduct l i f e cyc le i s t he dec l ine s tage . A t
th i s s tage the bus iness i s f aced by dec l in ing p ro f i t s and sa les .
The bus iness can t r y to i nc rease i t s p ro f i t leve l by ex i t ing some
marke t a reas and en te r ing new ones . Accord ing to Gray
(1991 :113 ) , the bus iness can surv i ve th is s tage by be ing more
cus tomer -o r ien ted than p roduct -o r ien ted .
3.3 .8 S tandard cost ing and job order cos t ing
S tanda rd cos t ing i s a cos t account ing sys tem tha t i s used to
de te rm ine the s tanda rd cos t and inpu t o f mate r ia ls , l abou r o r
ove rheads tha t the bus iness owner wou ld l i ke to ach ieve du r ing
the p roduct ion p rocess . S tandard cos t i s de f ined as a
p rede te rm ined cos t o f a un i t o f ou tpu t (Ho rngren , Da ta r ,
Fos te r , Ra jan & I t tner 2010:258 ) .
The s tandard cos t sys tem he lps sma l l bus iness ope ra to rs to
de te rm ine the s tanda rd inpu t f o r each un i t so ld . Th is w i l l he lp
sma l l bus iness owners to m in im ise the cos ts and avo id
p roduc ing unnecessa ry goods (Gowthorpe 2008 :213 ) .
Job o rder cos t ing emphas ises the p roduct ion o f goods on ly
a f te r the cus tomer has p laced an o rde r and the goods shou ld
be p roduced accord ing to cus tomer spec i f i ca t ion . App l ica t ion o f
the job o rde r cos t ing sys tem wi l l he lp the sma l l bus iness owner
to p roduce the goods demanded by the cus tomer . However ,

59
acco rd ing to Re ide r (2008 :157 ) , job o rder cos t ing and s tanda rd
cos t ing sys tems a re d i f f i cu l t to app ly in a sma l l bus iness
env i ronment .
Job o rde r cos t ing needs an o rde r to be made be fo re p roduct ion
commences. S ince a s ta r t -up bus iness has no t ye t es tab l ished
i t s marke t base , i t m igh t t ake a wh i le t o commence ope ra t ions
i f i t app l ies job o rde r cos t ing.
S tanda rd cos t ing emphas ises de te rm ina t ion o f inpu ts and
s tanda rd cos ts be fo re p roduct ion commences. S ince some
s ta r t -up bus inesses have no t ye t es tab l ished even a sample
p roduct , i t may b e d i f f i cu l t f o r them to app ly the sys tem.
A l though job o rder cos t ing and s tanda rd cos t ing can be d i f f i cu l t
to imp lemen t w i th ou t the he lp o f competen t consu l tan ts and
emp loyees, the owner can be ass is ted in te rms o f imp lement ing
the two sys tems .
3.3 .9 Jus t - in - t ime
Jus t - in - t ime (J IT ) i s a cos t account ing sys tem wh ich
encou rages p roduc t ion o f goods when they a re demanded . Th is
sys tem emphas ises reduc t ion o f inven to ry ho ld ing cos ts
because mate r ia ls and component par ts a re bough t on ly when
needed fo r p rod uc t ion . Accord ing to N iemand (2006 :198 ) , J IT is
p re fe r red by sma l l bus iness owners because i t reduces
inven to ry ho ld ing cos ts , the re fo re m in im is ing obso lescence o f
i nven to ry . Jus t l i ke the o the r management account ing sk i l l s ,
app ly ing J IT cos t account ing i s a ma jo r sk i l l requ i red by
ven tu re cap i ta l p rov iders .

60
Managemen t accoun t ing sk i l l s a re no t the on ly requ i rement to
secu re a loan f rom ven tu re cap i ta l i s ts . There a re o the r f ac to rs
tha t ven tu re cap i ta l i s t s wou ld l i ke to iden t i f y in an app l ica t ion
fo r a loan , such as the p ro jec ted f inanc ia l s ta tements o f the
app l ican t .
3.4 F INANCI AL INFORMATIO N REQUIRED BY MOST
VENTURE CAPITALISTS
Robust accoun t ing and f inance func t ions p rov ide the f ramework
th rough wh ich a bus iness is managed and con t ro l led , ensu r ing
compl iance wi th laws and regu la t ions , f u l f i l l ing ven tu re
requ i rements and ass is t ing in the pu rsu i t and ach ievement o f
s t ra teg ic ob jec t i ves . A we l l - thought -ou t bus iness p lan is key to
secu r ing funds . A l though the f inanc ia l p ro jec t ions o f a bus iness
p lan shou ld be ta i l o red to the de ta i l s o f the bus iness , ce r ta in
components o f a bus iness p lan a re common ly requ i red by most
ven tu re cap i ta l p rov iders (V in tu re l la & E r ickson 2004:62) :
S ta tement o f f inanc ia l pe r fo rmance,
S ta tement o f f inanc ia l pos i t ion ,
Cash f low s ta temen t ,
B reak -even ana lys i s ,
Key es t imates and assumpt ions beh ind p ro jec t ions , and
Key ra t ios .
Fo r the s ta r t -up , es t imates w i l l have to be made fo r each
ind iv idua l componen t o f the bus iness . An ope ra t iona l budget ,
s ta r t ing w i th the sa les , p roduct ion budget , mater ia ls budge t ,
l abou r , cos t o f sa les , adm in is t ra t i ve and resea rch and
deve lopment expenses shou ld be p repa red . Assumpt ions a re
the foundat ion o f the bus iness p lan fo r most s ta r t -up

61
bus inesses and the re fo re the p ro jec t ions shou ld be spec i f ied
fo r the fo l lowing:
Leve ls o f p ro jec ted sa les and inc reases in vo lume o r
p r ice ,
G ross marg in expecta t ions ,
Expec ted cap i ta l expend i tu re and t im ing,
Inven to ry tu rnover ,
Rece ivab les co l lec t ion pe r iod , and
Payab les paymen t per iod .
The ven tu re cap i ta l i s t , a f te r sc ru t in i s ing the p ro jec ted f inanc ia l
pe r fo rmance o f the bus iness , w i l l usua l l y l ook fo r add i t iona l
i n fo rmat ion . Th is i n fo rmat ion takes the fo rm o f the expe r ience
the bus iness owner has in management account ing sk i l l s and
sma l l bus iness management .
3.5 MAN AGEMENT ACCOUNTIN G SKILLS REQUIRED TO
SECURE A LO AN
Some s tud ies have exam ined d i f f e ren t ba r r ie rs faced by
en t repreneu rs in s ta r t ing the i r bus inesses . Lack o f bus iness
educa t ion , t ra in ing o r manager ia l expe r ienc e have been c i ted
as bar r ie rs tha t may have an impact on the f i rm ‟s success . As
i t was h igh l igh ted in chap te r 2 sma l l bus iness owners o f ten
expe r ience many p rob lems assoc ia ted w i th ob ta in ing loans , as
we l l as w i th hav ing the re levan t sma l l bus iness managem ent
expe r ience tha t fac i l i ta tes the success o f any bus iness (Jones
& Tu l los 2002:234) .
I t i s t here fo re qu i te c lea r tha t w i thou t a su f f i c ien t management
accoun t ing background o r exper ience i t may be d i f f i cu l t to

62
conv ince ven tu re cap i ta l i s ts tha t the app l i can t i s ready fo r
f und ing . To inc rease the l i ke l ihood o f success , the emerg ing
en t repreneu r has to conv ince the ven tu re cap i ta l i s t tha t he /she
i s ready fo r f und ing by mee t ing some o f the m in imum
requ i rements o f ven tu re cap i ta l i s ts . Acco rd ing to Bygrave , H ay
and Pee te rs (1999 :98 ) , in con junc t ion w i th management
accoun t ing, knowledge o f p rev ious ven tu re cap i ta l dea l
sc reen ing p rocesses, p re fe rab ly i n the ven tu re cap i ta l i s t s ‟
ta rge t marke ts , i s ve ry impor tan t .
Ven tu re cap i ta l i s t s a re in f luenced by a number o f f ac to rs
conce rn ing the po ten t ia l rec ip ien t o f the i r funds when
assess ing inves tment oppo r tun i t ies . They look fo r
en t repreneu rs w i th the po ten t ia l f o r g rowth as a resu l t o f
i nnova t i ve ideas , a sound manageme nt team and we l l -
s t ruc tu red o rgan isa t ion . Many ven tu re cap i ta l i s ts cons ider
en te rp r i se deve lopmen t s tage and the s i ze o f i nves tment
needed in con junc t ion w i th leve l o f bus iness sk i l l s and
managemen t accoun t ing sk i l l s as impor tan t f o r SMEs to secu re
a loan (Smal l Bus iness Admin is t ra t ion 1997:9 ) . As ea r l y as
1985 Lo renz de te rmined tha t managemen t teams and bus iness
ideas a re the ma jo r f ac to rs tha t ven tu re cap i ta l i s ts look fo r
when assess ing loan app l ica t ions . The fo l lowing c r i te r ia a re
used by ven tu re cap i ta l i s ts when se lec t ing app l ican ts fo r a loan
(Lo renz 1985 :77 -84 ; Meye r & A l len 1994:110 -277) :
3.5 .1 Cash f low management
The ma jo r source tha t ven tu re cap i ta l i s t s in jec t i n a bus iness is
money. Money i s an impor tan t sou rce tha t must be looked a f te r
to sus ta in the bus iness . The t rack reco rd o f the owner as fa r as

63
cash management i s conce rned inc reases the chances o f be ing
g ran ted a loan . The func t ion o f cash f l ow management i nvo lves
the owner ‟ s ab i l i t y t o t rack the cash tha t f lows in and ou t o f the
bus iness . I f the owner fa i led in th is task in p rev ious bus iness
ven tu res i t m igh t be d i f f i cu l t f o r ven tu re cap i ta l i s ts to t rus t the
owner w i th cash . Mos t , i f no t a l l , ven tu re cap i ta l i s ts p re fe r the
owners themse lves to unde r take the du ty o f cash management
(GEM 2003 :13 ) . Th is lack o f t rus t by ven tu re cap i ta l i s ts and the
inexpe r ience o f owners in cash managemen t m igh t imp ly no
fund ing to SMEs.
Keep ing reco rds o f the amounts gene ra ted and pa id ou t
i nc reases the con f idence o f ven tu re cap i ta l i s ts i n sma l l
bus iness owne rs . Ven tu re cap i ta l i s ts p re fe r t o iden t i f y the
re levan t ledge rs and jou rna l accounts tha t have been used and
t rack whether the bookkeep ing has been done c or rec t l y
(Bbenke le 2007:22 ) .
3.5 .2 Pr ic ing and cost measurement
The su rv i va l o f a sma l l bus iness a t an ea r l y s tage depends on
i t s ab i l i t y t o genera te enough p ro f i t o r a t leas t to b reak even .
Break ing even o r mak ing a p ro f i t w i l l resu l t f rom the owner ‟ s
ab i l i t y to measure cos ts and p r ice the p roducts co r rec t l y . Tha t
means incorpora t ing a l l the re levan t c os ts in t he f ina l p roduct .
One o f the ma jo r reasons fo r the fa i lu re o f SMEs is incor rec t
p r ic ing and inaccu ra te cos t measurement . Acco rd ing to Meye r
and A l len (1994 :133 ) and Hodget t s and Kura tko (1995 :640 ) the
owner ‟s ab i l i t y to app ly var ious p r ic ing s t ra t eg ies and mark -up
pe rcen tages wi l l inc rease h is /he r l i ke l ihood o f be ing g ran ted a
loan .

64
3.5 .3 Marke t analys is and forecast ing
Mos t s ta r t -up bus inesses use es t imated p roduct ion and sa les
f i gu res in the i r maste r budget when app ly ing fo r a loan (Meyer
& A l len 1994 :110 ) . The exper ience o f some emp loyees in
f o recas t ing and pe r fo rm ing a marke t ana lys is i s what the
ven tu re cap i ta l i s t w i l l wan t to see in an app l i ca t ion fo r a loan .
A loan app l ica t ion tha t can p rove tha t marke t ana lys is has been
pe r fo rmed by an exp e r ienced owner who i s ce r ta in about the
amoun t o f inven to ry to be so ld w i l l be more success fu l .
3.5 .4 Inventory management
The most impor tan t i ns t rumen t the bus iness uses to gene ra te
an income i s inven to ry . A bus iness owner who has expe r ience
in app ly in g inven to ry managemen t too ls w i l l inc rease h is /her
chances o f secu r ing a loan (Hodge t ts & Ku ra tko 1995 :640 ) .
Mos t ven tu re cap i ta l p rov ide rs p re fe r to wo rk w i th
en t repreneu rs who have expe r ience in manag ing a sma l l
bus iness . To conv ince the ven tu re cap i ta l i s t , Meye r and A l len
(1994 :280 ) ind ica te tha t sma l l bus iness owners mus t have
iden t i f ied a l l inven to ry ho ld ing cos ts in the i r loan app l ica t ion .
The four f ac to rs d i scussed above a re no t the on ly a t t r i bu tes the
ven tu re cap i ta l p rov iders eva lua te be fo re g ran t ing a loan .
The re a re o the r f ac to rs tha t t hey w i l l wan t t o iden t i f y . Some
have to do w i th the sma l l bus iness owners themse lves , wh i le
o thers have to do w i th the management team.

65
3.6 OTHER FACTORS CONSIDERED IMPORTANT FOR
SECURING A LOAN
Managemen t accoun t ing sk i l l s a re no t the on ly requ i rements
needed to secure a loan f rom a ven tu re cap i ta l i s t . The re a re
o ther f ac to rs tha t re la te to the type o f bus iness , s tage o f
bus iness and the managemen t team tha t the ven tu re cap i ta l i s t s
mus t i nves t iga te be fo r e gran t ing a loan . Some o f the fac to rs
cons ide red impor tan t a re (Bus iness l ink 2005:12 -19) :
3.6 .1 Inves tment a t an ear ly s tage
The competence o f the management team o r the en t rep reneur
i s the on ly aspec t tha t can be eva lua ted when dec id ing on
fund ing a t an ear l y s tage . I t i s d i f f i cu l t t o d iscove r i n any
mean ingfu l way wh ich compe t i to rs ex is t , even though an
ex tens ive pa ten t sea rch may have been done. The ma in
documents tha t the ven tu re cap i ta l i s t can use to assess the
en t repreneu r a t th is s tage a re f inanc ia l h i s to ry o f app l ican t ,
bus iness p lan and fo rward p ro jec t ions o f tu rnove r , p ro f i t s , cash
f low and bo r rowings over a m in imum o f a two -yea r pe r iod .
Some o f the key a reas a re (Pea rce & Ba rnes 2006:71) :
The t rack record o f the en t rep reneu r and h is /he r
managemen t team, and
The p r i ce o r cos t assumpt ions , pa r t icu la r l y w i th rega rd to
compet i t ion .
3.6 .2 Management team
Apar t f rom the techn ica l sk i l l s , the ven tu re cap i ta l i s t i s l ook ing
fo r f inanc ia l p lann ing and con t ro l d i sc ip l i ne and , above a l l ,

66
energy , d r i ve and mot i va t iona l ab i l i t y i n the team leader
(T immons & Sp ine l l i 2007 :387 ) . The managemen t pe r fo rmance
records o f the en t rep reneur ‟ s team wi l l be exam ined c r i t i ca l l y
by the ven tu re cap i ta l i s t , bo th as to the i r spec i f i c su i tab i l i t y f o r
the par t i cu la r bus iness an d as to the i r pas t ach ievements in
re la t ion to bus iness management and per fo rmance o f any
managemen t accoun t ing re la ted func t ion (Pea rce & Ba rnes
2006 :71 ) .
In add i t ion to the above fac to rs , the ven tu re cap i ta l i s t w i l l
usua l l y look fo r two o the r f ac to rs , w i th regard to new bus iness
in the indus t ry . F i r s t l y , ven tu re cap i ta l i s t s w i l l l ook fo r the
ind iv idua l commi tment o f each team member to the bus iness ,
as ev idenced by f inanc ia l r i sk and the ca ree r sacr i f i ces they
have made. Second ly , the pe rsona l i t y „ f i t ‟ of the team members
i s c r i t i ca l i n tha t they must be ab le to comp lement each o ther
(F reshwate r , Ba rk ley , Mark ley , Rub in & Shaf fe r 2001:4 ) .
3.6 .3 Inves tment a t a la ter s tage
The ra te o f f a i lu re in la te r -s tage ven tu re cap i ta l i nves tments is
l ower and th i s fo rm o f equ i t y f inanc ing is s ign i f i can t l y sa fe r
than ea r l y -s tage f i nance i f p roposa ls a re p rope r l y i nves t iga ted
and ca re fu l l y s t ruc tu red f rom the s ta r t . Howeve r , the re a re
f ewer „b ig w inners ‟ among the more matu re bus inesses . The
ventu re cap i ta l i s ts in t h is a rea o f ac t i v i t y a re l i ke l y to want a
so l id income y ie ld on the i r inves tment f rom the s ta r t and may
a lso p rov ide secured lend ing as par t o f the f inanc ing package.
The same p rocess o f ear l y -s tage se lec t ion w i l l a l so app ly to
the ven tu re cap i ta l i s t s ‟ eva l ua t ion o f more matu re bus iness es
seek ing f inance fo r expans ion .

67
3.6 .4 Sensi t iv i ty analys is and downside assessment
Ven tu re cap i ta l p rov iders w i l l no t inves t un less they have
car r ied ou t a tho rough assessment o f t he bus iness ‟s f u tu re
prospec ts , usua l ly by themse lves , bu t some t imes wi th ou ts ide
he lp f rom inves t iga t ing accountan ts o r consu l tan ts . In car ry ing
ou t a sens i t i v i t y ana lys is o f the en t rep reneu r ‟ s bus iness p lan ,
the ven tu re cap i ta l i s t w i l l cons ider t he fo l lowing aspects (Smal l
cap i ta l 2005 :45 ) :
Ach ievab le f inanc ia l and marke t p ro jec t ions ,
P roducts to be in t roduced to the marke t and o the r ac t i v i t ies
ab le to genera te an income
Amoun t o f p ro f i t s expec ted to be gene ra ted .
In summar is ing the above assessment c r i te r ia i t i s qu i te c lear
tha t w i thou t a conv inc ing t rack record and accu ra te p ro jec ted
f i gu res , the chances o f ge t t ing f inance wi l l be very s l im . I t i s
adv isab le fo r en t rep reneurs to equ ip themse lves w i th su f f i c ien t
knowledge o r to ob ta in ass is tance f rom expe r ienced
accoun tan ts to p repa re the f inanc ia l sec t ion o f the bus iness
p lan fo r them.
As ea r l y as 1985 B runo and Tyebee inves t iga ted some o f the
reasons why loans were den ied by ven tu re cap i ta l i s ts .
3.7 REASONS WH Y LO AN APPLICATIONS ARE TURNED
DOWN BY VENTURE CAPITAL PROVERS
Inab i l i t y o f the bus iness owner in mee t ing the m in imum
requ i rements o f the ven tu re cap i ta l i s ts is one o f t he ma jo r
reasons why cap i ta l i s no t g ran ted . Acco rd ing to Murphy
68
(1996 :14 ) mos t o f sma l l bus iness owners lacks the ab i l i t y to
manage the f inanc ia l a f f a i r s o f the bus iness . B runo and Tyebee
(1985 :70 ) conducted resea rch in 1985 on the reasons why
ven tu re cap i ta l p rov iders m igh t deny fund ing to SME ope ra to rs .
Some o f the reasons were fo und to be :
Su i tab i l i t y o f ven tu re and v iab i l i t y o f bus iness p lan , and
Po ten t ia l o f ven tu re success th rough good leade rsh ip .
Bu i ld ing an o rgan isa t ion based on human or in te l lec tua l cap i ta l
f rom va r ious indus t ry expe r iences i s one o f the ma jo r f ac to rs
in f luenc ing inves tment compan ies to supp ly funds to a bus iness
(Un i ted Nat ions 2001 :10 ) . Th is means tha t bus inesses ope ra ted
by one pe rson in mos t cases have d i f f i cu l t y in ob ta in ing funds ,
because o f the lack o f separa t ion be tween owner and the
bus iness , wh ich means a loss to the inves tment company
shou ld th e owner d ie . Ven tu re cap i ta l p rov ide rs be l ieve tha t a
we l l o rgan ised and exper ienced managemen t team is capab le
o f t rans fo rm ing any p roduc t o f poo r qua l i t y in to a supe r io r
p roduct (Meye r & A l len 1994:259 ) .
Loan app l ica t ions may be tu rned down i f the fo l lowing bas ic
requ i rements a re no t met ( Ho r i zon Equ i t y : 2005a ) :
An ou ts tand ing management team,
A we l l -de f ined indus t ry f ocus ,
S t rong pas t per fo rmance and exce l len t f u tu re g rowth
p rospec ts ,
Sus ta inab le compe t i t i ve advantages der i ved f rom
un iqueness o r innova t ion ,
S ign i f i can t marke t sha re in a we l l -segmen ted marke t ,
Ba r r ie rs to en t ry bu i l t on in te l l ec tua l p rope r t y , and
H igh -marg in p roducts .

69
Macmi l l an , S iege l & Subba Naras imha (1985:119 ) s ta ted tha t
some o f t he mos t impor tan t requ i reme nts o f ven tu re cap i ta l
p rov iders focus on the management team t ra i ts . Acco rd ing to
Tech Mon i to r (2009 :62 ) , t he bus iness p lan shou ld c lea r l y show
tha t the en t rep reneu r i s f i t to run a bus iness . The en t rep reneu r
mus t have the w i l l to succeed a bus iness expe r ience , be ab le
to i den t i f y and reac t to r isk and be fami l ia r w i th th e ta rge t
marke t . Fa i l ing th is , en t rep reneu rs need to be ab le to pu t
toge the r a team tha t has these qua l i t ies and show tha t he /she
i s capab le o f lead ing tha t team.
In t he i r s tudy , Macmi l lan et a l . (1985 :119 ) found tha t ven tu re
cap i ta l i s t s assess en t repreneu rs sys temat ica l l y in te rms o f s i x
ca tego r ies o f r i sk , wh ich need to be managed. These r i sks a re :
L iqu ida t ion due to ven tu re fa i l i ng ,
Fa i lu re to rece ive fund ing f rom ex te rna l sou rces and
se t t le deb ts ,
Fa i lu re o f a p ro to type p roduct to reach the marke t ,
Lack o f ven tu re compet i t i veness ,
Lack o f management con t ro l and imp lementa t ion o f
bus iness p lans , and
De f ic ienc ies in management team .
La te ly most ven tu re cap i ta l p rov iders use a number o f c r i te r ia
and scoreca rds in assess ing an en t repreneu r be fo re f ina l
dec is ions a re made. These c r i te r ia a re based on the
assessmen t o f t he bus iness en t i t y on i t s own and the owner o r
managemen t team.

70
3.7 .1Assessment o f ent repreneurs
A f te r assess ing bo th the bus iness and the managemen t
toge the r , the ven tu re cap i ta l i s t w i l l sc ru t in i se the capab i l i t ies
o f an en t rep reneur a lone us ing the fo l lowing c r i te r ia :
In tegr i ty and re l iabi l i ty
The en t rep reneur ‟ s background and h is to ry a re used to judge
h is /he r in tegr i t y and re l iab i l i t y and a re thus v i ta l sou rces o f
i n fo rmat ion . Ventu re cap i ta l p rov ider s w i l l no t want to
assoc ia te themse lves w i th som eone they do no t know o r a
pe rson who has a bad h is to ry o r c r im ina l reco rd , wh ich cou ld
d isc red i t them. Acco rd ing to S inswat and Subhan j i (2010 :2 ) the
c red i t sco re and f inanc ia l l i te racy o f an en t repreneu r w i l l p lay
an impor tan t ro le in th i s rega rd . I f any th ing d is repu tab le is
uncove red , the en t rep rene ur ‟ s l i ke l i hood o f ra i s ing money i s
ve ry sma l l . For example , i f the cap i ta l i s t d iscovers tha t the
en t repreneu r was p rev ious ly f i red f rom h is /he r job o r f a i led to
pay c red i to rs on t ime in the pas t , th i s w i l l m in im ise h is /her
chances o f ge t t ing money ( K im 2000 :1 ) . These days , ven tu re
cap i ta l p rov iders even go to the ex ten t o f check ing the c red i t
h is to ry o f an app l ican t w i th the c red i t bureaux.
Exper ience and proven t rack record
The ven tu re cap i ta l p rov ide rs wou ld wants to es tab l ish the
en t repreneu r ‟ s a reas o f compe tence . Sma l l bus iness
managemen t exper ience is a concern , bu t more impor tan t i s an
awareness o f bus iness ope ra t ions an d an ab i l i t y to manage a
deve lop ing bus iness . Acco rd ing to O lawa le and Gware

71
(2010 :731 ) manager ia l compe tenc ies a re ve ry impor tan t to the
surv i va l and g rowth o f SMEs. A l l too o f ten , the idea l
en t repreneu r is no t the idea l manager fo r the bus iness once i t
becomes a go ing conce rn . Most inves to rs p re fe r to see a g roup
o f ind iv idua ls w i th va r ious comp lementa ry a b i l i t ies and goa ls .
W i th a g roup , the inves to r i s more assu red o f ge t t ing a b road
range o f sk i l l s and the ven tu re ‟s dependence upon any one
i nd iv idua l i s reduced. The impor tance o f an awareness o f a l l
a reas , techno logy , manufac tu r ing, f inance and espec ia l l y
marke t ing , i s c ruc ia l ( Sun je 2003 :3 ; Bu t tne r & Rosen
1989 :249 ) .
Att i tudes and ambi t ions
I t i s impera t i ve fo r t he sma l l bus iness owners and ven tu re
cap i ta l p rov ide r tha t the i r amb i t ions a re in congruence , tha t i s ,
tha t they sha re common goa ls . Sha r ing t he same amb i t ion in
te rms o f ra te o f re tu rn on inves tment (ROI ) to be ach ieved and
marke t share to be ga ined may a t t rac t t he a t ten t ion o f ven tu re
cap i ta l p rov ide rs . Tha t is why ven tu re cap i ta l i s t s wou ld l i ke to
meet the app l ican t in person to see whethe r t he person knows
what he /she i s ta lk ing abou t . In tha t case the ab i l i t ies and t rack
record o f a loan app l i can t in pe r fo rm ing some o f the
pe r fo rmance measurement aspec ts l i ke re tu rn on sa les and
res idua l income wi l l be cons ide red . Because once the ven tu re
cap i ta l p rov ide r has app roved a loan , the en t rep reneu r must
see to i t tha t they a re upda ted abou t t he per fo rmance th rough
pe r iod ic repor ts .

72
3.7 .2 Assessing the venture
As ear l y as 1974 L i les (1974:461 -479 ) suggested the fo l lowing
when eva lua t ing the ven tu re i t se l f :
Fi tness o f the business in the capi ta l inves tor
inves tment por t fo l io
A ven tu re cap i ta l p rov ide r wou ld l i ke to es tab l i sh the ca tego ry
in wh ich the ven tu re w i l l f i t in the inves tment po r t f o l io . A
number o f ques t ions wou ld be asked in the p rocess o f
es tab l ish ing the f i tness o f ven tu re . Among o the r wou ld be :
W i l l i t o f f e r the same t ype o f p roducts as m ine?
I s i t a f o rm o f bus iness we inves t in?
How compet i t i ve w i l l be the management?
Prospects o f success
The s tage o f inves tmen t o r the ven tu re w i l l i n f l uence the
dec is ion o f a ven tu re cap i ta l p rov ide r . I f a bus iness i s a go ing
conce rn then i t i s easy fo r a ven tu re cap i ta l i s t to de te rmine the
fu tu re p rospects o f a bus iness . Howeve r , i f the bus iness is s t i l l
a t i t s i n i t ia l s tage then tha t w i l l d i scou rage the inves to r ,
because i t i s no t easy to de te rmine the fu tu re p rospects o f the
company unde r those c i rcumstances. Then the ven tu re
cap i ta l i s t w i l l cons ide r o ther va lua t ion techn iques , fo r exam p le
h is to ry o f the en t rep reneur o r management team. The
manager ia l sk i l l s , c red i t sco re and t rack reco rds as a l ready
d iscussed above wi l l be used to de te rm ine as to whe the r the
cap i ta l w i l l be gran ted o r den ied (S inswa t & Subhan j i 2010 :2 ) .

73
How successful w i l l the venture be?
The assessment o f the v iab i l i t y o f bus iness p lan and p roduct
o f fe red to the marke t and the managemen t team is the base to
de te rm ine the success ra te o f a new ven tu re . I f the
managemen t team compr ises ind iv idua ls w i th very good t rack
records , t hen inves to rs w i l l be tempted to inves t because they
w i l l be conv inced tha t the bus iness w i l l be a success . A lso , i f
the management o f a company has a success ion p lan fo r the
fu tu re , then the ven tu re cap i ta l i s t w i l l a l so be conv inced tha t
the bus iness w i l l succeed.
A f te r assess ing the bus iness and i t s management most peop le
s t i l l ask themse lves many ques t ions about the c r i t e r ia used by
ven tu re cap i ta l p rov ider in assess ing the i r bus iness ideas . The
ma in quest ion tha t i s o f ten asked is “what is the ven tu re cap i ta l
p rov ider rea l l y l ook ing fo r? ” . Some o f the fac to rs cons idered
impor tan t a re (One i l , Bhah i r , Fau lken & Canno 1987:153 ) :
Hands on exper ience in d i rec t ing
Job expe r ience a t an ea r l y s tage o f a bus iness i s cons ide red
one o f the fac to rs tha t de te rm ine the success o r f a i l u re o f the
bus iness . The en t rep reneu r as a d i rec to r i s expec ted to fo rm a
team o f capab i l i t ies in management accoun t ing and smal l
bus iness management . S ince mos t o f the en t rep reneu rs do no t
have educa t ion and sma l l bus iness m anagement sk i l l s , t hey
there fo re fa i l i n d i rec t ing and o rgan is ing a team o f sk i l led
peop le (Pr i yana th 2006: 98) .

74
New and untes ted prototype product
A new p roduct wh ich has no t ye t be ing tes ted in the marke t can
on ly secu re funds i f t he ven tu re cap i ta l p rov ider has con f i rmed
tha t i t w i l l be a success . The assessment w i l l cove r a reas l i ke
compet i t ion and ba r r ie rs to en t ry aga ins t the p roduc t and the
ab i l i t y o f the managemen t team to exp lo i t the marke t .
Management
Mos t ven tu re cap i ta l i s ts cons ide r management to be the key to
eve ry success fu l ven tu re cap i ta l inves tmen t . The f i rs t th ing a
managemen t team must have i s bus iness expe r ience . Anyone
p repa r ing a bus iness p roposa l shou ld pay pa r t i cu la r a t ten t ion
to the background o f the management team (Ma lho t ra , Chen,
Cr i scuo lo , Fan , Hamel & Savchenko 2006:14) . The bus iness
p roposa l shou ld exp la in in de ta i l how the management i s go ing
to ach ieve the in tended ob j ec t i ves . Th is p roposa l can on ly be
rea l i s t i c and ach ievab le i f the managemen t has bus iness
expe r ience s ince most o f bus iness fa i lu re a re a t t r i bu tab le to
f inanc ia l management de f ic ienc ies (P r i yana th 2006:97 ) .
Pro jec t ions
A cash p ro jec t ion i s one key fac to r covered in a good bus iness
p roposa l . I t i s the re fo re the respons ib i l i t y o f the en t rep reneur
to se t ou t s t rong g rowth p ro jec t ions fo r h i s /he r bus iness .
Acco rd ing to P r iyana th (2006:96 ) , these p ro jec t ions to be
accu ra te need to be p repa red by a pe rson wi th good
manager ia l t rack record . These f inanc ia l p ro jec t ions mus t no t
on ly be reasonab le in te rms o f the pe rcen tage o f g rowth tha t

75
occu rs each yea r , bu t they must a l so be rea l i s t i c when
compared wi th the o the r success fu l app l i ca t ions p resen ted by
o ther bus inesses . Eve ry en t rep reneu r shou ld spend a g rea t
dea l o f t ime mak ing , eva lua t ing and unde rs tand ing h is /her
f inanc ia l p ro jec t ions .
Some en t rep reneu rs use account ing f i rms to p repa re the i r
p ro jec t ions on the bas is o f assumpt ions . Th is is p robab ly a
poo r app roach because en t rep reneurs unde rs tand the i r
p ro jec t ions and assumpt ions be t te r t han an account ing f i rm. I f
someone e lse makes p ro jec t ions the en t rep reneur may no t
exp la in them adequa te ly o r conv inc ing ly s ince most do no t
have bus iness expe r ience and su f f i c ien t educa t ion (P r i yana th
2006 :96 ) .
3.8 P AST SUCCESS RATE OF APPL ICANTS IN
MANUFACTURING SECTOR
The h is to r ica l success ra te fo r the app l i ca t ion o f f unds o r
i nves tmen t in South A f r ica f rom ven tu re cap i ta l compan ies in
SMEs is ve ry low. Recent l y i nves tment in the SME sec to r has
been inc reas ing a t a s teady ra te . Th is has been as a resu l t o f a
pa r tnersh ip be tween gove rnment and the pub l i c sec to r to
i nc rease pa r t i c ipa t ion in the sec to r . Re fe r r ing to SAVCA‟s
mat r i x f o r 2005 (SAVCA 2005a ) , one can conc lude tha t ven tu re
cap i ta l i s t s a re inves t ing a t a low, bu t cons tan t ra te .
The SAVCA mat r ix i nd ica tes tha t the re were 76 ins t i tu t ions on
the members l i s t in 2005. Ou t o f a to ta l o f 76 on ly 31 members
inves ted in sma l l compan ies o r p rov ided s ta r t -up cap i ta l in
2005 , 40 members d id no t wh i le 5 we re s t i l l in the p rocess

76
cons ide r ing SMEs as an inves tment po r t f o l io . The inves tment
po r t f o l io o f ind iv idua l compan ies ind ica tes tha t the re i s s t i l l low
inves tmen t in SMEs.
The re a re a number o f ven tu re cap i ta l i s t s in South A f r i ca tha t
do no t inves t in the sma l l bus iness sec to r a t a l l (SAVCA
2005a:1 ) . I f the sec to r is ana lysed by d i v i s ions , the ra te o f
i nves tmen t in manufac tu r ing i s very low compared to sec to rs
l i ke in fo rma t ion techno logy and commun ica t ion .
A number o f compan ies l i ke Kag iso , Ho r i zon , Ac t and Aureos
have iden t i f ied SMEs as the next inves tment po r t f o l io .
Howeve r , po ten t ia l en t rep reneu rs in the c ra f t indus t ry a re
usua l l y no t aware o f these compan ies and the ma jo r i t y o f
en t repreneu rs s t i l l app roach on ly the commerc ia l banks when
app ly ing fo r f inance .
Acco rd ing to the inves tment c r i te r ia o f these compan ies
ment ioned above , t he success ra te in the pas t was based on
the bus iness p lan and the competence o f an en t rep reneur . I f
the bus iness p lan was good and the en t rep reneu r a lso had the
requ i red expe r ience , they cou ld ge t f und ing. The o ther f ac to r
tha t was the ven tu re cap i ta l i s ts ‟ ma jo r reason fo r low
i nves tmen t in SMEs was the marke t sec to r in wh ich the SMEs
were pu rsu ing a bus iness .
Acco rd ing to Bus iness l ink (2005:12) , v en tu re cap i ta l i s
ava i lab le to sma l l bus iness owners i f :
The bus iness is reg is te red ,
The management team is wo rk ing we l l ,
No t a im ing to se l l a new p roduct , and

77
The bus iness has p roven success ra te .
Th is means tha t in the pas t , f o r ven tu re cap i ta l i s t s to i nves t in
a bus iness , they had to be conv inced tha t the bus iness wou ld
succeed and the owner had the r igh t sk i l l s to ca r ry on w i th the
bus iness ac t i v i t i es on a da i l y bas is . Geograph ica l loca t ion was
a lso among the ma jo r reasons fo r ge t t i ng f inance .
3 .9 SUMMARY
Lack o f bus iness managemen t sk i l l s , management accoun t ing
sk i l l s and techn ica l sk i l l s in the indus t ry a re c i ted by ven tu re
cap i ta l i s t s as the ma jo r reasons why most SMEs do no t expand.
Acqu is i t ion o f these re levan t sk i l l s i s cons ide red by ven tu re
cap i ta l p rov iders as one o f t he ma jo r f ac to rs tha t t hey cons ider
be fo re p rov id ing fund ing to SME ope ra to rs . Apa r t f rom
managemen t accoun t ing sk i l l s o f the owners , ven tu re cap i ta l
p rov iders cons ide r in fo rma t ion re la t ing to f inanc ia l and
managemen t accoun t ing aspects o f the bus iness be fo re
p rov id ing a loan .
Some o f the management accoun t ing sk i l l s cons idered as
impor tan t by va r ious funders a re the app l i ca t ion o f ac t i v i t y -
based cos t ing , cos t -vo lume-p ro f i t ana lys is and p repa ra t ion o f
budgets . These aspects o f management accoun t ing a re
cons ide red impor tan t because they fo rm pa r t o f a bus iness
p lan . The re fo re c lea r a r t i cu la t ion o f these aspec ts is an
ind ica t ion to ven tu re cap i ta l p rov ide rs tha t the SME ope ra t o r i s
ready fo r f und ing.

78
Var ious ven tu re cap i ta l p rov ide rs va lue a range o f sk i l l s , some
o f wh ich a re re la ted to bo th management accoun t ing and sma l l
bus iness management . The accuracy o f the p ro jec t ions and the
knowledge o f the pe rson who p repa red the p ro jec t ions a lso
fo rm par t o f the m in imum requ i rements tha t must be met .

79
CHAPTER 4
RESE ARCH METHODOLOGY
4 .1 INTRODUCTION
In th is chap te r , the resea rch methods and resea rch des ign
used in the co l lec t ion and ana lys is o f da ta a re desc r ibed . The
research p rocess invo lves the app l i ca t ion o f va r ious me thods
and techn iques in o rde r to c rea te sc ien t i f i ca l l y ob ta ined
knowledge by us ing ob jec t i ve methods and p rocedu res (Lapan
& Quar ta ro l i 2009 :251 ; W elman & Kruge r 2001:2 ) . The need fo r
emp i r i ca l ev idence is impor tan t to suppo r t the l i te ra tu re rev iew
d iscussed in chap te r s 2 and 3 . The pe rcep t ion o f the SME
owners and ven tu re cap i ta l i s ts on access to cap i ta l w i l l be
inc luded in the f ind ings .
The pu rpose o f th is chap te r is to desc r ibe the methodo logy
used . The methodo logy inc luded in fo rma l d iscuss ions ,
ques t ionna i res and a l i te ra tu re rev i ew on wh ich the
conc lus ions and recommendat ion o f the s tudy w i l l be based .
Some o f t he quest ions used in the comp i la t ion o f the
quest ionna i res were de r i ved f rom the in fo rma l d i scuss ions he ld
w i th peop le invo lved in SMEs and some o f the ven tu re
cap i ta l i s t s , as we l l as the l i te ra tu re rev iew in bo th chap te rs 2
and 3 and what the resea rche r needed to do to fu l f i l the
pu rpose o f the s tudy .
In th i s chap te r , the da ta co l lec t ion and ana lys i s method s a re
d iscussed . The samp le s i ze and resea rch s i te , f o l lowed by an
exp lana t ion o f the des ign o f the quest ionna i res a re a l so

80
h igh l igh ted . The response ra te , p rob lems exper ienced in the
co l lec t ion o f da ta and t he l im i ta t ions o f the s tudy a re
d iscussed in the las t sec t ion o f the chap te r .
4.2 DAT A COLLECTION AND AN ALYSIS ME THOD
In th is s tudy , ques t ionna i res and in fo rma l d iscuss ions w i th the
respondents we re used in the co l le c t ion o f the da ta .
The ma in reason fo r se lec t ing SME owners in the c ra f t indus t ry
was tha t most o f them work a round townsh ips and c i t y cen t res
and i t was thus easy to reach them. A samp le o f SME owners in
the c ra f t indus t ry i n the Tshwane a rea and ven tu re cap i ta l
p rov iders who worked spec i f i ca l l y w i th ind iv idua ls and SME
owners we re used in the co l lec t ion o f da ta fo r th is s tudy . The
c ra f t indus t ry i s a sec to r o f the economy in wh ich mos t o f the
p roducts a re hand -made and a re manufac tu red accord ing to
cus tomer spec i f i ca t ions . The resea rcher ’ s i n te res t in the c ra f t
i ndus t ry emanates f rom the var ie t y o f un i t s p roduced.
The f i ve ma jo r banks and a comb ina t ion o f m ic ro - lende rs ,
gove rnment agenc ies and p r i va te ven tu re cap i ta l i s ts f o rm par t
o f the ven tu re cap i ta l p rov iders tha t we re used in the co l lec t ion
o f da ta fo r t h i s s tudy .
Quest ionna i re s we re used to co l lec t da ta f rom bo th SME
owners and ven tu re cap i ta l p rov ide rs . In the ques t ionna i re s
bo th s t ruc tu red and uns t ruc tu red quest ions were asked . The
quest ionna i re s we re s t ruc tu red in such a way tha t bo th
qua l i ta t i ve and quan t i ta t i ve da ta cou ld be co l lec ted .

81
4.2 .1 Qual i ta t ive and quant i ta t ive research
Qua l i ta t i ve and quan t i ta t i ve resea rch methodo log ies we re used
in the co l lec t ion o f da ta . Bo th methods were app l ied w i th the
pu rpose o f unde rs tand ing the p rocess es ven tu re cap i ta l
p rov iders use when eva lua t ing loan app l i ca t ion s , as we l l as the
soc ia l and cu l tu ra l con tex ts o f SME owners . The methodo log ies
we re mos t l y conce rned wi th exp lo r ing the reasons why some
ven tu re cap i ta l i s ts g ran t SMEs loan s and reasons fo r SMEs ’
success ra te .
S ince the ma in ob jec t i ve o f th is resea rch was to iden t i f y the
gap in managemen t account ing sk i l l s requ i red by ven tu re
cap i ta l i s t s and those possessed by SMEs in the c ra f t indus t ry ,
ques t ionna i res were iden t i f ied as the bes t poss ib le quan t i ta t i ve
and qua l i ta t i ve method to co l lec t th is t ype o f da ta . Acco rd ing
to W iske r (2001:147 ) , a quest ionna i re is gene ra l l y r ecogn ised
as an impor tan t ins t rument f o r se l f -adm in is te red resea rch .
Some o f the quest ionna i res we re hand de l i ve red to responden ts
a t the i r re ta i l marke ts . Th is f ac i l i ta ted access to ob ta in ing such
a la rge number o f responden ts and thus p rov ided su f f i c ien t
da ta fo r s ta t i s t i ca l ana lys i s . Obta in ing such a la rge number o f
respondents wou ld have been d i f f i cu l t to ach ieve i f the
quest ionna i res we re de l i ve red a t the i r manufac tu r ing p lace .
Few quest ionna i res we re pos ted to responden ts .
Appo in tments we re made wi th 5 0 SMEs to ass is t them in the
comple t ion o f the quest ionna i res . The resea rche r be l ieved tha t
th i s me thod wou ld y ie ld the necessary resu l t s . The same was

82
done w i th some o f the ven tu re cap i ta l p rov ide rs , as the re were
fewer o f them than SMEs.
4.2 .2 S ta t is t ica l ana lys is sof tware
The da ta co l lec ted was ana lysed us ing SPSS fo r W indows
ve rs ion 11 .1 . Th is so f tware i s ab le to ana lyse da ta , wh ich can
be conve r ted f rom an Exce l sp readsheet t o su i t the requ i red
fo rmat .
4.3 POPULATION, S AMPLE SIZE AND GEOGRAPHICAL
RESE ARCH AREA
The popu la t ion o f i n te res t compr i se the en t i re g roup o f peop le
f rom whom a resea rche r ob ta ins in fo rma t ion . These a re the
peop le whose v iews a re needed to ach ieve the ob jec t i ve o f t he
survey .
4.3 .1 SMEs
A t the t ime th is s tudy was conduc ted , the re were abou t 200
s ta l l s in Ha t f ie ld whe re SMEs se l l t he i r p roducts on Sundays
(B&B Af r i can Cra f t Marke ts ) . The re were a lso 20 ou t le ts in
D inokeng in the Cu l l inan a rea , 45 s ta l ls in f ron t o f the Zoo in
P re to r ia and 15 0 s ta l l s a t the annua l ga l le ry , wh ich i s he ld on
16 June a t the S ta te Theat re . Th is f o rms an es t imated to ta l o f
415 SMEs s ince the number va r ies pe r weekend . W hen SMEs
tha t se l l a t s t ree t co rne rs in townsh ips a re inc luded , the re
were an es t imated 500 c ra f t make rs in the Tshwane a rea .

83
Obta in ing an adequa te samp le i s one o f the most impor tan t
f ac to rs in conduc t ing su rveys ( Ryan, Scapens & Theoba ld
2002 :137 ; Graz iano & Rau l in 1997 :147 ) . A represen ta t i ve
sample (247 ) o f SMEs was se lec ted . A represen ta t i ve samp le
i s a g roup , subse t o r some par t o f a l a rge r popu la t ion ( Lapan &
Quar ta ro l i 2009 :44 ; Z ikmund 1994 :328 -332 ) . The SMEs
ta rge ted fo r th i s s tudy were so le ownersh ips , par tnersh ips and
c lose co rpo ra t ions in the Tshwane met ropo l i tan a rea . A to ta l o f
247 ques t ionna i res we re i ssued to SMEs. Th is number o f SMEs
was ach ieved th rough consu l ta t ions w i th owners a t p laces
where they exh ib i t the i r p roduc ts ove r weekends. Of the 247
quest ionna i res , 150 quest ionna i res we re re tu rned . The sample
o f 150 respondent s cons t i t u ted 30 % o f the en t i re popu la t ion
and 60 .73% o f the quest ionna i res issued . Th is was cons ide red
to be su f f i c ien t t o d raw conc lus ion s .
4.3 .2 Venture cap i ta l prov iders
The popu la t ion o f ven tu re cap i ta l p rov ide rs was d i f f i cu l t to
de te rm ine . F ive f i nanc ia l banks in the Tshwane met ropo l i tan
a rea were iden t i f i ed . T wo gove rnment - funded ins t i tu t i ons and
50 m ic ro - lende rs (bo th reg is te red and un reg is te red ) we re a lso
iden t i f ied . I n co l lec t ing in fo rma t ion i t was d i f f i cu l t to de te rmine
whethe r m ic ro - lende rs we re reg is t e red o r no t . I t was a lso
d i f f i cu l t t o ob ta in in fo rma t ion f rom the Na t iona l Cred i t Boa rd ,
because the in fo rmat ion i s on ly p rov ided to loan app l ican ts fo r
the pu rpose o f ve r i f y ing the reg is t ra t ion o f loan p rov ide rs .
A to ta l o f 48 ques t ionna i res we re issued to ven tu re cap i ta l i s t s .
Of the 48 , on ly 30 were rece ived by the resea rche r .

84
4.3 .3 Sampl ing techniques
One o f the ma jo r i ssues in samp l ing i s the de te rm ina t ion o f
samples tha t bes t rep resen t a popu la t ion to a l low fo r an
accu ra te gene ra l isa t ion o f the resu l t s . A comb ina t ion o f bo th
sys temat ic and c lus te r samp l ing methods were used fo r
sampl ing the in te res ted popu la t ion o f respondents . Th is method
ensu res tha t no popu la t ion g roup i s less rep resen ted . The
popu la t ion was a lso d i v ided in to s i ze and age s o f bus iness
(W est fa l l 2008 /9 :1 ; John , W hi take r & Johnson 2006:142 ) . I t was
a lso he lp fu l in d iv id ing the popu la t ion in to subgroups (s tage o f
bus iness , t ypes o f bus inesses , pe r iod o f suppo r t ing SMEs and
va lues o f dea ls ) . These p rocedures a re used when i t i s
impor tan t to ensu re tha t subgroups wi th in a popu la t ion a re
adequate ly rep resen ted in t he samp le ( John et a l . 2006 :142 ;
Graz iano & Rau l in 1997:149 ) . Us ing th i s method o f samp l ing ,
the popu la t ion wa s d iv ided in to a number o f homogeneous and
non -ove r lapp ing grou ps .
A f te r the g roup o f in te res t was iden t i f ied , the researcher used
pu rpos ive sampl ing to d i s t r ibu te the quest ionna i re . Pu rpos ive
sampl ing was used to se lec t respondents because o f t he i r
expe r ience in ope ra t ing an SME, knowledge loan app l i ca t ion
p rocedu res and se lec t ing SME owners who qua l i f y f o r f und ing
(Jacobs 2003 :46 ) .
4 .4 RESPONSE RATES
As s ta ted ea r l ie r , two ques t ionna i re s we re used to co l lec t the
da ta . Of t he issued ques t ionna i res , o n ly 150 were re tu rned by
SMEs and 30 by ven tu re cap i ta l p rov iders . The tab le be low

85
presents the response ra te fo r bo th SMEs and ven tu re cap i ta l
p rov iders .
Table 4 .1 : Response ra te
SM E s D i s t r i b u t e d R e s p o n d e d P e r c e n t a g e
So le ownersh ips 154 107 69 .48%
Par tnersh ips 84 39 46 .43%
C lose co rpo ra t ions 9 4 44 .44%
Tota l 247 150 60 .73%
V e n t u r e c a p i t a l p r o v i d e r s
Commerc ia l banks 5 4 80 .00%
Mic ro - lende rs 28 15 53 .57%
Gove rnment ins t i tu t ions 13 10 77 .00%
Bus iness owners 2 1 50 .00%
Tota l 48 30 62 .50%
Even though less than 100 quest ionna i res f rom SMEs w ere no t
re tu rned , t he response ra te was found to be su f f i c ien t f o r the
researche r to p roceed wi th the ana lys i s o f da ta .
4 .5 DESIGN OF QUESTIONNAIRE
The two se ts o f ques t ionna i re s wh ich were used , the f i r s t f o r
SMEs and the second fo r ven tu re cap i ta l i s ts , a re inc luded in
Append ix 1a and 1b . Bo th were des igned in a s imp le and
uncomp l i ca ted way . These ques t ionna i res we re deve loped a f te r
a p i lo t s tudy was conduc ted among SM Es and ven tu re
cap i ta l i s t s . The p i l o t s tudy he lped to c lass i f y t he quest ions i n
the ques t ionna i res and the sequence in wh ich quest ions shou ld
be a r ranged. The ques t ionna i re commenced wi th quest ions on
the age o f the bus ines s and the t ype o f knowledge owners

86
possessed be fo re the bus iness was fo rmed . Th is sequence was
found to be uncomp l i ca te d fo r most SME ope ra to rs .
Bo th quest ionna i re s had s t ruc tu red and open -ended quest ions .
The use o f s t ruc tu red quest ions l im i ts the number o f responses
ava i lab le , wh i le open -ended quest ions a l low the responden ts
cons ide rab le f reedom in answer ing ( W iske r 2001 :170 ; Z ikmund
1994 :181 ) .
Bo th ques t ionna i res had an a t tached cove r ing le t te r . Idea l l y the
cove r ing le t te r i s the f i r s t document exam ined by the
respondent when p ick ing up the quest ionna i re . I t shou ld
encou rage the responden t to comp le te the quest ionna i re and
re tu rn i t exped i t ious ly (D i l lma r 1978 :165 ) . The cove r ing le t te r
exp la ined to responden ts the pu rpose o f the s tudy and tha t
respondents wou ld no t have to iden t i f y t hemse lves . The le t te r
a lso ind ica ted the name o f the resea rche r and h is con tac t
te lephone numbers .
4.5 .1 The quest ionnai re for SMEs
The ques t ionna i re fo r SMEs was d iv ided in to f i ve sec t ions ,
each sec t ion w i th i t s subsect ions . Some o f the quest ions cou ld
be answered wi th a yes o r no , w i th respondents mark ing the
app l icab le a l te rna t i ves w i t h an x . The re were a lso open -ended
quest ions , wh ich requ i red SME owners to p rov ide add i t iona l
i n fo rmat ion no t cove red on the fac e o f the quest ionna i re . A
f i ve -po in t L i ke r t sca le was used to ra te ce r ta in ques t ions . The
advantage o f us ing L ike r t sca les i s tha t t he responden ts a re
more inc l ined to answer a l l the quest ions on the quest ionna i re

87
(Lapan & Quar ta ro l i 2009 :62) . The sca le used ranged f rom 1 to
5 w i th the fo l lowing mean ings :
1 = s t rong ly d isagree
2 = d i sagree
3 = ne i the r agree no r d i sagree
4 = agree
5 = s t rong ly agree
4.5 .1 .1 Sec t ion 1 o f the quest ionna ire
Th is sec t ion o f t he quest ionna i re dea l t w i th the background o f
the bus iness . I t inc luded the age and the deve lopment s tage o f
the bus iness .
Quest ion 1 .1 : How long have you been ope ra t ing the
bus iness?
The ma in a im o f ask ing th i s ques t ion was to de te rmine the
number o f responden ts a t each s tage o f bus iness s ince they
had s ta r ted the i r bus iness .
Quest ion 1 .2 : Desc r ibe the deve lopment s tage o f you r
bus iness .
The pu rpose o f ask ing th i s ques t ion was to de te rmine the
number o f bus inesses a t each leve l o f deve lopment .

88
4.5 .1 .2 Sec t ion 2 o f the quest ionnai re
Th is sec t ion o f the quest ionna i re , jus t l i ke sec t ion 1 ,
i nves t iga ted the background o f the respondents (SMEs) . I t s
ma in focus was on the reasons fo r s ta r t ing a bus iness , the t ype
o f bus iness ope ra ted and the managemen t account ing sk i l l s the
owners had acqu i red be fo re s ta r t ing a bus iness .
Quest ion 2 .1 : W hat was you r reason fo r s ta r t ing the bus iness?
The pu rpose o f ask i ng th i s ques t ion was to de te rmine the
reasons why most o f the respondents jo ined the c ra f t indus t ry .
Quest ion 2 .2 : Bus iness t ype
Th is ques t ion was asked to de te rm ine th e fo rm o f bus iness tha t
the SME owners we re ope ra t ing in the c ra f t indus t ry .
Quest ion 2 .3 : W ere you invo lved in the same t ype o f bus iness
be fo re you s ta r ted th is bus iness?
I f the respondent answered yes to the ma in ques t ion , then they
cou ld choose be tween va r ious a l te rna t i ves tha t were p rov ided
in t he sub -ques t ion .
Th is quest ion and sub-ques t ion were asked to de te rmine the
number o f responden ts who worked in the same indus t ry and
the i r expe r ience o f d i f f e ren t f unc t iona l a rea s be fo re open ing
the i r own manufac tu r ing bus iness es .

89
Quest ion 2 .4 : W hat i s you r educa t iona l background?
The pu rpose o f ask ing th i s ques t ion was to de te rm ine the leve l
o f educa t ion tha t respondents in the c ra f t i ndus t ry had a t ta ined
be fo re open ing the i r own bus inesses . The responden ts we re
g iven a number o f a l t e rna t i ves to choose f rom.
Quest ion 2 .5 : W as the above educa t ion bus iness - re la ted?
The pu rpose o f ask ing th i s ques t ion was to de te rmine the
number o f responden ts who ha d acqu i red bus iness - re la ted
educa t ion .
Quest ion 2 .6 : Have you eve r a t tended workshops o r sho r t
cou rses to deve lop spec i f i c bus iness sk i l l s?
Some SME owners have the luxu ry o f be ing t ra ined by the i r ex -
emp loyers . The re fo re the pu rpose o f ask ing th i s ques t ion was
to de te rmine the number o f pa r t ic ipan ts who ha d unde rgone
any fo rma l t ra in ing .
Quest ion 2 .7 : D id you have any exp e r ience o f t he fo l lowing
p r io r to you r dec is ion to s ta r t you r own
bus iness?
Mos t ventu re cap i ta l p rov ide rs p re fe r to p rov ide f inance to SME
owners w i th exper ience . The pu rpose o f ask ing th is ques t ion
was to de te rm ine the number o f SME owners who ha d been
t ra ined in the sk i l l s ment ioned .

90
Quest ion 2 .8 : A re you sk i l led in , o r d id you rece ive any
t ra in ing rega rd ing the fo l lowing aspects ?
As the pu rpose o f the s tudy was to de te rmine the gap in
managemen t accoun t ing sk i l l s possessed by SME owners and
those requ i red by ven tu re cap i ta l p rov ide rs , i t was f i t t i ng to
have a sec t ion tha t requ i re d the responden ts to de te rmine the
t ypes o f management account ing sk i l l s the SME owners
possessed be fore s ta r t ing the i r own bus inesses . The
respondents we re p rov ided wi th a number o f a l te rna t i ves they
cou ld choose f rom.
4.5 .1 .3 Sec t ion 3 o f the quest ionnai re
The th i rd sec t ion o f the ques t ionna i re dea l t w i th the f inanc ia l
background o f the SME ope ra to rs . Quest ions were bas ica l l y
abou t the exper ience o f the SME ope ra to rs in ra is ing cap i ta l f o r
the i r ope ra t ions . Quest ions asked dea l t w i th , f o r examp le , how
long i t took them to ra i se cap i ta l us ing the i r pe rsona l sav ings ,
bo r rowing f rom a re la t i ve o r loca l bank and the d i f f i cu l t i es
expe r ienced du r ing the p rocess .
Quest ion 3 .1 : How d id you f inance you r bus iness?
The pu rpose o f ask ing th i s ques t ion was to de te rmine some o f
the p rob lems these SME owners ha d expe r ienced .
Quest ion 3 .2 : W as the cap i ta l su f f ic ien t?
Insu f f i c ien t cap i ta l i s cons ide red to be one o f the majo r f ac to rs
con t r ibu t ing to lower s ta r t -up ra te s . The re fo re by inc lud ing th is

91
quest ion in the quest ionna i re the researche r was a im ing to
de te rm ine how many SME owners s t i l l cons ide r ed th is to be a
reason fo r the i r bus iness fa i lu res .
Quest ion 3 .3 : How much cap i ta l d id you ha ve ava i lab le to s ta r t
the bus iness?
Quest ion s 3 .2 and 3 .3 we re l i nked to de te rmine the s i ze o f
cap i ta l most SMEs s ta r ted the i r bus inesses wi th . The
respondents we re requ i red to s ta te the amount they ha d used
a t the in i t ia l s tage o f the bus iness .
Quest ion 3 .4 : How long d id i t take you to ra i se th i s cap i ta l?
SME owners who have fa i led to rea l i se the d ream o f ope ra t ing
a bus iness , usua l l y c i te the de lay in f und ing as one o f the
ma jo r reason fo r the i r f a i lu re . There fo re in o rde r t o unde rs tand
the causes o f f a i lu re the resea rcher inc luded a quest ion on how
long i t took SME owners to ra i se in i t ia l cap i ta l .
Quest ion 3 .5 : How long d id the ins t i tu t i on take to app rove your
l oan?
Quest ion 3 .4 was l i nked wi th quest ion 3 .5 to de te rm ine where
the p rob lem lay in te r ms o f t ime .
4.5 .1 .4 Sec t ion 4 o f the quest ionnai re
Th is sec t ion o f the ques t ionna i re cove red the re la t ionsh ip tha t
SMEs had wi th f inanc ia l ins t i tu t ions p r io r to s ta r t ing a bus iness
e i the r f o r the i r bus iness o r pe rsona l use . The a im was to

92
de te rm ine whe the r the respondents be l ieved tha t pe rsona l
accomp l ishmen ts and the i r educa t iona l background had an
in f luence on f inanc ia l p rov ide rs g ran t ing them loans .
Quest ion 4 .1 : P r io r t o s ta r t ing th i s bus iness , have you ever
bo r rowed money f rom the bank o r ven tu re
cap i ta l p rov ide rs fo r bus iness o r persona l use?
The pu rpose o f ask ing th i s ques t ion was to de te rmine how
fami l ia r the SME owners we re w i th loan app l ica t ion p rocesses
o f banks .
Quest ion 4 .2 : I f you have bus iness educa t ion , do you th ink
you r educa t iona l ba ckground in f l uenced the
dec is ion fo r a bank to app rove a loan?
Deve lop ing a bus iness f rom s ta r t -up to g rowth s tage need s
bus iness management sk i l l s more than cap i ta l . The re fo re by
inc lud ing th is ques t ion in the ques t ionna i re the resea rcher was
a im ing a t de te rm in ing the number o f SME owners w i th o r
w i thou t bus iness educa t ion o r t ra in ing.
Quest ion 4 .3 : Do you th ink persona l accompl ishments , l i ke
hav ing ope ra ted o r wo rked in a s im i la r bus iness
in f luenced the dec is ion to app rove you r loan?
Th is quest ion a imed a t de te rm in ing whethe r pe rsona l
accomp l ishmen ts ha d any in f l uence on the dec is ion to ob ta in a
loan .

93
Quest ion 4 .4 : How long d id i t take the f i nanc ia l ins t i tu t ion to
app rove you r loan?
The p rocess o f sc ru t in i s ing an app l ica t ion fo r a loan d i f f e rs
be tween ven tu re cap i ta l i s t s . So the a im o f ask ing th is ques t ion
was to de te rm ine on ave rage how long i t t ook a ven tu re
cap i ta l i s t to app rove a loan app l i ca t ion .
Quest ion 4 .5 : W ere any o f your app l ica t ions fo r a loan eve r
tu rned down?
In a p rev ious chapte r the success ra te o f loan app l ica t ion s was
d iscussed . By ask ing th is ques t ion the resea rche r was ab le to
compare the l i te ra tu re rev iew in chap te rs 2 and 3 and the
emp i r i ca l s tudy in chap te r 5 to de te rmine whethe r the s i tua t ion
has improved .
Quest ion 4 .6 : I f yes , what was s ta ted as the reason fo r tu rn ing
down the app l ica t ion?
Quest ion 4 .6 was l i nked wi th quest ion 4 .5 to de te rmine some o f
the reasons loan app l ica t ions were den ied . Th is was an open -
ended quest ion .
4.5 .1 .5 Sec t ion 5 o f the quest ionnai re
Iden t i f i ca t ion o f poss ib le f inanc ia l p rov iders i s one o f t he ma jo r
p rob lems exper ienced by SME ope ra to rs . The a im o f t h i s
sec t ion was bas ica l l y t o de te rm ine the expe r ience o f ope ra to rs
in the i r b id to secu re loans . In te rms o f iden t i f y ing poss ib le
f inanc ia l p rov ide rs and o ther d i f f i cu l t ies tha t they had , some o f

94
those d i f f i cu l t ies we re ment ioned in th i s sec t ion and the
respondents had to se lec t those mos t re levan t t o them.
4.5 .2 Quest ionnai re for venture capi ta l prov iders
The quest ionna i re fo r ven tu re ca p i ta l p rov ide rs was d iv ided
in to two sec t ions . Most o f the ques t ions requ i red responden ts
to answer yes o r no . Some answers we re ranked on a sca le o f
1 -5 and some were open -ended ques t ions .
4.5 .2 .1 Sec t ion 1 o f the quest ionnai re
Quest ions in t h is sec t ion o f the quest ionna i re cove red the
pe r iod tha t ven tu re cap i ta l p rov iders had been fund ing SMEs,
the bus iness t ypes they were more in te res ted in , the
deve lopment s tage o f the bus iness l i ke l y to be funded and
whethe r the app l i can ts knew the t ypes o f f unds the y cou ld
app ly fo r .
Quest ion 1 .1 : How long has your o rgan isa t ion been fund ing
SMEs?
By inc lud ing th is ques t ion in the quest ionna i re the researcher
was a im ing to de te rm ine how long the respondents have been
invo lved in f und ing SMEs.

95
Quest ion 1 .2 : Does the fo rm o f bus iness have an in f luence on
the dec is ion to fund an app l ican t?
The pu rpose o f ask ing th i s ques t ion was to de te rm ine whe ther
the fo rm o f bus iness ope ra ted ha d an in f luence on the dec is ion
to g ran t a loan .
Quest ion 1 .3 : W hich fo rms o f bus i ness a re most l i ke l y t o ge t
f inanc ia l suppo r t?
Quest ion 1 .3 was l i nked to ques t ion 1 .2 to de te rm ine wh ich
fo rm o f bus iness was most p re fe r red .
Quest ion 1 .4 : Does the deve lopment s tage o f a bus iness have
any in f luence on the dec is ion to f inance a
ven tu re?
The l i te ra tu re rev iew has revea led tha t some ven tu re
cap i ta l i s t s p re fe r to inves t a t a la te s tage o f bus iness
deve lopment . So by inc lud ing th is ques t ion the resea rcher was
de te rm in ing whe the r th i s was in f ac t t rue .
Quest ion 1 .5 : At wh ich s tage o f dev e lopment a re you most
l i ke l y to f inance a ven tu re?
Quest ion 1 .5 was l inked wi th quest ion 1 .4 to de te rmine the
deve lopment s tage tha t was leas t o r most p re fe r red .
Quest ion 1 .6 : A re app l i can t s aware o f the re levan t sou rces o f
f inance fo r wh ich they can app l y fo r the i r
bus inesses?

96
Dur ing the l i te ra tu re rev iew and p i l o t s tudy i t was d iscovered
tha t some app l i can ts d id no t know the sou rces o f f inance they
cou ld app ly fo r . So the resea rcher rea l i sed i t was necessa ry to
i nc lude a quest ion on re levan t sources o f f inance fo r SMEs.
Quest ion 1 .7 : I f the answer to 1 .6 above i s yes , p lease s ta te
the number o f app l ica t ions you rece ive pe r
month fo r each o f the fo l l owing sou rces o f
f inance .
Th is ques t ion was l inked wi th ques t ion 1 .6 to de te rm ine wh ich
sou rce o f f inance app l ican ts app l ied fo r the most .
Quest ion 1 .8 : W hy was fund ing g ran ted to these app l ican ts?
Can you g ive some o f the fac to rs?
Quest ion 1 .8 was an open -ended quest ion . The a im o f th i s
ques t ion was to d i scove r some o f the reasons f i nance was
g ran ted to app l i can ts .
Quest ion 1 .9 : Does the loca t i on o f the app l i can t ’ s bus iness
have any in f luence on the dec is ion to g ran t a
loan?
In the l i te ra tu re rev iew i t was revea led tha t some ven tu re
cap i ta l i s t s concent ra te more on ce r ta in a reas . The re fo re the
researche r f ound i t necessary to inc lude a quest ion to d i scove r
i f th i s was s t i l l t rue .

97
Quest ion 1 .10 : I f the answer to 1 .9 above i s yes , wh ich o f the
9 p rov inces is the p re fe r red one?
Quest ion 1 .10 was l i nked wi th quest ion 1 .9 to de te rm ine the
mos t p re fe r red reg io n .
Quest ion 1 .11 : Does se t t lemen t s t ra tegy have an in f luence on
the dec is ion to g ran t a loan?
Mos t ven tu re cap i ta l i s t s p re fe r to be pa r t o f the management
team so tha t they can reap the reward s ea r l y . A repayments
method is assumed to be one o f the a t t ra c t ing fac to rs to
ven tu re cap i ta l i s ts . The re fo re the resea rcher f ound i t
necessa ry to inc lude a quest ion on the p re fe r red me thod o f
payment .
Quest ion 1 .12 : Does unde rs tand ing the c r i te r ia used by the
company in se lec t ing a new ven tu re inc rease
the app l ican t ’ s chances?
Hav ing gone th rough a p rev ious ven tu re cap i ta l sc reen ing
p rocess i s cons ide red impor tan t to some ven tu re cap i ta l
p rov iders . The researche r the re fo re inc luded a quest ion
con f i rm ing whethe r t h i s was t rue .
Quest ion 1 .13 : I f the answer to 1 .12 i s yes , p lease ment ion
some o f t he fac to rs work ing aga ins t the
app l ican ts .
Quest ion 1 .13 was l inked wi th ques t ion 1 .12 to de te rmine some
o f the fac to rs tha t wo rk aga ins t the loan app l i can ts .

98
Quest ion 1 .14 : Does the app l ican t ’ s indus t ry sec to r have an
i n f luence on the dec is ion to g ran t a loan?
Some ven tu re cap i ta l i s t s a re cons ide red to focus on indus t r ia l
sec to rs . The resea rcher want ed to f ind ou t i f th is was t rue .
Quest ion 1 .15 : On a sca le o f 1 to 5 , wh ich o f t he fo l l owing
sec to rs a re l i ke l y to ge t f und in g?
Quest ion 1 .15 was l inked wi th ques t ion 1 .14 to de te rmine the
mos t p re fe r red sec to r o f the economy.
4.5 .2 .2 Sec t ion 2 o f the quest ionnai re
Th is sec t ion o f the quest ionna i re was about the ma jo r aspec ts
tha t ven tu re cap i ta l p rov ide rs look fo r be fo re g ra n t ing a loan .
Yes and no quest ions and a f i ve -po in t L ike r t sca le we re used in
th i s sec t ion .
Quest ions ranged f rom quest ion 2 .1 up to quest ion 2 .22 . A l l
these ques t ions were more about i nves t iga t ing the aspects o f
managemen t accoun t ing tha t ven tu re cap i ta l i s ts cons ide r
impor tan t be fo re they can g ran t a loan .
4.6 L IMITATIONS OF THE EMPIRICAL SURVEY
Some l im i ta t ions o f the s tudy were expe r ienced du r ing the
co l lec t ion o f the da ta . Among them wa s tha t many SMEs in the
c ra f t i ndus t ry a re no t reg is te red as lega l bus inesses . The lack
o f o f f i ces where they opera te a l so c rea ted a p rob lem as i t was
d i f f i cu l t to d i f f e ren t ia te be tween an emp loyee and the owner o f
the bus iness . Most o f the quest ions were d i rec ted a t the

99
owners bu t answered by emp loyees and th is may have a f fec ted
the accu racy o f the in fo rma t ion p rov ided by the SME owners .
Some o f these emp loyees were no t pa r t o f dea l nego t ia t ing
teams and they d id no t have re levan t expe r ience in runn ing a
bus iness . I t was a lso ve ry d i f f i cu l t t o de te rmine whethe r
respondents were te l l i ng the t ru th about the age o f the i r
bus inesses , educa t iona l background , reasons fo r s ta r t ing a
bus iness and the in i t ia l cap i ta l they used and whether they
were indeed invo lved in t he p roduct ion o r were mere ly se l l ing
the p roducts . The o the r l im i ta t ion i s tha t the s tudy was no t
done ac ross the coun t ry bu t i n one a rea . I t can the re fo re no t be
conc luded tha t the t rends m igh t be the same across the
count ry . W hat is happen ing in Tshwane a rea in te rms o f
ope ra t ing SMEs may o r may no t be the same as in o the r a reas .
4.7 SUMMARY
Th is chap te r d iscussed the methodo logy used in co l l ec t ing th e
da ta fo r th is s tudy . The two se ts o f ques t ionna i res used , the
research s i tes , popu la t ion o f in te res t (s i ze ) , represen ta t i ve
sample and the responses requ i red f rom responden ts we re
exp la ined .
The c r i te r ia f o r choos ing the c ra f t i ndus t ry and ven tu re cap i ta l
p rov iders as the ma in popu la t ion were a lso se t ou t . The
sampl ing techn iques used were desc r ibed . The l im i ta t ions o f
the s tudy were iden t i f ied . The resu l t s o f t he empi r ica l s tudy a re
d iscussed in chap te r 5 .

100
CHAPTER 5
RESULTS OF THE RESE ARCH
5.1 INTRODUCTION
In th i s chap te r the resu l ts o f t he emp i r i ca l resea rch , based on
the da ta co l lec ted , a re ana lysed , and the f ind ings and
d iscuss ions fo rm the bas is o f the recommendat ions and
conc lus ions .
F i r s t l y , the resu l t s f rom the SME respondents a re ana lysed .
Th is is f o l l owed by the resu l t s f rom the ven tu re cap i ta l p rov ider
respondents . The gaps in the managem ent account ing sk i l l s
i den t i f ied w i l l be d iscussed towards the end o f the chap te r .
5.2 RESE ARCH FINDINGS - SMEs
5.2 .1 Age and deve lopment s tage o f the business
Quest ion 1 .1 : How long have you been ope ra t ing the bus iness?
The a im o f ask ing th i s ques t ion was to f ind ou t when the SMEs
s ta r ted ope ra t ing. Th is quest ion was l inked to quest ions 1 .2
and 2 .2 , wh ich c rea ted the second a im as be ing to de te rmine
the deve lopment s tage o f the SMEs in the c ra f t indus t ry .
The resu l t s f o r the pe r iod o f ope ra t ing a bus iness a re
p resen ted in f i gu re 5 .1 . Twen ty -e igh t o f the SME respondents
had bus inesses tha t had been in op e ra t ion fo r less than th ree
yea rs , wh ich rep resen ts 18 , 67%. Ou t o f 150 on ly 41
respondents ind ica ted tha t the i r bus inesses had been in

101
opera t ion fo r be tween fou r and s i x yea rs , wh ich rep resen ts
27 ,33%. The h ighes t number was 81 , whose bus inesses were
seven yea rs o ld o r more , wh ich represen ts 54 , 00%.
Figure 5 .1 : Per iod o f opera t ing the business
Number of years in operation
18,67%
27,33%
54,00%
0.00%
10.00%
20.00%
30.00%
40.00%
50.00%
60.00%
Less than 3 years 4 to 6 years More than 7 years
Percentage
In ques t ion 1 .2 the respondents we re asked to desc r ibe the
deve lopment s tage o f the i r bus inesses . In the ca tego ry o f
bus inesses wh ich were less than th ree yea rs o ld on ly one
(3 .57%) ou t o f 28 responden ts con f i rmed tha t the bus iness was
s t i l l a t the p lann ing phase . Twenty - two (78 ,57%) con f i rmed tha t
the bus iness was a t the s ta r t -up phase , wh i le f our (14 ,29%)
were a t the g rowth phase and the rema in ing one (3 ,57%) a t the
matu re s tage .
In t he ca tego ry o f bus inesses be tween four and s ix yea rs o ld ,
two ou t o f 41 respondents con f i rmed tha t the i r bus inesses were
a t t he s ta r t -up phase . Th i r t y -s i x (87 .80%) were a t the g rowth
s tage and th ree (7 .32%) were a t the ma tu re s tage .

102
In the ca tego ry o f bus inesses seven yea rs o ld o r more , on ly
one (1 ,24%)ou t o f 81 respondents con f i rmed tha t the bus iness
was s t i l l a t the s ta r t -up phase . Fou r teen (17 ,28%) were a t the
g rowth phase and 66 (81 ,48%) con f i rmed tha t the i r bus inesses
were a t the matu re s tage . The resu l ts o f ques t ion 1 .2 a re
p resen ted in f i gu re 5 .2 be low.
Figure 5.2: Development stage of business
78,57%
14,29%
3,57% 4,88%
87,80%
7,32%1,24%
17,28%
81,48%
3,57%
0.00%
10.00%
20.00%
30.00%
40.00%
50.00%
60.00%
70.00%
80.00%
90.00%
100.00%
Pla
nn
ing
Ph
ase
Sta
rt-u
p
Ph
ase
Gro
wth
Ph
ase
Ma
ture
Ph
ase
Pla
nn
ing
Ph
ase
Sta
rt-u
p
Ph
ase
Gro
wth
Ph
ase
Ma
ture
Ph
ase
Pla
nn
ing
Ph
ase
Sta
rt-u
p
Ph
ase
Gro
wth
Ph
ase
Ma
ture
Ph
ase
Less than 3 years 4 to 6 years More than 7 years
Percentage
As i l lus t ra ted in f i gu re 5 .2 , SMEs do no t rema in in one s tage
fo r long , as the re were no bus inesses tha t we re s t i l l a t the
p lann ing phase when they reach ed the age o f be tween four and
s i x yea rs and more than seven yea rs . The to ta l number o f
bus inesses a t the matu re s tage keeps increas ing as the
bus inesses go th rough the i r l i f e cyc les .
The dec is ion to rank bus inesses in t e rms o f deve lopment
s tages was gu ided by the number o f p roduc ts they were ab le to
se l l . The ques t ionna i re fo r each o f the deve lopmen t s tages

103
prov ided phrases in b racke ts l i ke “ re la t i ve ly new and l im i ted
marke t ” . These ph rases were used so tha t t he respondents
cou ld be gu ided wh i le comple t ing the ques t ionna i res .
5.2 .2 Reasons for s tar t ing the business
Quest ion 2 .1 : Reasons fo r s ta r t ing the bus iness
Respondents were a l l owed to se lec t a comb ina t ion o f reasons.
The number o f reasons se lec ted i s more than the num ber o f
respondents , because respondents cou ld se lec t more than one
reason .
As i l lus t ra ted in f i gu re 5 .3 be low, the ma jo r reason fo r s ta r t ing
th i s t ype o f bus iness was unemployment . Of the to ta l number o f
respondents , 74 (35 ,58%) s ta ted tha t they were unemp loye d
and needed an income be fo re they s ta r ted the bus iness .
Bus iness oppor tun i t y i s the second b iggest reasons why peop le
pa r t i c ipa ted in the c ra f t indus t ry . A to ta l o f 63 (30 ,29 %)
respondents con f i rmed th i s .
Of the to ta l sample s i ze , on ly 60 (28 ,84 %) con f i rmed tha t they
en te red the indus t ry because o f the des i re to be en t rep reneu rs .
O the r reasons were tha t they s ta r ted the i r bus iness as a hobby
and to supp lement an income (5 ,29 % o f the en t i re sample
s i ze ) .

104
Figure 5.3: Reasons for starting SMEs
35
,58
%
30
,29
%
28
,84
%
5,2
9%
0.00% 5.00% 10.00% 15.00% 20.00% 25.00% 30.00% 35.00% 40.00%
Unemployed and in
need of income
Business opportunity
because of skills and
talent
Want to be an
entrepreneur and self
employed
Other
Percentage
5.2 .3 Bus iness type
Quest ion 2 .2 : Bus iness t ype
The a im o f ask ing th is ques t ion was to de te rm ine the fo rm o f
bus iness SME owners in the c ra f t indus t ry were ope ra t ing .
The resu l t s f o r ques t ion 2 .2 (see f i gu re 5 .4 ) ind ica te tha t the
ma jo r i t y o f peop le in t he c ra f t indus t ry we re ope ra t ing a so le
ownersh ip . A to ta l o f 107 o f the who le samp le (71 , 33%)
con f i rmed th i s . Pa r tne rsh ip s was the second h ighes t f o rm o f
bus iness 39 (26 ,00%) in the c ra f t indus t ry and c lose
corpora t ions were the th i rd , a t 4 (2 ,67%). None o f the
respondents opera ted as a p r i va te company.

105
Figure 5 .4 : Types o f bus iness
75,00% 73,17%
17,86%
7,14%
24,39%
2,44%
69,14%
29,63%
1,23%
0.00%
10.00%
20.00%
30.00%
40.00%
50.00%
60.00%
70.00%
80.00%
Sole
Ow
ner
Part
ners
hip
CC
Private
Co.
Sole
Ow
ner
Part
ners
hip
CC
Private
Co.
Sole
Ow
ner
Part
ners
hip
CC
Private
Co.
Less than 3 years 4 to 6 years More than 7 years
From f igu re 5 .4 i t can be seen tha t the respondents whose
bus inesses we re less than th ree yea rs o ld (28 ) , 75 ,00%(21)
con f i rmed tha t they opera ted a so le ownersh ip . In the ca tego ry
o f bus inesses tha t we re be tween th e age o f f our and s i x yea rs
(41 ) , 73 ,17%(30 ) con f i rmed tha t they a lso ope ra ted a so le
ownersh ip and in the ca tego ry o f seven yea rs o r more (81 ) ,
37 ,33% (56) ope ra ted a so le ownersh ip .
In the ca tego ry o f bus inesses less than th ree years o ld (28 ) ,
pa r tnersh ips cons t i tu ted 17 ,86 %(5 ) o f bus inesses . In the
ca tego ry o f bus inesses be tween four and s i x years o ld (41 )
there were 24 ,39 %(2 ) and the h ighes t ra te was in the ca tego ry
o f bus inesses seven yea rs o ld o r more (81 ) w i th 29 ,63%(24)
ope ra t ing pa r tne rsh ips .
C lose co rpo ra t ion s were the th i rd fo rm o f bus inesses inc luded
in the quest ionna i re . Th is f o rm was no t popu la r , as can be
seen f rom the f ind ings . In the ca tego ry o f bus inesses less than

106
th ree yea rs o ld 7 ,14%%(2) o f respondents con f i rmed tha t t hey
ope ra ted a c lose co rpo ra t ion . Unde r each o f the rema in ing
ca tego r ies on ly 2 ,44% and 1 ,23% o f the respondents ope ra ted
a c lose co rpo ra t ion .
These resu l t s con f i rm tha t most SMEs in the c ra f t indus t ry
ope ra te so le ownersh ip fo rm o f bus iness . They a re comfor tab le
w i th ope ra t ing e i the r as so le owners h ips o r par tne rsh ips ( f i gu re
5 .4 ) . On ly 2 ,00% o f t he to ta l sample o f the responden ts
ope ra ted c lose corpo ra t ions . These resu l t s i n re la t ion to q 2 .1 ’s
response , a lso ind ica te tha t peo p le en te r the c ra f t marke t
i ndus t ry e i the r as a hobby o r to supp lement the i r i ncome.
Under q 2 .1 , respondents con f i rmed tha t t hey had en te red the
c ra f t indus t ry t o supp lemen t the i r income. Peop le who en te r the
marke t f o r the above reasons wi l l usua l l y ope r a te the bus iness
a lone . Tha t i s p robab ly why so le ownersh ip is the most
p re fe r red fo rm o f bus iness .
5.2 .4 Involvement in s imi lar business, ro les per formed and
educat ional background
Quest ion 2 .3 : W ere you invo lved in the same t ype o f bus iness
be fo re you s ta r ted you r bus iness?
A to ta l o f 86 ou t o f 150 responden ts answered yes to th is
ques t ion and 64 answered no . Th is ind ica tes tha t the ma jo r i t y
o f peop le en te r ing th is indus t ry ga in some exper ience in the
indus t ry be fo re dec id ing to en te r i t .

107
In ques t ion s 2 .31 to 2 .38 the responden ts we re asked to se lec t
va r ious ro les tha t t hey had pe r fo rmed be fo re en te r ing the
indus t ry . Responden ts cou ld choose more than one op t ion .
The ro les , wh ich a re cons idered to be managemen t accoun t ing
re la ted o r use fu l f o r an en t rep reneu r when manag ing a
bus iness success fu l l y , we re p resen ted to respondents . The
ro les inc luded the fo l lowing:
Pu rchases ,
Mate r ia l hand l ing ,
Manufac tu r ing ,
Qua l i t y con t ro l ,
Marke t ing and sa les ,
Adm in is t ra t i ve tasks ,
Managemen t , and
O the r .
As i l lus t ra ted in tab le 5 .1 , peop le in the c ra f t indus t ry do en te r
the indus t ry w i th some exposu re to manufac tu r ing , qua l i t y
con t ro l , marke t ing and sa les o r mate r ia l hand l ing and less
exposu re to pu rchases , adm in is t ra t i ve tasks and management .
I t seems as i f respondents wo rked wi th s im i la r bus inesses f i rs t
to acqu i re some knowledge and then dec ided to go so lo and
s ta r t the i r own bus iness .
Exposure to d i f fe ren t aspec ts o f bus iness w i l l imp rove the
en t repreneu rs ’ chances to succeed . L i les (1974 :473 ) s ta tes
tha t one o f the ma jo r reasons why ven tu re cap i ta l i s ts inves t in
a bus iness i s tha t the owner i s aware o f a l l ma jo r f ace ts o f the
bus iness . Any SME owner who can conv ince the ven tu re

108
cap i ta l i s t tha t he /she is aware o f these face ts o f the bus iness
w i l l most p robab ly improve the i r chances to be g ran ted a loan .
The resu l ts f o r the above ro les a re shown in tab le 5 . 1 be low.
Table 5 .1 : Previous ro les
Less than 3 years 4 to 6 years More than 7 years
Freq. Percentage Freq. Percentage Freq. Percentage
Purchases 2 5,13% 3 5,45% 8 6,84%
Material handling 8 20,51% 11 20,00% 24 20,51%
Manufacturing 14 35,90% 21 38,18% 39 33,33%
Quality control 4 10,26% 6 10,91% 13 11,11%
Marketing and
sales
5 12,82% 8 14,55% 22 18,80%
Administrative
tasks
2 5,13% 3 5,45% 4 3,42%
Management 2 5,13% 2 3,64% 5 4,27%
Other 2 5,13% 1 1,82% 2 1,71%
Total 39 100,00% 55 100,00% 117 100,00%
Quest ion 2 .4 : W hat i s you r educa t iona l background?
The a im o f ask ing th is ques t ion was to de te rmine the number o f
peop le in the c ra f t i ndus t ry who ha d a t tended schoo l o r whose
educa t ion was bus iness re la ted . The respondents we re
requ i red on ly to ind ica ted the i r h ighes t leve l o f educa t ion .

109
Table 5 .2 : Level o f educat ion
Business
duration
No
education
at all
Limited
Schooling
Matric Certificate
for skills
development
programme
Certificate
Course
Diploma
or degree
Less than 3
years (28)
2 2 6 7 4 7
Between 4
and 6 years
(41)
0 1 10 17 5 8
7 years or
more (81)
4 17 19 13 16 12
Total 6 20 35 37 25 27
Percentage 4,00% 13,33% 23,33% 24,67% 16,67% 18,00%
Tab le 5 .2 ind ica tes tha t a to ta l o f 144 (96 , 00%) responden ts
had some fo rm o f schoo l ing , wh i le on ly s i x (4 , 00%) had no t . A
to ta l o f 37 responden ts had ce r t i f i ca tes fo r sk i l l s deve lopment ,
wh ich represen ts 24 ,67% o f the to ta l popu la t ion . These f i gu res
a re fo l lowed by the number o f peop le w i th a mat r ic cer t i f i ca te ,
tha t i s , a to ta l o f 35 responden ts , rep resen t ing 23 , 33%. The
th i rd ca tego ry had d ip loma cou rses w i th a to ta l o f 27
respondents (18 ,00%) . The lowest number was peop le w i th no
educa t ion . There were s i x (4 ,00%) o f these respondents .
Of the 28 responden ts whose bus inesses were less than th ree
yea rs o ld , seven (25 , 00%) had a d ip loma o r degree , seven
(25 ,00%) had a cer t i f i ca te fo r sk i l l s deve lopment , wh i le s i x
(21 ,43%) had a mat r ic ce r t i f i ca te . Tw o (7 ,14%) respondents
had no educa t ion , two (7 , 14%) had l im i ted educa t ion and fou r
(14 ,29%) had a t tended one -yea r ce r t i f i ca te cou rses . Th is is an

110
i nd ica t ion tha t mos t peop le do no t jus t e n te r the indus t ry
w i thou t some fo rm o f bas ic educa t ion .
Of the 41 responden ts who ope ra ted bus inesses wh ich were
be tween fou r and s i x yea rs o f age , ten (24 , 39%) con f i rmed tha t
they had acqu i red a mat r ic cer t i f i ca te , 17 (41 , 46%) had
a t tended ce r t i f i ca te courses , f i ve (12 , 20%) had a cer t i f i ca te fo r
a sk i l l s deve lopmen t p rogramme, e igh t (19 ,51%) had degrees
and one (2 ,44%) had l im i ted schoo l ing.
Tab le 5 .2 shows tha t in the ca tego ry o f seven years o r more ,
f our (4 ,94%) had no educa t ion , 17 (20 , 99%) had l im i ted
educa t ion and 19 (23 , 46%) had mat r i c . Th i r teen ind iv idua ls had
a ce r t i f i ca te fo r a s k i l l s deve lopment p rogramme (16 , 05%),
wh i le 16 ind iv idua ls had a t tended a ce r t i f i ca te course (20 ,00%)
and 12 had d ip lomas (14 , 81%).
In quest ion 2 .5 , the respondents we re asked to ind ica te
whethe r the i r educa t ion was bus iness - re la ted o r no t . A to ta l o f
144 respondents ans wered the quest ion , w i th 55 (38 , 19%)
con f i rm ing tha t the i r educa t ion was bus iness - re la ted , wh i le 89
(61 ,81%) ind ica ted tha t i t was no t .
On ly seven (28 ,00%) o f the 25 responden ts w i th bus inesses
less than th ree yea rs o ld s ta ted tha t the i r educa t ion
background was bus iness - re la ted and 18 (72 , 00%) ind ica ted
tha t i t was no t . Of the 41 respondents w i th bus inesses be tween
four and s i x yea rs o ld , 19 (46 , 34%) had bus iness - re la ted
educa t ion and 22 (5 3 ,66%) d id no t . Of those responden ts
whose bus inesses were mo re than seven yea rs o ld , on ly 78

111
answered th is ques t ion , o f them, 29 (37 ,18%) had bus ine ss-
re la ted educa t ion and 49 (62 , 82%) d id no t .
The above resu l ts ind ica te tha t bus iness - re la ted educa t ion is
no t a d r i ve o r mot i va t ion fo r peop le to en te r the c ra f t i ndus t ry .
Ava i lab i l i t y o f sk i l l s and unemp loyment a re the ma in reasons,
as ind ica ted in quest ion 2 .1 . Bu t tne r and Rosen (1989 :249 )
s ta te tha t the techn ica l know-how and competence o f t he owner
a re some o f the fac to rs tha t pe rsuad e ven tu re cap i ta l i s t s to
i nves t in SMEs. Th is ind ica tes tha t any SME owner who can
p rove tha t he /she has acqu i red a t leas t some fo rm o f
managemen t accoun t ing sk i l l s e i t he r th rough fo rma l educa t ion
o r o ther f o rms o f t ra in ing w i l l most p robab ly s tand a good
chance o f be ing gran ted a loan .
In quest ion 2 .6 respondents we re asked as to whether they
have a t tended workshops o r sho r t cou rses to deve lop the i r
bus iness sk i l l s . A to ta l o f 64 ,43% has con f i rmed tha t they have
a t tended workshops o r sho r t cou rses wh i le o n ly 35 .57% have
answered no .
In quest ion 2 .7 respondents we re asked to se lec t the
expe r iences they possessed be fo re open ing a bus iness . A to ta l
o f 4 were p rov ided in t he quest ion and they were a lso a l lowed
to s ta te any expe r ience excep t t he fou r p rov ided in t he
quest ion . On ly 11 ,11% o f the respondents con f i rmed tha t they
have managed o ther bus inesses be fo re , wh i le 16 ,16%
con f i rmed tha t they had done bookkeep ing. A to ta l o f 26 ,77% o f
the respondents con f i rmed th a t t hey pe r fo rmed adm in is t ra t i ve
du t ies fo r a bus iness wh i le 37 ,37% con f i rmed tha t t hey have

112
done some inven to ry con t ro l and on ly 8 ,59% spec i f ied o the r
f unc t ions .
5.2 .5 Management accoun t ing sk i l ls and exper ience
obta ined pr ior to opera t ing a s imi la r bus iness
Iden t i f i ca t ion o f the gap in managemen t accoun t ing sk i l l s
requ i red by ven tu re cap i ta l i s ts and those possessed by SME
ope ra to rs in the c ra f t i ndus t ry i s the ma in focus o f the s tudy . A
number o f management account ing sk i l l s we re p resen ted to the
respondents in quest ion 2 .8 and respondents we re a sked to
se lec t those they possessed du r ing opera t ion o f a bus iness .
The purpose o f th is sec t ion was to de te rm ine how they have
sk i l led themse lves dur ing the ope ra t ion o f the bus iness . F igure
5 .5 p resen ts the to ta l number o f responses.
F rom f igu re 5 .5 i t i s c lea r tha t on ly 62 , 00% o f t he responden ts
se lec ted bookkeep ing a s the sk i l l tha t they had acqu i red du r ing
ope ra t ion o f bus iness . Th is number inc ludes those who sa id
tha t they had enhanced the i r sk i l l by keep ing the i r own books
even though they d id no t have fo rma l t ra in ing. The lowest
number o f responses was found fo r economic o rde r quant i t y
(EOQ) (1 ,33%) , b reak-even ana lys i s (9 ,33%) , ac t iv i t y -based
cos t ing (3 ,33%) , va r iance ana lys is (4 ,00%) , l i f e cyc le cos t ing
(2 ,00%) and s tanda rd cos t ing (3 ,33%) . These low resu l ts
con f i rm tha t the y d id no t rece ive any t ra in ing in these
managemen t accoun t ing sk i l l s .
F rom the resu l t s i t can be con f i rmed tha t some respondents in
the c ra f t indus t ry cou ld pe r fo rm du t ies inc lud ing bookkeep ing ,

113
cos t con t ro l , cash f l ow manage ment , p roduc t cos t ing and
budget ing.
Figure 5 .5 : Ex is t ing exper ience and sk i l ls
1,33%
9,33%4,00%2,00%3,33%3,33%
48,67%
8,67%
37,33%36,67%
45,33%
5,33%
41,33%
62,00%
0.00%
10.00%
20.00%
30.00%
40.00%
50.00%
60.00%
70.00%
Boo
kkee
ping
Cas
h flo
w m
anagem
ent
Ove
rhea
ds
Cos
t con
trol
Pro
duct c
ostin
g
Raising
capi
tal
Finan
cial a
nd sa
les pro
jectio
ns
Bud
getin
g
Sta
ndar
d cost
ing
Act
ivity
bas
ed c
ostin
g
Life
cyc
le c
ostin
g
Var
ianc
e ana
lysis
Bre
ak-ev
en a
nlys
is
EO
Q &
Sto
ck m
anag
emen
t
Percentage
5.2 .6 Sources o f funds
Quest ion 3 .1 : How d id you f inance you r bus iness?
The a im o f ask ing th i s ques t ion was to de te rmine the sou rces
o f f inance the SME ope ra to rs used in f inan c ing the i r bus iness
when they in i t ia l l y s ta r ted the i r opera t ions .
The quest ion a l l owed the respondents the oppo r tun i ty t o se lec t
a combina t ion o f sources . There fo re the number o f se lec ted
sou rces a re more than the number o f ques t ionna i res re tu rned .

114
Figure 5.6: Sources of finance
94,67%
17,33%12,00% 8,67%
5,33%
0.00%
10.00%
20.00%
30.00%
40.00%
50.00%
60.00%
70.00%
80.00%
90.00%
100.00%
Personal
savings
Borrowing
from a
relative
Borrowing
from a local
bank
Funded by
venture
capitalist
Other
Percentage
Mos t o f the peop le who pa r t ic ipa ted in th is su rvey (see f i gure
5 .6 ) con f i rmed tha t the i r sou rces o f f unds were l im i ted to the i r
pe rsona l sav ings , re la t i ves and loca l m ic ro - lende rs . Mos t o f t he
respondents in q ues t ion 4 .1 repo r ted tha t they had neve r
wo rked wi th b ig banks o r app roached a ven tu re cap i ta l p rov ider
f o r a loan . These resu l t s a re in l ine w i th what was h igh l igh ted
by Nts ika En te rp r i se P romot ion Agency (2002 :111 ) tha t most
SMEs in South A f r i ca have neve r accessed a loan f rom e i the r a
p r i va te o r pub l ic ins t i tu t ion .
Some o f the respondents se lec ted more t han one sou rce o f
f inance , espec ia l ly t hose who were ope ra t ing par tnersh ips and
c lose co rpo ra t ions . A s ign i f i can t 142 o f the responden ts s ta ted
tha t t hey used the i r pe rsona l sav ings . The o the r sou rces o f
f inance tha t we re ment ioned in ques t ion 3 .1 we re sponso rsh ips
o r awards f rom compan ies a f te r recommendat ions by an
emp loyee . S tokve l , as ment ioned in chap te r 2 i s a l so a t ype o f
assoc ia t ion tha t peop le i n townsh ips can use to ob ta in fund ing.
115
In quest ion 3 .4 on ly 24 ,14% o f the SMEs respondents agreed
tha t on ave rage i t took them less than 12 months to ra ise the
cap i ta l e i the r by us ing pe rsona l sav ings o r bo r rowing money
f rom a loca l bank . SME owners a l so ind ica ted tha t the cap i ta l
was no t su f f i c ien t t o s ta r t ope ra t ion o f the bus iness (quest ion
3 .2 ) .
Pa r t i c ipan ts were requested to s ta te the m in imum amoun t o f
cap i ta l they used in buy ing the i r f i rs t inven to ry o r the i r wo rk ing
too ls . From the answers rece i ved to quest ion 3 .3 , the m in imum
amoun t was R450 and the ma jo r i t y used less than R2 000 .
Those who used a comb ina t ion o f persona l sav ings and
bo r rowing f rom a loca l bank and re la t i ves 13 (8 ,67%) ou t o f
150 responden ts used a m in imum o f R15 000 , and 13 (8 ,67%)
used R5 000 . F rom these resu l ts i t can be seen tha t most c ra f t
i ndus t ry bus iness peop le do no t requ i re much cap i ta l to
es tab l ish the i r bus inesse s . On ly f i ve (3 ,33%) and one (0 , 67%)
o f t he respondents used R20 000 and R50 000 , respec t i ve ly .
The resu l ts f o r th i s sec t ion a re p rov ided in append ix 2a ,
ques t ion 3 .3 .
The response to quest ion 3 .5 ind ica ted tha t on average i t took
m ic ro - lende rs less than two mon ths to approve a loa n
app l ica t ion (13 respondents ) w h i le i t took ven tu re cap i ta l
p rov iders about 6 to 12 months to app rove a loan amount o f
l ess than R15 000 (18 respondents ) . Howeve r , the ma jo r i t y o f
the responden ts (119 ) ind ica ted tha t they had never bor rowed
money f rom f inanc ia l ins t i tu t ions (banks ) f o r e i t her pe rsona l o r
bus iness use , wh ich rep resen ts 79 ,33%.

116
5.2 .7 Rela t ionship w i th f inanc ia l ins t i tu t ions
Respondents who used f inanc ia l ins t i tu t ions were asked
whethe r they be l ieve d tha t pe rsona l accomp l ishmen ts
(Quest ion 4 .3 ) and educa t iona l background (Quest ion 4 .2 ) had
an in f luence on the ins t i tu t ion ’s dec is ion to g ran t loans . The
resu l ts ind ica te tha t responde nts be l ieved tha t educa t ion
(78 ,79%) and persona l accomp l ishments (65 ,63%) d id no t have
much in f luence .
In quest ion 4 .6 reasons fo r no t be ing g ran ted loans were l i s ted
on the quest ionna i re . A to ta l o f 67 respondents answered th i s
ques t ion . The h ighes t number o f responses (34 o u t o f 67 )
con f i rmed no t hav ing enough secur i t y wh i le the lowest (10 ou t
o f 67 ) con f i rmed l im i ted management expe r ience as the ma in
reasons fo r tu rn ing down the app l i ca t ion . Of t he 67 on ly 23
s ta ted o ther reasons , such as the unava i lab i l i t y o f tax
cer t i f i ca te s and reg is t ra t ion documen ts to run a bus iness .
5.2 .8 Problems exper ienced in acquir ing a loan
Quest ion 5 : W hat was the b igges t p rob lem you exper ienced
in acqu i r ing a lo an?
The a im o f ask ing th is ques t ion was to asce r ta in the d i f f e ren t
p rob lems responden ts had expe r ienced in acqu i r ing a loan f rom
f inanc ia l i ns t i tu t i ons , re la t i ves and o ther sou rces .
A to ta l o f 142 ou t o f 150 responden ts answered th is ques t ion .
The respondents we re asked to se lec t a combina t ion o f
reasons , and there fo re the number o f reasons se lec ted i s more

117
than the number o f ques t ionna i res re tu rned . On ly fou r o f the
f i ve p rob lems l i s ted were se lec ted . None o f the respondents
chose “ t ime lapse be tween ap p l i ca t ion and approva l o f loan ” as
a p rob lem expe r ienced .
Figure 5 .7 : Problems exper ienced in acqui r ing a loan
F rom f igu re 5 .7 i t i s ev iden t t ha t , mos t o f the responden ts
con f i rmed tha t the b igges t p rob lem they expe r ienced w as
iden t i f y ing the poss ib le f inanc ia l p rov iders , w i th 82 (57 , 75%)
ind ica t ing tha t t h is was a p rob lem expe r ienced wheneve r they
have to app ly fo r a loan .
The second h ighes t p rob lem they expe r ienced was d ra wing up
a feas ib i l i t y s tudy (22 , 54%), wh i le the th i rd h ighes t was
comple t ing app l ica t ion fo rms (14 , 79%) .
The o the r p rob lems expe r ienced were :
No t be ing aware o f the p rocess used ,
Percentage
57,75% 14,79%
22,54%
4,92%
Identifying possible financiers
Completing complicated application forms
Drawing up a feasibility study
Other

118
Bus iness p lan no t in o rder ,
Feas ib i l i t y s tud ies no t conducted , and
Inco r rec t es t ima ted amount requ i red .
Seven (4 ,92%) o f the respondents con f i rmed tha t they had
expe r ienced one o r more o f the above p rob lems . As i l l us t ra ted
in f i gu re 5 .7 the resu l t s ind ica te tha t the ma jo r i t y o f
respondents were no t aware o f whe re to ra ise funds . The leve l
o f educa t ion in te rms o f comp le t ing app l i ca t ion fo rms is a lso a
p rob lem tha t f inanc ia l i ns t i tu t ions need to add ress .
5.3 RESE ARCH FINDINGS - VENTURE CAPITALISTS
As d i scussed in chap te r 4 mos t o f the SME ope ra to rs c i te lack
o f in te res t by ven tu re cap i ta l i s t s in the sma l l bus iness sec to r
as one o f the ma jo r reasons why the re i s low inves tment i n the
sec to r . Excep t in t e res t in the sec to r , r i sk i s a lso a ma jo r
reason c i ted by ven tu re cap i ta l i s ts f o r low inves tment in SMEs .
5.3 .1 Years o f exper ience o f funding SMEs
Quest ion 1 .1 : How long has you r o rgan isa t ion been fund ing
SMEs?
The resu l t s o f th is ques t ion a re p resen ted in f i gu re 5 .8 be low .
Ou t o f the to ta l number o f respondents who answered th is
ques t ion on ly one con f i rmed tha t the i r bus iness had been
fund ing SMEs fo r l ess than f i ve yea rs , wh i ch rep resen ts 3 , 33%
o f respondents . Seven had be tween s i x and ten years o f
expe r ience in f u nd ing SMEs, wh ich rep resen ts 23 , 33%. Of the
respondents , 13 con f i rmed tha t they had be tween 11 and 15

119
yea rs ’ exper ience o f f u nd ing SMEs, wh ich rep resen ts 43 , 33%
and n ine had 16 yea rs o r more , wh ich rep resen ts 30 , 00% o f the
respondents .
F igure 5 .8 : Years o f exper ience o f funding SMEs
43,33%
23,33%
3,33%
30,00%
Less than 5 years Between 6 and 10 years
Between 11 and 15 years 16 years and above
As i l l us t ra ted in f i gu re 5 . 8 , no t many ven tu re cap i ta l p rov ide rs
have funded in the c ra f t indus t ry . On ly 43 ,33% o f the
responden t s con f i rmed tha t t hey had be tween 11 and 15 yea rs ’
of expe r ience in he lp ing SMEs wi th funds . Th is f ind ing
ind ica tes tha t most SMEs may s t i l l expe r ience a p rob lem
access ing funds because ven tu re cap i ta l i s t s pe rce ive SMEs as
r i sky (Ross e t a l 1996 :448 ) .
5.3 .2 Form and development s tage o f business
In ques t ion 1 .2 of the quest ionna i re the responden ts we re
asked to ment ion whethe r the fo rm o f bus iness had an
in f luence on the dec is ion to f inance a sma l l bus iness .
120
Out o f a to ta l o f 30 respondents 21 (70 ,00%) answered yes ,
wh i le on ly 9 (30 ,00%) answered tha t the fo rm o f bus iness d id
no t have an in f luence on the dec is ion to f inance a sma l l
bus iness .
The resu l t s ind ica te tha t the respondents pe rce ived tha t the
fo rm o f bus iness does indeed have an in f luence on t he dec is ion
to f inance a bus iness . Th is means tha t i t w i l l be v i ta l f o r t he
fund app l i can ts to check wh ich fo rm o f bus iness they s ta r t
be fo re app ly ing f o r f unds and wh ich fo rm the ven tu re
cap i ta l i s t s p re fe r to f und .
In quest ion 1 .3 o f the quest ionna i re t he responden ts we re
asked to rank the fo rms o f bus inesses they were l i ke l y to f und .
A l l f o rms o f bus iness were ranked h igh above 57 ,00%, wh ich
ind ica tes tha t they a re a l l va lued . These resu l ts a re p resen ted
in f i gu re 5 .9 in the o rde r in wh ich they were ran ked , s ta r t ing
w i th the fo rm o f bus iness w i th the h ighes t number o f
responses.
A to ta l o f 26 ou t o f 30 respondents (86 , 67%) ranked p r i va te
compan ies a t 5 ou t o f 30 (h igh ) . The second h ighest f o rm o f
bus iness was c lose co rpo ra t ions w i th a to ta l o f 22 ou t o f 30
(73 ,33%) responden ts and the th i rd h ighes t was par t ne rsh ips
w i th a to ta l o f 20 (66 , 67%) responden ts . So le ownersh ips we re
the fou r th ranked fo rm o f bus iness w i th a to ta l o f 18 ou t o f 30
(60 ,00%) responden ts .

121
Figure 5.9: Form of business likely to receive funding
88,8
6%
73,3
3%
66,6
7%
60,0
0%
0.00% 10.00% 20.00% 30.00% 40.00% 50.00% 60.00% 70.00% 80.00% 90.00% 100.00
%
Private co.
Close Corp
Partnership
Sole Ownership
Percentage
The resu l t s in f igu re 5 . 9 i l lus t ra te tha t a l l f o rms o f bus iness
s tand a chance o f be ing g ran ted a loan . Howeve r , the
deve lopment s tages o f these bus inesses as seen f rom resu l ts
i n quest ion 1 .4 w i l l i n f luence the dec is ion whethe r to g ran t a
loan o r no t .
In quest ion 1 .4 , the respondents we re asked to de te rmine
whethe r the deve lopment s tage o f t he bus iness had an
in f luence on the dec is ion to g ran t a loan o r app rove fund ing . A
to ta l o f 20 (66 , 67%) respondents answered yes , wh i le 10
(33 ,33%) answered no .
The resu l t s i l l us t ra te tha t the deve lopmen t s tage o f a bus iness
in f luences the dec is ion to g ran t a loan o r f und a bus iness . Th is
suppo r t s t he s ta tement tha t was made in a DTI repo r t (2005)
tha t f i rs t - s tage SMEs a re un l i ke ly to ob t a in loans as compared
to o the r s tages .

122
In quest ion 1 .5 the responden ts we re asked to rank the
deve lopment s tages o f bus inesses tha t they wou ld inves t in .
The ra t ing was based on the mos t l i ke l y to l eas t l i ke l y
deve lopment s tage to be funded.
Acco rd ing to the resu l ts , t he most l i ke l y deve lopmen t s tages
tha t wou ld be funded a re the mature and g rowth s tages. Bo th
s tages were ranked h igh ly by 26 o f 30 (86 ,67%) and 25 o f 30
(83 ,33%) responden ts , r espect i ve ly . A to ta l o f 13 o f 30
(43 ,33%) responden ts ne i the r agreed no r d i sagreed tha t they
wou ld fund s ta r t -up bus inesses . The leas t l i ke l y deve lopment
s tage tha t t hey wou ld fund is t he p lann ing s tage wi th 25 o f 30
(83 ,33%) responden ts rank ing the p lann ing s tage a t 1 . The
resu l ts o f the above d iscuss ion a re p resen t ed in append ix 2b ,
quest ion s 1 .51 to 1 .54 .
5.3 .3 Awareness o f the appl icants about sources of funds
ava i lable
In quest ion 1 .6 t he responden ts we re asked to men t ion
whethe r the f inance app l i can ts we re aware o f t he t ypes o f
f unds they cou ld app ly fo r . A t o ta l o f 19 ou t o f 30 (63 .33%)
respondents answered tha t they a re o f the op in ion tha t
app l ican ts we re aware o f the t ypes o f f unds , wh i le 11 o f 30
(36 ,67%) responden ts answered no .
The resu l ts i l lus t ra te tha t most app l ican ts a re aware o f the
d i f f e ren t sou rces o f f inance . Th is is ind ica ted by the h igh
number o f ven tu re cap i ta l i s ts who con f i rmed tha t app l ican ts a re
aware o f the sou rces o f f unds .

123
In quest ion 1 .7 the responden ts had to ment ion the number o f
app l ica t ions they rece ived per month pe r source o f f in ance . A
l i s t o f the sou rces o f f unds was p resen ted to the responden ts .
The most app l i ca t ions were rece ived fo r s ta r t -up funds and
expans ion a t 50 app l i ca t ions pe r month , f o l lowed by
rep lacements and buy -ou ts bo th a t 40 app l ica t ions pe r month .
Seed cap i ta l was app l ied fo r the leas t , a t 10 app l ica t ions per
month . The resu l t s f o r the above pa ragraph a re p resen ted in
append ix 2b .
5.3 .4 Reasons for and agains t grant ing loan s to
appl icants
In quest ions 1 .8 and 2.21 the respondents we re asked to
ment ion some o f the reasons fo r gran t ing and re fus ing a loan .
Du r ing the co l lec t ion o f da ta f rom SMEs, some responden ts
ind ica ted reasons tha t wo rk fo r and aga ins t be ing g ran ted a
loan . Th is the re fo re led to the inc lus ion o f a ques t ion in the
ven tu re cap i ta l p rov iders ’ ques t ionna i re on reasons fo r g ran t ing
and re fus ing a loan .
Two open -ended ques t ions spec i f i ca l l y requested the
respondents to p rov ide some o f the ma in reasons why fund ing
was g ran ted to app l ican ts and why fund ing was den ied . Tab le
5 .3 s ta tes reasons men t ioned by more than one respondent f o r
and aga ins t g ran t ing loans to app l ican ts .

124
Table 5 . 3 : Reasons for and agains t grant ing loan
appl ica t ions
Reasons for granting a loan
(q 1.8)
Reasons against granting a loan (q 2.21)
The market is new Management team inexperienced
An outstanding management team No community involvement
A well-defined industry focus Owners between the ages of 18 and 35
Feasibility studies conducted Gender representation
Affordability of the loan amount Business idea not viable
Commercial viability of the project Financial projections not prepared by an
expert
Black-economic-empowerment
compliant
Business not registered
Business plan looks
good/promising
Affordability of loan amount
The barriers to entry into the
market are built on intellectual
capital or brands
Growth prospects not clear
Can provide 6 months’ financial
records
Consumer/applicant is a minor
Tab le 5 .3 a l so ind ica tes the reasons why fund ing is g ran ted o r
den ied to loan app l ican ts . These reaso ns cou ld be used by loan
app l ican ts fo r se l f - check ing be fo re lodg ing an app l ica t ion fo r
f und ing wi th fund p rov iders . They g ive an app l ican t a chance to
de te rm ine the l i ke l i hood o f success o f the app l ica t ion fo r f unds .
I t was a lso deduced tha t loca t ion and se t t lement s t ra teg ies o f
the bus iness do no t in f luence the l i ke l ihood o f success when
app ly ing fo r a loan (Quest ion 1 .9 to 1 .11 )

125
5.3 .5 Sec tors o f the indust ry most pre fe rred
In quest ion 1 .14 the respondents we re asked to ment ion
whethe r t he sec to r o f the indus t ry i n f luenced the dec is ion to
g ran t a loan and a to ta l o f 20 (66 , 67%) responden ts answered
yes wh i le 10 (33 , 33%) answered no .
In quest ion 1 .15 o f the quest ionna i re the responden ts were
asked to rank the indus t ry sec to r tha t was mos t l i ke l y to
rece ive a loan . The a im o f th is ques t ion was to de te rmine the
mos t p re fe r red indus t ry sec to r by ven tu re cap i ta l p rov iders .
The resu l t s f o r th is ques t ion a re p resen ted acco rd ing to the i r
rank ing , s ta r t ing w i th the most l i ke l y and f in i sh ing w i th the
leas t l i ke l y sec to r to rece ive fund ing (see f i gu re 5 .10) .
Respondents cou ld rank more than one indus t ry sec to r .
The sec to rs we re ranked in the fo l lowing o rde r : in fo rmat ion and
techno logy was ranked h igh ly by 27 (90 ,00%) respondents as
the sec to r most l i ke l y to rec e ive fund ing, f o l lowed by the re ta i l
sec to r w i th 19 (63 .33 %) responden ts , th i rd i s the t ranspo r t
sec to r w i th 18 (60 .00%) respondents , the fou r th - ranked sec to r
i s the commun ica t ion indus t ry w i th 16 (53 .33%) responden ts ,
f o l lowed by bo th agr icu l t u re and cons t ruc t ion w i th 14 (46 .67%)
respondents . The leas t l i ke l y sec to r is the c ra f t sec to r w i th
33 .33% o f responden ts rank ing i t a t 5 . The resu l t s f o r the
above paragraph a re p resen ted in f i gu re 5 .1 0 be low.

126
Figure 5.10: Sectors of economy
63,33%
60,00%
46,67%
90,00%
53,33%
46,67%
33,33%
0.00% 20.00% 40.00% 60.00% 80.00% 100.00%
Retail
Transport
Agriculture
Information &
Technology
Communication
Construction
Craft
Percentage
As i l lus t ra ted in f i gu re 5 .10 , the p re fe r red sec to r o f the
economy is in fo rmat ion and techno logy . Th is ind ica tes tha t i f
the app l i can t i s in in fo rmat ion and techno logy , they a re mos t
l i ke l y to rece ive fund ing. Howeve r , th is w i l l on ly depend on
whethe r the app l ican t unde rs t ands the c r i te r ia used in
assess ing the loan app l i ca t ions (quest ion 1 .12 ) . A to ta l o f 18
(60 ,00%) o f the respondents agreed tha t unde rs tand ing the
c r i te r ia used by ven tu re cap i ta l i s ts i nc reased the chances o f
ob ta in ing a loan , wh i le 12 (40 , 00%) d id no t agr ee .
5.3 .6 Major aspects that f inancia l ins t i tu t ions consider
be fore a l loca t ing funds
In quest ion 2 .1 the respondents we re asked to rank aspects o f
managemen t they cons ide red be fo re g ran t ing a loan to
app l ican ts . The responden ts ind ica ted tha t most , i f n o t a l l , o f
the aspec ts l i s ted were impor tan t because most o f t he m were

127
ranked 5 . None o f the 30 respondents ra ted these aspec ts less
than 3 .
A to ta l o f 29 ou t o f 30 (96 ,67%) , 27 (90 ,00%) and 25 (83 , 33%)
respondents respect i ve ly ranked good t rack reco rd i n manag ing
a s im i la r t ype o f bus iness , knowledge o r expe r ience in a s im i la r
marke t o r p roduct and expe r ience in d ra f t ing p ro jec ted sa les
and f inanc ia l s ta tements a t 5 (h igh) , respect i ve ly . On the o ther
hand , pa r t i c ipa t ion o f the app l i can t in deve lop ing a b us iness
p lan , par t i c ipa t ion o f the app l ican t in deve lop ing a p ro to t ype
p roduct and techn ica l expe r ience in the same p roduct
manufac tu red were ranked a t 4 . The se resu l ts a re p resen ted in
f i gu re 5 .11 be low.
The resu l t s in f igu re 5 .11 ind ica te tha t the pa r t i c ipa t ion and
expe r ience o f the app l ican t in runn ing a s im i la r t ype o f
bus iness a re h igh ly recommended. These resu l ts a re in l ine
w i th what was repo r ted by Bu t tne r and Rosen (1989:250 ) tha t
the chances o f the app l ican t ob ta in ing a loan depend on fu l l
i nvo lvement i n the bus iness . Knowledge o f a p ro to t ype p roduct
and marke t i s a lso h igh ly recommended .

128
Figure 5.11: Aspects considered before granting a loan
76.67% 76.67% 76.67%
96.67%
83.33%90.00%
0.00%
20.00%
40.00%
60.00%
80.00%
100.00%
120.00%
Percentages
Participation of applicant in developing a business plan
Participation of applicant in developing a prototype product
Technical experience in the same product manufactured
Good track record in managing a similar type of business
Experience in drafting projected sales and financial statements
Knowledge or experience in the similar market or product
5.3 .7 Analys is o f independent quest ions
Apa r t f rom the aspec ts l i s ted fo r the respondents , th ere were
gene ra l ques t ions re la ted to the managemen t o r success fu l
ope ra t ion o f the bus iness tha t we re inc luded in the
quest ionna i re . In quest ion 2 .2 , responden ts we re asked
whethe r the revenue gene ra ted in the pas t had an in f luence on
the dec is ion to f ina nce a bus iness . A to ta l o f 26 (86 , 67%) o f
the responden ts answered yes , wh i le f ou r (13 , 33%) answered
no .
In quest ion 2 .3 respondents we re asked to ment ion whether
the p ro jec ted revenue in f luenced the dec is ion to g ran t a loan .
A to ta l o f 28 (93 , 33%) agreed tha t t he p ro jec ted revenue had
an in f luence , wh i le on ly two (6 , 67%) d isagreed .
129
Quest ion 2 .4 was impor tan t ques t ion as i t was re la ted to
quest ion 2 .5 . Responden ts we re asked whether the gua ran teed
re tu rn on inves tments d i rec t l y in f luenced the dec is ion to
f inance a bus iness . A to ta l o f 10 (33 , 33%) responden ts agreed
tha t the re tu rn on inves tmen t had a d i rec t in f luence on the
dec is ion to g ran t a loan , wh i le 20 (66 , 67%) d isagreed . In
Quest ion 2 .5 respondents who answered yes to quest ion 2 .4
we re asked to men t ion the expec ted re tu rn on inves tment tha t
wou ld conv ince the respondents to g ran t a loa n . The resu l ts
i nd ica te tha t 42 , 86% o f those who answered th is ques t ion
s ta ted 15 ,00% as the expec ted re tu rn on inves tment , 28 , 57%
s ta ted 10 ,00% and ano the r 28 , 57% s ta ted 25 ,00%. The resu l ts
f rom the above ind ica te tha t re tu rn on inves tment does no t in
f ac t have a d i rec t in f luence on the dec is ion to g ran t a loan .
In quest ion 2 .6 respondents were asked to ind ica te whethe r
the p roduct charac te r i s t ics in f l uenced the dec is ion to f inanc e a
bus iness . A to ta l o f 13 (43 , 33%) respondents agreed tha t the
p roduct cha rac te r i s t i cs had an in f luence , wh i le 17 (56 ,67%)
d isagreed .
In quest ion 2 .7 a range o f op t ions were ava i lab le fo r se lec t ion .
In quest ion 2 .7a the respondents we re asked to ind ica te
whethe r p ro jec ted marke t sha re had an in f luence on the
dec is ion to g ran t a loan . Of the respondents 24 (80 , 00%)
agreed tha t p ro jec ted marke t sha re had a d i rec t i n f luence ,
wh i le s i x (20 ,00%) d isagreed .
In ques t ion 2 .7b the respondent s we re asked whethe r g rowth
p rospec ts in f luenced the dec is ion to g ran t a loan . Mos t o f the
respondent 25 (83 ,33%) agreed , wh i le f i ve (16 , 67%) d isagreed .

130
Quest ion 2 .7c asked responden ts whethe r compet i t i veness o f
the bus iness had a d i rec t in f luence on the d ec is ion t o g ran t a
loan . Twenty - fou r (80 ,00%) agreed and s i x (20 , 00%) d isagreed .
Quest ion 2 .7d asked responden ts to spec i f y o the r fac to rs tha t
they cons ide red impor tan t . The fo l lowing fac to rs were
ment ioned :
Type o f cus tomers ,
Type o f p roduct ,
D ive rs i f i ca t ion o f i nves tmen t po r t f o l i o ,
S t ra tegy and d i rec t ion o f the bus iness ,
H igh ba r r ie rs to en t ry , and
H igh marg in p roducts .
In quest ion 2 .8 the respondents we re requ i red to ind ica te the
ven tu re cap i ta l i s t ’ s expec ted g rowth ra te i n the bus iness be fo re
mak ing a f i nanc ia l commi tmen t . On ly 14 responden ts answered
th i s ques t ion . The lowes t and max imum expected g rowth ra tes
we re 10 ,00% ( ind ica ted by 14 , 29% o f responden ts ) to 25 ,00%
( ind ica ted by 14 , 29% o f respondents ) .
In quest ion 2 .9 the responden ts we re asked whe the r the
in te l lec tua l p roper t y ( reg is te red b rand ) had a d i rec t in f luence
on the dec is ion to g ran t a loan . A to ta l o f 23 (76 , 67%)
respondents agreed tha t i t d id , wh i le on ly seven (23 , 33%)
d isagreed .
In quest ion 2 .10 the respondents we re asked whethe r th e
p rev ious reco rd o f management had a d i rec t in f luence on the
dec is ion to g ran t a loan . A to ta l o f 19 (63 ,33%) agreed , wh i le
11 (36 ,67%) d isagreed . Quest ion 2 .10 was l inked to ques t ion

131
2.11 . I n quest ion 2 .11 the responden ts had to men t ion some o f
the fac to rs o r p rev ious ach ievements tha t wou ld be cons ide red
be fo re mak ing a f inanc ia l commi tment . The fo l lowing fac to rs
we re ment ioned :
A success fu l con t rac to r ,
In tegr i t y ,
Success fu l ope ra t ion o f a bus iness ,
Hav ing p rev ious ly been invo lved in the p roduc t ion o f
the ma in p roduct , and
Be ing ab le to repay the loan wi thou t any p rob lems .
Quest ion 2 .12 asked the respondents to ind ica te whe the r the
ro le o f the founder as a manager o r owner had an in f luence on
the dec is ion to g ran t a loan . A to ta l o f 27 (90 ,00%) agreed an d
th ree (10 ,00%) d isagreed .
In quest ion 2 .13 responden ts we re asked to ind ica te whethe r
the compos i t i on o f the management team in te rms o f gende r
had an in f luence on the dec is ion to g ran t a loan . A to ta l o f on ly
s i x (20 ,00%) o f the respondents agreed , wh i le 24 (80 ,00%)
d isagreed .
Quest ion 2 .14 was l i nked to quest ion 2 .15 and the
respondents had to ind ica te whe the r f inanc ia l con t r ibu t ion by
the founder o r managemen t team in f luenced the dec is ion to
g ran t a loan . A to ta l o f 2 0 (66 ,67%) agreed , wh i le 10 (33 , 33%)
d isagreed . I n ques t ion 2 .15 , responden ts we re asked to s ta te
the p re fe r red pe rcen tage , i f the answer to 2 .14 was yes . The
m in imum and max imum con t r ibu t ions requ i red were 10 ,00% and
50 ,00% o f the requ i red cap i ta l , respect i ve ly .

132
5.3 .8 Management accoun t ing sk i l ls l ike ly to in f luence the
decis ion
In quest ion 2 .16 ven tu re cap i ta l i s ts respondents were asked to
rank va r ious managemen t account ing sk i l l s l i ke l y to i n f luence a
dec is ion to g ran t a loan . Va r ious op t ions were p rov ided fo r
se lec t ion . The resu l t s a re p rov ided in t ab le 5 . 4 be low.
Tab le 5 .4 : Management account ing sk i l ls - h ighly
recommended
Frequency Percentage
Management of cash flow 25 83,33%
Product costing 24 80,00%
Ability to calculate profit 23 76,67%
Inventory management 23 76,67%
Budgeting 21 70,00%
Bookkeeping 20 66,67%
Calculation of financial and sales projections 14 46,67%
Calculation of break-even point 11 36,67%

133
Table 5.5: Management accounting skills - less highly recommended
Frequency Percentage
Knowledge of analysing price trends 15 50%
Analysis, identification or awareness of
overheads
12 40%
Identification and separation of fixed and
variable overheads
11 36,67%
Calculation of expected rate of return 11 36,67%
The f i gu res above ind ica te the sk i l l s wh ich v en tu re cap i ta l
p rov iders recommended as be ing necessa ry and those wh ich
were less h igh ly recommended . The resu l t s ind ica te tha t
w i thou t bas ic management account ing o r f inanc ia l accoun t ing
sk i l l s , such as cash f low management , p roduc t cos t ing and
budget ing , i t m igh t be ve ry d i f f i cu l t to conv ince ven tu re cap i ta l
p rov iders tha t the SME is wo r thy o f be ing g ran ted a loan . Th is
s imp ly means tha t i t i s qu i te impor tan t f o r the app l ican ts to
make su re tha t they possess these m in imum sk i l l s be fo re
app roach ing most , i f no t a l l , f inanc ia l p rov iders .
Th is suppo r t s the s ta tement tha t was made by Hansohm
(1992 :141 ) tha t a lack o f management account ing sk i l l s and
l im i ted sma l l bus iness managemen t sk i l l s in car ry ing ou t
o rgan isa t iona l f unc t ions is one o f the reasons why SM Es a re
no t g ran ted loans by ven tu re cap i ta l i s t s .
5.3 .9 Other aspects tha t in f luence a dec is ion
In quest ion 2 .17 the respondents we re asked whether non -
managemen t account ing aspects had an in f luence on

134
app l ica t ions fo r f und ing . They were asked to rank t he po ten t ia l
o f sa les g rowth on the success o f the app l ica t ion fo r f und ing . A
to ta l o f 26 (86 , 67%) respondents ranked po ten t ia l o f sa les
g rowth a t 5 (h igh ) .
Respondents fe l t tha t management compos i t ion had no d i rec t
i n f luence on the i r dec is ion to g ran t a loan to app l i can ts and 17
(56 ,67%) ranked i t a t 1 (ve ry low) .
W i th rega rd to ex i t t ime and rou te ( the way the bus iness owner
wou ld se t t le t he loan ) , 13 (43 ,33%) respondents ind ica ted tha t
these fac to rs had no d i rec t in f luence on g ran t ing a loan .
In quest ion 2 .18 the researcher wanted to es tab l ish the
impor tance o f the bus iness p lan , a feas ib i l i t y s tudy, p ro jec ted
f inanc ia l s ta tements , s tanda rd app l i ca t ion fo rms and de ta i ls o f
bus iness s t ra tegy to the ven tu re cap i ta l p rov ide rs . A to ta l o f 30
(100%) ranked a bus iness p lan a t 5 (h igh) , and 27 (90 , 00%)
ranked a feas ib i l i t y s tudy a t 5 (h igh) .
O the r responses were tha t p ro jec ted f inanc ia l s ta tements we re
ve ry impor tan t , w i th 24 (80 ,00%) o f the respondents rank ing i t
a t 5 (h igh ) . W i th rega rd to s tanda rd ap p l ica t ion fo rms , 12
(40 ,00%) ne i the r agreed nor d isagr eed , wh i le 26 (86 , 67%) o f
the respondents ind ica ted tha t de ta i l s o f bus iness s t ra tegy
were very impor tan t .
The responses ind ica te tha t the bus iness p lan is ve ry impor tan t
because a l l the responden ts ranked i t h igh . The same can be
sa id about a feas ib i l i t y s tudy, p ro jec ted f inanc ia l s ta tements
and the de ta i ls o f bus iness s t ra tegy . They were a l l ranked a t 5

135
by 27 , 24 and 26 responden ts , respect i ve ly . However , the
comple t ion o f s tanda rd app l ica t ion fo rm s was no t cons ide red
tha t impor tan t , as 12 o f the 30 respondents , rep resen t ing
40 ,00%, ranked i t a t 3 , wh ich is an ave rage response ra te .
The penu l t imate ques t ion o f th i s sec t ion was based on
p rob lems expe r ienced by app l ican ts on p resen t ing the i r
bus iness p lans o r comple t ing app l ica t ion fo rms . The responses
(80 ,00%) ind ica te tha t ven tu re cap i ta l i s t s do no t pe rce ive
app l ican ts to have a p rob lem in p resen t ing the i r bus iness p lans
o r comple t ing app l i ca t ion fo rms.
The las t ques t ion was based on the number o f app l i ca t ions tha t
a re success fu l . The respondents had to base the i r ra te o f
success ou t o f 10 app l i ca t ions . The lowest and h ighes t
numbers we re two and seven, respect i ve ly . A success ra te o f
f our ou t o f 10 was the most f requent answer g i ven . Th is
con f i rms tha t the re i s a low success ra te in SMEs be ing
g ran ted loans by ven tu re cap i ta l p rov iders .
5.3 .10 Forms of secur i ty
The las t sec t ion o f the quest ionna i re requested respondents to
rank the i r mos t p re fe r red fo rms o f secu r i t y o r co l la te ra l . The
resu l ts ind ica te tha t the most p re fe r red fo rms o f secur i t y a re :
Owner ’s house , and
Su re ty .
The l eas t p re fe r red a re :
O rd ina ry shares ,
P re fe rence sha res , and

136
Debt .
Fo rms o f secur i t y tha t rece ived an ave rage rank ing were car ,
equ ipmen t and insurance po l i c ies (see Quest ion 2 .22 ) .
5.4 COMP ARISON OF MANAGE MENT ACCOUNTING SKIL LS
Tab le 5 .5 be low compares the responses o f SMEs and ven tu re
cap i ta l i s t s w i th rega rd to managemen t accoun t ing sk i l l s .
Tab le 5 .6 : Compar ison o f management account ing sk i l ls
SMEs % Venture capital
providers
%
Bookkeeping 62.00 Bookkeeping 66.67
Product costing 45.33 Product costing 80.00
Budgeting 48.66 Budgeting 70.00
Preparing sales and financial
projections
8.67 Preparing sales and
financial projections
46.67
Inventory management 28.67 Inventory management 76.67
Break-even analysis 9.33 Calculation of break-
even point
36.67
Cash flow management 41.33 Management of cash
flow
83.33
Identification, classification and
measurement of overheads
5.33 Analysis, identification
or awareness of
overheads
23.33
The pe rcen tages fo r management accoun t ing sk i l l s possessed
by SMEs a re based on the responses o f 150 responden ts .
Those fo r ven tu re cap i ta l p rov ide rs a re based on fac to rs g i ven
the h ighes t rank o f 5 , wh ich the to ta l o f 30 (ven tu re cap i ta l

137
prov iders ) responden ts con f i rmed were ve ry impor tan t o r most
l i ke l y to in f luence the dec is ion to gran t a loan to app l i can ts .
5.5 AN ALYSIS OF THE G APS IN MANAGEMENT
ACCOUNTING SKILLS
The ma in pu rpose o f th is s tudy was to de te rmine the gap i n
managemen t accoun t ing sk i l l s requ i red by ven tu re cap i ta l
p rov iders and those possessed by SME ope ra to rs in the c ra f t
i ndus t ry . On ly sk i l l s tha t a re app l icab le to each g roup o f
respondents have been used to compare the pe rcen tages
based on the to ta l numbe r o f responden ts .
5.5 .1 Bookkeeping
A to ta l o f 62 ,00% o f the SME respondents ind ica ted tha t they
had acqu i red bookkeep ing sk i l l s be fo re they dec ided to s ta r t an
SME in the c ra f t indus t ry . Ven tu re cap i ta l i s t responden ts
(66 ,67%) fe l t tha t bookkeep ing wa s most l i ke l y t o in f luence a
dec is ion to g ran t an app l i can t a loan . The gap wi th rega rd to
bookkeep ing i s low . Howeve r , based on the fac t tha t most o f
the SME ope ra to r s sa id tha t t h i s was a sk i l l they had a t a
pe rsona l leve l and tha t they had neve r rece ive d any fo rma l
t ra in ing, th i s w i l l a f f ec t the i r success ra te in ge t t ing loans f rom
ven tu re cap i ta l p rov iders .
5.5 .2 Product cos t ing
P roduct cos t ing inco rpo ra tes a l l t h ree e lements o f cos ts (d i rec t
mate r ia ls , d i rec t l abou r and overheads ) . Peop le w i thou t the
ab i l i t y to ca lcu la te p roduct cos t means tha t the i r bus inesses

138
may e i the r unde r - o r ove r -es t ima te cos ts , lead ing to over - o r
unde r -p r ic ing o f p roducts . Of the 150 SME respondents ,
45 ,33% repo r ted tha t they were ab le to cos t the i r p roducts
w i thou t any p rob lems, wh i le 80 , 00% o f the ven tu re cap i ta l
p rov iders ranked p roduct cos t ing a t 5 , mean ing tha t i t was ve ry
l i ke l y to in f luence the i r dec is ion to g ran t a loan . The b ig gap is
an ind ica t ion tha t the re is a shor tage o f sk i l l s in te rms o f
p roduct cos t ing.
5.5 .3 Budget ing
O f the 150 SME responden ts , 48 , 67% s ta ted tha t t hey were
ab le to p repa re budgets , wh i le 70 , 00% o f the ven tu re cap i ta l
p rov iders sa id tha t budge t ing was mos t l i ke l y to in f luence the i r
dec is ion to g ran t l oans to app l i can ts . The re is thus a w ide gap
wh ich m igh t mean tha t w i thou t budget ing sk i l l s app l ican ts m igh t
no t succeed in secur ing loans o r ope ra t ing a bus iness
success fu l l y .
5.5 .4 Prepar ing sa les and f inancia l project ions
Emerg ing and ex is t ing compan ies a l ike mus t p rov ide sa les and
f inanc ia l p ro jec t ions when f i r s t l odg ing an app l ica t ion fo r f unds
w i th f inanc ia l p rov ide rs . On ly 8 , 67% o f the SME responden ts
ind ica ted tha t t hey had th is sk i l l be fo re dec id ing to s ta r t a
bus iness . Of the cap i ta l p rov ide rs , 46 , 67% con f i rmed tha t th i s
was one o f t he most l i ke l y sk i l l s tha t app l ican ts had to possess
be fo re an app l i ca t ion fo r f unds wi th va r ious f inanc ia l p rov iders
wou ld be success fu l . A w ide gap cou ld mean tha t tha t peop le
may no t succeed in ge t t i ng funds wi thou t be ing ab le to do sa les
and f inanc ia l p ro jec t ions .

139
5.5 .5 Inventory management
O f the to ta l o f 150 SME responden ts , 28 , 67% asser ted tha t
they had acqu i red th i s sk i l l be fo re dec id ing to s ta r t a bus iness .
Of the ven tu re cap i ta l p rov iders , 76 , 67% ind ica ted tha t
i nven to ry management wa s mos t l i ke l y to in f luence the dec is ion
to g ran t a loan to the app l ican t . The ga p wi th rega rd to
inven to ry management i s qu i te w ide . Th is con f i rms tha t the re is
a sho r tage o f sk i l l s i n inven to ry managemen t . Inven to ry i s a
revenue -gene ra t ing asse t o f t he co mpany. P rope r management
o f th i s asse t is ve ry impor tan t . Keep ing inven to ry tha t i s no t
mov ing means keep ing an asse t tha t i s accumu la t ing cos ts and
no t revenue . The re fo re i t i s v i ta l tha t the sk i l l o f the
en t repreneu r be up to sc ra tch in te rms o f con t ro l l i ng inven to ry .
5.5 .6 Break-even ana lys is
On ly 9 ,33% o f the SME respondents con f i rmed tha t they had
knowledge o f b reak -even ana lys is , wh i le 36 , 67% o f the ven tu re
cap i ta l p rov ide rs con f i rmed tha t the ab i l i t y to ca lcu la te and
app ly b reak -even ana lys is was mos t l i ke l y to in f luence a
dec is ion to g ran t the app l i can t a loan . The gap be tween the two
g roups o f responden ts is qu i te h igh , wh ich means tha t on ly a
few o f the SMEs know how to ca lcu la te o r ana lyse the b reak -
even po in t .
5.5 .7 Cash f low management
Cash f low management mon i to rs the cash f low o f the bus iness ,
bu t on ly 41 ,33% o f t he SMEs ind ica ted tha t they had acqu i red
th i s sk i l l be fo re dec id ing to s ta r t a bus iness . Some o f t hese

140
SMEs con f i rmed tha t they d id no t have any fo rma l t ra in ing in
cash f low management . On the o ther hand , 83 , 33% o f the
ven tu re cap i ta l responden ts sa id tha t cash f low management
was mos t l i ke l y to i n f luence the dec is ion to g ran t a loan . The
gap in te rms o f the ab i l i t y to pe r form cash f low managemen t i s
qu i te h igh . Th is i s a s ign i f i can t gap .
5.5 .8 Ident i f ica t ion , c lass i f ica t ion and measurement o f
overheads
Ove rheads a re the th i rd e lement o f cos t ing . A pe rson who
ope ra tes a bus iness w i thou t p rope r t ra in ing fa i l s to recogn ise
th i s impor tan t e lement in the p rocess o f cos t ing p ro ducts . On ly
5 .33% o f the SME respondents c la imed tha t they were aware o f
ove rheads and cou ld measu re them wi thou t any p rob lem. Of the
ven tu re cap i ta l p rov ide rs , 23 , 33% s ta ted tha t ove rheads were
mos t l i ke l y t o in f luence a dec is ion to g ran t an app l i can t a l oan .
The gap be tween the two g roups o f respondents i s w ide . Th is
gap i s w ide cons ide r ing the fac t tha t on ly 5 .33% o f the SMEs
repo r ted hav ing th is sk i l l .
The management account ing sk i l l s d i scussed above were no t
the on ly sk i l l s assessed. The o ther sk i l l s tha t we re no t ranked
above 3 a re d iscussed be low.
5.6 OTHER MAN AGEMENT ACCOUNTING SKILLS ASSESSED
Cos t con t ro l , ab i l i t y to ra ise cap i ta l and o ther management
accoun t ing sk i l l s we re inc luded in the quest ionna i re . Mos t o f
the fo l lowing sk i l l s we re ranked l ess than 3 as compared to the
managemen t accoun t ing sk i l l s i nc luded in tab le 5 .4 above .

141
5.6 .1 Cost control
A to ta l o f 45 .33% o f the SME respondents ind ica ted tha t they
cou ld con t ro l the i r p roduct ion cos ts . Th is percen tage is ve ry
good cons ide r ing the fac t tha t 45 .33% o f ven tu re cap i ta l
p rov iders ind ica ted tha t th i s sk i l l was impor tan t . Th is
knowledge i s very impor tan t because i t w i l l inc rease the
chances o f SMEs ge t t ing funds f rom cap i ta l p rov ide rs .
5.6 .2 Ra is ing capi ta l
The ab i l i t y to ra ise cap i ta l was inc luded unde r management
accoun t ing sk i l l s because any pe rson app ly ing fo r cap i ta l who
knows the t ypes o f sou rces o f cap i ta l must know the
advantages and d isadvan tages o f t hose sou rces o f cap i ta l .
Knowledge o f the sou rces o f f inance can be enhanced by tak ing
some commerc ia l sub jec ts o r a t tend ing some workshops. Some
37 .33% SME respondents ind ica ted tha t they knew how to ra ise
cap i ta l . Th is pe rcen tage i s good cons id e r ing the fac t tha t most
respondents in the c ra f t indus t ry had no t s tud ied f inanc ia l
re la ted sub jec ts . Ra is ing cap i ta l w i l l the re fo re increase the
app l ican ts ’ chances to ob ta in fund ing .
5.6 .3 S tandard cost ing
On ly f i ve o f the to ta l number o f SME respondents knew what
s tanda rd cos t ing en ta i led . Th is number i s ve ry low. However ,
cons ide r ing tha t mos t respon dents had no f inanc ia l educa t ion ,
the number is no t tha t d is tu rb ing because in mos t cases on ly
b ig compan ies make use o f s tanda rd cos t ing.

142
5.6 .4 Ac t iv i ty -based cost ing
Jus t l i ke s tanda rd cos t ing , any person wi thou t f inanc ia l
educa t ion w i l l no t know what ac t i v i t y -based cos t ing en ta i ls .
On ly f i ve o f the SME responden ts knew wha t i t en ta i led .
5.6 .5 L i fe cyc le cos t ing
On ly th ree o f the to ta l samp le o f SME respondents knew what
l i f e cyc le cos t ing en ta i led . L i f e cyc le cos t ing i s one o f the most
impor tan t management acco un t ing concepts . I t enab les the
owner o f the bus iness to know what and when consumers need
a p roduct . The owner w i l l be ab le to de te rm ine whe the r t he
p roduct i s reach ing the marke t o r no t . W i thou t th is knowledge,
the en t rep reneu r may keep a p roduc t i n the bus iness fo r a long
t ime when th is shou ld no t in f ac t be done. There fo re i t i s
adv isab le fo r bus iness owners to have a t leas t an idea o f what
i t en ta i l s .
5.6 .6 Var iance analys is
Va r iance ana lys is i s cons ide red one o f the mos t impor tan t
managemen t accoun t ing sk i l l s . On ly s i x o f the to ta l SME
popu la t ion were aware o f what va r iance ana lys i s was and cou ld
pe r fo rm such an ana lys is . These low ra te o f SME respondents
ind ica tes tha t the re is a shor tage o f sk i l l s i n th is a rea and
there fo re more t ra in ing in i t shou ld be encouraged. W i thou t
p rope r t ra in ing , mos t SMEs wi l l reduce the i r scoreca rd i f
va r iance ana lys i s i s one o f the requ i rements fo r f und ing .

143
5.6 .7 Abi l i ty to ca lcu la te prof i ts
Any bus iness person who canno t ca lcu la te the i r bus iness ’s
pro f i t i s des t ined fo r f a i lu re . Of the to ta l popu la t ion o f ven tu re
cap i ta l p rov ide rs , 23 p rov iders recommended tha t a l l bus iness
owners shou ld be ab le to ca lcu la te p ro f i t s . Of a l l the SMEs
surveyed 93 cou ld do bookkeep ing . Tha t i s an ind ica t ion tha t
some SME ope ra to rs a re ab le to ca lcu la te p ro f i t s . Ab i l i t y to
ca lcu la te p ro f i t s on i t s own wi l l a t leas t inc rease the chances o f
SMEs ge t t ing f inance .
5.7 SUMMARY
Th is chap te r p resen ted the resu l t s o f the resea rch ins t rument .
A to ta l o f 150 quest ionna i res were rece ived back f rom SMEs,
and a to ta l o f 30 quest ionna i res we re used to co l lec t da ta f rom
ven tu re cap i ta l p rov iders . The co l lec t ion o f da ta took abou t s i x
to seven mon ths .
The resu l t s f rom the survey amongs t SMEs in the c ra f t indus t ry
we re p resen ted f i r s t . The respondents ind ica te tha t the ma jo r i t y
o f the SMEs su rveyed opera te d as so le ownersh ips , i .e . 107
respondents ou t o f a to ta l o f 150 . The resu l ts a lso ind ica te d
tha t the re i s a gap in management accoun t ing sk i l l s . Most o f
the respondents con f i rmed tha t they had never a t tended any
fo rma l t ra in ing in the ma jo r i t y o f accoun t ing sk i l l s needed fo r
the success fu l ope ra t ion o f a bus iness .
The second phase o f the su rvey was conducted to co l lec t da ta
f rom ven tu re cap i ta l p rov ide rs . These respondents con f i rmed

144
tha t the possess ion o f management account ing sk i l l s do have
an in f luence on the dec is ion to g ran t an app l ican t a loan .

145
CHAPTER 6
CONCLUSION AND RECOM MENDATIONS
6.1 INTRODUCTION
In t h i s chap te r a summary o f the s tudy f i nd ings , the
conc lus ions , imp l ica t ions and recommendat ions a re p resen ted .
Chapte r 1 iden t i f ied the ma in pu rpose o f th i s s tudy as
de te rm in ing the gap in m anagement account ing sk i l l s requ i red
by ven tu re cap i ta l i s t s and those possessed by SME opera to rs
in the c ra f t indus t ry . The s tudy fu r ther iden t i f ied the fo l lowing
ob jec t i ves :
To iden t i f y managemen t account ing sk i l l s ven tu re
cap i ta l i s t s expect f rom sma l l bus iness owners be fo re
inves tmen ts a re made.
To asce r ta in the ava i lab i l i t y o f su f f i c ien t management
accoun t ing sk i l l s wh ich en t rep reneu rs mus t have be fo re
they approach ven tu re cap i ta l i s ts fo r cap i ta l f und ing.
To compare the requ i rements o f ven tu re cap i ta l i s t s and
the knowledge o f SMEs in management account ing .
A summary o f the l i te ra tu re rev iew wi l l be p resen ted f i rs t ,
f o l lowed by a summary o f t he f i nd ings , and then the ove ra l l
conc lus ion , suggest ions and the recommendat ions f o r f u r the r
research wi l l con c lude the chapte r .

146
6.2 SUMMARY OF L ITERATUR E REVIEW AND EMPIRIC AL
STUDY
The s tudy made use o f two app roaches , t ha t i s a l i te ra tu re
rev iew and an emp i r i ca l s tudy . A summary o f bo th app roaches
i s p resen ted be low.
6.2 .1 L i terature rev iew
In the l i te ra tu re rev iew the theo re t ica l background o f the s tudy
was p rov ided . Chap te r 2 and chap te r 3 we re used fo r th is
pu rpose . The ma in sou rces o f i n fo rma t ion used fo r t he
l i te ra tu re rev iew were books , a r t i c les , jou rna ls , pe r iod ica l
repo r t s , theses and d isse r ta t io ns .
In chap te r 2 the s tudy focused on the cu r ren t s i tua t ion w i th
rega rd to the ven tu re cap i ta l marke t and SMEs. The s tudy a lso
made re fe rence to sou rces o f ven tu re cap i ta l ava i lab le ,
d i f f e ren t ven tu re cap i ta l p rov iders and c r i t i ca l success fac to rs
fo r SMEs. In add i t ion , the d i f f i cu l t ies expe r ienced by loan
app l ican ts , app roaches p re fe r red by cap i ta l p rov ide rs when
loan app l i can ts app ly fo r loans and min imum requ i rements tha t
need to be me t by app l i can ts be fo re loans a re g ran ted were
a lso h igh l igh ted .
In chap te r 3 the s tudy focused more on management
accoun t ing sk i l l s requ i red by ven tu re cap i ta l p rov ide rs . Apa r t
f rom the management account ing sk i l l s requ i red by ven tu re
cap i ta l i s t s , re fe rence was made to managemen t sho r t comings
and va r ious managemen t accoun t ing sk i l l s necessary to secure
a loan .

147
In bo th chap te r 2 and 3 t he researcher a l so found i t f i t t i ng to
ment ion the t ype o f f inanc ia l in fo rma t ion most wanted by
ven tu re cap i ta l i s ts , the p rocedure and p rocess o f acqu i r ing
ven tu re cap i ta l and the success ra te o f app l ican ts in the pas t .
6.2 .2 Empir ica l s tudy
Emp i r i ca l resea rch was conducted to de te rmine the gap
be tween management accoun t ing sk i l l s requ i red by ven tu re
cap i ta l i s t s and those possessed by SME ope ra to rs in the c ra f t
i ndus t ry . The resea rch me thodo logy used was desc r ibed in
chap te r 4 . Quest ionna i res we re used to co l lec t the da ta fo r
bo th t ypes o f respondents . The resu l ts f rom the survey were
in te rp re ted and an a lysed in chap te r 5 .
A number o f the managemen t accoun t ing sk i l l s we re p resen ted
to responden ts on the quest ionna i re . SMEs were requested to
choose the sk i l l s they possessed be fo re they s ta r ted the i r
bus inesses and ven tu re cap i ta l i s t s we re requested to ind ica te
those they cons ide red impor tan t .
A number o f managemen t account ing sk i l l s tha t we re p resen ted
to the respondents a re d iscussed be low, toge the r w i th the i r
imp l i ca t ions . Most o f the sk i l l s d iscussed b e low a re p resen ted
in tab le 5 .4 o f chap te r 5 . Th e reason fo r choos ing these sk i l l s
i s t ha t they a re s im i la r to those p resen ted to ven tu re cap i ta l
p rov iders . These sk i l l s we re compared in chap te r 5 and the
gaps fo r each were iden t i f i ed and measu red .

148
6.2 .2 .1 Bookkeeping
Bookkeep ing i s i nc luded in the quest ionna i re and was
p resen ted to bo th the SMEs and ven tu re cap i ta l p rov ide rs as an
op t ion fo r se lec t ion . A to ta l o f 62 .00% o f t he SME respondents
who answered th is ques t ion ind ica ted tha t t hey knew what
bookkeep ing was a l l abou t even though they have ne ve r
a t tended any fo rma l t ra in ing o r a wo rkshop. The reason fo r no
fo rma l t ra in ing was tha t the i r educa t ion a l background was no t
bus iness - re la ted . On the o ther hand , 66 .67% o f the ven tu re
cap i ta l p rov ide rs who answered a s im i la r ques t ion ind ica ted
tha t bookkeep ing was most l i ke l y to in f luence a dec is ion to
g ran t SMEs a loan . By compar ing the two answers , the answers
i l lus t ra te a sma l l gap .
The imp l ica t ion o f these f ind ings fo r SMEs is t ha t the i r chances
o f ge t t ing loans o r any fo rm o f f und ing f rom ven tu re c ap i ta l i s ts
a re ve ry s l im wi thou t knowledge o f bookkeep ing.
Mos t o f the SMEs in the c ra f t indus t ry ope ra te so le ownersh ips
and do no t make use o f p ro fess iona l accoun tan ts o r even
bookkeepe rs . The re fo re i t i s adv isab le fo r them to have
knowledge o f bookkee p ing be fore app ly ing fo r f und ing .
Howeve r , the gap be tween the two g roups o f respondents in
th i s a rea i s sma l l , so i t can the re fo re be deduced tha t SMEs
have th i s sk i l l to ope ra te the i r bus inesses .
149
6.2 .2 .2 Cash f low management
Cash f low management is one o f the management accoun t ing
sk i l l s p resen ted to bo th SMEs and ven tu re cap i ta l p rov ide rs . A
to ta l o f 83 .33% o f ven tu re cap i ta l i s t s con f i rmed tha t
managemen t o f cash was most l i ke l y t o in f luence the i r dec is ion
to g ran t a loan . Of the SME respondents on ly 41 .33% s ta ted
tha t t hey possessed th is sk i l l , a l though a t a pe rsona l and no t
bus iness (expe r t ) l eve l . Th is i s because the i r educa t ion a l
background was no t bus iness - re la ted and they ha d no t rece ived
any fo rm o f t ra in ing in i t .
Th is means tha t the chanc es o f SMEs ob ta in ing any fo rm o f
l oan f rom ven tu re cap i ta l i s ts a re ve ry l ow. The gap in th is sk i l l
i s qu i te h igh , and a lmost 50% o f the ven tu re cap i ta l p rov ide rs
requ i red SME ope ra to rs to have th i s sk i l l . The re fo re , more
fo rma l t ra in ing in cash f low manage ment is needed fo r
ope ra to rs to acqu i re funds and to inc rease the gove rnment ’ s
c rea t ion ra te o f SMEs.
6.2 .2 .3 Product cos t ing
P roduct cos t ing is one o f the func t ions SME ope ra to r s per fo rm
da i l y in the c ra f t indus t ry . A lmost 45 .33% o f the SME ope ra to rs
who answered th i s ques t ion ind ica ted tha t they knew how to
cos t the i r p roducts . Some who had no commerc ia l educa t ion
repo r ted tha t they had a t tended some workshops to enhance
the i r knowledge and sk i l l w i th rega rd to p roduct cos t ing .
Howeve r , in look ing a t th e number o f responden ts who
answered th is ques t ion , i t i s qu i te c lear tha t more t ra in ing is
needed in p roduct cos t ing . A to ta l o f 80% o f the ven tu re cap i ta l

150
prov iders con f i rmed tha t knowledge o f p roduct cos t ing is very
impor tan t . Th is imp l ies tha t w i thou t th is sk i l l , SMEs wi l l mos t
l i ke l y no t be g ran ted loans , un less the y use a qua l i f ied
managemen t accoun tan t .
6.2 .2 .4 Budget ing
Budget ing i s an impor tan t e lemen t o f any bus iness and o f any
bus iness p lan tha t i s t o be p resen ted to the ven tu re cap i ta l
p rov ide r (Fa r row 1994 :287 -288 ) . Th is managemen t accoun t ing
techn ique i s h igh ly recommended by ven tu re cap i ta l p ro v iders ,
w i th a lmost 70% o f t he respondents ind ica t ing tha t i t w i l l most
l i ke l y in f luence the i r dec is ion to g ran t loans to SME ope ra to rs .
On ly 48 .66% o f the SME opera to rs s ta ted tha t they knew how
to p repa re a budge t . Cons ide r ing the number o f responden ts
w i th bus iness - re la ted educa t ion , i t i s ev iden t tha t t he re i s a
need fo r f u r the r t ra in ing to c lose the gap . The imp l i ca t ion o f
the gap in th i s sk i l l m eans tha t SME ope ra to rs w i thou t budget
p repa ra t ion sk i l l s a re no t l i ke ly t o rece ive fund ing f rom
p rov iders .
6.2 .2 .5 Preparat ion o f sa les and f inancia l pro jec t ions
A s ta tement o f sa les and f inanc ia l p ro jec t ions , in o ther wo rds
budget ing, f o rms an impor tan t pa r t o f the bus iness p lan
(Far row 1994:290 -291 ) . The re fo re inaccu ra te f i gu res mean tha t
an app l i ca t ion fo r f unds canno t be success fu l . On ly 8 .67% o f
the SME opera to r s asse r ted tha t t hey knew how to p repa re
sa les and f inanc ia l p ro jec t ions . Of the ven tu re ca p i ta l p rov iders
46 .47% s ta ted tha t t h i s sk i l l was ve ry impor tan t and was mos t
l i ke l y to in f luence the i r dec is ion to g ran t a loan .

151
The gap be tween the two g roups o f responden ts i s qu i te la rge .
Th is gap imp l ies tha t the SMEs ’ chances o f ge t t ing f i nance a re
ve ry s l im . Th is a lso means tha t f u r ther t ra in ing has to be done
to i nc rease the SMEs’ chances, un less they dec ide to use
qua l i f ied accountan ts to p repa re the p ro jec t ions on the i r
beha l f .
6.2 .2 .6 Inventory management
Inven to ry i s an income -gene ra t ing asse t f o r any fo rm o f
bus iness in any sec to r o f the economy. Any bus iness owner
who can per fo rm inven to ry management du t ies on h is /he r own
can be su re tha t mos t ven tu re cap i ta l p rov ide rs w i l l be w i l l ing
to do bus iness w i th tha t owner . A lmos t 76 .67% o f the ven tu re
cap i ta l p rov ide rs repo r ted tha t inven to ry management was
h igh ly recommended and most l i ke l y to in f luence the i r dec is ion
to g ran t a loan . On ly 28 .67% o f the SME ope ra to rs con f i rmed
tha t they knew wha t inven to ry management en ta i l ed . The gap
be tween the respondent g roups is ve ry la rge and i t imp l ies tha t
the chances o f ob ta in ing funds wi thou t th is sk i l l a re ve ry low.
6.2 .2 .7 Break -even analys is
A lmos t 90 .67% o f the SME ope ra to rs ind ica ted tha t they had
neve r hea rd o f b reak -even ana lys is . On ly 9 .33% o f the
respondents knew a l i t t le about i t . Th is pe rcen tage i s ve ry
sma l l compared to the 36 .67% o f ven tu re cap i ta l p rov ide rs who
recommended the use o f b reak -even ana lys i s very h igh ly .
The gap imp l ies tha t the re is a sho r tage o f t ra in ing in th is
managemen t accoun t ing sk i l l and a lso tha t the chances o f

152
ob ta in ing f inance a re ve ry low i f SME ope ra to rs do no t know
how to do b reak -even ana lys is . T ra in ing is needed fo r
ope ra to rs to enhance the i r sk i l l s and to inc rease the i r chances
o f ge t t ing fund ing f rom f inanc ia l p rov iders .
6.2 .2 .8 Ident i f i cat ion , c l ass i f ica t ion and measurement o f
overheads
Ove rheads a re the th i rd e lemen t o f cos t ing a f te r mater ia l and
labou r cos t and fo rm pa r t o f a p roduct ’ s cos t even though i t i s
rega rded as a seconda ry cos t (supp lemen tary cos t ) . Bu t f o r
peop le w i thou t a management account ing ba ckground , i t i s
qu i te d i f f i cu l t to iden t i f y and recogn ise non -p roduct ion
ove rheads when cos t ing the i r p roduc ts . On ly 5 .33% o f the SME
ope ra to rs con f i rmed tha t they knew wha t an ove rhead was,
wh i le 23 .33% o f the ven tu re cap i ta l p rov id e rs con f i rmed tha t
the a l loca t ion , iden t i f i ca t i on and measurement o f ove rheads
was ve ry impor tan t .
The gap be tween the two g roups o f respondents i s l a rge ,
cons ide r ing the low pe rcen tage o f SME respondents who knew
what an overhead was. The imp l ica t ion o f t h i s low pe rcen tage
i s tha t the number o f SMEs tha t can be cons ide red fo r f und ing
wi l l be low i f ove rheads a re inc luded in the assessmen t
c r i te r ia .

153
6.3 CONCLUSIONS
The ma jo r conc lus ions d rawn f rom th i s s tudy a re summar ised
as fo l lows:
The ana lys i s o f the t ypes o f sk i l l s tha t SME opera to rs
possess and those tha t ven tu re cap i ta l p rov ide rs requ i re s
ind ica tes tha t the re a re bo th b ig and sma l l gaps in the
knowledge and sk i l l s leve ls compared . The resu l ts show
tha t there i s a need fo r t ra in ing o f SME ope ra to r s in
managemen t accoun t ing sk i l l s .
The lack o f some o f the management account ing sk i l l s
was h igh l igh ted by mos t o f the m ic ro - lende rs who
pa r t i c ipa ted in th is su rvey as one o f the reasons why
fund ing in mos t cases was no t g ran ted . Most f inanc ia l
p rov iders use a sco recard to assess loan app l ica t ions .
The use o f a sco recard means tha t a l l the management
accoun t ing sk i l l s i nc luded on th e scoreca rd a re a l loca ted
a we igh t . I f most o f the sk i l l s a re ranked low because the
app l ican t does no t have them, then on ave rage th e
app l ican ts w i l l have a low sco re . I f an app l ican t has a low
sco re , the app l i ca t ion w i l l be unsuccess fu l . The re fo re i t
wou ld be adv isab le fo r ven tu re cap i ta l i s t s to inc lude the
m in imum o r bas ic sk i l l s on the face o f the i r app l i ca t ion
fo rm used in the asses sment o f loan app l ica t ion s . Loan
app l ican ts w i l l then be ab le to measu re the i r success ra te
even be fo re f ina l ou tcome o f the app l ica t ion i s re leased .
In add i t ion to the sco reca rd , bus iness t ype o r economic
sec to r f o rms a ma jo r pa r t o f the se lec t ion c r i te r ia .
The re fo re i t wou ld be adv isab le fo r any app l i can t to know
wh ich se lec t ion c r i te r ia the ven tu re cap i ta l p rov ide rs use
in assess ing the i r loan app l ica t ions . By do ing so the

154
app l ican ts can assess themse lves be fo rehand and
de te rm ine the i r chances o f success o r f a i lu re . I t w i l l a lso
he lp them in se lec t ing the re levan t f unde r .
S ince mos t SME ope ra to rs have some o f the sk i l l s
requ i red , ven tu re cap i ta l p rov ide rs shou ld de te rmine the
m in imum sk i l l s tha t they cons id e r impor tan t . There fo re i f
an app l i can t can p rove tha t they have an idea o f what tha t
managemen t accoun t ing sk i l l en ta i ls in p rac t i ce , t hen the
cap i ta l p rov ide r shou ld a t leas t g i ve the app l ican t a
chance . The y cou ld a lso reduce the amoun t o f the loan
ra the r than re jec t ing the app l i ca t ion ou t r igh t .
The re a re app l i can ts who have a good t rack record in
ope ra t ing the i r bus inesses . Some ven tu re cap i ta l
p rov iders surveyed ind ica ted tha t based on these t rack
records and the m in imum sk i l l s tha t the SME owners
possess , they wou ld be wi l l i ng to he lp such app l ican ts .
Th is techn ica l l y means tha t app l i can ts shou ld se t up the i r
bus iness be fo re they app ly fo r a loan . Some o f the
ven tu re cap i ta l p rov iders ind ica ted tha t they were w i l l i ng
to do bus iness w i th any reg is te red bus iness . Some o f the
app l ican ts a l so men t ioned tha t the reason why they were
no t g i ven funds was tha t they were ope ra t ing un reg is te red
bus inesses .
6.4 RECOMMENDATIONS
Mos t o f the ven tu re cap i ta l p rov iders h igh ly recommended
mos t , i f no t a l l , o f the management account ing sk i l l s
ment ioned in the quest ionna i re . I n o rde r to g i ve the lo an
app l ican ts a chance o f succeed ing in bus iness , i t i s

155
adv isab le fo r ven tu re cap i ta l p rov ide rs to pub l ish the most
and less impor tan t sk i l l s requ i red .
S ince a sco recard is used t o assess app l ican ts , ven tu re
cap i ta l p rov ide rs shou ld adv ise app l ican ts on the t ypes o f
sk i l l s they va lue be fo re app l ica t ions can be made fo r
f und ing .
The app l i ca t ion fo rms fo r f und ing shou ld l i s t the t ypes o f
the bus inesses tha t ven tu re cap i ta l i s ts a re mo st l i ke l y to
f und . Th is w i l l save app l ican ts hav ing to go th rough the
who le app l ica t ion p rocess on ly to be re jec ted because o f
the fo rm o f bus iness they have .
The success ra te o f app l i can ts in the pas t shou ld be
cons ide red ra the r t han on ly the sk i l l s . The r e a re peop le
who have o the r f o rms o f bus iness in ope ra t ion . These
peop le have p roven tha t they can opera te a bus iness
i r respect i ve o f the sk i l l s they have .
Mento rs : P rev ious success fu l app l ican ts can be
in t roduced as mentors on how to p repa re an app l ica t io n .
6.5 SUGGESTIONS FOR FURT HER RESE ARCH
The in i t ia l ma in ob jec t i ve o f th i s s tudy was to de te rmine the
gap in managemen t accoun t ing sk i l l s be tween SME ope ra to rs
and ven tu re cap i ta l p rov ide rs in the c ra f t indus t ry . The s tudy
has iden t i f ied spec i f i c gaps i n mana gemen t accoun t ing sk i l l s . A
fu tu re need is to de te rm ine , among o ther t h ings , s tanda rd ised
c r i te r ia wh ich ven tu re cap i ta l p rov ide rs can use spec i f i ca l l y to
assess o the r SMEs and no t on ly t hose invo lved in the c ra f t
i ndus t ry . The same resea rch o f the s im i la r t ype can be car r ied
ou t i n o the r indus t r ies , w i th the a im o f deve lop ing a mode l tha t
cou ld cove r a l l sec to rs o f the economy.

156
An imp lementa t ion po l icy o f these recommendat ions i s an i ssue
tha t w i l l a l so need to be add ressed in the fu tu re . Some
research has been done on the same sec to r in the pas t bu t
some o f the recommendat ions were no t imp lemen ted . The
reason appea rs to be tha t t he p r i va te and pub l ic sec to rs seem
to have d i f f e ren t ob jec t i ves when lend ing cap i ta l .
Educa t iona l ins t i tu t ions can use th e cap i ta l p rov ide rs ’
sco recard as gu ide l ine to deve lop in fo rma l sho r t l ea rn ing
managemen t accoun t ing p rogrammes fo r SME owners o r
managers .

157
BIBLIOGRAPHY Acs , ZJ & Aud re tsch , DB . 1990. Innova t ion & sma l l f i rms . Cambr idge , Massachuse t t s : MIT P ress . A f r i can Merchant Bank. n .d . Targe ts [On l ine ] . Ava i lab le :h t tp : / /www.amb.co .za /PDF/0579_AMB_News le t te r_PRINT.PDF . (Accessed 20 Apr i l 2007 ) . Agreb i , M. 2009. F inanc ing SMEs[On l ine ] . Ava i lab le :h t tp : / /www.oecdobse rve r .o rg /news/ fu l l s to ry .php /a id/3102/F inanc ing SMEs.h tm . (Accessed 5 December 2009 ) . A ld r ich , H & Z immer , C. 1985 . Ent repreneu rsh ip th rough soc ia l ne tworks . In DL Sexton & RW Smi lo r (eds ) . The ar t and sc ience o f en t rep reneursh ip . New York : Ba l l inger . A l len , T & Thomas , A (eds ) . 2000 . Pover t y and deve lopment i n to the 21 s t cen tu ry . New York : Oxfo rd Un ive rs i t y Press . A l lon , J . 2001 . Turn you r pass ion in to p ro f i t s – How to s ta r t the bus iness o f you r d reams . New York : Hea r ts Books . A rg i l . 2006 . Ph i losophy [On l ine ] . Ava i lab le : h t tp : / /www.a rg i l . com/ph i losophy . (Accessed 15 August 2007 ) . Au reos Cap i ta l L im i ted . 2005 . Por t fo l io : Dea l t ype and sec to r expo r t cap i ta l : Por t fo l io compan ie s [On l ine ] . Ava i lab le : h t tp : / /www.au reos .com/abou t / inves tment_ove rv iew007 (Accessed 12 Ju ly 2005 ) . Aureos Cap i ta l L im i ted . 2006 . Inves tment in fo rmat ion [On l ine ] . Ava i lab le : h t tp : / /www.au reos .com/ reg ion /a f r i ca / inves tments . (Accessed 14 August 2007) . Au themet , JP & Roe, CW . 1992 . Unde rs tand ing a bus iness s t ra tegy : The key to success fu l sma l l bus iness lend ing . The Jou rna l o f Commerc ia l Lend ing , 74 (5 ) :33 -40 . Ba r r ickman, JR & Charges , MJ . 1995 . Sma l l bus iness lend ing: W i l l we b low i t aga in? The Jou rna l o f Commerc ia l Lend ing , 78 (3 ) :12 -22 . Ba r row, C . 2003 . The comp le te sma l l bus iness gu ide - A sou rcebook fo r new and sma l l bus iness . Oxfo rd : Caps tone . Ba tes , T . 1990 . En t repreneu r ia l human cap i ta l inpu ts and sma l l bus iness longev i t y . Rev iew o f Economics and Sta t is t i cs , 74 (4 ) :551 -559 .

158
Bates , T . 1997 . F inanc ing sma l l bus iness c rea t ion : The case o f Ch inese and Ko rean immigran t en t repreneu rs . Jou rna l o f Bus iness Ventu r ing , 12 (1 ) :109 -110 . Ba ty, GB. 1981 . Ent repreneu rsh ip fo r t he e igh t ies . V i rg in ia : Res ton . Bbenke le , EK. 2007 . An inves t iga t ion o f sma l l bus iness and med ium en te rp r i ses pe rcep t ions towards serv i ces o f fe red by commerc ia l banks in Sou th A f r i ca . Af r i can journa l o f Account ing , Economics , F inance and Bank ing Research ,1 (1 ) :13 -25 Bees ley , M & W i lson , P . 1992. Gove rnment a id to the sma l l f i rms s ince Bo l ton . In J S tanwor th , A W est r ip , D W atk ins & J Lewis e t a l (eds ) . Perspec t i ves on a decade o f sm a l l bus iness research . A lde rsho r t : Gower . Be r ry , A . 2002 . The ro le o f sma l l and med ium en te rp r ises sec to r in La t in Amer ican and s im i la r deve lop ing coun t r ies . Seton Ha l l Jou rna l o f D ip lomacy and In te rna t iona l Re la t ions ,W in te r /Sp r ing 2002:104 -119 [On l ine ] .Ava i lab le : h t tp : / /www.c i rano .qc .ac /EFM10/pd f /p rogramme_en.pd t . (Accessed 10 Janua ry 2011 ) . Bowle r , A & Dawood , MS. 1986 . Ent rep reneu rsh ip and sma l l bus iness management . Cape Town: Nasou . Boyd , N & Voz ik is , G. 1994. The in f l uence o f se l f e f f i cacy on the deve lopment o f en t rep reneur ia l in ten t ions . Ent repreneu rsh ip Theo ry and P rac t ice , 18 :28 -36 . B rau , JC, B rown, RA & Oste ryoung, JS. 2004 . Do ven tu re cap i ta l i s t s add va lue to sma l l manufac tu r ing f i rms? An emp i r i ca l ana lys i s o f ven tu re and non -ven tu re cap i ta l backed in i t ia l pub l ic o f fe r ing . Jou rna l o f Sma l l Bus iness Managemen t , 24 (1 ) :78 -92 . B rown, CM. 1999. Nobody ’s bus iness bu t you r own - A sma l l bus iness s ta r t -up gu ide w i th adv ice f rom today ’s most success fu l young en t repreneu rs . New York : Hyper ion B runo , AV & Tyebee , TT . 1985. En t repreneu r ’ s sea rch fo r cap i ta l . Jou rna l o f Bus iness Ventu r ing , 1(1 ) :61 -71 . Bu lmer , M. 2004 . Quest ionna i res , vo l .1 . London: Sage .

159
Bus iness Day . 2005 . W hy SA ’s sma l l bus inesses s tay tha t way. [On l ine ] . Ava i lab le :h t tp : / /www. t ips .o rg.za / f i les /bd__sma l l_bus iness_ rev iew_ launch_030105 .pd f . (Accessed 20 August 2006) . Bus iness l ink . 2005 . No -nonsense gu ide to sma l l bus iness f inanc ing. [On l ine ] . Ava i lab le : h t tp : / /www.bus iness l ink .gov.uk /F inance_f i les /SBFcomp le te2008 .pd f . (Accessed 11 June 2009 ) . Bus iness Pa r tne rs . 2004 . Making success o f independent en te rp r i se - Key success fac to rs fo r en t r ep reneu rs [On l ine ] . Ava i lab le : (Accessed 20 May 2005 ) . Bus iness Repor t s . 2006 . SMMEs need en t rep reneu r ia l sk i l l s , say banks [On l ine ] . Ava i lab le : h t tp : / /www.myfnb .co .za /news / la tes t -news /smmes -need -en t repreneu r ia l - sk i l l s , - say-banks-%11-09022006 . (Accessed 9 Feb rua ry 2007 ) . But tne r , EH & Rosen, BH. 1988 . Bank loan o f f i ce rs ’ percep t ions o f cha rac te r i s t ics o f men , women and success fu l en t repreneu rs . Jou rna l o f Bus iness Ven tu r ing , 3 (3 ) :249 -258 . Bu t tne r , EH & Rosen, B H. 1989 . Fund ing new bus iness ven tu res , a re dec is ion make rs b iased aga ins t women en t repreneu rs? Jou rna l o f Bus iness Ven tu r ing , 4 (1 ) :249 -250 . BVCA, v ide B r i t i sh Ven tu re Cap i ta l Assoc ia t ion . 2002 . Sma l l bus iness loans [On l ine ] . Ava i lab le : h t tp : / /www.bvca .co .uk /pub l ica t ions /en t repreneu rs . (Accessed 11 June 2007 ) . Bygrave , W D, Hay, M & Peete rs , JB . 1999. The ven tu re cap i ta l handbook . G rea t B r i ta in : F inanc ia l T imes -Pren t i ce Ha l l . Ca ley, K , Cha l l , E , Ch i t ten dam, F & Mason, C. 1992 . Smal l en te rp r i se deve lopmen t - Po l i cy and p rac t ice in ac t ion . B r is to l : Chapman . Cava l luzo , K & W olken , J . 2005 . Smal l bus iness loan tu rndowns, pe rsona l wea l th and d isc r im ina t ion . Jou rna l o f Bus iness , 78 (5 ) :2153 -2154 . Ch i l ton , KW , W arren , M & W eidenbaun , ML. 1990 . Amer ican manufac tu r ing in a g loba l marke t . Bos ton : K luwer Academic . Ch i t tenden , F , Robe r t son , M & W atk ins , D . 1993 . Sma l l f i rms: Recess ion and recove ry . London : Chapman.

160
Church i l l , NC & Lewis , VL . 1985. Bank lend ing to new and g rowing en te rp r i ses . Jou rna l o f Bus iness Ven tu r ing , 1 (1 ) :193 -200 .
CIMA. n .d . Mak ing a success o f you r bus iness - Essen t ia l check l i s t [On l ine ] . Ava i lab le : h t tp : / /www.c imag loba l . com/ resea rchpub l ica t ion . (Accessed 21 August 2010 ) . C IMA. 2002. F inance . 3 r d ed i t ion . London: Bpp . Coetzee , JK , Graa f f , J , Hend r i ks , F & W ood, G. 2001 . Deve lopmen t – Theo ry , po l icy and p rac t i ce . Cape Town : Oxfo rd Un ivers i t y P ress . Cohan, W A. 2006. The en t rep reneu r and smal l bus iness p rob lem so lve r . 3 r d ed i t ion . New York : John W i ley and Sons . Co r tes , M, Be r ry , RA & I shaq, A . 1987 . Success in sma l l and med ium-sca le en te rp r ise s . New York : Oxfo rd Un ive rs i t y P ress . Dagogo , DW & O l lo r , W G. 2009 . The e f fec t o f ven tu re cap i ta l f inanc ing on the economic va lue added p ro f i le o f N iger ian SMEs. Af r ican Jou rna l o f Accountancy , Economics , F inance and Ban k ing Resea rch , 5 (5 ) : 37 -51 . Dami t io , JW & Schmidga l l , RS . 2007. What account ing sk i l l s do managers va lue? St ra teg ic F inance [On l ine ] . Ava i lab le : h t tp : / /www.a l lbus iness .com/ lega l / tax - law- income-tax /6202628 -1 .h tm . (Accessed 19 August 2010 ) . Dav is , TT , J r & S te tson , CP, J r . 1984 . Crea t ing success fu l ven tu re backed compan ies . Jou rna l o f Bus iness S t ra tegy , 5 :45-58 . De Cle rca , D & Sap ienza , H. 2006. E f fec t o f ra t iona l cap i ta l and commi tment on ven tu re cap i ta l pe rcep t ion o f po r t f o l io company pe r fo rmance . Jou rna l o f Bus iness Ven tu r ing , 21 (3 ) :326-347 . Des i , K . 1998 . F inanc ia l fund ing mechan isms fo r b lack economic empowerment o rgan i za t ion s in South A f r ica . MBA d isse r ta t ion . Un ive rs i t y o f Cape Town . Deve lopmen t and P lann ing Commiss ion . 1999. Document DCP 4 /99 , Ap r i l [On l ine ] .Ava i lab le : h t tp : / /www. in fo .gov .za /g reenpapers /1999 /devep lan .pd f . (Accessed 3 May 2006 ) .

161
Dibernado, N (ed) . 1984 . The bus iness fa i lu re record . New York : Dun & B rads t ree t . D i l lma r , DA. 1978 . Mai l & te lephone su rvey - The to ta l des ign method . London: W i l ley - In te rsc ience . D lamin i , P . 2010 . Sma l l bus iness m isses ou t . Sowetan , 20 Sep tember . D rury , C. 2008. Management and cos t accoun t ing . 7 t h ed i t ion . Un i ted S ta tes : Sou th W este rn -Cengage Lea rn ing Do rsey , T . 1979 . Opera t ing gu ide l ines fo r e f fec t ive ven tu re cap i ta l funds managemen t . Aus t in : Un ive rs i t y o f Texas . DT I , v ide Depar tment o f T rade and Indus t ry . 1998 . F inanc ia l access fo r SMMEs: Toward a comprehens ive s t ra tegy – A d ra f t d i scuss ion document . P re to r ia : Cen t re fo r Sma l l Bus iness . DT I , v ide Depar tment o f T rade and Indus t ry . 2002 /2003 . Annua l repo r t [On l ine ] . Ava i lab le : h t tp : / /www.d t i . gov.za /down loads/annua l repo r t2002.pd f . (Accessed 20 Ju l y 2009 ) . DT I , v ide Depar tment o f T rade and Indus t ry . 2005 . Sma l l bus iness se rv i ce - Depa r tmen t o f T rade and Indus t ry . A mapp ing o f s tudy o f ven tu re cap i ta l p rov is ion to SMEs in Eng land , October [On l ine ] . Ava i lab le : h t tp : / /www.b is .gov.uk / f i les / f i le38273 .pd f . (Accessed 14 Octobe r 2007 ) . DT I , v ide Depar tment o f T rade and Indus t ry . 2006 . In teg ra ted s t ra tegy on the p romot ion o f en t rep reneursh ip and sma l l en te rp r ises [On l ine ] . Ava i lab le : h t tp : / /www.d t i . gov .za /smme/s t ra tegy .pd f . (Accessed 20 June 2006). Dushn i tsky, G & Lenox, MJ. 2006. W hen does co rpo ra te ven tu re cap i ta l inves tment c rea te f i rm va lue? Jou rna l o f Bus iness Ventu r ing , 21 (6 ) :753 -754 . E l i t zu r , P & Gav ious , A . 2003. Con t rac t ing, s igna l l i ng a nd mora l haza rd : A mode l o f en t rep reneu rs , ange ls and ven tu re cap i ta l i s t s . Jou rna l o f Bus iness Ventu r ing , 18 (1 ) :709 -710 . E l l io t , DR. 1997 . Does g rowth cause s t ruc tu ra l t rans fo rmat ion? Ev idence f rom La t in Amer ica and the Car ibbean . Jou rna l o f Deve lopmen t A reas , 32 (2 ) :187 -198 .

162
El l io t , JA . 2000 . An in t roduc t ion to sus ta inab le deve lopment . 2 n d ed i t ion . Oxfo rd : Rout ledge Tay lo r and F ranc is . Eng ineer ing News . 2005 . Smal l bus iness , SA ’s b igges t tes t [On l ine ] . Ava i lab le : h t tp : / /www.eng inee r ingnews .co .za /a r t ic le / sma l l -bus iness -sas -b iggest - tes t -2005 -01 -17 . (Accessed 10 June 2007 ) . EPRI v ide Economic Po l icy Research Ins t t i tu te .1999 . Pove r t y -Erad ica t ing Job Crea t ion -EPRI Research Paper#7 [On l ine ] . Ava i lab le : h t tp : / /www.ep r i .o rg . za / resea rchpub l i ca t ions . (Accessed 14 May 2005 ) . E r ikson , T . 2002 . En t rep reneu r ia l cap i ta l : The emerg ing ventu re ’s most impor tan t asse t and compet i t i ve advantage . Jou rna l o f Bus iness Ventu r ing , 17 (1 ) :275-290 . Eu ropean Commiss ion . 2008. Summary o f repo r t o f wo rkshops on c ross -bo rde r ven tu re cap i ta l w i th na t iona l expe r ts , indus t ry rep resen ta t ives and resea rche rs [On l ine ] . Ava i lab le :h t tp : / /ec .eu ropa .eu /en te rp r ise /po l i c ies / f inance / f i les/ summary_ repo r t_vc_workshops_2008 .pd f . (Accessed 18 August 2009) . Evans , D & Jovanov ic , B . 1989 a . An es t imated mode l o f en t repreneu r ia l cho ice unde r l i qu id i t y cons t ra in t s . Jou rna l o f Po l i t i ca l Economy , 97 (4 ) :808 -827 . Evans , D & Jovanov ic , B . 1989 b. Demons t ra tes tha t cap i ta l cons t ra in ts e f fec t i ve ly k i l l the p lans o f numerous po ten t ia l sma l l bus iness owners . Jou rna l o f Po l i t i ca l Economy , 97 (4 ) :55 -76 . Expo r t Cap i ta l . 2001 . P r iva te equ i t y and ven tu re cap i ta l B lack management f o rum semina r [On l ine ] . Ava i lab le : h t tp : / /www.expo r tcap i ta l . co .za /p ress .h tm l . (Accessed 8 Augus t 2007) . Fabe r , B . 2005 . A ca ta lys t fo r en t repreneu rsh ip [On l ine ] . Ava i lab le : h t tp : / /www.b lueca ta lys t . co .za /news . (Accessed 15 November 2005 ) . Fa fchamps, M. 1994. I ndus t r ia l s t ruc tu re and m ic ro -en te rp r i ses in A f r ica . Jou rna l o f Deve lopment Areas , 29 (1 ) :1 -30 . Fa r row, D. 1994. Maste r ing f inance and account ing . London: McGraw-Hi l l .

163
Frank , AG. 2004 . The sovere ign deb t res t ruc tu r ing mechan isms : Is i t t he p roposa l o r the p roposa l ’s fa i lu re to f ind suppo r t? The Sou th A f r i can Jou rna l o f Economics , 72 (4 ) :707-709 . F ra toe , FA . 1984. Abst rac ts o f the soc io log ica l l ibe ra t ion on mino r i t y bus iness ownersh ips . Resea rch Div i s ion MBDA, US. Depar tmen t o f Commerce . F ra toe , FA . 1986 . A soc io log ica l ana lys i s o f m ino r i t y bus iness . The Rev iew o f B lack Po l i t i ca l Economy , Fa l l : 5 -29 F reea r , J , Soh l , JE & W etze l , W E. 1996 . Creat ing new cap i ta l marke ts fo r emer g ing ven tu res . New Hampsh i re : Un ive rs i t y o f New Hampsh i re . F reshwate r , D , Bark ley , DL , Mark ley , DM, Rub in ,JS & Shaf fe r ,R .2001. Non- t rad i t iona l ven tu re cap i ta l ins t i tu t i ons : F i l l i ng a f i nanc ia l marke t gap . Co lomb ia , MO: Ru ra l Po l icy Research Ins t i tu te . [On l ine ] . Ava i lab le : h t tp : / /www. ru ra lesh ip .o rg/con ten t /c r_2 /2_000027 .pd f . (Accessed 10 December 2010 ) . Fu tuse , B . 2007. S tokve ls se t to en te r BEE b ig league - S ta te backs p lan by R12b i l l ion a yea r on in fo rma l sav ing sec to r . Ci ty Press - Bus iness , 22 Ap r i l : 5 . Gaston , RJ . 1989 . The sca le o f i n fo rma l cap i ta l marke ts . Sma l l Bus iness Economics , 1:223 -232 . GEM v ide Globa l En t rep reneursh ip Mon i to r . 2003 . South A f r i can Execu t i ve Repor t 2003 Update . [On l ine ] . Ava i lab le : h t tp : / /www.gsb .uc t .ac .za / f i les /GEM2003BW .pdf . (Accessed 11 November 2010 ) . GEM v ide Globa l En t repreneu rsh ip Mon i to r . 2005 . South A f r i can Repor t 2005 . [On l ine ] . Ava i lab le : h t tp : / /www.uwc .ac .za /us r f i les / impor tcms/gen11Srv7Nme54_9708_1210050485/man731_GEM2005SouthAf r ica .pd f . (Accessed 11 November 2010 ) . G i f f o rd , S . 1997 . L im i ted a t ten t ion and the ro le o f the ven tu re cap i ta l i s t . Jou rna l o f Bus iness Ventu r ing , 12 (1 ) :459 -482 . G lads tone , D. 1988. Ven tu re cap i ta l handbook : An en t repreneu r ’s gu ide to ob ta in ing cap i ta l to s ta r t a bus iness or expand an ex is t i ng bus iness . Eng lewood C l i f f s : P ren t i ce Ha l l .

164
Glocap i ta l . 1996 . Ven tu re cap i ta l [On l ine ] . Ava i lab le : h t tp : / /www.g locap ia ta l . com/ven tu recap i ta l . (Accessed 20 Apr i l 2007 ) . Gob igne twork . 2007 . F inanc ing your bus iness [On l ine ] . Ava i lab le : h t tp : / /www.gob igne twork .com. (Accessed 20 November 2007 ) . Go ldsche ide r , C & Kobr in , F . 1980 . E thn ic con t inu i ty and the p rocess o f se l f emp loymen t . E thn ic i t y , 7 :256 -278 . Goosen , W , Pampa l l i s , A , Van de r Merwe , A & Md lu l i , L . 1999 . Bank ing in the new mi l lenn ium . Kenwyn : Ju ta . Gove rnment Gazet te . 1998 . South A f r i ca : Vo l .400 (19412) : P re to r ia : Gove rnment P r in te r Government Ga ze t te . 2004 . South A f r i ca . Vo l . 471 (26762) . P re to r ia : Gove rnment P r in te r . Gowthorpe , C. 2008 . Managemen t account ing . London : Cengage Lea rn ing . Gray , C . 1991 . The Ba rc lays gu ide to manag ing g rowth in the sma l l bus iness . Massachuse t t s : B lackwe l l . G ray , W JH. 1975 . The deve lopment o f an en t rep reneu r ia l f inance d iv i s ion in South A f r ican f i nanc ia l ins t i tu t ion . MBL, Un ive rs i t y o f Sou th A f r i ca . Graz iano , AM & Rau l in , ML. 1997 . Research methods - A p rocess o f i nqu i ry . 3 r d ed i t ion . New York : Longman. Grego ry , BT , Ruther fo rd , MW , Oswa ld , S & Gard ine r , L . 2005 . An emp i r i ca l i nves t iga t ion o f g rowth cyc le theo ry o f sma l l f i rm f i nanc ing . Jou rna l o f Sma l l Bus iness Ma nagemen t , 43 (4 ) :382 -384 . Gumming, DJ. 2006 . The de te rminan ts o f ven tu re cap i ta l po r t f o l io s i ze : Emp i r i ca l ev idence . Journa l o f Bus iness , 79 (3 ) :1083 -1089 . Hak im, C. 1989 . I den t i f y fas t g rowth f i rms . Depa r tmen t o f Emp loyment . Ha l l , G . 1989 . Lack o f f inance as a cons t ra in t on the expans ion o f innova to ry sma l l f i rms. I n J Ba rbe r , JS Metca l fe & M Por teous . Bar r ie rs to g rowth in sma l l f i rms . London: Rout ledge .

165
Ha l l , G, Hu tch inson , P & Michae l s , N . 2000. Indus t ry e f fec ts of the de te rm inan ts o f unquoted SMEs’ cap i ta l s t ruc tu re . In te rna t iona l Journa l o f Economics and Bus iness , 7 (3 ) :297 -312 . Ha l l , J & Hofe r , CW . 1993. Ventu re cap i ta l i s ts ’ dec is ion c r i te r ia in new eva lua t ion . Jou rna l o f Bus iness Ventu r ing , 8 (1 ) :25 -27 . Hann ig , J & Joube r t , M. 2003 . S ta te o f equ i t y f inance in Sou th A f r i ca : A rev iew o f the indus t ry and the techn iques used fo r success fu l inves tment . MBA: Un ive rs i t y o f Cape Town. Hansohm, D. 1992. Sma l l i ndus t ry deve lopmen t in A f r i ca -l essons f rom Sudan . Bremer A f r i ca -Stud ienBd2, L i t Ve r lag . Munste r , Hamburg . Ha rpe r , M. 1984 . Sma l l bus iness in the th i rd wor ld . New York : John W i ley . Ha r r i son , RT & Mason, CM. 1990 . The ro le o f the bus iness expans ion scheme in the UK. OMEGA , 17 (2 ) :147-157 . Ha r t , G . 2002. Disab l ing g loba l i za t ion : P laces o f power in pos t apa r the id South A f r i ca . Be rke ley : Un ive rs i t y o f Ca l i f o rn ia P ress . Hawk ins , AM. 1997 . Economic po l icy and pe r fo rmance in A f r i ca – wha t can South A f r i ca lea rn? Cape Town: A IPA/Franco l in . HBD. 2005 . Inves tmen t p rocess and p rocedu res [On l ine ] . Ava i lab le : h t tp / / www.hbd.co .za . (Accessed 20 M ay 2007 ) . He ls ing, AHJ & Ko ls tee , TH (eds) . 1993 . Smal l en te rp r ises and chang ing po l ic ies : S t ruc tu re ad jus tments , f inanc ia l po l icy and ass is tance p rog rammes in A f r i ca . London : IT Pub l ica t ions . Hess , DW . 1995. How banke rs can deve lop the sma l l bus iness marke t . Jou rna l o f Commerc ia l Bank Lend ing , 68 (1 ) :11 -18 . H is r i ch , RD & Pe te rs , MP. 2002 . Ent rep reneu rsh ip . 5 t h ed i t ion . Bos ton : McGraw H i l l / I rw in . Ho l l iday , R. 1995. Inves t iga t ing sma l l f i rms: N ice work ? New York : Rout ledge .
166
Hor izon Equ i t y . 2005a . Inves tment c r i te r ia [On l ine ] . Ava i lab le :h t tp : / /www.ho r i zonequ i t y .co .za / INVESTMENTPHILOSOPHY/Our Inves tmentCr i te r ia / tab id /14792/Defau l t .aspx . (Accessed 20 May 2006 ) . Ho r i zon Equ i t y . 2005 b . Ent rep reneu rs . [On l ine ] . Ava i lab le :
ht tp : / /www.ho r i zonequ i t y . co .za / INVESTMENTPHILOSOPHY/Ent rep reneu rs / tab id /14787/Defau l t .aspx . (Accessed 9 August 2006 ) . Ho rngren , CH, Data r , SM & Foste r , G . 2006. Cost accoun t ing a manager ia l emphas is . 12 t h ed i t ion . New Jersey : Pea rson In te rna t iona l . Ho rngren , CH, Data r , SM, Fos te r , G , Ra jan , M & I t tne r , C. 2010 . Cost account ing a manager ia l emphas is . 13 t h ed i t i on . New Je rsey : Pea rson In te rna t iona l . Ho r tge t ts , RM & Ku ra tko , DF . 1995. Ef fec t i ve sma l l bus iness managemen t . 5 t h ed i t ion . Tokyo : The Dryden Press – Ha rcou r t s B race Co l lege Pub l ishers Hu l l , CJ & H jem, B . 1987. Help ing sma l l f i rms to g row - An imp lementa t ion app roach . London: Croom He lm . Hus tedde, R & Pu lver , G . 1992. Fac to rs a f fec t ing equ i t y cap i ta l acqu is i t ion : The demand . Jou rna l o f Bus iness Ven tu r ing , 7 :363 -374 . I cap i ta l . 2005 . Overv iew [On l ine ] . Ava i lab le : h t tp : / /www. icap i ta l . co .za /por t f o l ios .h tm . (Accessed 1 June 2006 ) . IDC, v ide Indus t r ia l Deve lopment C o rpo ra t ion . 2006 . An ove rv iew o f recen t t rends in the South A f r i can economy 2005 [On l ine ] .Ava i lab le :h t tp : / /www. idc .co .za /pub ica t ions / resea rch repo r t s2005 . (Accessed 5 August 2007 ) . Jacobs, RM. 2003 . Educat ion Resea rch : Samp l ing a popu la t ion . Educa t ion Resea rch . [On l ine ] . Ava i lab le :h t tp : / /www.83 .homepage.v i l l anova .edu /R icha rd . jacobs/ . . . . / samp l ing. ppp . (Accessed 7 Novemver 2009 ) . Jackowicz, A & H is r i ck , R. 1987 . Ins t i tu t ion in sma l l bus iness lend ing dec is ions . Jou rna l o f Smal l Bus iness Managemen t , 25 :45 -52 .

167
Jeppesen, S . 2009 . In i t ia t i ve I : Accesses to inves tment f inance to SMEs. [On l ine ] . Ava i la b le :
ht tp : / /www.dd rn .dk / f i le r / f o rum/F i le /A f r i ca_Commiss ion_ in i t ia ti ve_areas_ I_ I I_and_ IV.pd f . (Accessed 20 September 2009 ) . John , JA, W hi taker , D & Johns on , DG. 2006. Sta t is t i ca l th ink ing in bus iness . 2 n d ed i t ion . New York : Chapman & Ha l l . Johns , BL , Dun lop , W C & Sheehan , W J. 1983. Sma l l bus iness in Aust ra l ia - P rob lems and p rospects . 2 n d ed i t ion . Sydney: A l len & Urwin . Jones , K & Tu l los , R . 2002 . Behav iou r o f p re -ven tu re en t repreneu rs and pe rcep t ions on the i r f inanc ia l needs . Jou rna l o f Smal l Bus iness Management , 40 (3 ) :233-236 . Jones , N. 1989 . Sma l l bus iness commerc ia l loan se lec t ion dec is ion , an emp i r i ca l eva lua t ion . Amer ican Journa l o f Sma l l Bus iness , 6 :45 -49 . Kasekende, L & Opondo, H. 2003 . F inanc ing sma l l and med ium sca le en te rp r ises (SMEs) : Uganda ’s expe r ience [On l ine ] .Ava i lab le :h t tp : / /www.aacb .o rg/ IMG/pd f /F INANCING_SMEs.pd f . (Accessed 20 June 2005) . Khu la En te rp r ise . n.d . Khu la b r ings more South A f r i can s in to the ma ins t ream economy [On l ine ] . Ava i lab le : h t tp : / /www.khu la .o rg.za /pub l ica t ion . (Accessed 10 Sep tember 2005 ) . Khu la En te rp r i se . 2004 . Khu la maps the way fo rward [On l ine ] . Ava i lab le : h t tp : / /www.khu la .o rg .za /ma in .h tm l . (Accessed 12 November 2005 ) . Khu la En te rp r ise . 2005 . Guaran tee schemes [On l ine ] . Ava i lab le : h t tp : / /www.khu la . o rg.za /c red i t .h tm . (Accessed 10 Apr i l 2006 ) . K im, J . 2000 . “The e f fec ts o f wo rkp lace f inanc ia l educa t ion on pe rsona l f inances and workou t ” , Unpub l i shed Phd thes is . B lacksbu rg: V i rg in ia Po ly techn ic Ins t i tu te and S ta te Un ive rs i t y K inunda-Rutashobya , L & O lomi , DR. 1999. Ent rep reneu rsh ip and smal l bus iness deve lopment . Tanzan ia : Un ive rs i t y o f Da r -es -Sa laam. Kno t t , G. 2004 . F inanc ia l managemen t . 4 t h ed i t ion . New York : Pa lg rave MacMi l lan .

168
Kotze , L & Smi t , AVA. 2008. Pe rsona l f inanc ia l l i te racy and pe rsona l deb t management : the po ten t ia l re la t ionsh ip w i th new ven tu re c rea t ion . SAJESBM NS, 1 (1 ) :35 -50 Ku r i lo f f , A H, Hemph i l l , J , J r & C loud , D. 1993. Sta r t ing and manag ing the sma l l bus iness . 3 r d ed i t ion . New York : McGraw-Hi l l . Langdon, K & Bonham, A . 2000 . Smar t th ings to know about bus iness f inance . Oxfo rd : Capstone . Lapan, SD & Quar ta ro l i , MT. 2009 . Research essen t ia ls - An in t roduc t ion to des ign and p rac t i ce . Hoboken , NJ : John W i ley & Sons . Le Roux, H . 2004 . New in i t ia t i ves to tu rn ideas in to p ro f i t s . [On l ine ] .Ava i lab le : http://www.engineeringnews.co.za/article/new-initiative-to-turn-ideas-to-profit-2004-08-20 . (Accessed 12 August 2005). Lev in , JS. 2000. St ruc tu r ing ven tu re cap i ta l , p r iva te equ i ty and en t rep reneur ia l t ransac t ions . Ch icago , IL : Pane l . Lev inson , D & More , KS. 1998 . Househo ld wo rks as a de te r ren t to schoo l ing: An ana lys i s o f ado lescen t g i r l s in Pe ru . Journa l o f Deve lop ing A reas , 32 (1 ) :339 -356 . Lewis , J , S tanwor th , J & G ibb , A . 1984 . Success and fa i lu re in sma l l bus iness . A lde rsho t : Gower . L i les , PR. 1974. New bus iness ven tu res and the en t repreneu r . Homewood, I l l ino is : R icha rd D. I rw ing . L i t t le f ie ld , E , Morduch , J & Hashemi , S . 2003 . Is m ic ro -f inance an e f fec t i ve s t ra tegy to reach the m i l l enn ium deve lopment goa ls? Focus Note , 24 , January . Longenecke r , JG, Moore , CW & Pe t t y , JW . 1994. Smal l bus iness management - An en t rep reneu r ia l emphas is . 9 t h ed i t ion . C inc inna t i : Sou th -W este rn . Lo renz , T . 1985 . Ventu re cap i ta l today : A gu ide to ven tu re cap i ta l marke t i n the Un i ted K ingdom . Cambr idge : W oodhead -Fau lker . Louw, I & Nt ing i , A . 2007 . Labou r shuns gove rnment ’ s s t ra tegy to d r i ve g rowth . Ci ty P ress - Bus iness , 22 Ap r i l : 3 . Maasdo rp , L . 200 5 . BEE: Not jus t bus iness as usua l i n the boa rd room. Sunday T imes - Bus iness T imes , 20 March :4 .

169
MacLeod, G . 1995 . Sta r t ing your own bus iness in South A f r i ca . 8 t h ed i t ion . Cape Town: Oxfo rd Un ive rs i t y P ress . MacLeod, G & Te rb lanche , B . 2004 . Sta r t ing you r own bus iness in South A f r ica . 10 t h ed i t ion . Cape Town: Oxfo rd Un ive rs i t y Press . Macm i l l an , IC, S iege l , R & Subba Naras imha, PN. 1985 . Cr i te r ia used by ven tu re cap i ta l i s ts to eva lua te new ven tu re p roposa ls . Jou rna l o f Bus iness Ventu r ing , 1 (1 ) :119 -122 . Mad i , PM. 1997 . Black economic empowerment in the new Sou th A f r ica , the r igh ts and the w rongs . Randburg : Knowledge Resources . Ma ie r , JB ( I I ) & W alke r , DA. 1987 . The ro le o f ven tu re cap i ta l in f inanc ing sma l l bus iness . Jou rna l o f Bus iness Ven tu r ing , 2 (1 ) :207 -210 . Ma jo la , CH. 2000 . Loca l economic empowerment in i t ia t i ves and u rban pove r ty a l lev ia t ion in the c i t y o f Johannesbu rg . MSc(DP) , Un ive rs i t y o f the W i twate rs rand . Ma lgas , H (ed ) . 2002 . The s ta te o f sma l l bus iness in South A f r i ca - Annua l rev iew 2002 . P re to r ia : N ts i ka En te rp r ise P romot ion Agency . Ma lho ta , M, Chen, Y , Cruscuo lo , A , Fan , Q , Hame l , I I & Savchenko , Y . 2006 . Expand ing access to f inance : Good p rac t ice fo r Mic ro , Sma l l and Med ium Ente rp r ises . W ash ington : W or ld bank ins t i tu te Mann, PH. 1990. Non - t rad i t iona l bus iness educa t ion fo r b lack en t repreneurs : Obse rva t ion f rom a success fu l p rogram . Jou rna l o f Smal l Bus iness Management , 28 (2 ) :28 -32 . Mara is , H. 2001 . Sou th A f r i ca : L imi ts to change – The po l i t i ca l economy o f t rans i t ion . 2 n d ed i t ion . London: Zed Books . Maree , K . 2007. F i rs t s teps in resea rch . P re to r ia : Van Scha ik . Mbek i , T . 2004 . Sta te o f the Nat ion add ress . P re to r ia . McBennet , R . 2002 . Budge t s ta r t -up - 101 ways to s ta r t a new bus iness on £10 000 o r less . Cha r lo f f : Management Books .

170
McCormack, B & H i l l , E . 1997 . The SPSS workbook - Conduct ing su rvey s . London : In te rna t iona l Thompson Bus iness P ress . McGra th , S . 2005. Sk i l l s f o r p roduct i ve c i t i zensh ip fo r a l l : The p lace o f sk i l l deve lopment f o r m ic ro and sma l l en te rp r i ses in So uth A f r i ca . Jou rna l o f Educa t ion and Wor k , 18 (1 ) : 111 -125 Mc In ty re , RJ & Da l lago , B . 2003 . Sma l l and med ium en te rp r i ses in t rans i t iona l economies . Bas ings toke : Pa lg rave -Macmi l lan . McLaney, EJ . 2003. Bus iness f inance - Theo ry and p rac t ice . 6 t h ed i t ion . Ha r low: F inanc ia l T imes P ren t i ce Ha l l . Meyer , EC & A l len , KR. 1994. Ent rep reneu rsh ip and smal l bus iness management . New York : G lencoe -McGraw-H i l l . Mhome, G & Ed ighe j i , O . 2003 . Governance in the new Sou th A f r i ca – The cha l lenges o f g loba l i za t ion . Lansdowne : Un ive rs i t y o f Cape Town Press . Mond i , L . 2006 . The IDC’s ro le in the p romo t ion o f indus t r ia l deve lopment [On l ine ] .Ava i lab le : h t tp : / /www. idc .co .za /Confe rence%20Papers /2006/Af r ica%20Deve lopment% 20F inance%20W eek/Lumk i leMond i .pd f . (Accessed 5 Augus t 2007) . Mopp, RA. 1997 . A c r i t i ca l rev iew o f gove rnment po l icy ins t ruments to ensure b lack economic empowerment i n South A f r i ca . MA, Un ive rs i t y o f W este rn Cape . Mor r i s , R. 2004 . Sma l l bus inesses a re s t i l l sho r t changed, says S tanda rd Bank [On l ine ] . Ava i lab le : h t tp / /www. f inanc ia lma i l . co .za . (Accessed 15 June 2006 ) . Mor r i sson , C, Lecomte , SHB & Oud in , X . 1994 . Mic ro -en te rp r i ses & the ins t i tu t iona l f ramework in deve lop ing count r ies . Pa r is : OECD. Murphy ,M. 1996. Sma l l bus iness management . London. : P i tman Pub l i sh ing Nafukho , FM. 1998 . En t rep reneu r ia l sk i l l s deve lopment p rograms fo r unemp loyed you th in A f r i ca : A second look . Jou rna l o f Smal l Bus iness Management , 36 (1 ) :100 -103 .

171
Nat iona l Smal l Bus iness Amendment Amendmen t Ac t 26 . 2003 . Gove rnment Gazet te Repu b l ic o f Sou th A f r ica Newburgh , C . 1991 . Cha rac te r assessment in the lend ing p rocess . The Jou rna l o f Commerc ia l Bank Lend ing , 73 (8 ) :34 -37 . Newton , K . 2001. Management sk i l l s fo r sma l l bus iness . Canada : Sma l l Bus iness Po l i cy Branch [On l ine ] . Ava i lab le :
ht tp : / /dsp -psd .pwgsc.gc .ca /Co l lec t ion / Iu188 -21 -2001E.pd f . (Accessed 20 September 2010 ) . Ndegwa, P . 1985. Phi l ip Ndegwa on A f r i ca ’s deve lopment c r i s i s and re la ted in te rna t iona l i ssues . Na i rob i : He inemann . N iemand, G. 2006. Sma l l bus iness management . Pre to r ia : Van Scha ik . N iemand, G & P re to r ius , M. 2004 . Manag ing g rowth - A gu ide fo r en t rep reneu rs . Cape Town: Ju ta Academic . Nompozo lo , MT. 1997 . Fac to rs con t r ibu t ing to the success o f b lack economic empowerment s t ra teg ic a l l iances . MBA, Un ive rs i t y o f the W itwate rs rand . NPI , v ide Nat iona l P roduct i v i t y Ins t i tu te . 2003 . Gran t fo r SMME deve lopment [On l ine ] . Ava i lab le : h t tp / /www.np i . co .za . (Accessed 20 Ju ly 2005 ) . N t ing i , A . 2007 . Equ i t y sk i l l s acqu is i t ion w i l l be a cap i ta l ga in - Mogase . Ci ty P ress - Bus iness , 4 Feb rua ry: 1 . N ts i ka En te rp r i se P romot ion Agency . 1999. Sta te o f sma l l bus iness deve lopment in Sou th A f r ica . Annua l Rev iew . P re to r ia . N ts i ka En te rp r i se P romot ion Agency . 2002. S ta te o f sma l l bus iness deve lopment in Sou th A f r ica . Annua l Rev iew . P re to r ia . N ts i ka En te rp r i se P romot ion Agency. 200 5 . Sta te o f sma l l bus iness deve lopment in Sou th A f r ica . Annua l Rev iew . P re to r ia . O lawa le , F & Gware , D . 2010 . Obstac les to the g rowth o f the new SMEs in South A f r i ca : A p r inc ipa l component ana lys i s app roach . A f r ican jou rna l o f sma l l bus iness managemen t ,4 (5 ) :729 -738
172
Ol iv ie r , LT . 1999. A p rac t ica l gu ide to ob ta in f inance fo r sma l l and med ium en te rp r i ses - An ins igh t in to the South A f r i can bank ing and f i nanc ing indus t ry . Sma l l Bus iness P ro jec t . O lusapo, FA . 2005. Loca l governmen t and ru ra l deve lopment . Jou rna l o f Deve lopment A l te rna t i ves and A rea S tud ies , 24 (1 &2 ) :185 -203 . Oswa ld , J & T i l ley , F . 2003 . Compet i t i ve advantage in smes -o rgan is ing fo r innova t ion and change . London: John W i ley . Oxfo rd . J . 2004 . SA ’s one b ig need : Exper ienced mento rs [On l ine ] . Ava i lab le : h t tp : / /www.b lueca ta lys t . co .za /news . (Accessed 20 November 2005 ) . Pannee rse l ram, R . 2005 . Research methodo logy . I nd ia : P ren t i ce Ha l l . Pa rhankangas, A & Lands t röm, H . 2006. How ven tu re cap i ta l i s t s respond to unmet expecta t ions : The ro le o f soc ia l env i ronment . Jou rna l o f Bus iness Ven tu r ing , 21 (6 ) :773 -801 . Pa ton , C. 2004. Keep i t loose o r we w i l l l ose i t . F inanc ia l Ma i l [On l ine ] . Ava i lab le : h t tp : / /www. f inanc ia lma i l . co .za /04 /1210/bus iness . (Accessed 12 August 2007 ) . Pa t r i c io , A & M i tche l l , P . 2000 . Up & runn ing – A gu ide to runn ing you r own bus iness . Sou th A f r ica : Mass ive Pub l ish ing . Pea rce , R & Ba rnes , S . 2006. Rais ing ven tu re cap i ta l . W est Sussex: John W i ley . Peck , JA & W ai -Chung Yeung, H. 2003 . Remak ing the g loba l economy . London: Sage. Po l icy Co -o rd ina t ion and Adv iso ry Se rv i ce . 2003 . Towards a ten -yea r rev iew - Syn thes is repo r t imp lemen ta t ion o f gove rnment p rogrammes - D iscuss ion documen t . The P res idency . P r i yana th , HMS. 2006 . Manager ia l de f i c ienc ies in the sma l l and med ium en te rp r i ses (SMEs) in S r i Lanka : An emp i r i ca l ev idence o f the SMEs in the Ratnapu ra D is t r i c t . Sabaragamuwa Un ive rs i t y Jou rna l , 6 (1 ) :90 -110 . [On l ine ] . Ava i lab le : ht tp : / /www.sab .ac . l k /Acade -Act i v i t y / vo l_6 /8 .DOC . (Accessed 09 December 2010 ) .

173
Pub l ish ing Research Conso r t ium. 2009 . Access by UK sma l l and med ium s ized en te rp r ises to p ro fess iona l and academic in fo rmat ion . [On l ine ] . Ava i lab le :h t tp : / /www.pub l ish ingresea rch .ne t /documents /S MEAccessResea rchRepor t .pd f . (Accessed 10 January 2011 ) . Rea, RH. 1989 . Fac to rs a f fec t ing success and fa i l u res o f seed cap i ta l / s ta r t -up negot ia t ions . Jou rna l o f Bus iness Ven tu r ing , 4 (1 ) :149 -158 . Re id , S . 1987 . Des ign ing managemen t educa t ion and t ra in ing p rograms fo r se rv i ce f i rms en t repreneu rs . Jou rna l o f Sma l l Bus iness Management , 25 (1 ) :49 -52 . Re ide r , J . 2008 . Ef fec t i ve opera t ions and con t ro l f o r sma l l p rope r t y he ld bus iness . New Je rsey: John W i ley . Reuv id , J . 2001 . Do ing bus iness in South A f r i ca . London: Kogan Page. Rob inson , RB , J r . 1987 . Emerg ing s t ra teg ies in the ven tu re cap i ta l indus t ry . Jou rna l o f Bus iness Ven tu r ing , 2 (1 ) :53 -54 . Rose , PS. 2002 . Commerc ia l bank managemen t . 5 t h ed i t ion . Bos ton : McGraw-H i l l / I rw in . Ross , SA , W este r f ie ld , RW & Jo rdan , BD. 1996. Essent ia ls o f co rpora te f inance . Ch icago : I rw in . Ross , SA, W este r f ie ld , RW , Jordan , BD & F i re r , CS. 2001. Fundamenta ls o f co rpo ra te f inance . 2 n d ed i t ion . Rosev i l le : McGraw-Hi l l . Ryan , B , Scapens, RW & Theoba ld , M. 2002 . Research me thod & methodo logy in f inance & account ing . 2 n d ed i t ion . London : Thomson . Ryan , E . 2005a. Economic equa l i t y i s decades away. Sunday T imes - Bus iness T imes , 11 Sep tember :4 . Ryan , E . 2005b . SMEs’ su rv i va l h inges on BEE. Sunday T imes - Bus iness T imes , 11 Sep tember :5 . Ryan , JD & H iduke , GP. 200 5 . Sma l l bus iness - An en t repreneu r ’s bus iness p lan . 7 t h ed i t ion . Oh io : Thompson -Sou th W este rn . Samson, M, Macquene , K & Van Nieke rk , I . 2001 . Cap i ta l / sk i l l s - in tens i ty and job c rea t ion : An ana lys i s o f po l icy op t ion . EPRS, T IPS Annua l Fo rum .

174
Samson, M, Van N ieke rk , I & Bovu la , N . 1999. Pover t y -e rad ica t ing job c rea t ion - EPRI Resea rch Pape r#7 [On l ine ] . Ava i lab le : h t tp : / /www.ep r i .o rg . za / rp7 .h tm l . (Accessed 14 May 2005 ) . SAVCA, v i de South A f r i can Ventu re Cap i ta l Assoc ia t ion . 2003 . SAVC KPMG pr i va te equ i ty survey - 2003 [On l ine ] . Ava i lab le :h t tp : / /www.savca .co .za /down loads/SAVCA%20KPMG%20Pr iva te%20Equ i t y%20Survey%202003.pd f . (Accessed 18 March 2006) . SAVCA, v ide South A f r i can Ventu r e Cap i ta l Assoc ia t ion . 2004 . SAVCA KPMG p r i va te equ i ty survey - 2004 [On l ine ] . Ava i lab le :h t tp : / /www.savca .co .za /down loads/SAVCA%20KPMG%20Pr iva te%20Equ i t y%20Survey%202004.pd f . (Accessed 18 March 2006) . SAVCA, v ide South A f r i can Ventu re Cap i ta l Assoc ia t ion . 2005a. Assoc ia te members o f SAVCA [On l ine ] . Ava i lab le : h t tp : / /www.savca .co .za /assoc ia temembers /de fau l t .aspx . (Accessed 18 March 2006 ) . SAVCA, v ide South A f r i can Ventu re Cap i ta l Assoc ia t ion . 2005b. SAVCA KPMG p r iva te equ i t y su rvey - 2005 [On l ine ] . Ava i lab le :h t tp : / /www.savca .co .za /down loads/SAVCA%20KPMG%20Pr iva te%20Equ i t y%20Survey%202005.pd f . (Accessed 18 March 2006 ) . SBP, v ide Sma l l Bus iness P ro jec t . 2009 . Acce le ra t ing sma l l bus iness g rowth in South A f r ica [On l ine ] . Ava i lab le : h t tp : / /www.a f r i ca . fns t - f re ihe i t .o rg /news/sbp -a le r t -d ig i ta l -oc tobe r .pd f . (Accessed 24 August 2010 ) . SBP, v ide Sma l l Bus iness p ro jec t . 2009 . Sma l l bus iness deve lopment in Sou th A f r ica . [On l ine ] . Ava i lab le : h t tp : / /www.a r ica . fns t - f re ihe i t .o rg /new/sbp -a le r t - smmes -deve lopment - in -sa -august -09 -d ig i ta l .pd f . (Accessed 24 August 2010 ) . Sca rbo rough, NM, W i lson , DL & Z immere r , TW . 2009. Ef fec t i ve sma l l bus iness management - An en t rep reneu r ia l app roach . 9 t h ed i t i on . London : Pea rson In te rna t iona l Ed i t ion . Schepherd , DA & Zacha rak is , A . 2002 . Ven tu re cap i ta l i s t s ’ expe r t ise : A ca l l fo r resea rch in to dec is ion a id and cogn i t i ve feedback . Jou rna l o f Bus iness Ventu r ing , 17 (1 ) :1 -20 .
175
Schoombee , A . 2000 . Bank ing fo r the poo r : The success es and fa i l u res o f Sou th A f r ican banks . DEVNET Confe rence on Pove r t y , P rospe r i t y and Progress , V ic to r ia Un ive rs i t y o f W e l l ing ton , W el l ing ton , New Zea land , 17 -19 November . Sh i lson , D. 1984. Ventu re cap i ta l i n the Un i ted K ingdom . Bank o f Eng land Quar te r l y Bu l le t in , 24(4 ) :207 -211 . S i l ve rman, D. 1997 . Qua l i ta t ive resea rch - Theo ry , me thods and p rac t i ce . London : Sage. S impson, R. 1997 . Manag ing f inance and in fo rma t ion . London: P i tman . S ims , A & Sm i th , R . 2000 . Management account ing -Bus iness s t ra tegy - CIMA s tudy tex t . London : CIMA. S ims , A & Sm i th , R . 2002. Management account ing -Bus iness s t ra tegy - CIMA s tudy tex t . London : CIMA. S ingh , K . 2010. Exp la in ing the v en tu re cap i ta l inves t ing p rocess [On l ine ] . Ava i lab le :h t tp : / / www.b r igh thub .com/o f f i ce /en t rep reneu rs /a r t icles /82037 .aspx . (Accessed 18 August 2010) . S inswa t , W & Subhan j i , T . 2010 . A cross -count ry su rvey on SMEs f inanc ia l access and imp l ica t ion fo r Tha i land . Bank o f Tha i land . [On l i ne ] .Ava i lab le :h t tp : / /www. jc i c .o rg . tw/h is to r y_eng.h tm . (Accessed 13 January 2011) . S i r ta ine , S . 2006 . Access to f inance by Ch i lean co rpo ra t ion s - Wor ld Bank. Wor ld Bank Po l i cy Resea rch Work ing Paper 3845 , Feb rua ry [On l ine ] . Ava i lab le :h t tp : / /mfbbva .o rg /up loads/ t x_bbvagbmic ro f /wps3845.pd f . (Accessed 12 March 2007) . S i tho le , X . 2006. Max imis ing access fo r f inance SMMEs [On l ine ] . Ava i lab le : h t tp : / /www. idc .co .za .Confe rence%20papers /2006/ A f r i ca%20Deve lopment%20Finance%20W eek/Xo laS i tho le .pd f . (Accessed 14 Janua ry 2007 ) . S izanan i Adv iso ry . 2004 . Sizanan i head says t ra in ing w i l l he lp SMEs ge t loans [On l ine ] . Ava i lab le : www.bus inessowners .co .za /s ta r t you rownbus iness . (Accessed 14 September 2004 ) .

176
Sizanan i Adv iso ry . 2006 . Eva lua t ion p rocess [On l ine ] . Ava i lab le : h t tp : / /www.s izanan iadv iso ry .o rg.za /p rocess .h tm. (Accessed 20 August 2007). Sma l l Bus iness Admin is t ra t ion . 1997 . Trends in ven tu re cap i ta l fund ing in t he 1990s. Who supp l ies ven tu re cap i ta l , who rece ives i t , and how i s i t chang ing the US economy? [On l ine ] .Ava i lab le : h t tp : / /www.sba .gov .advo . (Accessed 10 August 2005 ) . Sma l l bus iness lend ing su rvey resu l ts . 1995 . Jou rna l o f Commerc ia l Lend ing , 78 (1 ) :56 -57 . Sma l l cap i ta l - The p rac t i ca l gu ide fo r SMEs in South A f r ica . 2005 . I ssue 3 , Sep tember [On l ine ] . Ava i lab le :h t tp : / /www.s tanda rdbank.co .za /po r ta l / images/s tanda rdbank/s ta t i cF i le /Bus iness /Bus iness_gu ides /Sma l lCap i ta l i ss3 .pd f . (Accessed 10 June 2006 ) . Soh l , JE . 2003. The US ange l and ven tu re cap i ta l marke ts : Recent t rends and deve lopmen ts . Jou rna l o f p r i va te equ i ty , 6 (2 ) : 7 -17 So lo , MT & Manro th , A . 2006. Access to f i nanc ia l se rv i ces in Co lombia . W or ld Bank Po l i cy Resea rch Pape r 3834, Feb rua ry [On l ine ] .Ava i lab le :h t tp : / /e l ib ra ry .wor ldbank.o rg/docserve r /down load /3834.pd f?exp i res=1297237256&id= id&accname=guest&checksum=C79F0E6891C77D7E5D99FBCDE71F8F14 . (Accessed 12 June 2007 ) . Sou th A f r ica . 1995 . Whi te Pape r on Sma l l Bus iness . P re to r ia : Gove rnment P r in te r . Sou th A f r i ca . 1996 . Nat iona l Sma l l Bus iness Deve lopment Ac t 112 o f 1981 . P re to r ia : Gove rnment P r in te r . Sou tha l l , R . 2004 . Black empowermen t and corpora te cap i ta l . In S ta te o f the na t ion : South A f r ica 2004 -2005 . Cape Town: HSRC Press . S ta f f wr i te r . 2004 . Where to ge t f inance ? [On l ine ] . Ava i lab le : h t tp : / /www.bus inessowner . co .za /A r t i c le .aspx?Page=23&type=30&I tem=1850 . (Accessed 5 December 2004 ) . S tanwor th , J & Gray , C. 1991 . Bo l ton 20 yea rs on : The sma l l f i rm in the 1990s . London: Chapman.

177
Sta tssa , v ide S ta t i s t i cs South A f r i ca . 2006 . MYPS, mid -yea r -popu la t ion -es t imates -2005 [On l ine ] . Ava i lab le :h t tp : / /www.s ta tssa .gov.za /pub l i ca t ions /P0302 /P03022006.pd f . (Accessed 25 March 2007 ) . S teyn , R . 2005 . When you r bank tu rns you down aga in , cons ide r equ i ty f inance [On l ine ] . Ava i lab le : h t tp : / /www.bus inessowner . co .za /A r t i c le .aspx?Page=23&type=21&I tem=288 . (Accessed 5 September 2006 ) . S t ig l i t z , J & W eiss , A . 1981 . Cred i t ra t i on ing in marke ts w i th imper fec t in fo rmat ion . Amer ican Economic Rev iew , 71 :393-410 . S to l l , HR. 1984 . Smal l f i rms ’ access to pub l ic equ i t y f inanc ing. In PM Horv i t z & R R icha rdson Pet t i t (eds ) . Smal l bus iness f inance , P rob lems in the f i nanc ing o f sma l l bus iness . Greenwich , Conn. : JAI P ress . S to rey, DJ . 1982 . Ent rep reneu rsh ip & the new f i rm . London: Croom He lm . S to rey, DJ . 1994 . Unders tand ing the sma l l b us iness sec to r . London: Rou t ledge . S t rydom, I . 2005 . Banks a re to spend R5mi l l ion on ba lck smes. [On l ine ] . Ava i lab le : h t tp : / /www.bus inessowner . co .za /A r t i c le .aspx?Page=23&t ype=27&I tem=2800 . (Accessed 20 August 2006 ) . Sumser , J . 2001 . A gu ide to emp i r ica l resea rch in commun ica t ion - Ru les fo r look ing . London: Sage . Sunday T imes – Bus iness T imes. 2007a. Cha r te red accoun tan t award reco rd number o f bursa r ies , 29 March . Sunday T imes - Bus iness T imes . 2007b. Educa t ion r i ses to top o f the l i s t , 29 March . Sunday T imes - Bus iness T imes . 2007c. More fo r soc ia l causes, 29 March . Sunder land , R. 2001 . Comp le te gu ide to runn ing you r own bus iness . New York : Random House.

178
Sun je , A .2003. The ro le o f gove rnmen t in suppo r t ing en t repreneu rsh ip and SMEs. [On l ine ] . Ava i lab le :http://www.ecorys.nl/dmdocuments/Sunje%20-%20Support%20to%20Entrepreneurship%20&%20SMEs%20BiH.pdf. (Accessed 12 August 2005 ) . Ta t i , S . 2005 . F ind ing f i nance - Cha l lenge ra the r than hu rd le . Ci ty P ress - Money , 3 (11 ) , 5 March . Tay lo r , TW . 1985 . The f inanc ing o f indus t ry and commerce . London: He inemann . Tech Mon i to r . 2007 . Venture cap i ta l – A l te rna t i ve source o f f inanc ing fo r SME s [On l ine ] . Ava i lab le : h t tp : / /www. techmon i to r .ne t / tm/ images/7 /74 /09nov_dec_ven ture_ f inanc ing.pd f . (Accessed 29 October 2009 ) . Te rb lanche , B . 2004 . Look beyond banks to f i nance tho se b ig tende rs [On l ine ] . Ava i lab le :h t tp : / /www.bus inessowner . co .za /A r t ic le .aspx?Page=23&type=21&I tem=2271 . (Accessed 20 Ap r i l 2005 ) . Te rb lanche , B . 2005 . Top f inanc ie rs fo r bus iness owners , Bus iness Repor t [On l ine ] . Ava i lab le :h t tp : / /www.bus inessowner . co .z a /A r t ic le .aspx?Page=23&type=30&I tem=2445 . (Accessed 17 Ap r i l 2006 ) . Te rps t ra , DE & O lson , PD. 1993 . En t rep reneur ia l s ta r t -up and g rowth , a c lass i f i ca t ion o f p rob lems . Ent rep reneu r ia l Theo ry and P rac t ice , 17 (3 ) :5 -15 . The Indus Ent rep reneu rs . 2003 . The essen t ia ls o f en t repreneu rsh ip - What i t takes to c rea te a success fu l en te rp r i se . To ron to : John W i ley . T immons, JA. 1999. New ven tu re c rea t ion - En t repreneu rsh ip fo r the 21 cen tu ry . 5 t h ed i t i on . Bos ton : I rw in /McGraw-H i l l . T immons, JA & Bygrave , W D. 1997. Ventu re cap i ta l : Re f lec t ions and p ro jec t ions . In DL Sexton & RW S im i lo r (eds) . Ent repreneu rsh ip 2000 . Ch i cago : Ups ta r t . T immons, JA & Sap ienza , H . 1992 . Ventu re cap i ta l : The decade ahead. In DL Sexton & JD Kasa rda (eds ) . The s ta te o f the a r t o f en t rep rene u rsh ip . Bos ton : PW S-Ken t .

179
T immons , JA & Sp ine l l i , S . 2007 . New ven tu re c rea t ion : en t repreneu rsh ip fo r the 21 s t cen tu ry . 7 t h ed i t ion . New York : McGraw H i l l Tus t in , DH. 2003. Smal l bus iness sk i l l s aud i t in pe r i -u rban a reas o f No r thern Tshwane (Sk i l l s requ i rements o f sma l l bus iness es tab l ishments in No r thern Tshwane) . Un isa : Bu reau o f Marke t Resea rch : Research Repor t no .315 [On l ine ] .Ava i lab le : h t tp : / /www.un isa .ac .za /con ten ts / fac u l t ies /ems /docs /P ress315.pd f . (Accessed 20 September 2010 ) . Tyebee, TT & B runo , AV. 1984. A mode l o f ven tu re cap i ta l i s t s inves tment ac t i v i t y . Management Sc ience , 30 :1051 -1066 . Tyson , E . 2003 . I nves t ing fo r dummies . 3 r d ed i t i on . New York : W i ley . Un i ted Na t ions . 2001 . Improv ing the compet i t i veness o f SMEs in deve lop ing count r ie s . [On l ine ] . Ava i lab le :h t tp : / /www.unc tad .o rg /en /docs / i te tebm isc3_en .pd f . (Accessed 10 December 2010 ) . Van Aa rd t , I , Van Aard t , C, Bezu idenhout , S & Mumba, M. 2008 . Ent rep reneu rsh ip and new ven tu re management . Cape Town: Oxfo rd -Southern A f r ican Un ive rs i t y P ress . Van Nieke rk , JT . 1995 . En t rep reneu r ia l sk i l l s as eva lua t ion c r i te r ia in g ran t ing f inanc ia l ass is tance to app l i can ts in the bus iness sec to r w i th re fe rence to reg ion G . MBA. Un ive rs i t y o f the Nor th . V in tu re l la , JB & Er i ckson , SM. 2004. Rais ing en t repreneu r ia l cap i ta l . New York : E lsev ie r Bu t te rwor th He inemann . Vos loo , W B. 1994 . En t rep reneu rsh ip and economic g rowth . P re to r ia : Human Sc ience s Research Counc i l . W a lker , D. 1989 . F inanc ing the sma l l f i rm. Sma l l Bus iness Economics , 1 :285-296 . W atson , R & W i l son , N . 2002. Sma l l and med ium s ize en t repreneu rs f i nanc ing: A no te on some o f the emp i r i ca l imp l i ca t ions o f a peck ing o rde r . Jou rna l o f Bus iness F inance and Accoun t ing , 29 (3&4) :557 -558 . W e issman, RL. 1979 . Sma l l bus iness and ven tu re cap i ta l . New York : ARNO Press .

180
W elman, JC & K ruge r , SJ . 2001 . Research methodo logy fo r the bus iness and admin is t ra t i ve sc ience s . 2 n d ed i t ion . Cape Town: Oxfo rd Un ive rs i t y P ress . W est fa l l , L .2008/9 .Sampl ing Methods. [On l ine ] . Ava i lab le :h t tp : / /www.wes t fa l l team.com/Papers /Sampl ing%20Methods.pd f . (Accessed 20 Feb rua ry 2011 ) . W eston , JF & Cope land , TE. 1999. Manager ia l f inance . 19 t h ed i t ion . Fo r t W or th : Drydan Press . W iske r , G. 2001. The pos tg raduate resea rch handbook - Succeed w i th you r MA, MPh i l , EdD & Phd . G rea t B r i ta in : Pa lg rave S tudy Gu ides . W or ld Bank. 2003. Wor ld deve lopment repo r t 2003 . W or ld Bank and Oxfo rd Un ive rs i t y Press . W r igh t , C . 1995 . Success fu l sma l l bus iness management i n Sou th A f r i ca : Choos ing a sma l l bus iness , s ta r t ing a bus iness , ra is ing cap i ta l , avo id ing p i t fa l l s , runn ing yo u r bus iness . W ynberg : S t ru ik . Z i kmund, W G. 1994 . Bus iness resea rch methods . London : Dryden P ress . Z immere r , TW & Sca rbo rough, NM. 1994 . Essen t ia l s o f sma l l bus iness management . New York : MacMi l l an Co l lege .

181
APPENDIX-1A
Consent for participation in an academic research study The gap in management accounting skills required by venture capitalists and those possessed by small and medium enterprises (SMEs) in the craft industry
Questionnaire to SMEs owners in the craft industry
Dear respondent
You are invited to participate in an academic research study conducted by David Shaku, a master’s
student under the supervision of Professor PC du Plessis of the Department of Management Accounting
at the University of South Africa.
Lack of awareness by SMEs of the type of management accounting skills required by providers of
capital is among major reasons why SMEs in South Africa fail to raise sufficient capital to start their
business on time. There is minimum management accounting skills providers of capital need to identify
in a business before they can grant a loan to a business owner.
The purpose of this study is to investigate the gap in management accounting skills required by venture
capitalists and those possessed by SMEs in the craft industry.
The questionnaire comprises mostly of questions where the respondent can mark with an X to an
alternative and some yes/no questions.
The responses obtained from the individual questionnaires will be analysed and statistically processed
into final results. The information from individual respondents will at all times be treated as confidential
and will not be made available to any entity or third party. Neither your name nor your company will be
linked to your contributions to this study. The data obtained from the questionnaires will be used for
academic research purposes only.
Your participation in this study is very important and will be appreciated. You may, however, choose
not to participate and you may also stop participating at any time without any adverse consequences.
As soon as the research is completed, an electronic copy of the final research will be made available to
all participants requesting such information.
As soon as the research is completed, an electronic copy of the final research will be made available to
all participants requesting such information.
Should you require any further information, please do not hesitate to contact David Shaku at:
Telephone : 012 549 5030 / 012 382 0634
Fax : 012 382 0808
Email : [email protected] or [email protected]
Postal address : P O BOX 42341
Boordfontein

182
0201
Your response to the enclosed questionnaire would be greatly appreciated.
Thank you in anticipation for your kind cooperation and assistance with this research project.
Yours sincerely
Mr. M.D. Shaku

183
1.
Development stage of business
OFFICIAL
USE
1.1.
How long have you been operating the business
Less
than 3
years
4-6
years
More than
7 years
1
2
3
1.2.
Describe the development stage of your business: (Mark with X)
Planning phase (Still an idea; not yet started) 1
Start-up phase (Preliminary sales) 2
Growth phase (Relatively new business; limited markets) 3
Mature phase (well established) 4
2.
Background of the entrepreneur/owner
2.1.
Reason for starting the business: (Mark with X)
Unemployed and in need of earning an income 1
Business opportunity because of special skills and talent 2
Wants to be an entrepreneur and self-employed 3
Others (Please specify): 4
2.2.
Business type: (Mark with X)
Sole owner 1
Partnership 2
Close corporation 3
Private company 4

184
2.3.
Have you been involved in the same type of business before you
started your business?
Yes
No
0
1
If yes, what was your involvement? (Mark with X)
Purchases 1
Material handling (Store, etc) 2
Manufacturing 3
Quality control 4
Marketing and sales 5
Administrative tasks 6
Management 7
Others (Please specify):
8
2.4.
What is your educational background? (Mark with X)
No education at all (Never attended school) 1
Limited schooling (No matric) 2
Matric 3
Certificate for skills development programme (Short course) 4
Certificate course (One year formal training) 5
Diploma or degree (Three years formal training) 6
2.5
Was the above education business related?
Yes
No
0
1
2.6
Have you ever attended workshops or short courses to develop
specific business skills?
Yes
No
0
1
2.7
Did you have any experience of the following prior to your decision to start your
own business? (Mark with X)
Managing a business or a segment of a business 1
Bookkeeping 2
Administration 3
Stockholding 4
Others (Please specify):
5

185
2.8
Are you skilled in, or did you receive any training regarding the following aspects?
Bookkeeping 1
Cash flow management 2
Identification, classification and measurement of overheads 3
Cost control 4
Product costing 5
Raising capital 6
Preparing financial and sales projections 7
Budgeting 8
Standard costing 9
Activity based costing 10
Life cycle costing 11
Variance analysis 12
Break-even analysis 13
EOQ & Stock management 14
3.
Financial background of the business
3.1.
How did you finance the business? (Mark with X)
Personal savings 1
Borrowing from a relative 2
Borrowing from a local bank 3
Funded by a venture capitalist 4
Others (Please specify):
5
3.2.
Was the capital sufficient?
Yes
No
0
1
3.3.
How much capital did you have available to start the business?
Please mention the amount?
R
3.4.
How long did it take you to raise the capital?
3.5
How long did the institution take to approve your loan? State
number of months.

186
4.
Relationship with financial institutions
4.1
Prior to starting this business, have you ever borrowed money from
a bank or venture capitalist for business or personal use?
Yes
No
0
1
4.2.
If you have a business education, do you think your educational
background influenced the decision for a bank to approve you a
loan?
Yes
No
0
1
4.3
Do you think personal accomplishments, like having operated or
worked in the similar business, have influenced the decision to
approve your loan?
Yes
No
0
1
4.4
How long did it take the financial institution to approve your loan?
Please state the number of months.
4.5
Was any of your applications for a loan ever turned down?
Yes
No
0
1
4.6
If yes, what was stated as the reason for turning down the
application? (Please mark with X)
Not enough security 1
Limited management experience 2
Others (Please specify):
3
5.
What was the biggest problems you experienced in acquiring a loan?
Identifying possible financiers 1
Completing a complicated application form 2
Drawing up a feasibility study 3
Time lapse between application and approval of loan 4
Others (Please specify):
5

187
APPENDIX-B
Consent for participation in an academic research study The gap in management accounting skills required by venture capitalists and those possessed by
small and medium enterprises (SMEs) in the craft industry
Questionnaire to venture capital providers
Dear Respondent
You are invited to participate in an academic research study conducted by David Shaku, a
master’s student under the supervision of Professor PC du Plessis of the Department of
Management Accounting at the University of South Africa.
Lack of awareness by SMEs of the type of management accounting skills required by providers
of capital is among the major reasons why SMEs in South Africa fail to raise sufficient capital to
start their business on time. There is a minimum of management accounting skills that providers
of capital need to identify in a business before they can grant a loan to a business owner.
The purpose of this study is to investigate the gap in management accounting skills required by
venture capitalists and those possessed by SMEs in the craft industry.
The questionnaire comprises mostly questions where you can choose an alternative, there are
some yes/no questions and space is provided next to some questions for reasons, percentages
and/or figures.
The responses obtained from the individual questionnaires will be analysed and statistically
processed into final results. The information from individual respondents will be treated as
confidential at all times and will not be made available to any entity or third party. Neither your
name nor your company will be linked to your contributions to this study. The data obtained
from the questionnaires will be used for academic research purposes only.
Your participation in this study is very important and would be appreciated. You may, however,
choose not to participate and you may also stop participating at any time without any adverse
consequences.
As soon as the research is completed, an electronic copy of the final research will be made
available to all participants requesting such information.
Should you require any further information, please do not hesitate to contact David Shaku at:
Telephone : 012 549 5030 / 012 382 0634
Fax : 012 382 0808
Email : [email protected] or [email protected]
Postal address : PO BOX 42341
Boordfontein

188
0201
Your response to the enclosed questionnaire would be greatly appreciated.
Thank you in anticipation for your kind cooperation and assistance with this research project.
Yours sincerely
M.D. Shaku

189
1.
Background on funding SMEs
OFFICIAL
USE
1.1 How long has your organisation been funding
SMEs?
Less
than 5
years
6-10
years
11-15
years
More
than
16
years
1
2
3
4
1.2 Does the form of business have an influence on the decision to
fund an applicant?
Yes
No
0
1
1.3 Which forms of business are most likely to
get financial support? Please rate them
Low High
1 2 3 4 5
1 Sole ownership 1
2 Partnerships 2
3 Close corporations 3
4 Private companies 4
1.4 Does the development stage of the business influence the decision
to finance the venture?
Yes
No 0 1
1.5 At which stage of development is a venture
capitalist most likely to finance a venture?
Least Most
likely likely
1 2 3 4 5
1 Planning phase (Still an idea; not yet
started)
1
2 Start-up phase (Prototype; preliminary
sales)
2
3 Growth phase (Relatively new business;
limited markets)
3
4 Mature phase (established; operating at a
profit)
4
1.6 Are applicants aware of the relevant sources of finance for which
they can apply for their businesses?
Yes
No
0
1
1.7 If the answer to 1.6 above is yes, please state the number of applications you
receive per month for each of the following sources of finance: ↓
1 Seed 1
2 Start-up 2
3 Expansion 3
4 Replacement capital 4
5 Buy-outs 5
1.8 Why funding was granted to these
applicants? Can you give some of the
factors?

190
1.9 Does the location of the applicant’s business have any influence
on the decision to grant a loan?
Yes
No
0
1
1.10 If the answer to 1.9 above is yes, which of the nine provinces is
the most preferred one?
1.11 Does settlement strategy have an influence on the decision to
grant a loan?
Yes
No
0
1
1.12 Does understanding the criteria used by the company in
selecting a new venture increase the applicant's chances? →
Yes
No
0
1
1.13 If the answer to 1.12 above is yes, please
mention some of the factors working against
the applicant.
1.14 Does the applicant's industry sector have an influence on the
decision to grant a loan?
Yes No
0
1
1.15 On a scale of 1 to 5, which of the following
sectors are likely to get funding?
Least Most
likely likely
1 2 3 4 5
1 Craft 1
2 Construction 2
3 Communication 3
4 Information and technology 4
5 Agriculture 5
6 Transportation 6
7 Retail 7
2.
Major aspects that financial institutions consider before allocating funds
2.1 On a scale of 1 to 5, when granting a
loan/capital, which of the following aspects
of management have an influence on the
decision?
Low High
1 2 3 4 5
1 Participation of applicant in developing a
business plan
1
2 Participation of applicant in developing a
prototype product
2
3 Technical experience in the same product
manufactured
3
4 Good track record in managing a similar
type of business
4
5 Experience in drafting projected sales and
financial statements
5
6 Knowledge or experience in the similar
market or product
6

191
2.2 Does revenue generated in the past have a direct influence on the
decision to finance a business?
Yes
No
0
1
2.3 Does projected revenue have a direct influence on the decision to
finance a business?
Yes
No
0
1
2.4 Does the guaranteed return on investment directly influence the
decision to finance a company?
Yes No 0 1
2.5 If the answer to 2.4 above is yes, mention the expected return on
investment that will help the applicant to secure the funding. →
2.6 Do product characteristics have an influence on the decision to
finance a company?
Yes No
0
1
2.7 Do any of the following have a direct influence on the decision to
finance the business?
a. Projected market share Yes No 0 1
b. Growth prospects Yes No 0 1
c. Competitiveness of the company Yes No 0 1
d. Others, please specify
2.8 What should a venture’s expected growth rate be for the capitalist
to grant a loan?
2.9 Does intellectual property have a direct influence on the decision
to finance a business, e.g. registered brand?
Yes
No 0 1
2.10 Does the previous record of the management team or the
entrepreneur in a similar type of business have a direct influence
on the decision to finance the business?
Yes
No
0
1
2.11 If the answer to 2.10 above is yes, name
some of the management achievements
that will directly influence the decision.
……………………………………….
……………………………………….
……………………………………….
……………………………………….
2.12 Does the role of the founder as manager/owner have an influence
on the decision to give financial support?
Yes
No
0
1
2.13 Does the composition of the management team in terms of gender
have an influence on the decision to grant a loan?
Yes
No
0
1
2.14 Does any financial contribution by the entrepreneur or the
management team to the business have any influence on the
decision to give financial support?
Yes
No
0
1
2.15 If the answer to 2.14 above is yes, mention the preferred
percentage in terms of contribution to the company that the
founder should make.

192
2.16 How are the following management
or financial accounting skills likely
to influence the decision to grant a
loan?
Least Most
likely likely
1 2 3 4 5
1 Bookkeeping 1
2 Product costing 2
3 Budgeting 3
4 Management of cash flow 4
5 Ability to calculate profits 5
6 Knowledge of analysing price trends 6
7 Analysis, identification or awareness
of overheads
7
8 Inventory management 8
9 Calculation of break-even point 9
10 Identification and separation of fixed
and variable overheads
10
11 Calculation of expected rate of
return
11
12 Calculation of financial and sales
projections
12
2.17 How likely are the following to
influence a decision to grant a loan?
Least Most
likely likely
1 2 3 4 5
1 The potential of sales growth 1
2 The compatibility of management
assumptions with market
opportunity
2
3 The exit time scale, exit valuation
and exit route
3
2.18 On a scale of 1 to 5, how important
are the following as requirements for
successful venture capital loans?
Not Very
important important
1 2 3 4 5
1 Business plan 1
2 Feasibility study 2
3 Projected financial statements 3
4 Standard application forms 4
5 Details of business strategy, covering
reasons why the company will succeed
5
2.19 Do applicants have problems completing a form or
presenting their business plan?
Yes
No
0
1
2.20 Out of a total of 10 applicants, how many applicants are
successful? State the number

193
2.21 What are the main reasons for failure?
1………………………………………..
2………………………………………..
3………………………………………..
4………………………………………..
5………………………………………..
6………………………………………..
7………………………………………..
8……………………………………….
9……………………………………….
10………………………………………
1
2
3
4
5
6
7
8
9
10
2.22 Which of the following is the most
preferred form of security or collateral
by a venture capitalist in a new
business?
Least Most
preferred preferred
1 2 3 4 5
Equity 1
Ordinary shares 2
Preference shares 3
Debt 4
Property 5
Owner's house 6
Business premises 7
Car 8
Equipment 9
Surety 10
Insurance policy 11
Investment in a bank 12

194
APPENDIX 2A -------------------------------------------------------------------------------
opened on: 12 Sep 2008, 07:43:14
. use "C:\Documents and Settings\Kobuep\My Documents\david shaku 2.dta", clear
. lab var v1_1" Duration of operating the business"
. lab var v1_2" Development stage of your business"
. lab var v1_11" Unemployment and need of earning an income"
variable v1_11 not found
r(111);
. lab var v2_11" Unemployment and need of earning an income"
. lab var v2_12" Business opportunitity because of special skills and talent"
. lab var v2_13" Wants to be an entrepreneur and self-employed"
. lab var v2_14" Others"
. lab var v2_2" Business type"
. lab var v2_3" Involved in the same type of business before you started"
. lab var v2_31" Purchases"
. lab var v2_32" Material hanling"
. lab var v2_33" Quality control"
. lab var v2_34" Marketing and sales"
. lab var v2_35" Administrative tasks"
. lab var v2_36" Management"
. lab var v2_37" Others"
. lab var v2_38" Others"
. lab var v2_37" Management"
. lab var v2_36" Administrative tasks"
. lab var v2_35" Marketing and sales"
. lab var v2_34" Quality control"
. lab var v2_33" Manufacturing"
. lab var v2_4" Educational background"
. lab var v2_5" Education business related"

195
. lab var v2_6" Attended workshop or short courses "
. lab var v2_71" Managing a business or a segment of a business "
. lab var v2_72" Bookkeeping "
. lab var v2_73" Administration "
. lab var v2_74" Stockholding "
. lab var v2_75" Other "
. lab var v2_81" Bookkeeping "
. lab var v2_82" Cash flow management "
. lab var v2_83" Overheads "
. lab var v2_84" Cost control "
. lab var v2_85" Product costing "
. lab var v2_86" Raising capital "
. lab var v2_87" Finacial and sales projections "
. lab var v2_88" Budgeting "
. lab var v2_89" Standard costing "
. lab var v2_810" Activity based costing "
. lab var v2_811" Life cycle costing "
. lab var v2_812" Variance analysis "
. lab var v2_813" Break-even analysis "
. lab var v2_814" EOQ & Stock management "
. lab var v3_1" How did you finance the business "
v3_1 ambiguous abbreviation
r(111);
. lab var v3_11" Personal savings "
. lab var v3_12" Borrowing from a relative "
. lab var v3_13" Borrowing from a local bank "
. lab var v3_14" Funded by a venture capitalist "
. lab var v3_15" Others "
. lab var v3_2" Capital sufficient "
. lab var v3_3" Capital available to start business "

196
. lab var v3_4" How long did it take to raise the Capital "
. lab var v3_5" How long did it take to approve your loan "
. lab var v4_1" Prior to stating this business, borrowed money from a bank or
> venture capitalist "
note: label truncated to 80 characters
. lab var v4_2" If you have a business education, it influenced the decision
> to approve your loan? "
note: label truncated to 80 characters
. lab var v4_3" Personal accomplishments influenced the decision to approve y
> our loan? "
. lab var v4_4" How long did the financial institution take to approve your l
> oan "
. lab var v4_5" Was any of your applications for a loan ever turned down? "
. lab var v4_6" Reason for turning down the application? "
v4_6 ambiguous abbreviation
r(111);
. lab var v4_61" Not enough security "
. lab var v4_62" Limited management experience "
. lab var v4_63" Others "
. lab var v5_1" Identifying possible financiers "
. lab var v5_2" Compliting a complicated application form "
. lab var v5_3" Drawing up a feasible study"
. lab var v5_4" Time lapse between application and approval of loan"
. lab var v5_4" Others"
. save "C:\Documents and Settings\Kobuep\My Documents\david shaku 2.dta", repla
> ce
file C:\Documents and Settings\Kobuep\My Documents\david shaku 2.dta saved
. tab v1_1
Duration of |
operating |
the |
business | Freq. Percent Cum.
------------+-----------------------------------
1 | 28 18.67 18.67
2 | 41 27.33 46.00
3 | 81 54.00 100.00
------------+-----------------------------------
Total | 150 100.00

197
. tab v1_1 - v5_4
too many variables specified
r(103);
. for all var X, tab X,
invalid syntax
r(198);
. help tab
. help frequency
. tab v1_1 v1_2
Duration |
of |
operating |
the | Development stage of your business
business | 1 2 3 4 | Total
-----------+--------------------------------------------+----------
1 | 1 22 4 1 | 28
2 | 0 2 36 3 | 41
3 | 0 1 14 66 | 81
-----------+--------------------------------------------+----------
Total | 1 25 54 70 | 150
. tab v1_1 v2_2
Duration |
of |
operating |
the | Business type
business | 1 2 3 | Total
-----------+---------------------------------+----------
1 | 21 5 2 | 28
2 | 30 10 1 | 41
3 | 56 24 1 | 81
-----------+---------------------------------+----------
Total | 107 39 4 | 150
. tab v1_1 v2_3
Duration |
of | Involved in the same
operating | type of business
the | before you started
business | 0 1 | Total
-----------+----------------------+----------
1 | 15 13 | 28
2 | 26 15 | 41
3 | 45 36 | 81
-----------+----------------------+----------
Total | 86 64 | 150

198
. tab v1_1 v2_31
Duration |
of |
operating |
the | Purchases
business | 1 | Total
-----------+-----------+----------
1 | 2 | 2
2 | 3 | 3
3 | 8 | 8
-----------+-----------+----------
Total | 13 | 13
. tab v1_1 v2_32
Duration |
of |
operating | Material
the | hanling
business | 2 | Total
-----------+-----------+----------
1 | 8 | 8
2 | 11 | 11
3 | 24 | 24
-----------+-----------+----------
Total | 43 | 43
. tab v1_1 v2_33
Duration |
of |
operating | Manufactur
the | ing
business | 3 | Total
-----------+-----------+----------
1 | 14 | 14
2 | 21 | 21
3 | 39 | 39
-----------+-----------+----------
Total | 74 | 74
. tab v1_1 v2_34
Duration |
of |
operating | Quality
the | control
business | 4 | Total
-----------+-----------+----------
1 | 4 | 4
2 | 6 | 6
3 | 13 | 13

199
-----------+-----------+----------
Total | 23 | 23
. tab v1_1 v2_35
Duration |
of |
operating | Marketing
the | and sales
business | 5 | Total
-----------+-----------+----------
1 | 5 | 5
2 | 8 | 8
3 | 22 | 22
-----------+-----------+----------
Total | 35 | 35
. tab v1_1 v2_36
Duration |
of |
operating | Administra
the | tive tasks
business | 6 | Total
-----------+-----------+----------
1 | 2 | 2
2 | 3 | 3
3 | 4 | 4
-----------+-----------+----------
Total | 9 | 9
. tab v1_1 v2_37
Duration |
of |
operating |
the | Management
business | 7 | Total
-----------+-----------+----------
1 | 2 | 2
2 | 2 | 2
3 | 5 | 5
-----------+-----------+----------
Total | 9 | 9
. tab v1_1 v2_38
Duration |
of |
operating |
the | Others
business | 8 | Total
-----------+-----------+----------

200
1 | 2 | 2
2 | 1 | 1
3 | 2 | 2
-----------+-----------+----------
Total | 5 | 5
. tab v1_1 v2_4
Duration |
of |
operating |
the | Educational background
business | 1 2 3 4 5 6 |
> Total
-----------+------------------------------------------------------------------+
----------
1 | 2 2 6 7 4 7 |
> 28
2 | 0 1 10 17 5 8 |
> 41
3 | 4 17 19 13 15 12 |
> 80
-----------+------------------------------------------------------------------+
----------
Total | 6 20 35 37 24 27 |
> 149
. tab v1_1 v2_5
Duration |
of |
operating | Education business
the | related

201
business | 0 1 | Total
-----------+----------------------+----------
1 | 9 18 | 27
2 | 19 22 | 41
3 | 29 49 | 78
-----------+----------------------+----------
Total | 57 89 | 146
. summarize v1_1-v5_4
Variable | Obs Mean Std. Dev. Min Max
-------------+--------------------------------------------------------
v1_1 | 150 2.353333 .7783709 1 3
v1_2 | 150 3.286667 .7626927 1 4
v2_11 | 74 1 0 1 1
v2_12 | 63 2 0 2 2
v2_13 | 60 3 0 3 3
-------------+--------------------------------------------------------
v2_14 | 11 4 0 4 4
v2_2 | 150 1.313333 .519895 1 3
v2_3 | 150 .4266667 .4962499 0 1
v2_31 | 13 1 0 1 1
v2_32 | 43 2 0 2 2
-------------+--------------------------------------------------------
v2_33 | 74 3 0 3 3
v2_34 | 23 4 0 4 4
v2_35 | 35 5 0 5 5
v2_36 | 9 6 0 6 6
v2_37 | 9 7 0 7 7
-------------+--------------------------------------------------------
v2_38 | 5 8 0 8 8
v2_4 | 149 3.899329 1.422526 1 6
v2_5 | 146 .609589 .4895218 0 1
v2_6 | 149 .3557047 .4803409 0 1
v2_71 | 22 1 0 1 1
-------------+--------------------------------------------------------
v2_72 | 32 2 0 2 2
v2_73 | 53 3 0 3 3
v2_74 | 74 4 0 4 4
v2_75 | 17 5 0 5 5
v2_81 | 93 1 0 1 1
-------------+--------------------------------------------------------
v2_82 | 62 2 0 2 2
v2_83 | 8 3 0 3 3
v2_84 | 68 4 0 4 4
v2_85 | 55 5 0 5 5
v2_86 | 56 5.982143 .1336306 5 6
-------------+--------------------------------------------------------
v2_87 | 13 7 0 7 7
v2_88 | 73 8 0 8 8
v2_89 | 5 9 0 9 9
v2_810 | 5 10 0 10 10
v2_811 | 3 11 0 11 11
-------------+--------------------------------------------------------
v2_812 | 6 12 0 12 12
v2_813 | 14 13 0 13 13

202
v2_814 | 2 14 0 14 14
v3_11 | 142 1 0 1 1
v3_12 | 26 2 0 2 2
-------------+--------------------------------------------------------
v3_13 | 18 3 0 3 3
v3_14 | 13 4 0 4 4
v3_15 | 8 5 0 5 5
v3_2 | 150 .7666667 .4243695 0 1
v3_3 | 0
-------------+--------------------------------------------------------
v3_4 | 150 7.626667 7.580925 1 60
v3_5 | 29 4.103448 1.988266 1 8
v4_1 | 149 .7651007 .4253657 0 1
v4_2 | 66 .7878788 .4119429 0 1
v4_3 | 64 .65625 .4787136 0 1
-------------+--------------------------------------------------------
v4_4 | 29 2.931034 2.170106 0 6
v4_5 | 131 .6870229 .4654852 0 1
v4_61 | 34 1 0 1 1
v4_62 | 10 2 0 2 2
v4_63 | 23 3 0 3 3
-------------+--------------------------------------------------------
v5_1 | 82 1 0 1 1
v5_2 | 21 2 0 2 2
v5_3 | 32 3 0 3 3
v5_4 | 7 4 0 4 4
. tab1 v1_1-v5_4
-> tabulation of v1_1
Duration of |
operating |
the |
business | Freq. Percent Cum.
------------+-----------------------------------
1 | 28 18.67 18.67
2 | 41 27.33 46.00
3 | 81 54.00 100.00
------------+-----------------------------------
Total | 150 100.00
-> tabulation of v1_2
Development |
stage of |
your |
business | Freq. Percent Cum.
------------+-----------------------------------
1 | 1 0.67 0.67
2 | 25 16.67 17.33
3 | 54 36.00 53.33
4 | 70 46.67 100.00
------------+-----------------------------------
Total | 150 100.00
-> tabulation of v2_11

203
Unemploymen |
t and need |
of earning |
an income | Freq. Percent Cum.
------------+-----------------------------------
1 | 74 100.00 100.00
------------+-----------------------------------
Total | 74 100.00
-> tabulation of v2_12
Business |
opportuniti |
ty because |
of special |
skills and |
talent | Freq. Percent Cum.
------------+-----------------------------------
2 | 63 100.00 100.00
------------+-----------------------------------
Total | 63 100.00
-> tabulation of v2_13
Wants to be |
an |
entrepreneu |
r and |
self-employ |
ed | Freq. Percent Cum.
------------+-----------------------------------
3 | 60 100.00 100.00
------------+-----------------------------------
Total | 60 100.00
-> tabulation of v2_14
Others | Freq. Percent Cum.
------------+-----------------------------------
4 | 11 100.00 100.00
------------+-----------------------------------
Total | 11 100.00
-> tabulation of v2_2
Business |
type | Freq. Percent Cum.
------------+-----------------------------------
1 | 107 71.33 71.33
2 | 39 26.00 97.33
3 | 4 2.67 100.00
------------+-----------------------------------
Total | 150 100.00
-> tabulation of v2_3

204
Involved in |
the same |
type of |
business |
before you |
started | Freq. Percent Cum.
------------+-----------------------------------
0 | 86 57.33 57.33
1 | 64 42.67 100.00
------------+-----------------------------------
Total | 150 100.00
-> tabulation of v2_31
Purchases | Freq. Percent Cum.
------------+-----------------------------------
1 | 13 100.00 100.00
------------+-----------------------------------
Total | 13 100.00
-> tabulation of v2_32
Material |
hanling | Freq. Percent Cum.
------------+-----------------------------------
2 | 43 100.00 100.00
------------+-----------------------------------
Total | 43 100.00
-> tabulation of v2_33
Manufacturi |
ng | Freq. Percent Cum.
------------+-----------------------------------
3 | 74 100.00 100.00
------------+-----------------------------------
Total | 74 100.00
-> tabulation of v2_34
Quality |
control | Freq. Percent Cum.
------------+-----------------------------------
4 | 23 100.00 100.00
------------+-----------------------------------
Total | 23 100.00
-> tabulation of v2_35
Marketing |
and sales | Freq. Percent Cum.
------------+-----------------------------------
5 | 35 100.00 100.00
------------+-----------------------------------
Total | 35 100.00
-> tabulation of v2_36

205
Administrat |
ive tasks | Freq. Percent Cum.
------------+-----------------------------------
6 | 9 100.00 100.00
------------+-----------------------------------
Total | 9 100.00
-> tabulation of v2_37
Management | Freq. Percent Cum.
------------+-----------------------------------
7 | 9 100.00 100.00
------------+-----------------------------------
Total | 9 100.00
-> tabulation of v2_38
Others | Freq. Percent Cum.
------------+-----------------------------------
8 | 5 100.00 100.00
------------+-----------------------------------
Total | 5 100.00
-> tabulation of v2_4
Educational |
background | Freq. Percent Cum.
------------+-----------------------------------
1 | 6 4.03 4.03
2 | 20 13.42 17.45
3 | 35 23.49 40.94
4 | 37 24.83 65.77
5 | 24 16.11 81.88
6 | 27 18.12 100.00
------------+-----------------------------------
Total | 149 100.00
-> tabulation of v2_5
Education |
business |
related | Freq. Percent Cum.
------------+-----------------------------------
0 | 57 39.04 39.04
1 | 89 60.96 100.00
------------+-----------------------------------
Total | 146 100.00
-> tabulation of v2_6
Attended |
workshop or |
short |
courses | Freq. Percent Cum.
------------+-----------------------------------
0 | 96 64.43 64.43

206
1 | 53 35.57 100.00
------------+-----------------------------------
Total | 149 100.00
-> tabulation of v2_71
Managing a |
business or |
a segment |
of a |
business | Freq. Percent Cum.
------------+-----------------------------------
1 | 22 100.00 100.00
------------+-----------------------------------
Total | 22 100.00
-> tabulation of v2_72
Bookkeeping | Freq. Percent Cum.
------------+-----------------------------------
2 | 32 100.00 100.00
------------+-----------------------------------
Total | 32 100.00
-> tabulation of v2_73
Administrat |
ion | Freq. Percent Cum.
------------+-----------------------------------
3 | 53 100.00 100.00
------------+-----------------------------------
Total | 53 100.00
-> tabulation of v2_74
Stockholdin |
g | Freq. Percent Cum.
------------+-----------------------------------
4 | 74 100.00 100.00
------------+-----------------------------------
Total | 74 100.00
-> tabulation of v2_75
Other | Freq. Percent Cum.
------------+-----------------------------------
5 | 17 100.00 100.00
------------+-----------------------------------
Total | 17 100.00
-> tabulation of v2_81
Bookkeeping | Freq. Percent Cum.
------------+-----------------------------------
1 | 93 100.00 100.00
------------+-----------------------------------
Total | 93 100.00

207
-> tabulation of v2_82
Cash flow |
management | Freq. Percent Cum.
------------+-----------------------------------
2 | 62 100.00 100.00
------------+-----------------------------------
Total | 62 100.00
-> tabulation of v2_83
Overheads | Freq. Percent Cum.
------------+-----------------------------------
3 | 8 100.00 100.00
------------+-----------------------------------
Total | 8 100.00
-> tabulation of v2_84
Cost |
control | Freq. Percent Cum.
------------+-----------------------------------
4 | 68 100.00 100.00
------------+-----------------------------------
Total | 68 100.00
-> tabulation of v2_85
Product |
costing | Freq. Percent Cum.
------------+-----------------------------------
5 | 55 100.00 100.00
------------+-----------------------------------
Total | 55 100.00
-> tabulation of v2_86
Raising |
capital | Freq. Percent Cum.
------------+-----------------------------------
5 | 1 1.79 1.79
6 | 55 98.21 100.00
------------+-----------------------------------
Total | 56 100.00
-> tabulation of v2_87
Finacial |
and sales |
projections | Freq. Percent Cum.
------------+-----------------------------------
7 | 13 100.00 100.00
------------+-----------------------------------
Total | 13 100.00
-> tabulation of v2_88

208
Budgeting | Freq. Percent Cum.
------------+-----------------------------------
8 | 73 100.00 100.00
------------+-----------------------------------
Total | 73 100.00
-> tabulation of v2_89
Standard |
costing | Freq. Percent Cum.
------------+-----------------------------------
9 | 5 100.00 100.00
------------+-----------------------------------
Total | 5 100.00
-> tabulation of v2_810
Activity |
based |
costing | Freq. Percent Cum.
------------+-----------------------------------
10 | 5 100.00 100.00
------------+-----------------------------------
Total | 5 100.00
-> tabulation of v2_811
Life cycle |
costing | Freq. Percent Cum.
------------+-----------------------------------
11 | 3 100.00 100.00
------------+-----------------------------------
Total | 3 100.00
-> tabulation of v2_812
Variance |
analysis | Freq. Percent Cum.
------------+-----------------------------------
12 | 6 100.00 100.00
------------+-----------------------------------
Total | 6 100.00
-> tabulation of v2_813
Break-even |
analysis | Freq. Percent Cum.
------------+-----------------------------------
13 | 14 100.00 100.00
------------+-----------------------------------
Total | 14 100.00
-> tabulation of v2_814
EOQ & Stock |
management | Freq. Percent Cum.

209
------------+-----------------------------------
14 | 2 100.00 100.00
------------+-----------------------------------
Total | 2 100.00
-> tabulation of v3_11
Personal |
savings | Freq. Percent Cum.
------------+-----------------------------------
1 | 142 100.00 100.00
------------+-----------------------------------
Total | 142 100.00
-> tabulation of v3_12
Borrowing |
from a |
relative | Freq. Percent Cum.
------------+-----------------------------------
2 | 26 100.00 100.00
------------+-----------------------------------
Total | 26 100.00
-> tabulation of v3_13
Borrowing |
from a |
local bank | Freq. Percent Cum.
------------+-----------------------------------
3 | 18 100.00 100.00
------------+-----------------------------------
Total | 18 100.00
-> tabulation of v3_14
Funded by a |
venture |
capitalist | Freq. Percent Cum.
------------+-----------------------------------
4 | 13 100.00 100.00
------------+-----------------------------------
Total | 13 100.00
-> tabulation of v3_15
Others | Freq. Percent Cum.
------------+-----------------------------------
5 | 8 100.00 100.00
------------+-----------------------------------
Total | 8 100.00
-> tabulation of v3_2
Capital |
sufficient | Freq. Percent Cum.
------------+-----------------------------------

210
0 | 35 23.33 23.33
1 | 115 76.67 100.00
------------+-----------------------------------
Total | 150 100.00
-> tabulation of v3_3
Capital |
available to |
start business | Freq. Percent Cum.
---------------+-----------------------------------
1 000 | 8 5.33 5.33
1 100 | 1 0.67 6.00
1 200 | 1 0.67 6.67
1 500 | 9 6.00 12.67
1 600 | 3 2.00 14.67
1 700 | 1 0.67 15.33
1 850 | 1 0.67 16.00
10 000 | 7 4.67 20.67
10 700 | 1 0.67 21.33
1000 | 1 0.67 22.00
12 000 | 4 2.67 24.67
13 000 | 1 0.67 25.33
13 800 | 1 0.67 26.00
14 000 | 1 0.67 26.67
15 000 | 13 8.67 35.33
2 000 | 4 2.67 38.00
2 500 | 2 1.33 39.33
2 600 | 1 0.67 40.00
2 700 | 1 0.67 40.67
2 800 | 1 0.67 41.33
20 000 | 5 3.33 44.67
25 000 | 2 1.33 46.00
28 000 | 1 0.67 46.67
3 000 | 4 2.67 49.33
3 500 | 1 0.67 50.00
3 600 | 1 0.67 50.67
30 000 | 1 0.67 51.33
4 000 | 4 2.67 54.00
4 500 | 1 0.67 54.67
4 600 | 1 0.67 55.33
4 800 | 1 0.67 56.00
4 900 | 1 0.67 56.67
45 000 | 1 0.67 57.33
450 | 1 0.67 58.00
480 | 1 0.67 58.67
5 000 | 13 8.67 67.33
5 400 | 1 0.67 68.00
5 500 | 1 0.67 68.67
50 000 | 1 0.67 69.33
500 | 5 3.33 72.67
6 000 | 8 5.33 78.00
6 500 | 3 2.00 80.00
6 800 | 2 1.33 81.33
600 | 4 2.67 84.00
650 | 2 1.33 85.33
680 | 1 0.67 86.00

211
7 000 | 2 1.33 87.33
7 200 | 1 0.67 88.00
7 500 | 1 0.67 88.67
7 600 | 1 0.67 89.33
7 800 | 2 1.33 90.67
700 | 2 1.33 92.00
750 | 1 0.67 92.67
780 | 1 0.67 93.33
8 000 | 2 1.33 94.67
8 500 | 1 0.67 95.33
8 600 | 1 0.67 96.00
800 | 2 1.33 97.33
850 | 1 0.67 98.00
9 000 | 1 0.67 98.67
900 | 2 1.33 100.00
---------------+-----------------------------------
Total | 150 100.00
-> tabulation of v3_4
How long |
did it take |
to raise |
the Capital | Freq. Percent Cum.
------------+-----------------------------------
1 | 15 10.00 10.00
2 | 18 12.00 22.00
3 | 16 10.67 32.67
4 | 9 6.00 38.67
5 | 4 2.67 41.33
6 | 22 14.67 56.00
7 | 13 8.67 64.67
8 | 10 6.67 71.33
9 | 4 2.67 74.00
12 | 28 18.67 92.67
16 | 1 0.67 93.33
22 | 1 0.67 94.00
24 | 6 4.00 98.00
36 | 2 1.33 99.33
60 | 1 0.67 100.00
------------+-----------------------------------
Total | 150 100.00
-> tabulation of v3_5
How long |
did it take |
to approve |
your loan | Freq. Percent Cum.
------------+-----------------------------------
1 | 5 17.24 17.24
2 | 2 6.90 24.14
3 | 2 6.90 31.03
4 | 8 27.59 58.62
5 | 3 10.34 68.97
6 | 7 24.14 93.10
7 | 1 3.45 96.55

212
8 | 1 3.45 100.00
------------+-----------------------------------
Total | 29 100.00
-> tabulation of v4_1
Prior to |
stating |
this |
business, |
borrowed |
money from |
a bank or |
venture |
capitalis | Freq. Percent Cum.
------------+-----------------------------------
0 | 35 23.49 23.49
1 | 114 76.51 100.00
------------+-----------------------------------
Total | 149 100.00
-> tabulation of v4_2
If you have |
a business |
education, |
it |
influenced |
the |
decision to |
approve |
your lo | Freq. Percent Cum.
------------+-----------------------------------
0 | 14 21.21 21.21
1 | 52 78.79 100.00
------------+-----------------------------------
Total | 66 100.00
-> tabulation of v4_3
Personal |
accomplishm |
ents |
influenced |
the |
decision to |
approve |
your loan? | Freq. Percent Cum.
------------+-----------------------------------
0 | 22 34.38 34.38
1 | 42 65.63 100.00
------------+-----------------------------------
Total | 64 100.00
-> tabulation of v4_4
How long |

213
did the |
financial |
institution |
take to |
approve |
your loan | Freq. Percent Cum.
------------+-----------------------------------
0 | 1 3.45 3.45
1 | 11 37.93 41.38
2 | 4 13.79 55.17
3 | 2 6.90 62.07
4 | 3 10.34 72.41
6 | 8 27.59 100.00
------------+-----------------------------------
Total | 29 100.00
-> tabulation of v4_5
Was any of |
your |
application |
s for a |
loan ever |
turned |
down? | Freq. Percent Cum.
------------+-----------------------------------
0 | 41 31.30 31.30
1 | 90 68.70 100.00
------------+-----------------------------------
Total | 131 100.00
-> tabulation of v4_61
Not enough |
security | Freq. Percent Cum.
------------+-----------------------------------
1 | 34 100.00 100.00
------------+-----------------------------------
Total | 34 100.00
-> tabulation of v4_62
Limited |
management |
experience | Freq. Percent Cum.
------------+-----------------------------------
2 | 10 100.00 100.00
------------+-----------------------------------
Total | 10 100.00
-> tabulation of v4_63
Others | Freq. Percent Cum.
------------+-----------------------------------
3 | 23 100.00 100.00
------------+-----------------------------------
Total | 23 100.00

214
-> tabulation of v5_1
Identifying |
possible |
financiers | Freq. Percent Cum.
------------+-----------------------------------
1 | 82 100.00 100.00
------------+-----------------------------------
Total | 82 100.00
-> tabulation of v5_2
Compliting |
a |
complicated |
application |
form | Freq. Percent Cum.
------------+-----------------------------------
2 | 21 100.00 100.00
------------+-----------------------------------
Total | 21 100.00
-> tabulation of v5_3
Drawing up |
a feasible |
study | Freq. Percent Cum.
------------+-----------------------------------
3 | 32 100.00 100.00
------------+-----------------------------------
Total | 32 100.00
-> tabulation of v5_4
Others | Freq. Percent Cum.
------------+-----------------------------------
4 | 7 100.00 100.00
------------+-----------------------------------
Total | 7 100.00
closed on: 12 Sep 2008, 11:37:12
-------------------------------------------------------------------------------

file:///Z|/ETD/New/Shaku_MD/appendix%202b.txt[2011/10/06 10:00:20 AM]
APPENDIX 2B------------------------------------------------------------------------------- log: C:\Documents and Settings\Kobuep\My Documents\David Shaku1.smcl log type: smcl opened on: 5 Sep 2008, 12:49:29
. use "C:\Documents and Settings\Kobuep\My Documents\david shaku 1.dta", clear
. edit- preserve
. tab1 v1_1- v2_2210
-> tabulation of v1_1
v1_1 | Freq. Percent Cum.------------+----------------------------------- 1 | 1 3.33 3.33 2 | 7 23.33 26.67 3 | 13 43.33 70.00 4 | 9 30.00 100.00------------+----------------------------------- Total | 30 100.00
-> tabulation of v1_2
v1_2 | Freq. Percent Cum.------------+----------------------------------- 0 | 21 70.00 70.00 1 | 9 30.00 100.00------------+----------------------------------- Total | 30 100.00
-> tabulation of v1_31
v1_31 | Freq. Percent Cum.------------+----------------------------------- 1 | 8 26.67 26.67 3 | 3 10.00 36.67 4 | 1 3.33 40.00 5 | 18 60.00 100.00------------+----------------------------------- Total | 30 100.00
-> tabulation of v1_32
v1_32 | Freq. Percent Cum.------------+----------------------------------- 1 | 2 6.67 6.67 3 | 3 10.00 16.67 4 | 5 16.67 33.33 5 | 20 66.67 100.00------------+-----------------------------------

file:///Z|/ETD/New/Shaku_MD/appendix%202b.txt[2011/10/06 10:00:20 AM]
Total | 30 100.00
-> tabulation of v1_33
v1_33 | Freq. Percent Cum.------------+----------------------------------- 1 | 1 3.33 3.33 3 | 1 3.33 6.67 4 | 2 6.67 13.33 5 | 26 86.67 100.00------------+----------------------------------- Total | 30 100.00
-> tabulation of v1_34
v1_34 | Freq. Percent Cum.------------+----------------------------------- 1 | 6 20.00 20.00 4 | 2 6.67 26.67 5 | 22 73.33 100.00------------+----------------------------------- Total | 30 100.00
-> tabulation of v1_4
v1_4 | Freq. Percent Cum.------------+----------------------------------- 0 | 20 66.67 66.67 1 | 10 33.33 100.00------------+----------------------------------- Total | 30 100.00
-> tabulation of v1_51
v1_51 | Freq. Percent Cum.------------+----------------------------------- 1 | 25 83.33 83.33 2 | 2 6.67 90.00 3 | 1 3.33 93.33 4 | 1 3.33 96.67 5 | 1 3.33 100.00------------+----------------------------------- Total | 30 100.00
-> tabulation of v1_52
v1_52 | Freq. Percent Cum.------------+----------------------------------- 1 | 5 16.67 16.67 2 | 1 3.33 20.00 3 | 13 43.33 63.33 4 | 3 10.00 73.33 5 | 8 26.67 100.00------------+-----------------------------------

file:///Z|/ETD/New/Shaku_MD/appendix%202b.txt[2011/10/06 10:00:20 AM]
Total | 30 100.00
-> tabulation of v1_53
v1_53 | Freq. Percent Cum.------------+----------------------------------- 3 | 2 6.67 6.67 4 | 3 10.00 16.67 5 | 25 83.33 100.00------------+----------------------------------- Total | 30 100.00
-> tabulation of v1_54
v1_54 | Freq. Percent Cum.------------+----------------------------------- 1 | 2 6.67 6.67 4 | 2 6.67 13.33 5 | 26 86.67 100.00------------+----------------------------------- Total | 30 100.00
-> tabulation of v1_6
v1_6 | Freq. Percent Cum.------------+----------------------------------- 0 | 19 63.33 63.33 1 | 11 36.67 100.00------------+----------------------------------- Total | 30 100.00
-> tabulation of v1_71
v1_71 | Freq. Percent Cum.------------+----------------------------------- 0 | 1 5.26 5.26 1 | 5 26.32 31.58 2 | 7 36.84 68.42 3 | 1 5.26 73.68 4 | 1 5.26 78.95 5 | 2 10.53 89.47 10 | 2 10.53 100.00------------+----------------------------------- Total | 19 100.00
-> tabulation of v1_72
v1_72 | Freq. Percent Cum.------------+----------------------------------- 2 | 3 15.79 15.79 3 | 3 15.79 31.58 4 | 1 5.26 36.84 5 | 4 21.05 57.89 6 | 2 10.53 68.42

file:///Z|/ETD/New/Shaku_MD/appendix%202b.txt[2011/10/06 10:00:20 AM]
7 | 2 10.53 78.95 15 | 1 5.26 84.21 20 | 1 5.26 89.47 25 | 1 5.26 94.74 50 | 1 5.26 100.00------------+----------------------------------- Total | 19 100.00
-> tabulation of v1_73
v1_73 | Freq. Percent Cum.------------+----------------------------------- 2 | 1 5.26 5.26 3 | 2 10.53 15.79 4 | 2 10.53 26.32 5 | 5 26.32 52.63 6 | 1 5.26 57.89 7 | 1 5.26 63.16 10 | 1 5.26 68.42 15 | 2 10.53 78.95 20 | 2 10.53 89.47 50 | 2 10.53 100.00------------+----------------------------------- Total | 19 100.00
-> tabulation of v1_74
v1_74 | Freq. Percent Cum.------------+----------------------------------- 0 | 2 11.11 11.11 1 | 1 5.56 16.67 3 | 1 5.56 22.22 4 | 3 16.67 38.89 5 | 2 11.11 50.00 6 | 1 5.56 55.56 7 | 2 11.11 66.67 10 | 2 11.11 77.78 26 | 1 5.56 83.33 30 | 2 11.11 94.44 40 | 1 5.56 100.00------------+----------------------------------- Total | 18 100.00
-> tabulation of v1_75
v1_75 | Freq. Percent Cum.------------+----------------------------------- 0 | 5 35.71 35.71 1 | 1 7.14 42.86 4 | 3 21.43 64.29 6 | 1 7.14 71.43 7 | 2 14.29 85.71 10 | 1 7.14 92.86 40 | 1 7.14 100.00

file:///Z|/ETD/New/Shaku_MD/appendix%202b.txt[2011/10/06 10:00:20 AM]
------------+----------------------------------- Total | 14 100.00
-> tabulation of v1_8 no observations
-> tabulation of v1_9
v1_9 | Freq. Percent Cum.------------+----------------------------------- 0 | 7 23.33 23.33 1 | 23 76.67 100.00------------+----------------------------------- Total | 30 100.00
-> tabulation of v1_10 no observations
-> tabulation of v1_11
v1_11 | Freq. Percent Cum.------------+----------------------------------- 0 | 13 43.33 43.33 1 | 17 56.67 100.00------------+----------------------------------- Total | 30 100.00
-> tabulation of v1_12
v1_12 | Freq. Percent Cum.------------+----------------------------------- 0 | 18 60.00 60.00 1 | 12 40.00 100.00------------+----------------------------------- Total | 30 100.00
-> tabulation of v1_13 no observations
-> tabulation of v1_14
v1_14 | Freq. Percent Cum.------------+----------------------------------- 0 | 20 66.67 66.67 1 | 10 33.33 100.00------------+----------------------------------- Total | 30 100.00
-> tabulation of v1_151
v1_151 | Freq. Percent Cum.------------+----------------------------------- 1 | 11 36.67 36.67 2 | 3 10.00 46.67

file:///Z|/ETD/New/Shaku_MD/appendix%202b.txt[2011/10/06 10:00:20 AM]
3 | 6 20.00 66.67 5 | 10 33.33 100.00------------+----------------------------------- Total | 30 100.00
-> tabulation of v1_152
v1_152 | Freq. Percent Cum.------------+----------------------------------- 1 | 6 20.00 20.00 2 | 1 3.33 23.33 3 | 7 23.33 46.67 4 | 2 6.67 53.33 5 | 14 46.67 100.00------------+----------------------------------- Total | 30 100.00
-> tabulation of v1_153
v1_153 | Freq. Percent Cum.------------+----------------------------------- 1 | 5 16.67 16.67 3 | 6 20.00 36.67 4 | 3 10.00 46.67 5 | 16 53.33 100.00------------+----------------------------------- Total | 30 100.00
-> tabulation of v1_154
v1_154 | Freq. Percent Cum.------------+----------------------------------- 1 | 3 10.00 10.00 5 | 27 90.00 100.00------------+----------------------------------- Total | 30 100.00
-> tabulation of v1_155
v1_155 | Freq. Percent Cum.------------+----------------------------------- 1 | 4 13.33 13.33 2 | 1 3.33 16.67 3 | 8 26.67 43.33 4 | 3 10.00 53.33 5 | 14 46.67 100.00------------+----------------------------------- Total | 30 100.00
-> tabulation of v1_156
v1_156 | Freq. Percent Cum.------------+----------------------------------- 1 | 4 13.33 13.33

file:///Z|/ETD/New/Shaku_MD/appendix%202b.txt[2011/10/06 10:00:20 AM]
3 | 1 3.33 16.67 4 | 7 23.33 40.00 5 | 18 60.00 100.00------------+----------------------------------- Total | 30 100.00
-> tabulation of v1_157
v1_157 | Freq. Percent Cum.------------+----------------------------------- 1 | 3 10.00 10.00 3 | 2 6.67 16.67 4 | 6 20.00 36.67 5 | 19 63.33 100.00------------+----------------------------------- Total | 30 100.00
-> tabulation of v2_11
v2_11 | Freq. Percent Cum.------------+----------------------------------- 1 | 5 16.67 16.67 2 | 1 3.33 20.00 3 | 1 3.33 23.33 5 | 23 76.67 100.00------------+----------------------------------- Total | 30 100.00
-> tabulation of v2_12
v2_12 | Freq. Percent Cum.------------+----------------------------------- 1 | 3 10.00 10.00 2 | 1 3.33 13.33 3 | 2 6.67 20.00 4 | 1 3.33 23.33 5 | 23 76.67 100.00------------+----------------------------------- Total | 30 100.00
-> tabulation of v2_13
v2_13 | Freq. Percent Cum.------------+----------------------------------- 1 | 3 10.00 10.00 3 | 3 10.00 20.00 4 | 1 3.33 23.33 5 | 23 76.67 100.00------------+----------------------------------- Total | 30 100.00
-> tabulation of v2_14
v2_14 | Freq. Percent Cum.

file:///Z|/ETD/New/Shaku_MD/appendix%202b.txt[2011/10/06 10:00:20 AM]
------------+----------------------------------- 3 | 1 3.33 3.33 5 | 29 96.67 100.00------------+----------------------------------- Total | 30 100.00
-> tabulation of v2_15
v2_15 | Freq. Percent Cum.------------+----------------------------------- 2 | 1 3.33 3.33 3 | 2 6.67 10.00 4 | 2 6.67 16.67 5 | 25 83.33 100.00------------+----------------------------------- Total | 30 100.00
-> tabulation of v2_16
v2_16 | Freq. Percent Cum.------------+----------------------------------- 3 | 2 6.67 6.67 4 | 1 3.33 10.00 5 | 27 90.00 100.00------------+----------------------------------- Total | 30 100.00
-> tabulation of v2_2
v2_2 | Freq. Percent Cum.------------+----------------------------------- 0 | 26 86.67 86.67 1 | 4 13.33 100.00------------+----------------------------------- Total | 30 100.00
-> tabulation of v2_3
v2_3 | Freq. Percent Cum.------------+----------------------------------- 0 | 28 93.33 93.33 1 | 2 6.67 100.00------------+----------------------------------- Total | 30 100.00
-> tabulation of v2_4
v2_4 | Freq. Percent Cum.------------+----------------------------------- 0 | 10 33.33 33.33 1 | 20 66.67 100.00------------+----------------------------------- Total | 30 100.00

file:///Z|/ETD/New/Shaku_MD/appendix%202b.txt[2011/10/06 10:00:20 AM]
-> tabulation of v2_5
v2_5 | Freq. Percent Cum.------------+----------------------------------- 10 | 2 28.57 28.57 15 | 3 42.86 71.43 25 | 2 28.57 100.00------------+----------------------------------- Total | 7 100.00
-> tabulation of v2_6
v2_6 | Freq. Percent Cum.------------+----------------------------------- 0 | 13 43.33 43.33 1 | 17 56.67 100.00------------+----------------------------------- Total | 30 100.00
-> tabulation of v2_7a
v2_7a | Freq. Percent Cum.------------+----------------------------------- 0 | 24 80.00 80.00 1 | 6 20.00 100.00------------+----------------------------------- Total | 30 100.00
-> tabulation of v2_7b
v2_7b | Freq. Percent Cum.------------+----------------------------------- 0 | 25 83.33 83.33 1 | 5 16.67 100.00------------+----------------------------------- Total | 30 100.00
-> tabulation of v2_7c
v2_7c | Freq. Percent Cum.------------+----------------------------------- 0 | 24 80.00 80.00 1 | 6 20.00 100.00------------+----------------------------------- Total | 30 100.00
-> tabulation of v2_7d no observations
-> tabulation of v2_8
v2_8 | Freq. Percent Cum.------------+----------------------------------- 10 | 2 14.29 14.29

file:///Z|/ETD/New/Shaku_MD/appendix%202b.txt[2011/10/06 10:00:20 AM]
15 | 3 21.43 35.71 20 | 7 50.00 85.71 25 | 2 14.29 100.00------------+----------------------------------- Total | 14 100.00
-> tabulation of v2_9
v2_9 | Freq. Percent Cum.------------+----------------------------------- 0 | 23 76.67 76.67 1 | 7 23.33 100.00------------+----------------------------------- Total | 30 100.00
-> tabulation of v2_10
v2_10 | Freq. Percent Cum.------------+----------------------------------- 0 | 19 63.33 63.33 1 | 11 36.67 100.00------------+----------------------------------- Total | 30 100.00
-> tabulation of v2_11_1 no observations
-> tabulation of v2_12_1
v2_12_1 | Freq. Percent Cum.------------+----------------------------------- 0 | 27 90.00 90.00 1 | 3 10.00 100.00------------+----------------------------------- Total | 30 100.00
-> tabulation of v2_13_1
v2_13_1 | Freq. Percent Cum.------------+----------------------------------- 0 | 6 20.00 20.00 1 | 24 80.00 100.00------------+----------------------------------- Total | 30 100.00
-> tabulation of v2_14_1
v2_14_1 | Freq. Percent Cum.------------+----------------------------------- 0 | 20 66.67 66.67 1 | 10 33.33 100.00------------+----------------------------------- Total | 30 100.00

file:///Z|/ETD/New/Shaku_MD/appendix%202b.txt[2011/10/06 10:00:20 AM]
-> tabulation of v2_15_1
v2_15_1 | Freq. Percent Cum.------------+----------------------------------- 10 | 2 11.11 11.11 15 | 2 11.11 22.22 20 | 6 33.33 55.56 25 | 7 38.89 94.44 50 | 1 5.56 100.00------------+----------------------------------- Total | 18 100.00
-> tabulation of v2_161
v2_161 | Freq. Percent Cum.------------+----------------------------------- 1 | 2 6.67 6.67 3 | 4 13.33 20.00 4 | 4 13.33 33.33 5 | 20 66.67 100.00------------+----------------------------------- Total | 30 100.00
-> tabulation of v2_162
v2_162 | Freq. Percent Cum.------------+----------------------------------- 1 | 1 3.33 3.33 3 | 3 10.00 13.33 4 | 2 6.67 20.00 5 | 24 80.00 100.00------------+----------------------------------- Total | 30 100.00
-> tabulation of v2_163
v2_163 | Freq. Percent Cum.------------+----------------------------------- 1 | 2 6.67 6.67 3 | 4 13.33 20.00 4 | 3 10.00 30.00 5 | 21 70.00 100.00------------+----------------------------------- Total | 30 100.00
-> tabulation of v2_164
v2_164 | Freq. Percent Cum.------------+----------------------------------- 3 | 3 10.00 10.00 4 | 2 6.67 16.67 5 | 25 83.33 100.00------------+----------------------------------- Total | 30 100.00

file:///Z|/ETD/New/Shaku_MD/appendix%202b.txt[2011/10/06 10:00:20 AM]
-> tabulation of v2_165
v2_165 | Freq. Percent Cum.------------+----------------------------------- 1 | 1 3.33 3.33 3 | 3 10.00 13.33 4 | 3 10.00 23.33 5 | 23 76.67 100.00------------+----------------------------------- Total | 30 100.00
-> tabulation of v2_166
v2_166 | Freq. Percent Cum.------------+----------------------------------- 1 | 7 23.33 23.33 3 | 15 50.00 73.33 4 | 3 10.00 83.33 5 | 5 16.67 100.00------------+----------------------------------- Total | 30 100.00
-> tabulation of v2_167
v2_167 | Freq. Percent Cum.------------+----------------------------------- 1 | 10 33.33 33.33 3 | 12 40.00 73.33 4 | 1 3.33 76.67 5 | 7 23.33 100.00------------+----------------------------------- Total | 30 100.00
-> tabulation of v2_168
v2_168 | Freq. Percent Cum.------------+----------------------------------- 1 | 1 3.33 3.33 3 | 4 13.33 16.67 4 | 2 6.67 23.33 5 | 23 76.67 100.00------------+----------------------------------- Total | 30 100.00
-> tabulation of v2_169
v2_169 | Freq. Percent Cum.------------+----------------------------------- 1 | 3 10.00 10.00 2 | 1 3.33 13.33 3 | 9 30.00 43.33 4 | 6 20.00 63.33 5 | 11 36.67 100.00

file:///Z|/ETD/New/Shaku_MD/appendix%202b.txt[2011/10/06 10:00:20 AM]
------------+----------------------------------- Total | 30 100.00
-> tabulation of v2_1610
v2_1610 | Freq. Percent Cum.------------+----------------------------------- 1 | 8 26.67 26.67 3 | 11 36.67 63.33 4 | 4 13.33 76.67 5 | 7 23.33 100.00------------+----------------------------------- Total | 30 100.00
-> tabulation of v2_1611
v2_1611 | Freq. Percent Cum.------------+----------------------------------- 1 | 13 43.33 43.33 2 | 1 3.33 46.67 3 | 11 36.67 83.33 4 | 2 6.67 90.00 5 | 3 10.00 100.00------------+----------------------------------- Total | 30 100.00
-> tabulation of v2_1612
v2_1612 | Freq. Percent Cum.------------+----------------------------------- 1 | 3 10.00 10.00 3 | 11 36.67 46.67 4 | 2 6.67 53.33 5 | 14 46.67 100.00------------+----------------------------------- Total | 30 100.00
-> tabulation of v2_171
v2_171 | Freq. Percent Cum.------------+----------------------------------- 1 | 1 3.33 3.33 3 | 2 6.67 10.00 4 | 1 3.33 13.33 5 | 26 86.67 100.00------------+----------------------------------- Total | 30 100.00
-> tabulation of v2_172
v2_172 | Freq. Percent Cum.------------+----------------------------------- 1 | 17 56.67 56.67 2 | 2 6.67 63.33

file:///Z|/ETD/New/Shaku_MD/appendix%202b.txt[2011/10/06 10:00:20 AM]
3 | 7 23.33 86.67 4 | 1 3.33 90.00 5 | 3 10.00 100.00------------+----------------------------------- Total | 30 100.00
-> tabulation of v2_173
v2_173 | Freq. Percent Cum.------------+----------------------------------- 1 | 13 43.33 43.33 2 | 2 6.67 50.00 3 | 6 20.00 70.00 5 | 9 30.00 100.00------------+----------------------------------- Total | 30 100.00
-> tabulation of v2_181
v2_181 | Freq. Percent Cum.------------+----------------------------------- 5 | 30 100.00 100.00------------+----------------------------------- Total | 30 100.00
-> tabulation of v2_182
v2_182 | Freq. Percent Cum.------------+----------------------------------- 3 | 3 10.00 10.00 5 | 27 90.00 100.00------------+----------------------------------- Total | 30 100.00
-> tabulation of v2_183
v2_183 | Freq. Percent Cum.------------+----------------------------------- 3 | 4 13.33 13.33 4 | 2 6.67 20.00 5 | 24 80.00 100.00------------+----------------------------------- Total | 30 100.00
-> tabulation of v2_184
v2_184 | Freq. Percent Cum.------------+----------------------------------- 1 | 8 26.67 26.67 2 | 1 3.33 30.00 3 | 12 40.00 70.00 4 | 3 10.00 80.00 5 | 6 20.00 100.00------------+-----------------------------------

file:///Z|/ETD/New/Shaku_MD/appendix%202b.txt[2011/10/06 10:00:20 AM]
Total | 30 100.00
-> tabulation of v2_185
v2_185 | Freq. Percent Cum.------------+----------------------------------- 1 | 1 3.33 3.33 4 | 3 10.00 13.33 5 | 26 86.67 100.00------------+----------------------------------- Total | 30 100.00
-> tabulation of v2_19
v2_19 | Freq. Percent Cum.------------+----------------------------------- 0 | 6 20.00 20.00 1 | 24 80.00 100.00------------+----------------------------------- Total | 30 100.00
-> tabulation of v2_20
v2_20 | Freq. Percent Cum.------------+----------------------------------- 2 | 2 7.14 7.14 3 | 5 17.86 25.00 4 | 11 39.29 64.29 5 | 6 21.43 85.71 6 | 3 10.71 96.43 7 | 1 3.57 100.00------------+----------------------------------- Total | 28 100.00
-> tabulation of v2_21 no observations
-> tabulation of v2_221
v2_221 | Freq. Percent Cum.------------+----------------------------------- 1 | 27 90.00 90.00 3 | 2 6.67 96.67 4 | 1 3.33 100.00------------+----------------------------------- Total | 30 100.00
-> tabulation of v2_222
v2_222 | Freq. Percent Cum.------------+----------------------------------- 1 | 17 56.67 56.67 3 | 3 10.00 66.67 4 | 1 3.33 70.00

file:///Z|/ETD/New/Shaku_MD/appendix%202b.txt[2011/10/06 10:00:20 AM]
5 | 9 30.00 100.00------------+----------------------------------- Total | 30 100.00
-> tabulation of v2_223
v2_223 | Freq. Percent Cum.------------+----------------------------------- 1 | 19 63.33 63.33 2 | 3 10.00 73.33 3 | 4 13.33 86.67 4 | 1 3.33 90.00 5 | 3 10.00 100.00------------+----------------------------------- Total | 30 100.00
-> tabulation of v2_224
v2_224 | Freq. Percent Cum.------------+----------------------------------- 1 | 1 3.33 3.33 2 | 1 3.33 6.67 3 | 1 3.33 10.00 4 | 1 3.33 13.33 5 | 26 86.67 100.00------------+----------------------------------- Total | 30 100.00
-> tabulation of v2_225
v2_225 | Freq. Percent Cum.------------+----------------------------------- 1 | 2 6.67 6.67 2 | 1 3.33 10.00 3 | 1 3.33 13.33 4 | 2 6.67 20.00 5 | 24 80.00 100.00------------+----------------------------------- Total | 30 100.00
-> tabulation of v2_226
v2_226 | Freq. Percent Cum.------------+----------------------------------- 1 | 14 46.67 46.67 2 | 8 26.67 73.33 3 | 3 10.00 83.33 4 | 2 6.67 90.00 5 | 3 10.00 100.00------------+----------------------------------- Total | 30 100.00
-> tabulation of v2_227

file:///Z|/ETD/New/Shaku_MD/appendix%202b.txt[2011/10/06 10:00:20 AM]
v2_227 | Freq. Percent Cum.------------+----------------------------------- 1 | 15 50.00 50.00 2 | 8 26.67 76.67 3 | 4 13.33 90.00 4 | 3 10.00 100.00------------+----------------------------------- Total | 30 100.00
-> tabulation of v2_228
v2_228 | Freq. Percent Cum.------------+----------------------------------- 1 | 6 20.00 20.00 2 | 5 16.67 36.67 3 | 8 26.67 63.33 4 | 7 23.33 86.67 5 | 4 13.33 100.00------------+----------------------------------- Total | 30 100.00
-> tabulation of v2_229
v2_229 | Freq. Percent Cum.------------+----------------------------------- 1 | 5 16.67 16.67 2 | 4 13.33 30.00 3 | 4 13.33 43.33 4 | 8 26.67 70.00 5 | 9 30.00 100.00------------+----------------------------------- Total | 30 100.00
-> tabulation of v2_2210
v2_2210 | Freq. Percent Cum.------------+----------------------------------- 1 | 6 20.00 20.00 2 | 4 13.33 33.33 3 | 7 23.33 56.67 4 | 4 13.33 70.00 5 | 9 30.00 100.00------------+----------------------------------- Total | 30 100.00
. for var v1_2 v1_31 v1_32 v1_33 v1_34 v1_4 v1_51 v1_52 v1_53 v1_54 v2_2 v2_3> v2_4 v2_6 v2_7a v2_7b v2_7c v2_7d: tab v1_1 X,
-> tab v1_1 v1_2,
| v1_2 v1_1 | 0 1 | Total-----------+----------------------+---------- 1 | 1 0 | 1

file:///Z|/ETD/New/Shaku_MD/appendix%202b.txt[2011/10/06 10:00:20 AM]
2 | 3 4 | 7 3 | 10 3 | 13 4 | 7 2 | 9 -----------+----------------------+---------- Total | 21 9 | 30
-> tab v1_1 v1_31,
| v1_31 v1_1 | 1 3 4 5 | Total-----------+--------------------------------------------+---------- 1 | 0 0 0 1 | 1 2 | 2 0 0 5 | 7 3 | 3 2 0 8 | 13 4 | 3 1 1 4 | 9 -----------+--------------------------------------------+---------- Total | 8 3 1 18 | 30
-> tab v1_1 v1_32,
| v1_32 v1_1 | 1 3 4 5 | Total-----------+--------------------------------------------+---------- 1 | 0 0 0 1 | 1 2 | 1 1 1 4 | 7 3 | 1 1 2 9 | 13 4 | 0 1 2 6 | 9 -----------+--------------------------------------------+---------- Total | 2 3 5 20 | 30
-> tab v1_1 v1_33,
| v1_33 v1_1 | 1 3 4 5 | Total-----------+--------------------------------------------+---------- 1 | 0 0 0 1 | 1 2 | 1 0 0 6 | 7 3 | 0 1 1 11 | 13 4 | 0 0 1 8 | 9 -----------+--------------------------------------------+---------- Total | 1 1 2 26 | 30
-> tab v1_1 v1_34,
| v1_34 v1_1 | 1 4 5 | Total-----------+---------------------------------+---------- 1 | 1 0 0 | 1 2 | 2 0 5 | 7 3 | 3 1 9 | 13

file:///Z|/ETD/New/Shaku_MD/appendix%202b.txt[2011/10/06 10:00:20 AM]
4 | 0 1 8 | 9 -----------+---------------------------------+---------- Total | 6 2 22 | 30
-> tab v1_1 v1_4,
| v1_4 v1_1 | 0 1 | Total-----------+----------------------+---------- 1 | 0 1 | 1 2 | 5 2 | 7 3 | 8 5 | 13 4 | 7 2 | 9 -----------+----------------------+---------- Total | 20 10 | 30
-> tab v1_1 v1_51,
| v1_51 v1_1 | 1 2 3 4 5 | Total-----------+-------------------------------------------------------+---------- 1 | 1 0 0 0 0 | 1 2 | 5 0 1 1 0 | 7 3 | 10 2 0 0 1 | 13 4 | 9 0 0 0 0 | 9 -----------+-------------------------------------------------------+---------- Total | 25 2 1 1 1 | 30
-> tab v1_1 v1_52,
| v1_52 v1_1 | 1 2 3 4 5 | Total-----------+-------------------------------------------------------+---------- 1 | 0 0 1 0 0 | 1 2 | 1 0 1 2 3 | 7 3 | 2 1 6 0 4 | 13 4 | 2 0 5 1 1 | 9 -----------+-------------------------------------------------------+---------- Total | 5 1 13 3 8 | 30
-> tab v1_1 v1_53,
| v1_53 v1_1 | 3 4 5 | Total-----------+---------------------------------+---------- 1 | 0 0 1 | 1 2 | 0 2 5 | 7 3 | 0 1 12 | 13 4 | 2 0 7 | 9 -----------+---------------------------------+----------

file:///Z|/ETD/New/Shaku_MD/appendix%202b.txt[2011/10/06 10:00:20 AM]
Total | 2 3 25 | 30
-> tab v1_1 v1_54,
| v1_54 v1_1 | 1 4 5 | Total-----------+---------------------------------+---------- 1 | 0 0 1 | 1 2 | 2 0 5 | 7 3 | 0 2 11 | 13 4 | 0 0 9 | 9 -----------+---------------------------------+---------- Total | 2 2 26 | 30
-> tab v1_1 v2_2,
| v2_2 v1_1 | 0 1 | Total-----------+----------------------+---------- 1 | 1 0 | 1 2 | 4 3 | 7 3 | 12 1 | 13 4 | 9 0 | 9 -----------+----------------------+---------- Total | 26 4 | 30
-> tab v1_1 v2_3,
| v2_3 v1_1 | 0 1 | Total-----------+----------------------+---------- 1 | 1 0 | 1 2 | 6 1 | 7 3 | 12 1 | 13 4 | 9 0 | 9 -----------+----------------------+---------- Total | 28 2 | 30
-> tab v1_1 v2_4,
| v2_4 v1_1 | 0 1 | Total-----------+----------------------+---------- 1 | 0 1 | 1 2 | 0 7 | 7 3 | 7 6 | 13 4 | 3 6 | 9 -----------+----------------------+---------- Total | 10 20 | 30

file:///Z|/ETD/New/Shaku_MD/appendix%202b.txt[2011/10/06 10:00:20 AM]
-> tab v1_1 v2_6,
| v2_6 v1_1 | 0 1 | Total-----------+----------------------+---------- 1 | 1 0 | 1 2 | 2 5 | 7 3 | 6 7 | 13 4 | 4 5 | 9 -----------+----------------------+---------- Total | 13 17 | 30
-> tab v1_1 v2_7a,
| v2_7a v1_1 | 0 1 | Total-----------+----------------------+---------- 1 | 1 0 | 1 2 | 5 2 | 7 3 | 10 3 | 13 4 | 8 1 | 9 -----------+----------------------+---------- Total | 24 6 | 30
-> tab v1_1 v2_7b,
| v2_7b v1_1 | 0 1 | Total-----------+----------------------+---------- 1 | 1 0 | 1 2 | 5 2 | 7 3 | 11 2 | 13 4 | 8 1 | 9 -----------+----------------------+---------- Total | 25 5 | 30
-> tab v1_1 v2_7c,
| v2_7c v1_1 | 0 1 | Total-----------+----------------------+---------- 1 | 1 0 | 1 2 | 4 3 | 7 3 | 11 2 | 13 4 | 8 1 | 9 -----------+----------------------+---------- Total | 24 6 | 30
-> tab v1_1 v2_7d,

file:///Z|/ETD/New/Shaku_MD/appendix%202b.txt[2011/10/06 10:00:20 AM]
no observations
. for var v1_2 v1_31 v1_32 v1_33 v1_34 v1_4 v1_51 v1_52 v1_53 v1_54 v2_2 v2_3> v2_4 v2_6 v2_7a v2_7b v2_7c v2_7d: tab v1_1 X, CHI2
-> tab v1_1 v1_2, CHI2option CHI2 not allowedr(198);
. for var v1_2 v1_31 v1_32 v1_33 v1_34 v1_4 v1_51 v1_52 v1_53 v1_54 v2_2 v2_3> v2_4 v2_6 v2_7a v2_7b v2_7c v2_7d: tab v1_1 X, row col exp chi2
-> tab v1_1 v1_2, row col exp chi2
+--------------------+| Key ||--------------------|| frequency || expected frequency || row percentage || column percentage |+--------------------+
| v1_2 v1_1 | 0 1 | Total-----------+----------------------+---------- 1 | 1 0 | 1 | 0.7 0.3 | 1.0 | 100.00 0.00 | 100.00 | 4.76 0.00 | 3.33 -----------+----------------------+---------- 2 | 3 4 | 7 | 4.9 2.1 | 7.0 | 42.86 57.14 | 100.00 | 14.29 44.44 | 23.33 -----------+----------------------+---------- 3 | 10 3 | 13 | 9.1 3.9 | 13.0 | 76.92 23.08 | 100.00 | 47.62 33.33 | 43.33 -----------+----------------------+---------- 4 | 7 2 | 9 | 6.3 2.7 | 9.0 | 77.78 22.22 | 100.00 | 33.33 22.22 | 30.00 -----------+----------------------+---------- Total | 21 9 | 30 | 21.0 9.0 | 30.0 | 70.00 30.00 | 100.00 | 100.00 100.00 | 100.00
Pearson chi2(3) = 3.4403 Pr = 0.329
-> tab v1_1 v1_31, row col exp chi2

file:///Z|/ETD/New/Shaku_MD/appendix%202b.txt[2011/10/06 10:00:20 AM]
+--------------------+| Key ||--------------------|| frequency || expected frequency || row percentage || column percentage |+--------------------+
| v1_31 v1_1 | 1 3 4 5 | Total-----------+--------------------------------------------+---------- 1 | 0 0 0 1 | 1 | 0.3 0.1 0.0 0.6 | 1.0 | 0.00 0.00 0.00 100.00 | 100.00 | 0.00 0.00 0.00 5.56 | 3.33 -----------+--------------------------------------------+---------- 2 | 2 0 0 5 | 7 | 1.9 0.7 0.2 4.2 | 7.0 | 28.57 0.00 0.00 71.43 | 100.00 | 25.00 0.00 0.00 27.78 | 23.33 -----------+--------------------------------------------+---------- 3 | 3 2 0 8 | 13 | 3.5 1.3 0.4 7.8 | 13.0 | 23.08 15.38 0.00 61.54 | 100.00 | 37.50 66.67 0.00 44.44 | 43.33 -----------+--------------------------------------------+---------- 4 | 3 1 1 4 | 9 | 2.4 0.9 0.3 5.4 | 9.0 | 33.33 11.11 11.11 44.44 | 100.00 | 37.50 33.33 100.00 22.22 | 30.00 -----------+--------------------------------------------+---------- Total | 8 3 1 18 | 30 | 8.0 3.0 1.0 18.0 | 30.0 | 26.67 10.00 3.33 60.00 | 100.00 | 100.00 100.00 100.00 100.00 | 100.00
Pearson chi2(9) = 4.7975 Pr = 0.852
-> tab v1_1 v1_32, row col exp chi2
+--------------------+| Key ||--------------------|| frequency || expected frequency || row percentage || column percentage |+--------------------+
| v1_32 v1_1 | 1 3 4 5 | Total-----------+--------------------------------------------+----------

file:///Z|/ETD/New/Shaku_MD/appendix%202b.txt[2011/10/06 10:00:20 AM]
1 | 0 0 0 1 | 1 | 0.1 0.1 0.2 0.7 | 1.0 | 0.00 0.00 0.00 100.00 | 100.00 | 0.00 0.00 0.00 5.00 | 3.33 -----------+--------------------------------------------+---------- 2 | 1 1 1 4 | 7 | 0.5 0.7 1.2 4.7 | 7.0 | 14.29 14.29 14.29 57.14 | 100.00 | 50.00 33.33 20.00 20.00 | 23.33 -----------+--------------------------------------------+---------- 3 | 1 1 2 9 | 13 | 0.9 1.3 2.2 8.7 | 13.0 | 7.69 7.69 15.38 69.23 | 100.00 | 50.00 33.33 40.00 45.00 | 43.33 -----------+--------------------------------------------+---------- 4 | 0 1 2 6 | 9 | 0.6 0.9 1.5 6.0 | 9.0 | 0.00 11.11 22.22 66.67 | 100.00 | 0.00 33.33 40.00 30.00 | 30.00 -----------+--------------------------------------------+---------- Total | 2 3 5 20 | 30 | 2.0 3.0 5.0 20.0 | 30.0 | 6.67 10.00 16.67 66.67 | 100.00 | 100.00 100.00 100.00 100.00 | 100.00
Pearson chi2(9) = 2.2503 Pr = 0.987
-> tab v1_1 v1_33, row col exp chi2
+--------------------+| Key ||--------------------|| frequency || expected frequency || row percentage || column percentage |+--------------------+
| v1_33 v1_1 | 1 3 4 5 | Total-----------+--------------------------------------------+---------- 1 | 0 0 0 1 | 1 | 0.0 0.0 0.1 0.9 | 1.0 | 0.00 0.00 0.00 100.00 | 100.00 | 0.00 0.00 0.00 3.85 | 3.33 -----------+--------------------------------------------+---------- 2 | 1 0 0 6 | 7 | 0.2 0.2 0.5 6.1 | 7.0 | 14.29 0.00 0.00 85.71 | 100.00 | 100.00 0.00 0.00 23.08 | 23.33 -----------+--------------------------------------------+---------- 3 | 0 1 1 11 | 13 | 0.4 0.4 0.9 11.3 | 13.0 | 0.00 7.69 7.69 84.62 | 100.00

file:///Z|/ETD/New/Shaku_MD/appendix%202b.txt[2011/10/06 10:00:20 AM]
| 0.00 100.00 50.00 42.31 | 43.33 -----------+--------------------------------------------+---------- 4 | 0 0 1 8 | 9 | 0.3 0.3 0.6 7.8 | 9.0 | 0.00 0.00 11.11 88.89 | 100.00 | 0.00 0.00 50.00 30.77 | 30.00 -----------+--------------------------------------------+---------- Total | 1 1 2 26 | 30 | 1.0 1.0 2.0 26.0 | 30.0 | 3.33 3.33 6.67 86.67 | 100.00 | 100.00 100.00 100.00 100.00 | 100.00
Pearson chi2(9) = 5.4466 Pr = 0.794
-> tab v1_1 v1_34, row col exp chi2
+--------------------+| Key ||--------------------|| frequency || expected frequency || row percentage || column percentage |+--------------------+
| v1_34 v1_1 | 1 4 5 | Total-----------+---------------------------------+---------- 1 | 1 0 0 | 1 | 0.2 0.1 0.7 | 1.0 | 100.00 0.00 0.00 | 100.00 | 16.67 0.00 0.00 | 3.33 -----------+---------------------------------+---------- 2 | 2 0 5 | 7 | 1.4 0.5 5.1 | 7.0 | 28.57 0.00 71.43 | 100.00 | 33.33 0.00 22.73 | 23.33 -----------+---------------------------------+---------- 3 | 3 1 9 | 13 | 2.6 0.9 9.5 | 13.0 | 23.08 7.69 69.23 | 100.00 | 50.00 50.00 40.91 | 43.33 -----------+---------------------------------+---------- 4 | 0 1 8 | 9 | 1.8 0.6 6.6 | 9.0 | 0.00 11.11 88.89 | 100.00 | 0.00 50.00 36.36 | 30.00 -----------+---------------------------------+---------- Total | 6 2 22 | 30 | 6.0 2.0 22.0 | 30.0 | 20.00 6.67 73.33 | 100.00 | 100.00 100.00 100.00 | 100.00
Pearson chi2(6) = 7.2028 Pr = 0.302

file:///Z|/ETD/New/Shaku_MD/appendix%202b.txt[2011/10/06 10:00:20 AM]
-> tab v1_1 v1_4, row col exp chi2
+--------------------+| Key ||--------------------|| frequency || expected frequency || row percentage || column percentage |+--------------------+
| v1_4 v1_1 | 0 1 | Total-----------+----------------------+---------- 1 | 0 1 | 1 | 0.7 0.3 | 1.0 | 0.00 100.00 | 100.00 | 0.00 10.00 | 3.33 -----------+----------------------+---------- 2 | 5 2 | 7 | 4.7 2.3 | 7.0 | 71.43 28.57 | 100.00 | 25.00 20.00 | 23.33 -----------+----------------------+---------- 3 | 8 5 | 13 | 8.7 4.3 | 13.0 | 61.54 38.46 | 100.00 | 40.00 50.00 | 43.33 -----------+----------------------+---------- 4 | 7 2 | 9 | 6.0 3.0 | 9.0 | 77.78 22.22 | 100.00 | 35.00 20.00 | 30.00 -----------+----------------------+---------- Total | 20 10 | 30 | 20.0 10.0 | 30.0 | 66.67 33.33 | 100.00 | 100.00 100.00 | 100.00
Pearson chi2(3) = 2.7253 Pr = 0.436
-> tab v1_1 v1_51, row col exp chi2
+--------------------+| Key ||--------------------|| frequency || expected frequency || row percentage || column percentage |+--------------------+
| v1_51

file:///Z|/ETD/New/Shaku_MD/appendix%202b.txt[2011/10/06 10:00:20 AM]
v1_1 | 1 2 3 4 5 | Total-----------+-------------------------------------------------------+---------- 1 | 1 0 0 0 0 | 1 | 0.8 0.1 0.0 0.0 0.0 | 1.0 | 100.00 0.00 0.00 0.00 0.00 | 100.00 | 4.00 0.00 0.00 0.00 0.00 | 3.33 -----------+-------------------------------------------------------+---------- 2 | 5 0 1 1 0 | 7 | 5.8 0.5 0.2 0.2 0.2 | 7.0 | 71.43 0.00 14.29 14.29 0.00 | 100.00 | 20.00 0.00 100.00 100.00 0.00 | 23.33 -----------+-------------------------------------------------------+---------- 3 | 10 2 0 0 1 | 13 | 10.8 0.9 0.4 0.4 0.4 | 13.0 | 76.92 15.38 0.00 0.00 7.69 | 100.00 | 40.00 100.00 0.00 0.00 100.00 | 43.33 -----------+-------------------------------------------------------+---------- 4 | 9 0 0 0 0 | 9 | 7.5 0.6 0.3 0.3 0.3 | 9.0 | 100.00 0.00 0.00 0.00 0.00 | 100.00 | 36.00 0.00 0.00 0.00 0.00 | 30.00 -----------+-------------------------------------------------------+---------- Total | 25 2 1 1 1 | 30 | 25.0 2.0 1.0 1.0 1.0 | 30.0 | 83.33 6.67 3.33 3.33 3.33 | 100.00 | 100.00 100.00 100.00 100.00 100.00 | 100.00
Pearson chi2(12) = 11.0110 Pr = 0.528
-> tab v1_1 v1_52, row col exp chi2
+--------------------+| Key ||--------------------|| frequency || expected frequency || row percentage || column percentage |+--------------------+
| v1_52 v1_1 | 1 2 3 4 5 | Total-----------+-------------------------------------------------------+---------- 1 | 0 0 1 0 0 | 1 | 0.2 0.0 0.4 0.1 0.3 | 1.0 | 0.00 0.00 100.00 0.00 0.00 | 100.00 | 0.00 0.00 7.69 0.00 0.00 | 3.33 -----------+-------------------------------------------------------+---------- 2 | 1 0 1 2 3 | 7 | 1.2 0.2 3.0 0.7 1.9 | 7.0 | 14.29 0.00 14.29 28.57 42.86 | 100.00 | 20.00 0.00 7.69 66.67 37.50 | 23.33 -----------+-------------------------------------------------------+---------- 3 | 2 1 6 0 4 | 13

file:///Z|/ETD/New/Shaku_MD/appendix%202b.txt[2011/10/06 10:00:20 AM]
| 2.2 0.4 5.6 1.3 3.5 | 13.0 | 15.38 7.69 46.15 0.00 30.77 | 100.00 | 40.00 100.00 46.15 0.00 50.00 | 43.33 -----------+-------------------------------------------------------+---------- 4 | 2 0 5 1 1 | 9 | 1.5 0.3 3.9 0.9 2.4 | 9.0 | 22.22 0.00 55.56 11.11 11.11 | 100.00 | 40.00 0.00 38.46 33.33 12.50 | 30.00 -----------+-------------------------------------------------------+---------- Total | 5 1 13 3 8 | 30 | 5.0 1.0 13.0 3.0 8.0 | 30.0 | 16.67 3.33 43.33 10.00 26.67 | 100.00 | 100.00 100.00 100.00 100.00 100.00 | 100.00
Pearson chi2(12) = 9.7947 Pr = 0.634
-> tab v1_1 v1_53, row col exp chi2
+--------------------+| Key ||--------------------|| frequency || expected frequency || row percentage || column percentage |+--------------------+
| v1_53 v1_1 | 3 4 5 | Total-----------+---------------------------------+---------- 1 | 0 0 1 | 1 | 0.1 0.1 0.8 | 1.0 | 0.00 0.00 100.00 | 100.00 | 0.00 0.00 4.00 | 3.33 -----------+---------------------------------+---------- 2 | 0 2 5 | 7 | 0.5 0.7 5.8 | 7.0 | 0.00 28.57 71.43 | 100.00 | 0.00 66.67 20.00 | 23.33 -----------+---------------------------------+---------- 3 | 0 1 12 | 13 | 0.9 1.3 10.8 | 13.0 | 0.00 7.69 92.31 | 100.00 | 0.00 33.33 48.00 | 43.33 -----------+---------------------------------+---------- 4 | 2 0 7 | 9 | 0.6 0.9 7.5 | 9.0 | 22.22 0.00 77.78 | 100.00 | 100.00 0.00 28.00 | 30.00 -----------+---------------------------------+---------- Total | 2 3 25 | 30 | 2.0 3.0 25.0 | 30.0 | 6.67 10.00 83.33 | 100.00 | 100.00 100.00 100.00 | 100.00

file:///Z|/ETD/New/Shaku_MD/appendix%202b.txt[2011/10/06 10:00:20 AM]
Pearson chi2(6) = 8.4615 Pr = 0.206
-> tab v1_1 v1_54, row col exp chi2
+--------------------+| Key ||--------------------|| frequency || expected frequency || row percentage || column percentage |+--------------------+
| v1_54 v1_1 | 1 4 5 | Total-----------+---------------------------------+---------- 1 | 0 0 1 | 1 | 0.1 0.1 0.9 | 1.0 | 0.00 0.00 100.00 | 100.00 | 0.00 0.00 3.85 | 3.33 -----------+---------------------------------+---------- 2 | 2 0 5 | 7 | 0.5 0.5 6.1 | 7.0 | 28.57 0.00 71.43 | 100.00 | 100.00 0.00 19.23 | 23.33 -----------+---------------------------------+---------- 3 | 0 2 11 | 13 | 0.9 0.9 11.3 | 13.0 | 0.00 15.38 84.62 | 100.00 | 0.00 100.00 42.31 | 43.33 -----------+---------------------------------+---------- 4 | 0 0 9 | 9 | 0.6 0.6 7.8 | 9.0 | 0.00 0.00 100.00 | 100.00 | 0.00 0.00 34.62 | 30.00 -----------+---------------------------------+---------- Total | 2 2 26 | 30 | 2.0 2.0 26.0 | 30.0 | 6.67 6.67 86.67 | 100.00 | 100.00 100.00 100.00 | 100.00
Pearson chi2(6) = 9.5858 Pr = 0.143
-> tab v1_1 v2_2, row col exp chi2
+--------------------+| Key ||--------------------|| frequency || expected frequency || row percentage || column percentage |+--------------------+

file:///Z|/ETD/New/Shaku_MD/appendix%202b.txt[2011/10/06 10:00:20 AM]
| v2_2 v1_1 | 0 1 | Total-----------+----------------------+---------- 1 | 1 0 | 1 | 0.9 0.1 | 1.0 | 100.00 0.00 | 100.00 | 3.85 0.00 | 3.33 -----------+----------------------+---------- 2 | 4 3 | 7 | 6.1 0.9 | 7.0 | 57.14 42.86 | 100.00 | 15.38 75.00 | 23.33 -----------+----------------------+---------- 3 | 12 1 | 13 | 11.3 1.7 | 13.0 | 92.31 7.69 | 100.00 | 46.15 25.00 | 43.33 -----------+----------------------+---------- 4 | 9 0 | 9 | 7.8 1.2 | 9.0 | 100.00 0.00 | 100.00 | 34.62 0.00 | 30.00 -----------+----------------------+---------- Total | 26 4 | 30 | 26.0 4.0 | 30.0 | 86.67 13.33 | 100.00 | 100.00 100.00 | 100.00
Pearson chi2(3) = 7.1767 Pr = 0.066
-> tab v1_1 v2_3, row col exp chi2
+--------------------+| Key ||--------------------|| frequency || expected frequency || row percentage || column percentage |+--------------------+
| v2_3 v1_1 | 0 1 | Total-----------+----------------------+---------- 1 | 1 0 | 1 | 0.9 0.1 | 1.0 | 100.00 0.00 | 100.00 | 3.57 0.00 | 3.33 -----------+----------------------+---------- 2 | 6 1 | 7 | 6.5 0.5 | 7.0 | 85.71 14.29 | 100.00 | 21.43 50.00 | 23.33

file:///Z|/ETD/New/Shaku_MD/appendix%202b.txt[2011/10/06 10:00:20 AM]
-----------+----------------------+---------- 3 | 12 1 | 13 | 12.1 0.9 | 13.0 | 92.31 7.69 | 100.00 | 42.86 50.00 | 43.33 -----------+----------------------+---------- 4 | 9 0 | 9 | 8.4 0.6 | 9.0 | 100.00 0.00 | 100.00 | 32.14 0.00 | 30.00 -----------+----------------------+---------- Total | 28 2 | 30 | 28.0 2.0 | 30.0 | 93.33 6.67 | 100.00 | 100.00 100.00 | 100.00
Pearson chi2(3) = 1.3893 Pr = 0.708
-> tab v1_1 v2_4, row col exp chi2
+--------------------+| Key ||--------------------|| frequency || expected frequency || row percentage || column percentage |+--------------------+
| v2_4 v1_1 | 0 1 | Total-----------+----------------------+---------- 1 | 0 1 | 1 | 0.3 0.7 | 1.0 | 0.00 100.00 | 100.00 | 0.00 5.00 | 3.33 -----------+----------------------+---------- 2 | 0 7 | 7 | 2.3 4.7 | 7.0 | 0.00 100.00 | 100.00 | 0.00 35.00 | 23.33 -----------+----------------------+---------- 3 | 7 6 | 13 | 4.3 8.7 | 13.0 | 53.85 46.15 | 100.00 | 70.00 30.00 | 43.33 -----------+----------------------+---------- 4 | 3 6 | 9 | 3.0 6.0 | 9.0 | 33.33 66.67 | 100.00 | 30.00 30.00 | 30.00 -----------+----------------------+---------- Total | 10 20 | 30 | 10.0 20.0 | 30.0

file:///Z|/ETD/New/Shaku_MD/appendix%202b.txt[2011/10/06 10:00:20 AM]
| 33.33 66.67 | 100.00 | 100.00 100.00 | 100.00
Pearson chi2(3) = 6.4615 Pr = 0.091
-> tab v1_1 v2_6, row col exp chi2
+--------------------+| Key ||--------------------|| frequency || expected frequency || row percentage || column percentage |+--------------------+
| v2_6 v1_1 | 0 1 | Total-----------+----------------------+---------- 1 | 1 0 | 1 | 0.4 0.6 | 1.0 | 100.00 0.00 | 100.00 | 7.69 0.00 | 3.33 -----------+----------------------+---------- 2 | 2 5 | 7 | 3.0 4.0 | 7.0 | 28.57 71.43 | 100.00 | 15.38 29.41 | 23.33 -----------+----------------------+---------- 3 | 6 7 | 13 | 5.6 7.4 | 13.0 | 46.15 53.85 | 100.00 | 46.15 41.18 | 43.33 -----------+----------------------+---------- 4 | 4 5 | 9 | 3.9 5.1 | 9.0 | 44.44 55.56 | 100.00 | 30.77 29.41 | 30.00 -----------+----------------------+---------- Total | 13 17 | 30 | 13.0 17.0 | 30.0 | 43.33 56.67 | 100.00 | 100.00 100.00 | 100.00
Pearson chi2(3) = 1.9755 Pr = 0.577
-> tab v1_1 v2_7a, row col exp chi2
+--------------------+| Key ||--------------------|| frequency || expected frequency || row percentage |
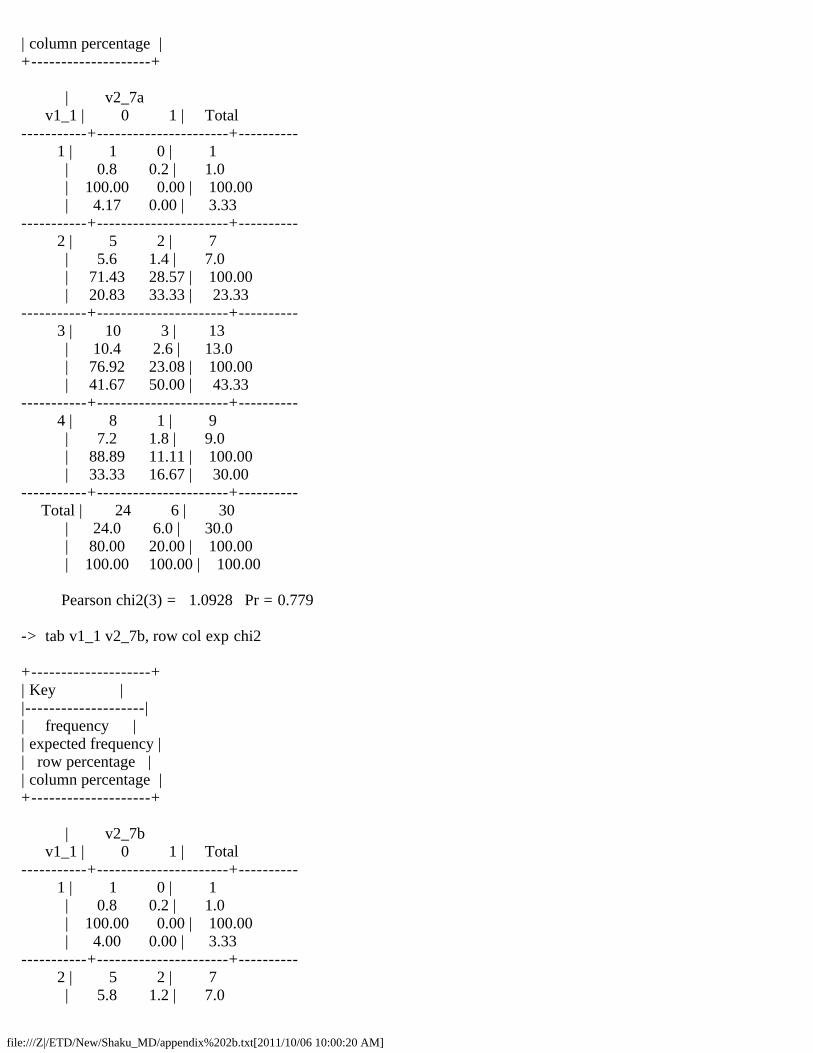
file:///Z|/ETD/New/Shaku_MD/appendix%202b.txt[2011/10/06 10:00:20 AM]
| column percentage |+--------------------+
| v2_7a v1_1 | 0 1 | Total-----------+----------------------+---------- 1 | 1 0 | 1 | 0.8 0.2 | 1.0 | 100.00 0.00 | 100.00 | 4.17 0.00 | 3.33 -----------+----------------------+---------- 2 | 5 2 | 7 | 5.6 1.4 | 7.0 | 71.43 28.57 | 100.00 | 20.83 33.33 | 23.33 -----------+----------------------+---------- 3 | 10 3 | 13 | 10.4 2.6 | 13.0 | 76.92 23.08 | 100.00 | 41.67 50.00 | 43.33 -----------+----------------------+---------- 4 | 8 1 | 9 | 7.2 1.8 | 9.0 | 88.89 11.11 | 100.00 | 33.33 16.67 | 30.00 -----------+----------------------+---------- Total | 24 6 | 30 | 24.0 6.0 | 30.0 | 80.00 20.00 | 100.00 | 100.00 100.00 | 100.00
Pearson chi2(3) = 1.0928 Pr = 0.779
-> tab v1_1 v2_7b, row col exp chi2
+--------------------+| Key ||--------------------|| frequency || expected frequency || row percentage || column percentage |+--------------------+
| v2_7b v1_1 | 0 1 | Total-----------+----------------------+---------- 1 | 1 0 | 1 | 0.8 0.2 | 1.0 | 100.00 0.00 | 100.00 | 4.00 0.00 | 3.33 -----------+----------------------+---------- 2 | 5 2 | 7 | 5.8 1.2 | 7.0

file:///Z|/ETD/New/Shaku_MD/appendix%202b.txt[2011/10/06 10:00:20 AM]
| 71.43 28.57 | 100.00 | 20.00 40.00 | 23.33 -----------+----------------------+---------- 3 | 11 2 | 13 | 10.8 2.2 | 13.0 | 84.62 15.38 | 100.00 | 44.00 40.00 | 43.33 -----------+----------------------+---------- 4 | 8 1 | 9 | 7.5 1.5 | 9.0 | 88.89 11.11 | 100.00 | 32.00 20.00 | 30.00 -----------+----------------------+---------- Total | 25 5 | 30 | 25.0 5.0 | 30.0 | 83.33 16.67 | 100.00 | 100.00 100.00 | 100.00
Pearson chi2(3) = 1.1297 Pr = 0.770
-> tab v1_1 v2_7c, row col exp chi2
+--------------------+| Key ||--------------------|| frequency || expected frequency || row percentage || column percentage |+--------------------+
| v2_7c v1_1 | 0 1 | Total-----------+----------------------+---------- 1 | 1 0 | 1 | 0.8 0.2 | 1.0 | 100.00 0.00 | 100.00 | 4.17 0.00 | 3.33 -----------+----------------------+---------- 2 | 4 3 | 7 | 5.6 1.4 | 7.0 | 57.14 42.86 | 100.00 | 16.67 50.00 | 23.33 -----------+----------------------+---------- 3 | 11 2 | 13 | 10.4 2.6 | 13.0 | 84.62 15.38 | 100.00 | 45.83 33.33 | 43.33 -----------+----------------------+---------- 4 | 8 1 | 9 | 7.2 1.8 | 9.0 | 88.89 11.11 | 100.00 | 33.33 16.67 | 30.00 -----------+----------------------+----------

file:///Z|/ETD/New/Shaku_MD/appendix%202b.txt[2011/10/06 10:00:20 AM]
Total | 24 6 | 30 | 24.0 6.0 | 30.0 | 80.00 20.00 | 100.00 | 100.00 100.00 | 100.00
Pearson chi2(3) = 3.1532 Pr = 0.369
-> tab v1_1 v2_7d, row col exp chi2no observations
. save "C:\Documents and Settings\Kobuep\My Documents\david shaku 1.dta", repla> cefile C:\Documents and Settings\Kobuep\My Documents\david shaku 1.dta saved
. log close log: C:\Documents and Settings\Kobuep\My Documents\David Shaku1.smcl log type: smcl closed on: 5 Sep 2008, 13:39:06-------------------------------------------------------------------------------